1. Introduction
The Pacific coastal region of California has been found to be an extremely narrow but coherent climatologic zone, typically less than 30 km wide, and much narrower in Central California near Big Sur (Monterey County) where the steepest coastal elevations gradients in North America are found [
1]. The Central Coast is where the wet, cooler climate of the northern California region meets the dry, warmer climate of the southern region [
2]. The highest peaks in the Santa Lucia Mountains form a wall behind coastal hillsides, which effectively traps cooler marine air [
3]. This can lead to the formation of steep elevation gradients in air temperature regimes, humidity and other climate factors. The advection of marine stratus layers over land profoundly moderates the coastal climate by reducing insolation and temperatures, raising humidity, and supplying water directly to the landscape [
4].
Lebassi
et al. analyzed summer (June–August) air temperature records from 1950 to 2005 for two California coastal regions, the South Coast Air Basin and the San Francisco Bay Area, and reported cooling (−0.30 °C·decade
−1) in low-elevation coastal areas open to marine air penetration and warming (0.32 °C·decade
−1) in inland areas [
5]. These investigators surmised that the coastal cooling trends have resulted from the consistent summer warming of inland valley areas, which resulted in increased sea-breeze flow activity at the coast. Such simple trend patterns of long-term cooling (or warming) can nevertheless overlook the possibilities of extreme daily weather events occurring at new frequencies within the changing climate record. Moreover, cooling trends may come in different forms, such a predominantly nighttime
vs. predominantly daytime cooling, which can have differing and important implications for natural and human systems alike.
The main objective of the study was to quantify and characterize potential climate change on Central California Coast near Big Sur (Monterey County), with special attention to changes in the frequency of extreme daily temperature events among any discernable long-term trends. The setting for this analysis is arguably located at the nexus of modern climate change geography in the Western United States. The Central Coast of California is constantly subjected to extreme climate events [
4], frequent wildfires, and human development impacts, together affecting wildlife populations, native plant communities, soil conservation, riparian zones, and water quality.
The many unique microclimates of Big Sur result in high natural biodiversity [
3,
6], including many endemic rare and endangered species, such as the wild orchid
Piperia yadonii, the California condor (
Gymnogyps californianus), California southern sea otter (
Enhydra lutris nereis), and southernmost habitat of the coast redwood (
Sequoia sempervirens). Even minor shifts in climate and the frequency of extreme weather events have the potential to tip the balance in favor or against such vulnerable biological resources and the human activities that sometimes struggle to prosper in a remote and rugged coastal environmental.
2. Study Area Description
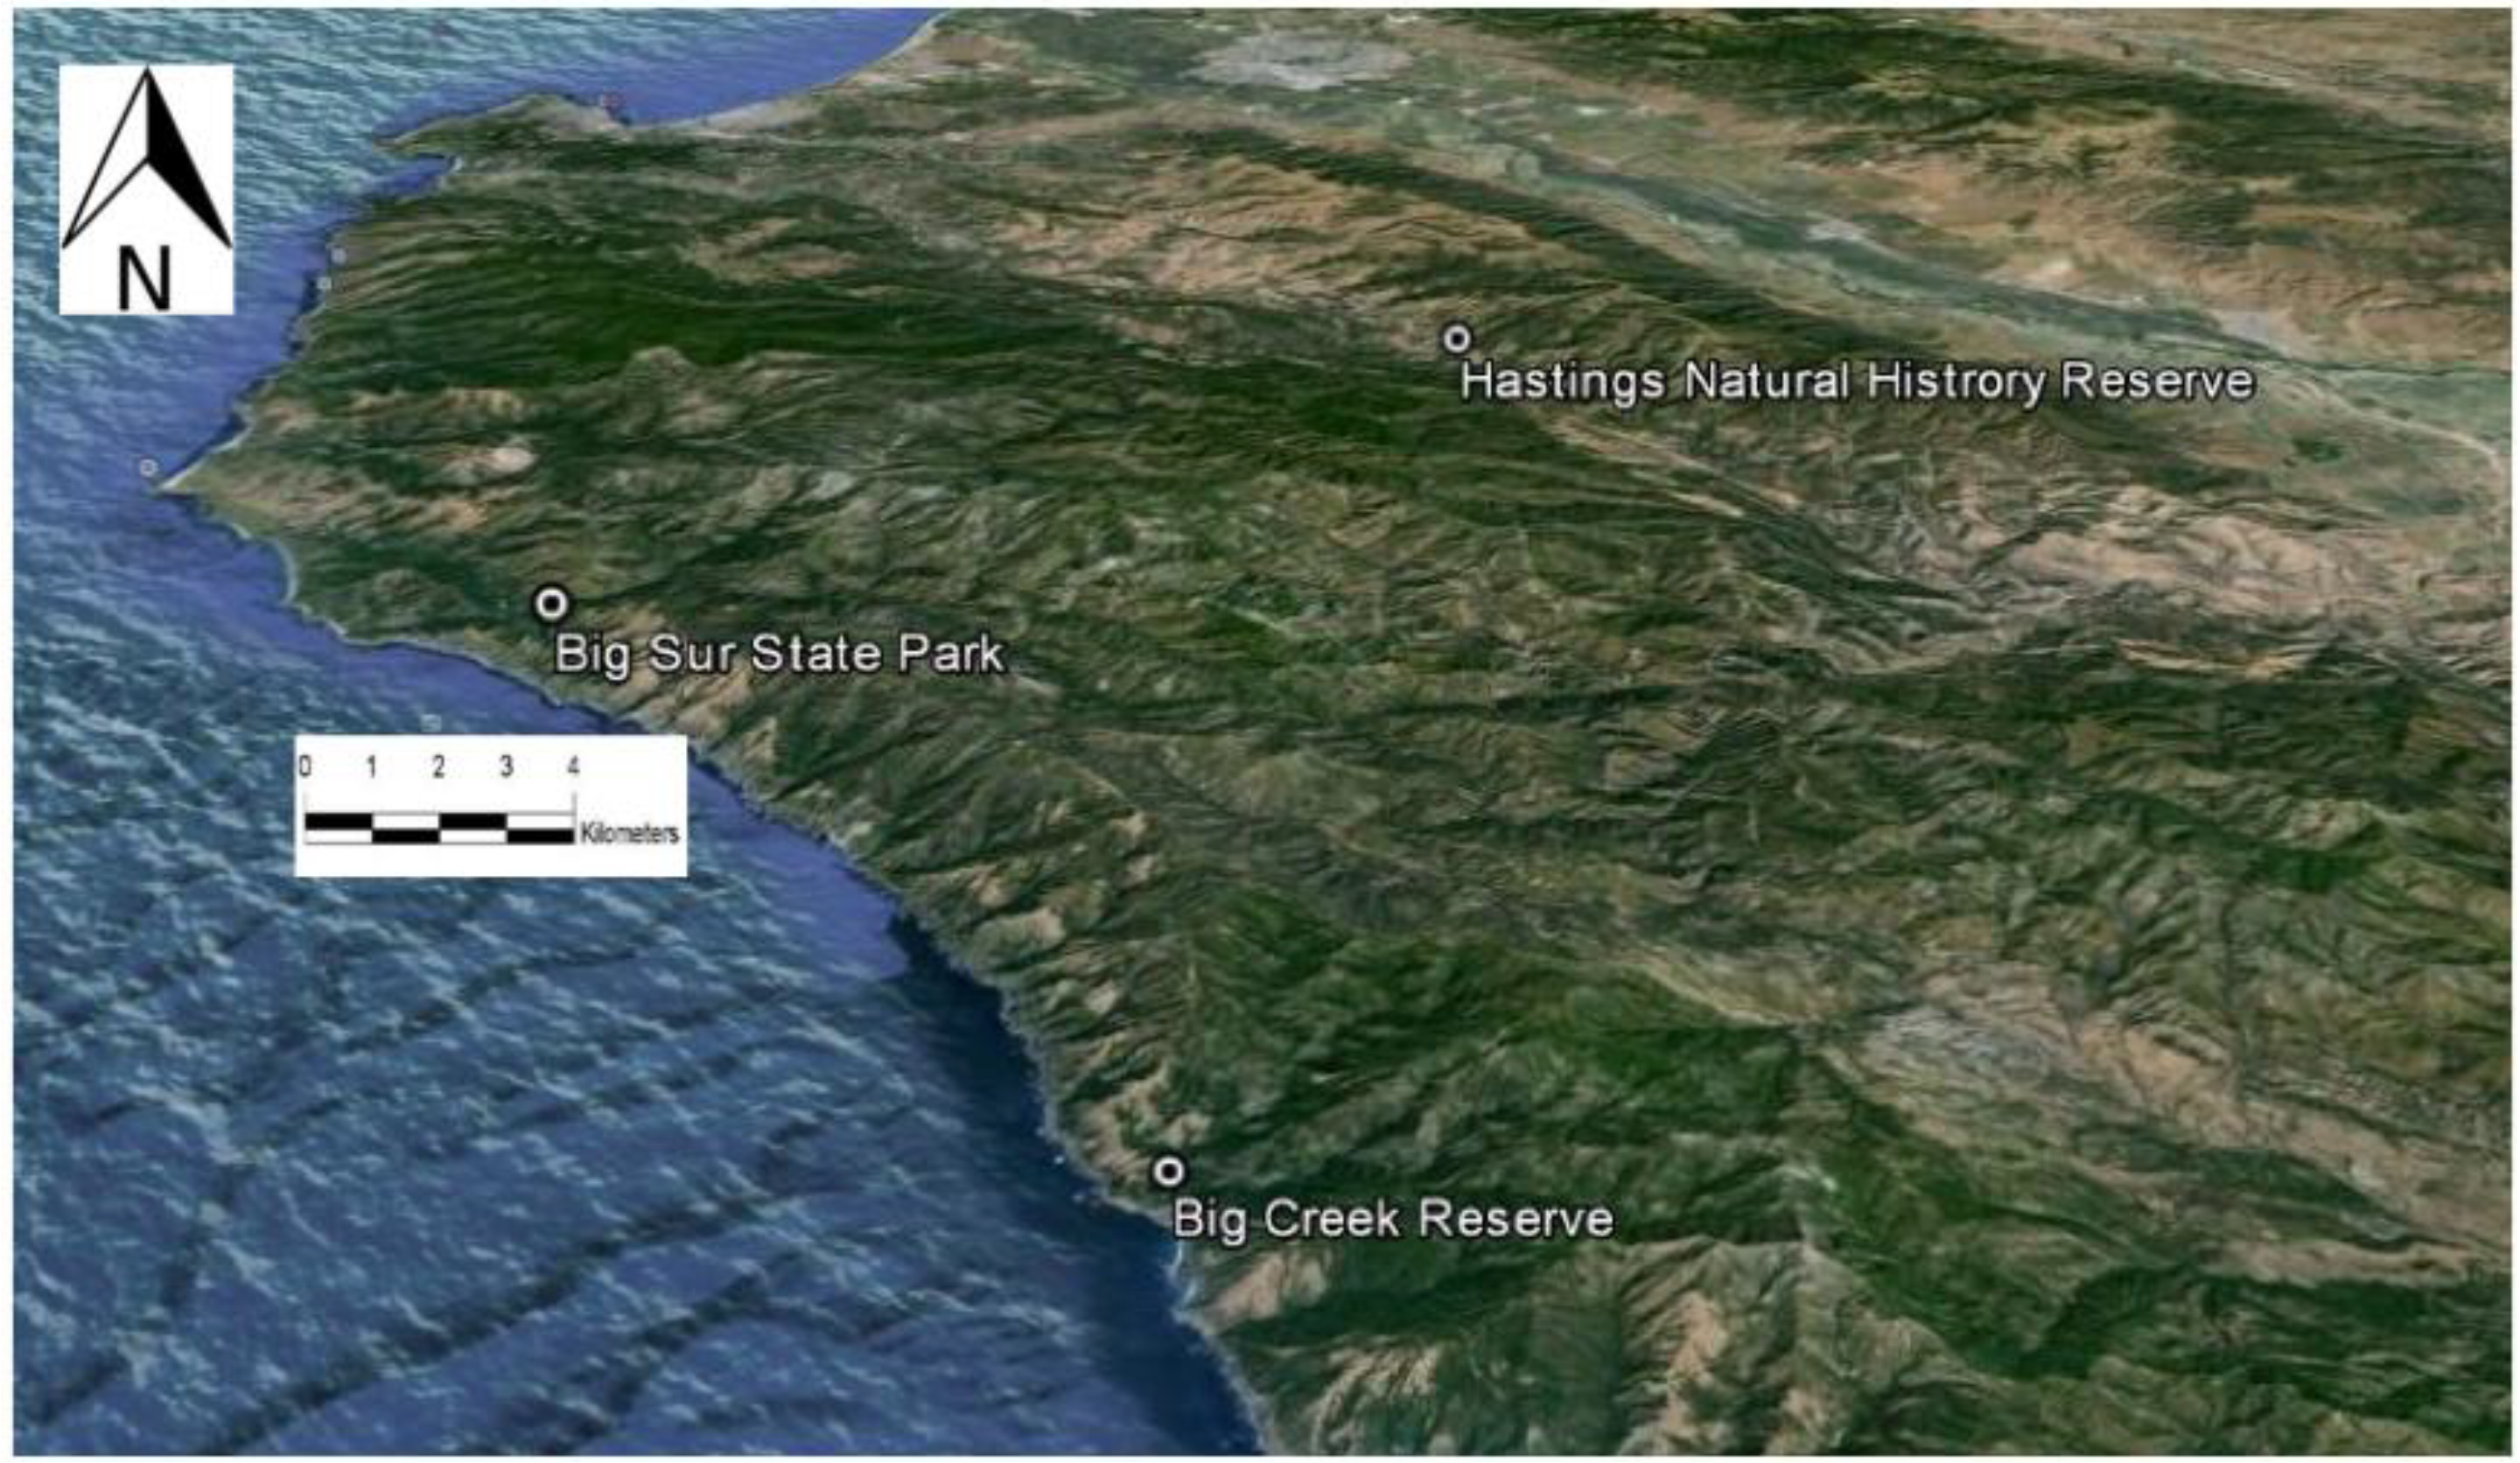
The study area was in the central Pacific coastal region near Big Sur, CA, USA (
Figure 1). Big Sur is generally delineated by the 140 km (90 miles) of coastline from the Carmel River in Monterey County south to the San Carpoforo Creek in San Luis Obispo County, and extends about 30 km inland to the eastern foothills of the Santa Lucia Mountains. The region has a Mediterranean climate of warm, dry summers and cool, wet winters, with localized summer fog near the coast [
4]. Annual rainfall is highly variable and ranges from 400 to 1520 mm throughout the region, with highest event totals generally falling on the higher mountains in the northern extreme of the study area during winter storms. During the summer, fog and low clouds are frequent along the coast. Mean annual temperature ranges between 10 °C and 15 °C, from shaded canyon bottoms to exposed ridge tops, respectively.
Figure 1.
Map of the Big Sur area showing weather station locations.
Figure 1.
Map of the Big Sur area showing weather station locations.
Plant growth on the Central Coast can be highly variable from year-to-year and is generally limited by declines of soil moisture in the summer and by cool temperatures in the winter [
4]. The annual production pattern for coastal grasses is rapid growth in the late fall (November) after the first rains have returned, slow winter growth (December–February), and rapid growth again in spring (March–May) [
7,
8,
9].
4. Results
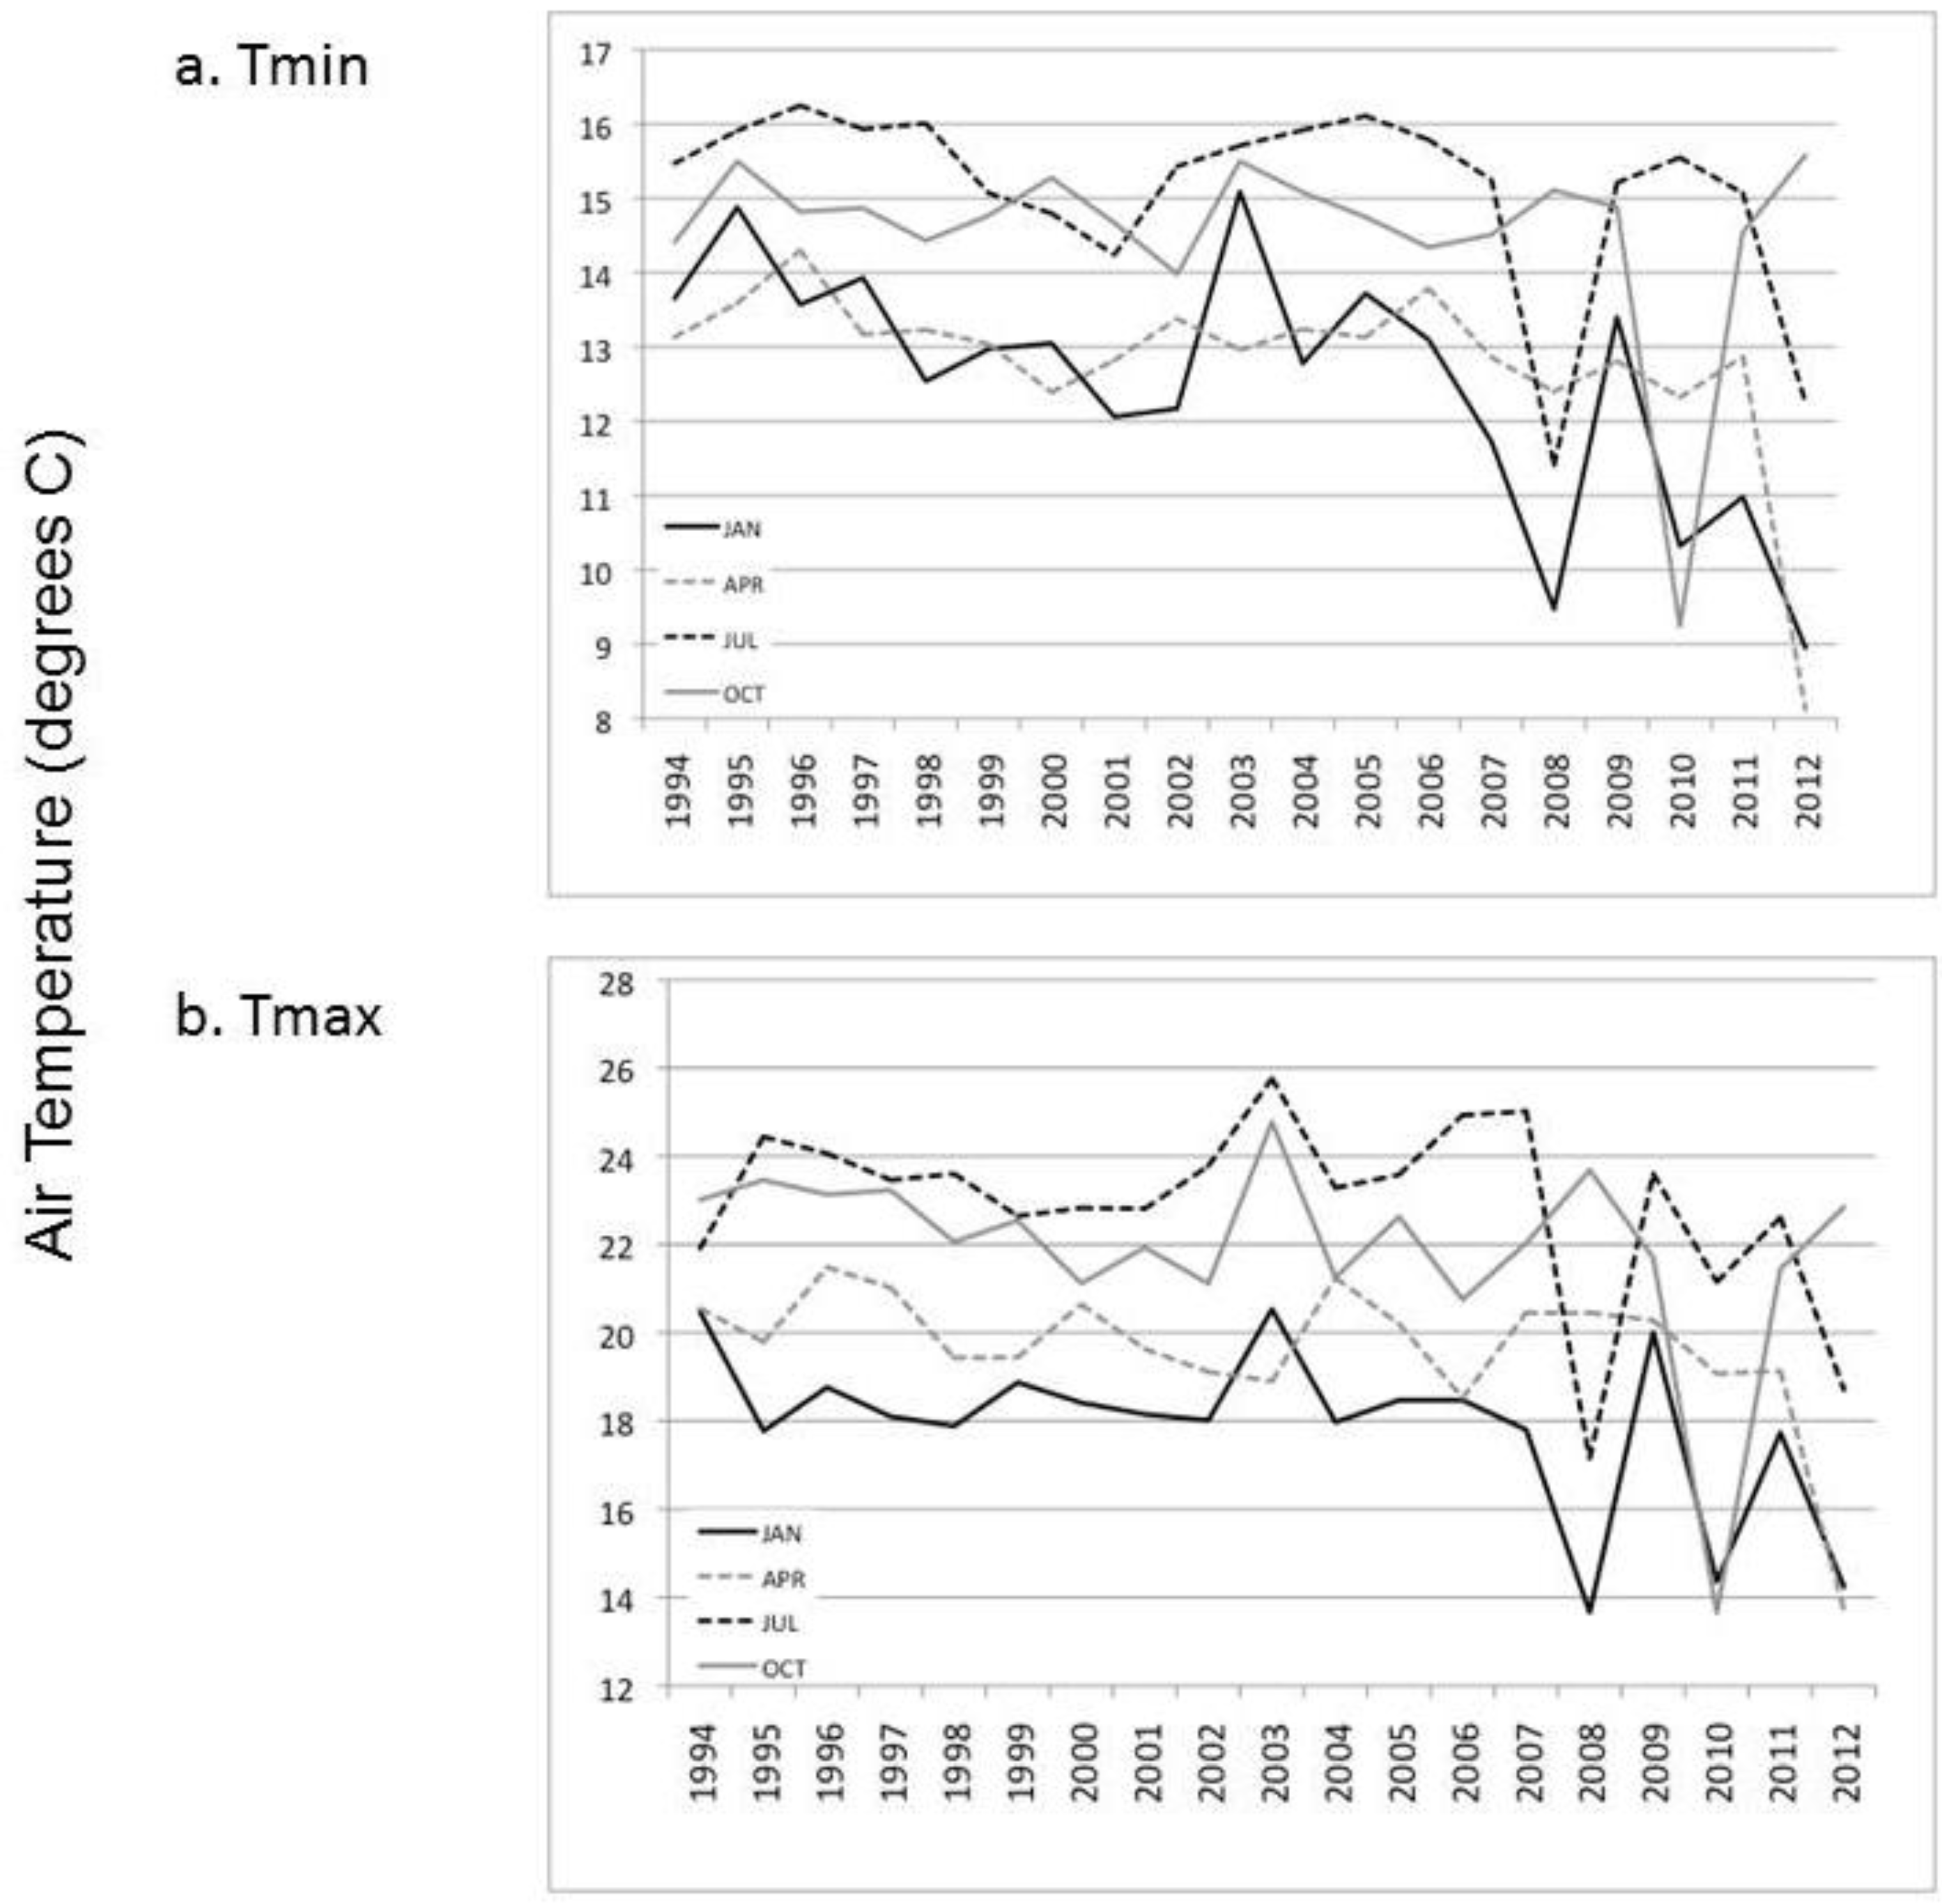
Average Tmin at the coastal BSP weather station over the past 20 years (1994–2013) decreased significantly (
Table 1) for the months of January, April, and July (
Figure 2a). The most consistent decrease in average monthly Tmin values was detected in the winter months (December–February), with time series
R2 values as high as 0.5. The downward trends in Tmin for all seasons at BSP was most notable after 2003, and was heavily influenced by colder Tmin averages in 2008, 2010, and 2012. None of the Tmin time series at BSP showed any statistically significant autocorrelation of residuals.
Table 1.
Linear regression coefficients of determination (R2 values) from monthly average temperature time series analysis for the Big Sur State Park (BSP) weather station from 1994 to 2013.
Table 1.
Linear regression coefficients of determination (R2 values) from monthly average temperature time series analysis for the Big Sur State Park (BSP) weather station from 1994 to 2013.
| | Tmin Monthly R2 | p Less than | Tmax Monthly R2 | p Less than |
|---|
| January | 0.41 | 0.01 * | 0.21 | 0.05 * |
| April | 0.29 | 0.05 * | 0.25 | 0.05 * |
| July | 0.26 | 0.05 * | 0.21 | 0.05 * |
| October | 0.07 | NS | 0.14 | NS |
Average Tmax over the past 20 years (1994–2013) at the BSP station decreased significantly as well (
Table 1) for the months of January, April, and July at the BSP weather station (
Figure 2b). The most consistent decrease in average monthly Tmax values was detected in the spring months (April–June), with
R2 values as high as 0.3. None of the Tmax time series at BSP showed any statistically significant autocorrelation of residuals.
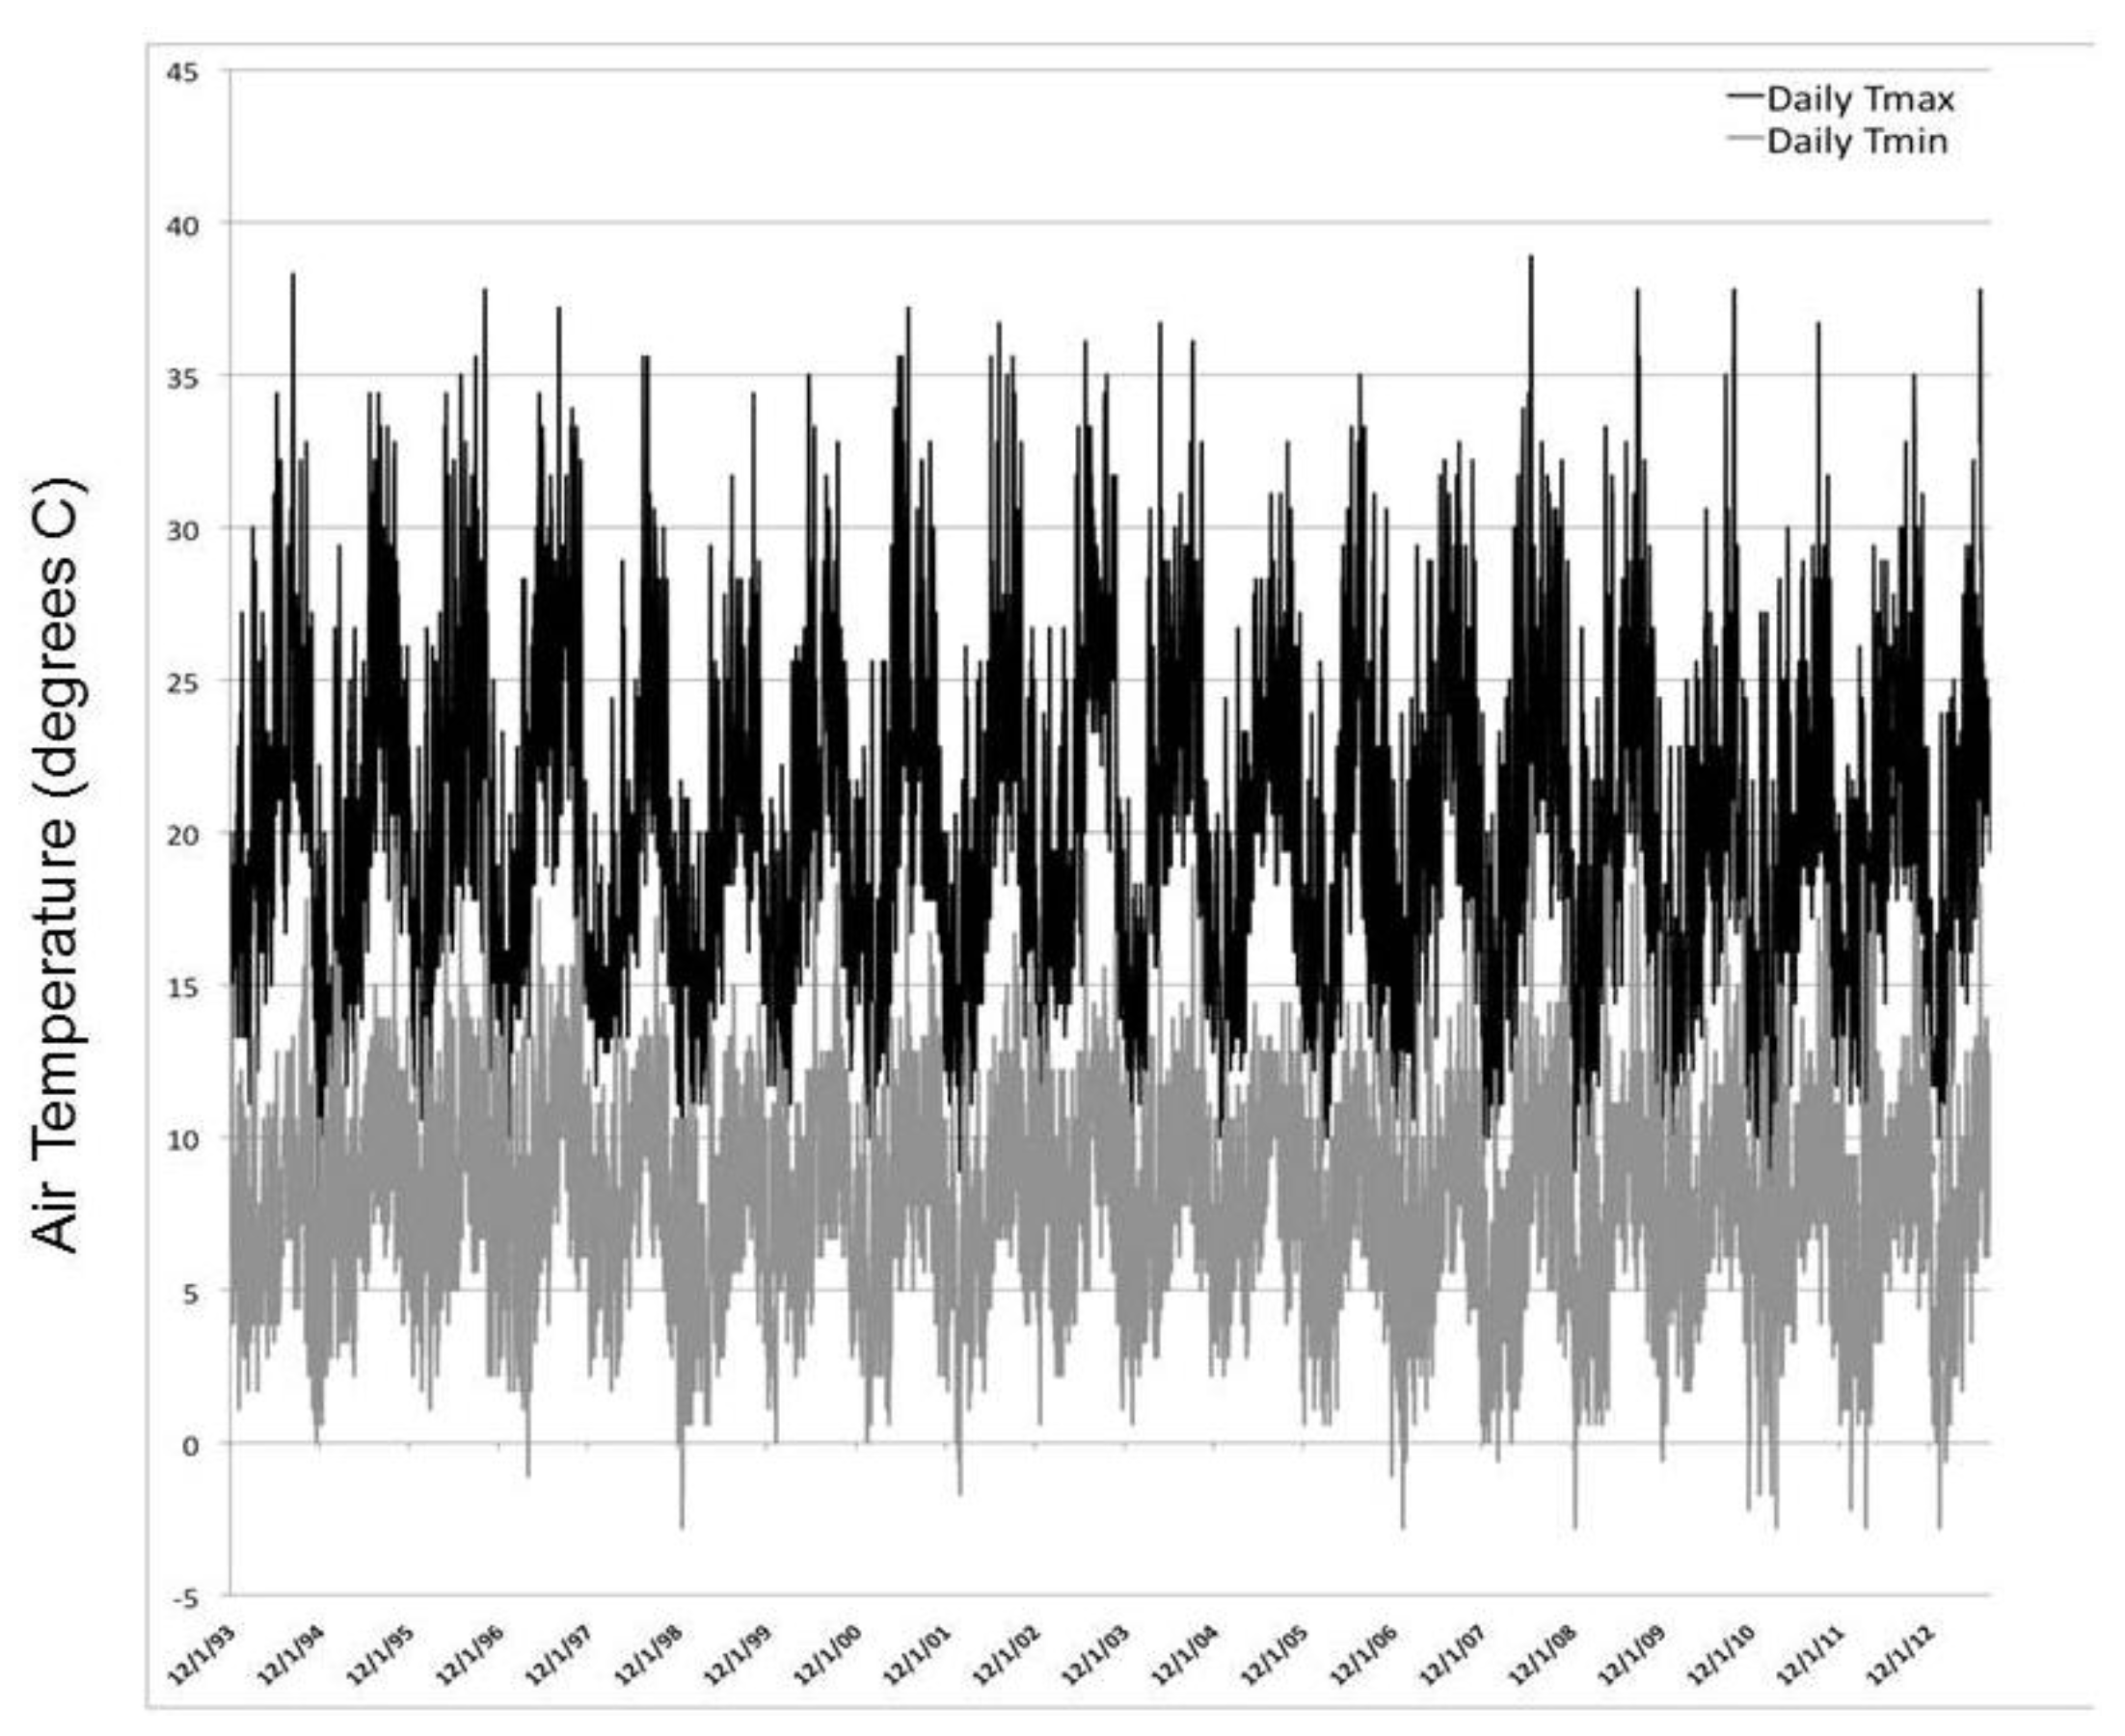
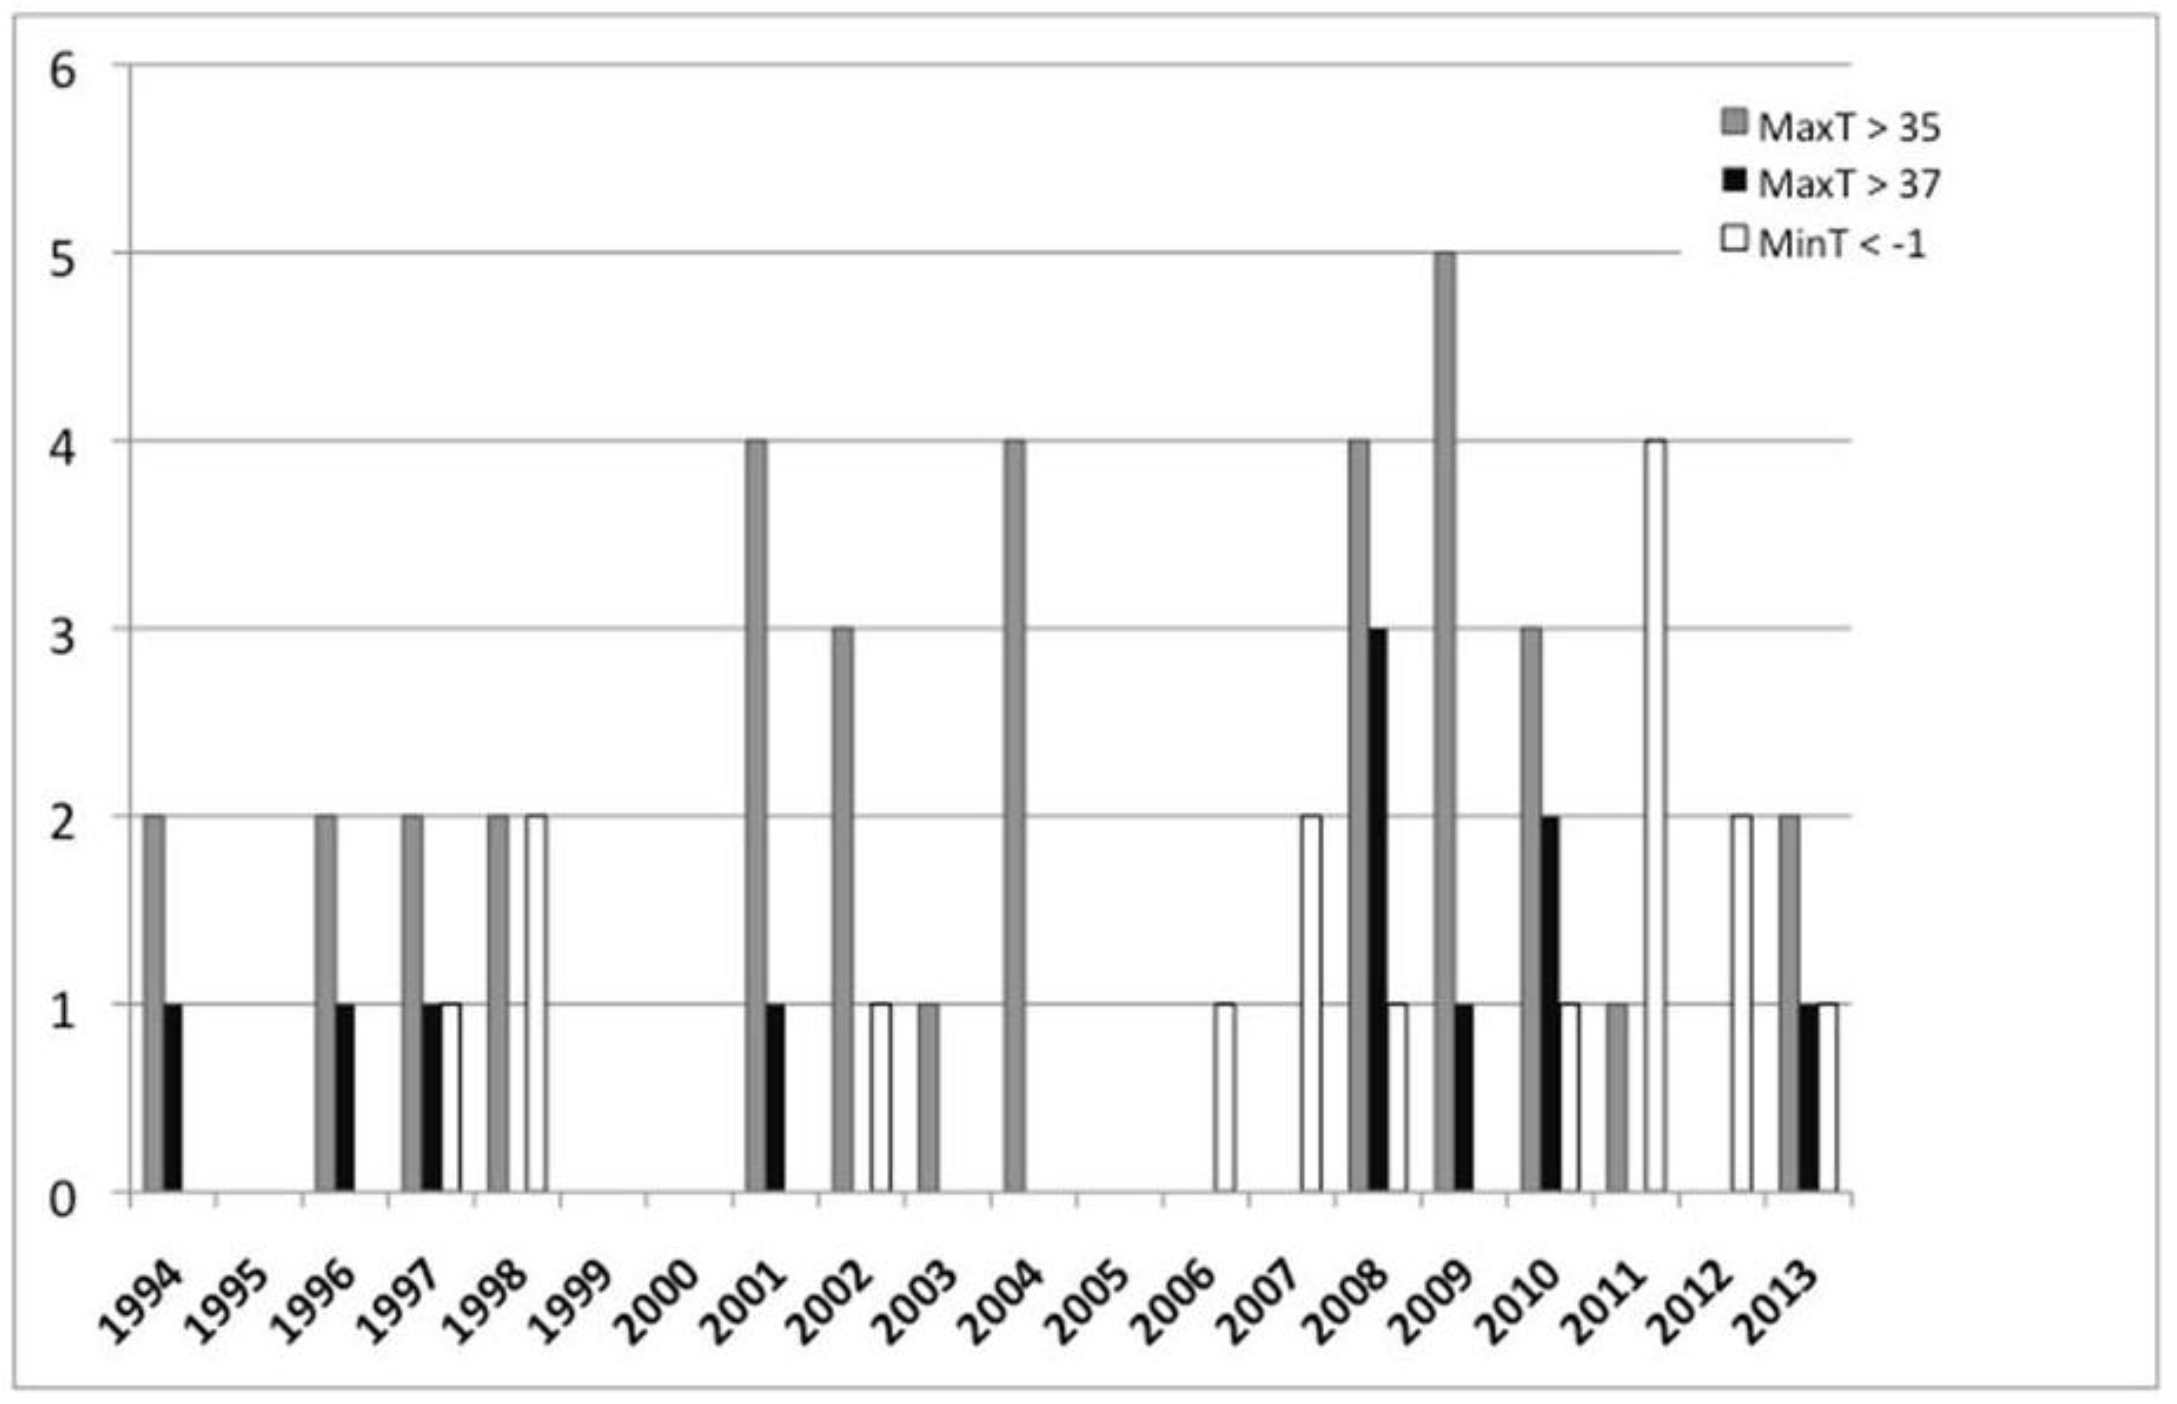
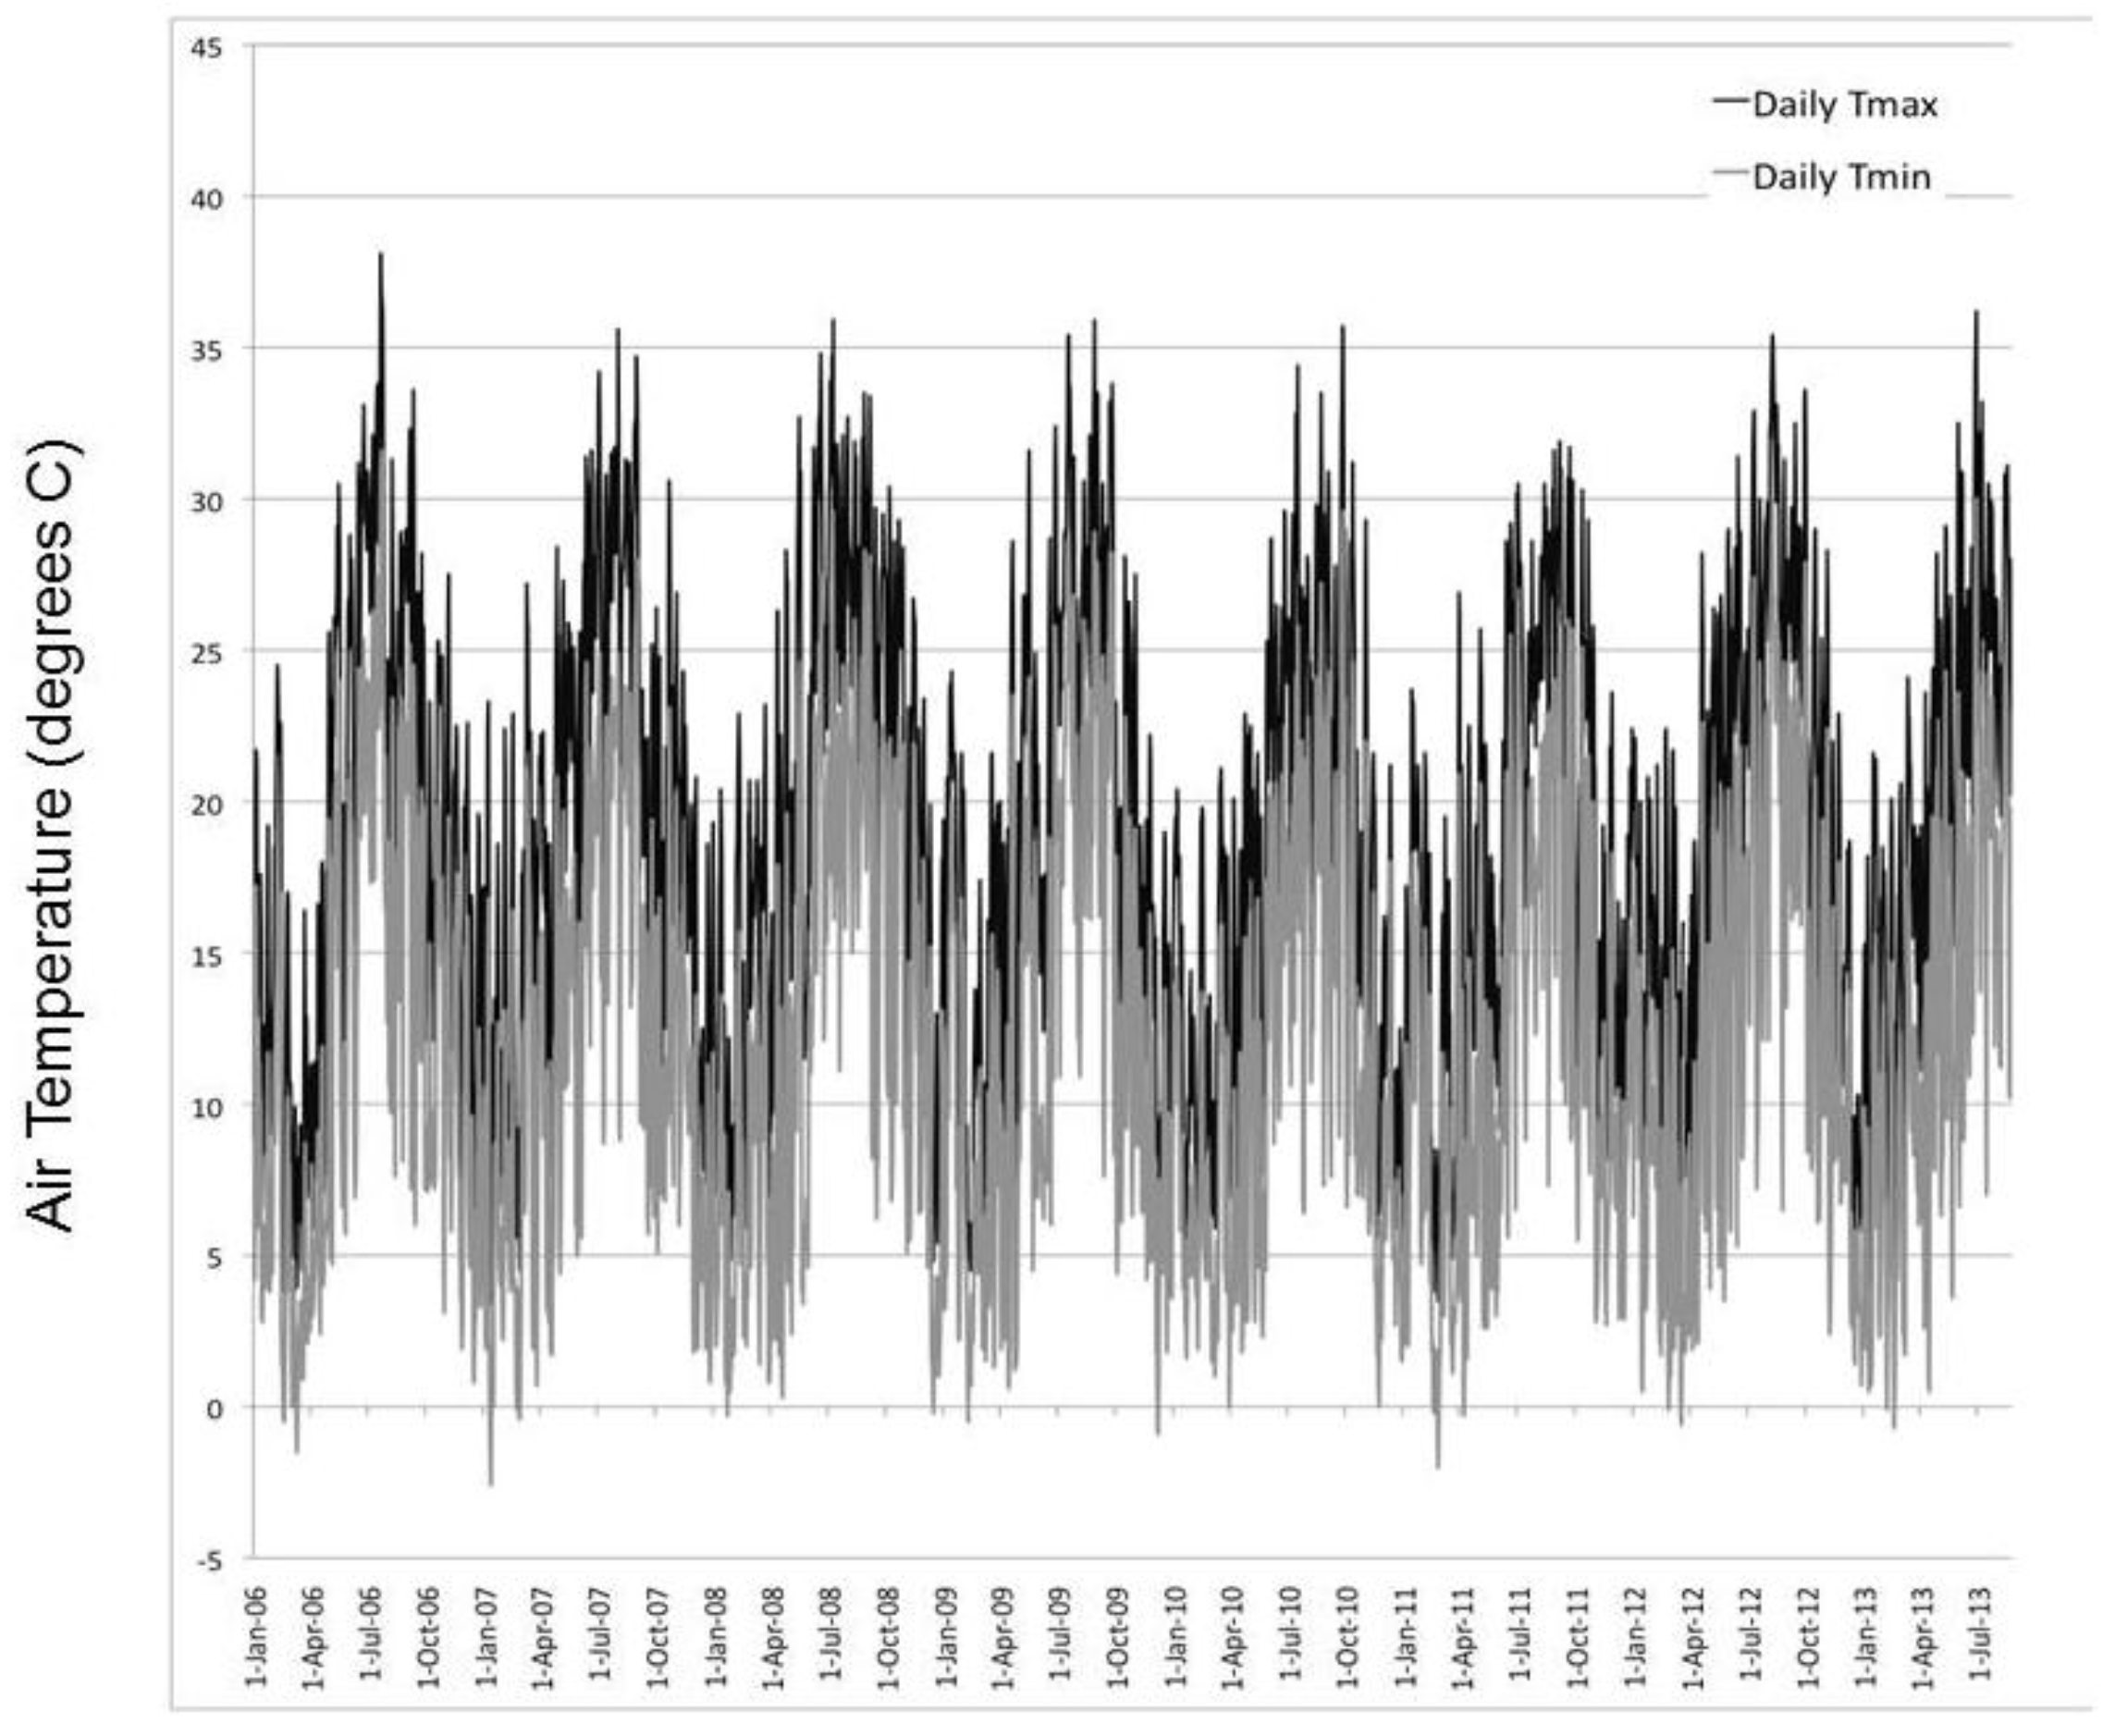
A closer examination of daily Tmin and Tmax time series at the BSP station location showed an increase in the number of extreme Tmin values < −1 °C from 1994 to 2013, and also in the number of extreme Tmax values > 35 °C (
Figure 3). Prior to the year 2000, the station at BSP recorded only 3 days with Tmin values < −1 °C; whereas in the years 2006 and 2013, the station at BSP recorded 12 days with Tmin values < −1 °C (
Figure 4). Even while the average monthly Tmax over the past 20 years (1994–2013) decreased gradually and significantly, the number of extreme warm summer days also increased in frequency, showing only 8 days with Tmax values >35 °C prior to 2000, but 15 days with Tmax values > 35 °C in 2006–2013. Likewise, the BSP record showed only 3 days with Tmax values > 37 °C prior to 2000, but 7 days with Tmax values > 37 °C in 2006–2013.
Figure 2.
Monthly average temperatures at the BSP station from 1994 to 2013. (a) monthly minimum, (b) monthly maximum.
Figure 2.
Monthly average temperatures at the BSP station from 1994 to 2013. (a) monthly minimum, (b) monthly maximum.
The coastal weather station record at BCR (2006 to 2013) corroborated the average daily summer months cooling trend observed after 2005 at the BSP station (
Figure 5). Average June–August Tmax values at BCR dropped routinely to below 27 °C by 2010, down from more typical average daily summer Tmax levels of >28 °C in previous years.
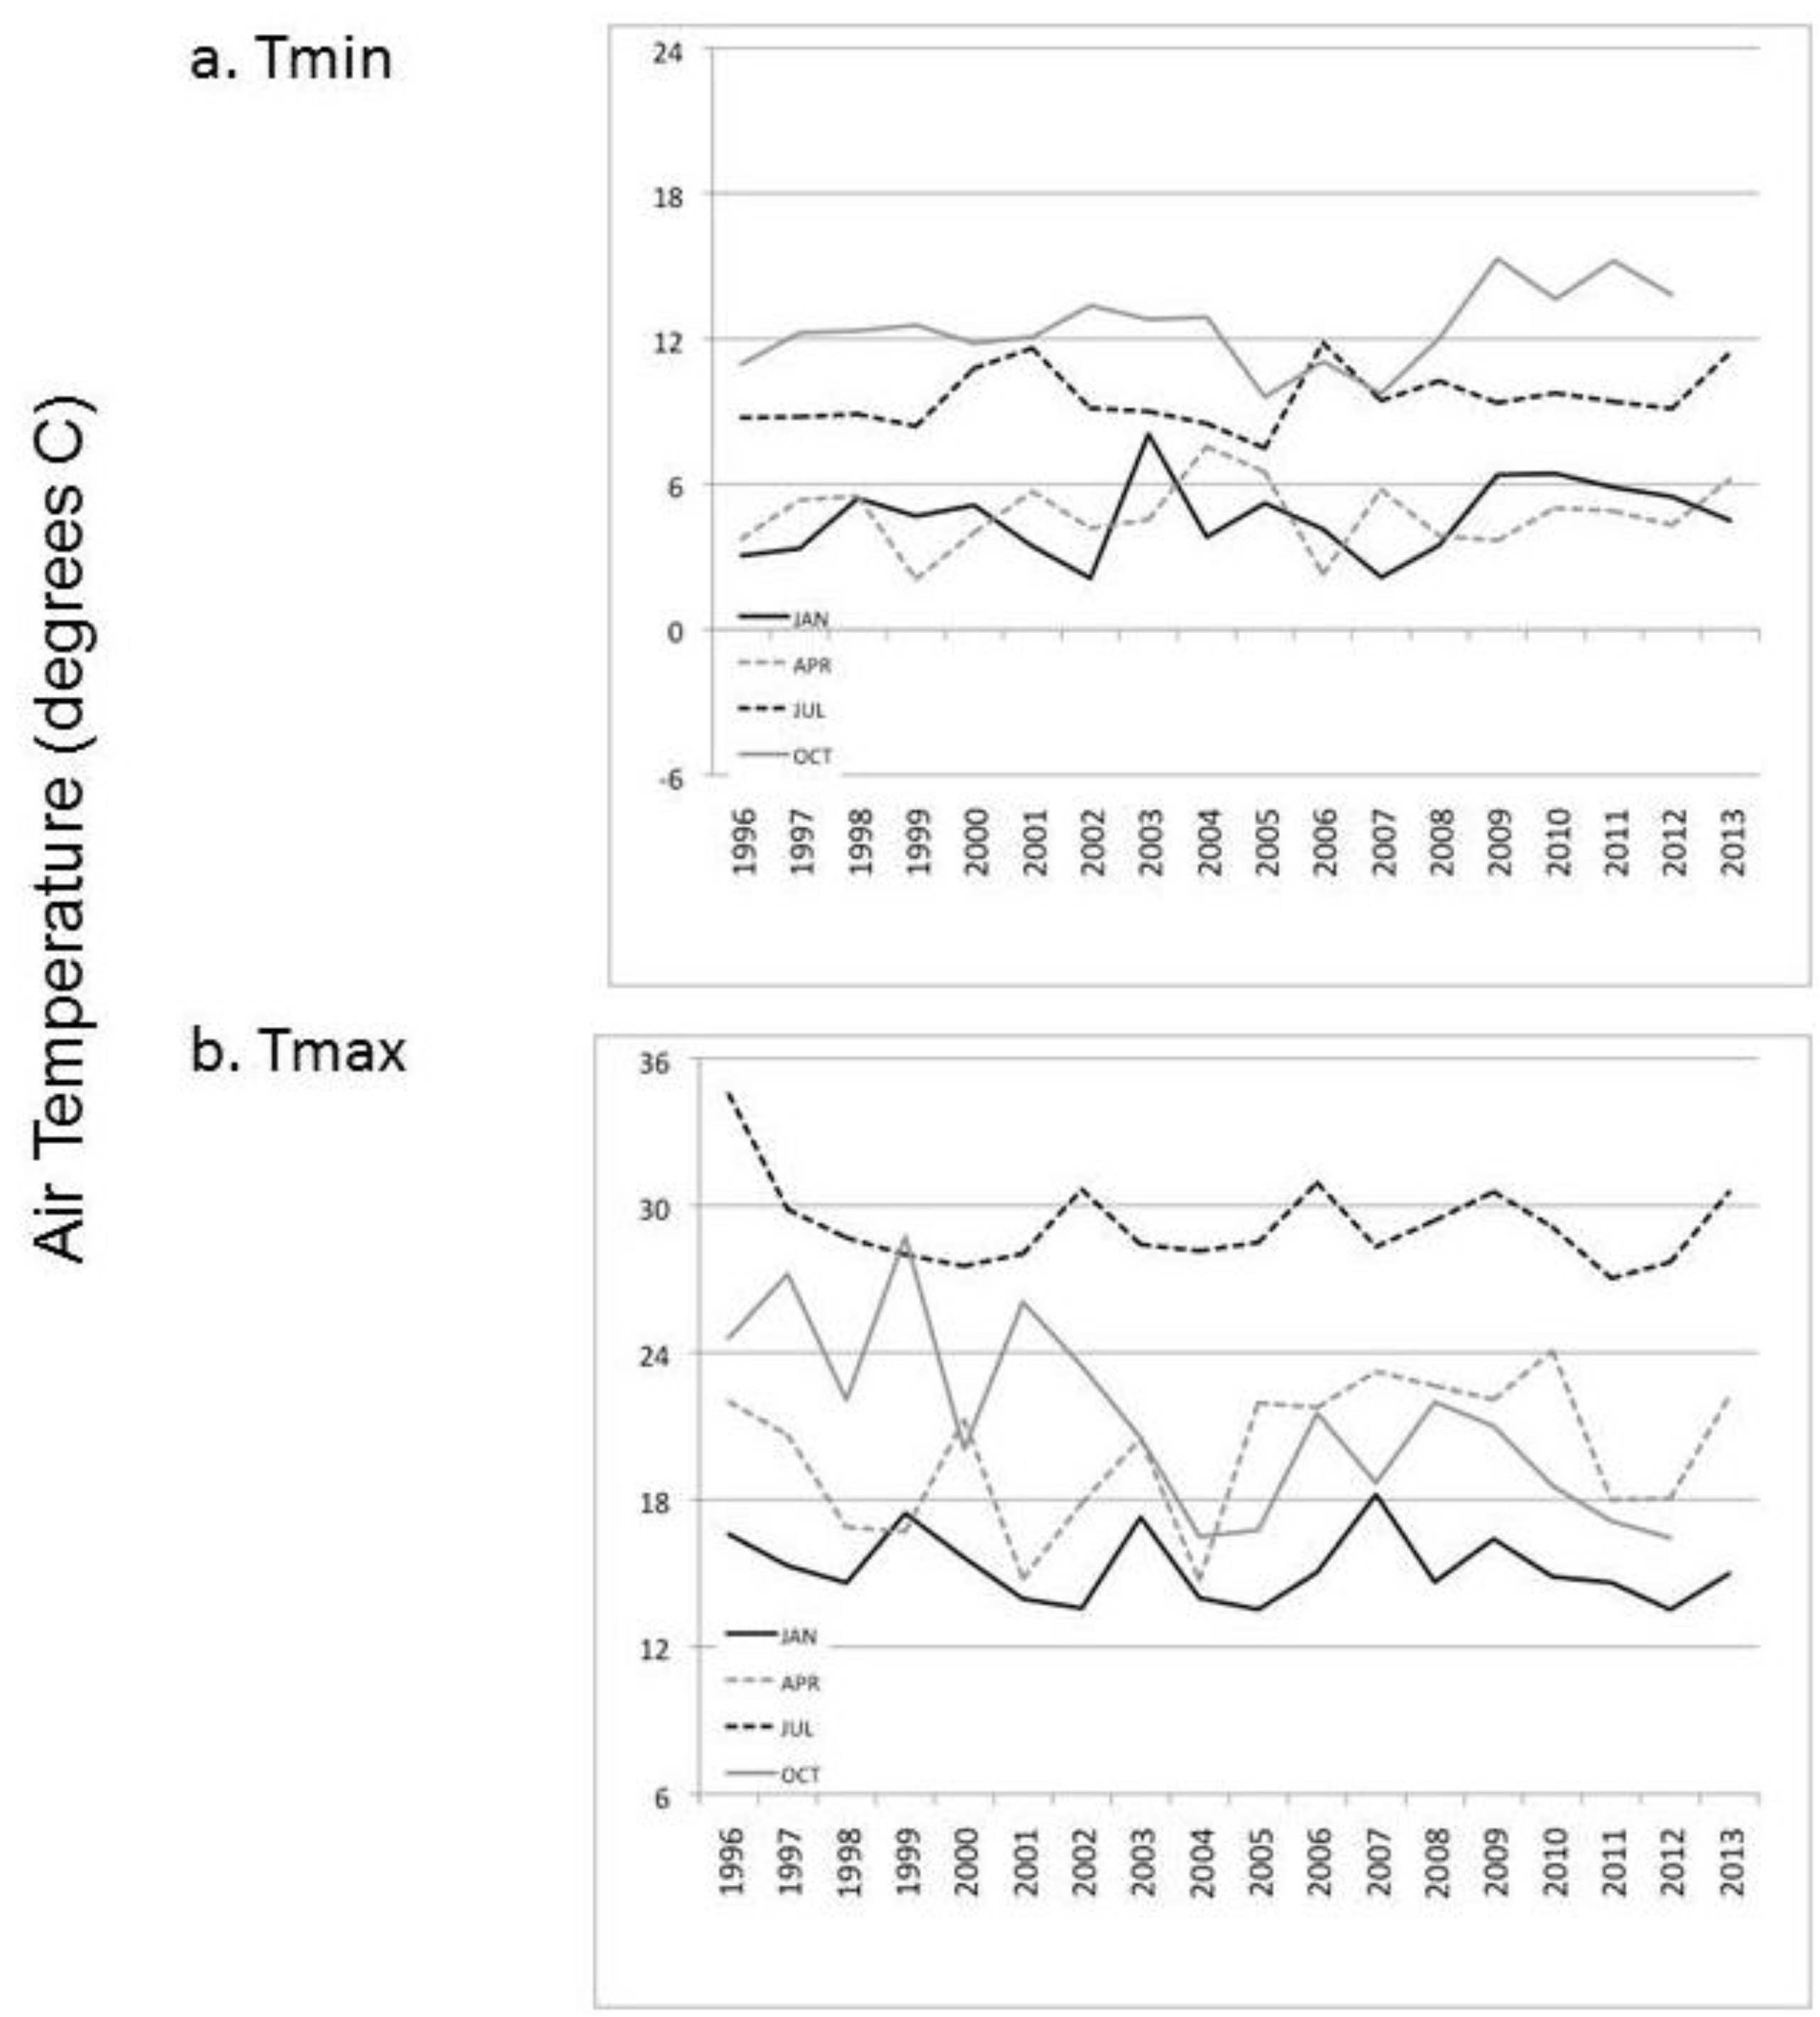
Comparison of the more inland weather station record at HNR from 1996 to 2013 showed no statistically significant trends in monthly average Tmin or Tmax, with the exception of October Tmax cooling (
R2 = 0.5,
p < 0.05) offset by detectable October Tmin warming (
Figure 6). Generally, relatively cool and warm years at HNR have oscillated on a 3 to 4 year cycle over this period, such that no major coastal air mass cooling trend could be detected in this station located in the Carmel River drainage east of the coastal Santa Lucia mountain range.
Figure 3.
Daily Tmin and Tmax records at the BSP station from 1994 to 2013.
Figure 3.
Daily Tmin and Tmax records at the BSP station from 1994 to 2013.
Figure 4.
Annual summed temperature extremes at the BSP station from 1994 to 2013.
Figure 4.
Annual summed temperature extremes at the BSP station from 1994 to 2013.
Figure 5.
Daily Tmin and Tmax records at the Big Creek Reserve (BCR) station from 2006 to 2013.
Figure 5.
Daily Tmin and Tmax records at the Big Creek Reserve (BCR) station from 2006 to 2013.
Figure 6.
Monthly average temperatures at the Hastings Natural History Reserve (HNR) station from 1996 to 2013. (a) monthly minimum, (b) monthly maximum.
Figure 6.
Monthly average temperatures at the Hastings Natural History Reserve (HNR) station from 1996 to 2013. (a) monthly minimum, (b) monthly maximum.
5. Discussion
The results from this study offer new evidence of potential climate change impacts on California’s coastal zone. Previously, Lebassi
et al. analyzed California coastal cooling trends in only summer air temperature records and did not focus on the Central Coast region [
5]. Results from the present study imply that Tmin in the winter season likewise has cooled the Big Sur coast, particularly after 2003.
Closer examination of daily temperature records at a station location near the Big Sur coast revealed that even as average monthly Tmax could decrease gradually, the number of extreme warm summer days (Tmax > 37 °C) has also increased by several fold in frequency. Overall patterns in the station records since the mid-1990s indicated that diurnal temperature ranges are widening on the Big Sur coast, with markedly cooler nighttime temperatures (frequently in the wet winter season) followed by slightly higher-than-average daytime temperatures, especially during the warm, dry summer season. The main lesson from this analysis is that long-term monthly climate trends (no matter how strong) can mask potentially important daily events that are opposite in direction. More extreme hot days in the summer season may offset some mitigating effects of cooling effects on the Pacific coast, but the available weather station record is too short and geographically sparse at this time to speculate further in this regard.
On a statewide basis, surface air temperatures have been warming between 1950 and 2005 [
7]. Almost all increases detected were due to changes in Tmin in the dry summer season, since Tmax showed either no change or cooling. A current hypothesis is that observed coastal California cooling of Tmax values derives from greenhouse gas-induced regional warming of the inland Central Valley and Sierra Nevada foothill areas, resulting in increased on-shore sea-breeze flow, which in turn can overwhelm GHG warming of coastal areas [
9]. This hypothesis is consistent with increased upwelling of cold ocean water off the California coast that further enhances cool sea-breeze flows and associated low stratus cloud cover.
Regional warming remains a plausible explanation for the results of this study. As an alternative (or additional explanation), the Pacific Decadal Oscillation (PDO) index [
11], defined as the leading principal component of North Pacific monthly sea surface temperature variability (poleward of 20°N) from 1995 to 2012 was compared to the coastal temperature record from Big Sur. The results showed a non-significant statistical relationship, such that the PDO did not explain a more than about 10% of the variation in monthly land temperatures on the Big Sur coast. It is worth noting that the PDO shifted from the warm phase to the cool phase in 1998, and in 2003, there was an unusually warm influx of waters—PDO shifted temporarily to warm again until about 2008. Since then, the PDO has been mostly cool (negative). With a cooler PDO, the regional warming differential would be moderated, possibly leading to weaker marine incursions. Because there are no other decade-long observational data sets for wind patterns and surface pressure specifically for the Big Sur coast, further analysis of ocean temperature oscillations on coastal cooling is not feasible at this time, but may prove interesting in the decades to come.
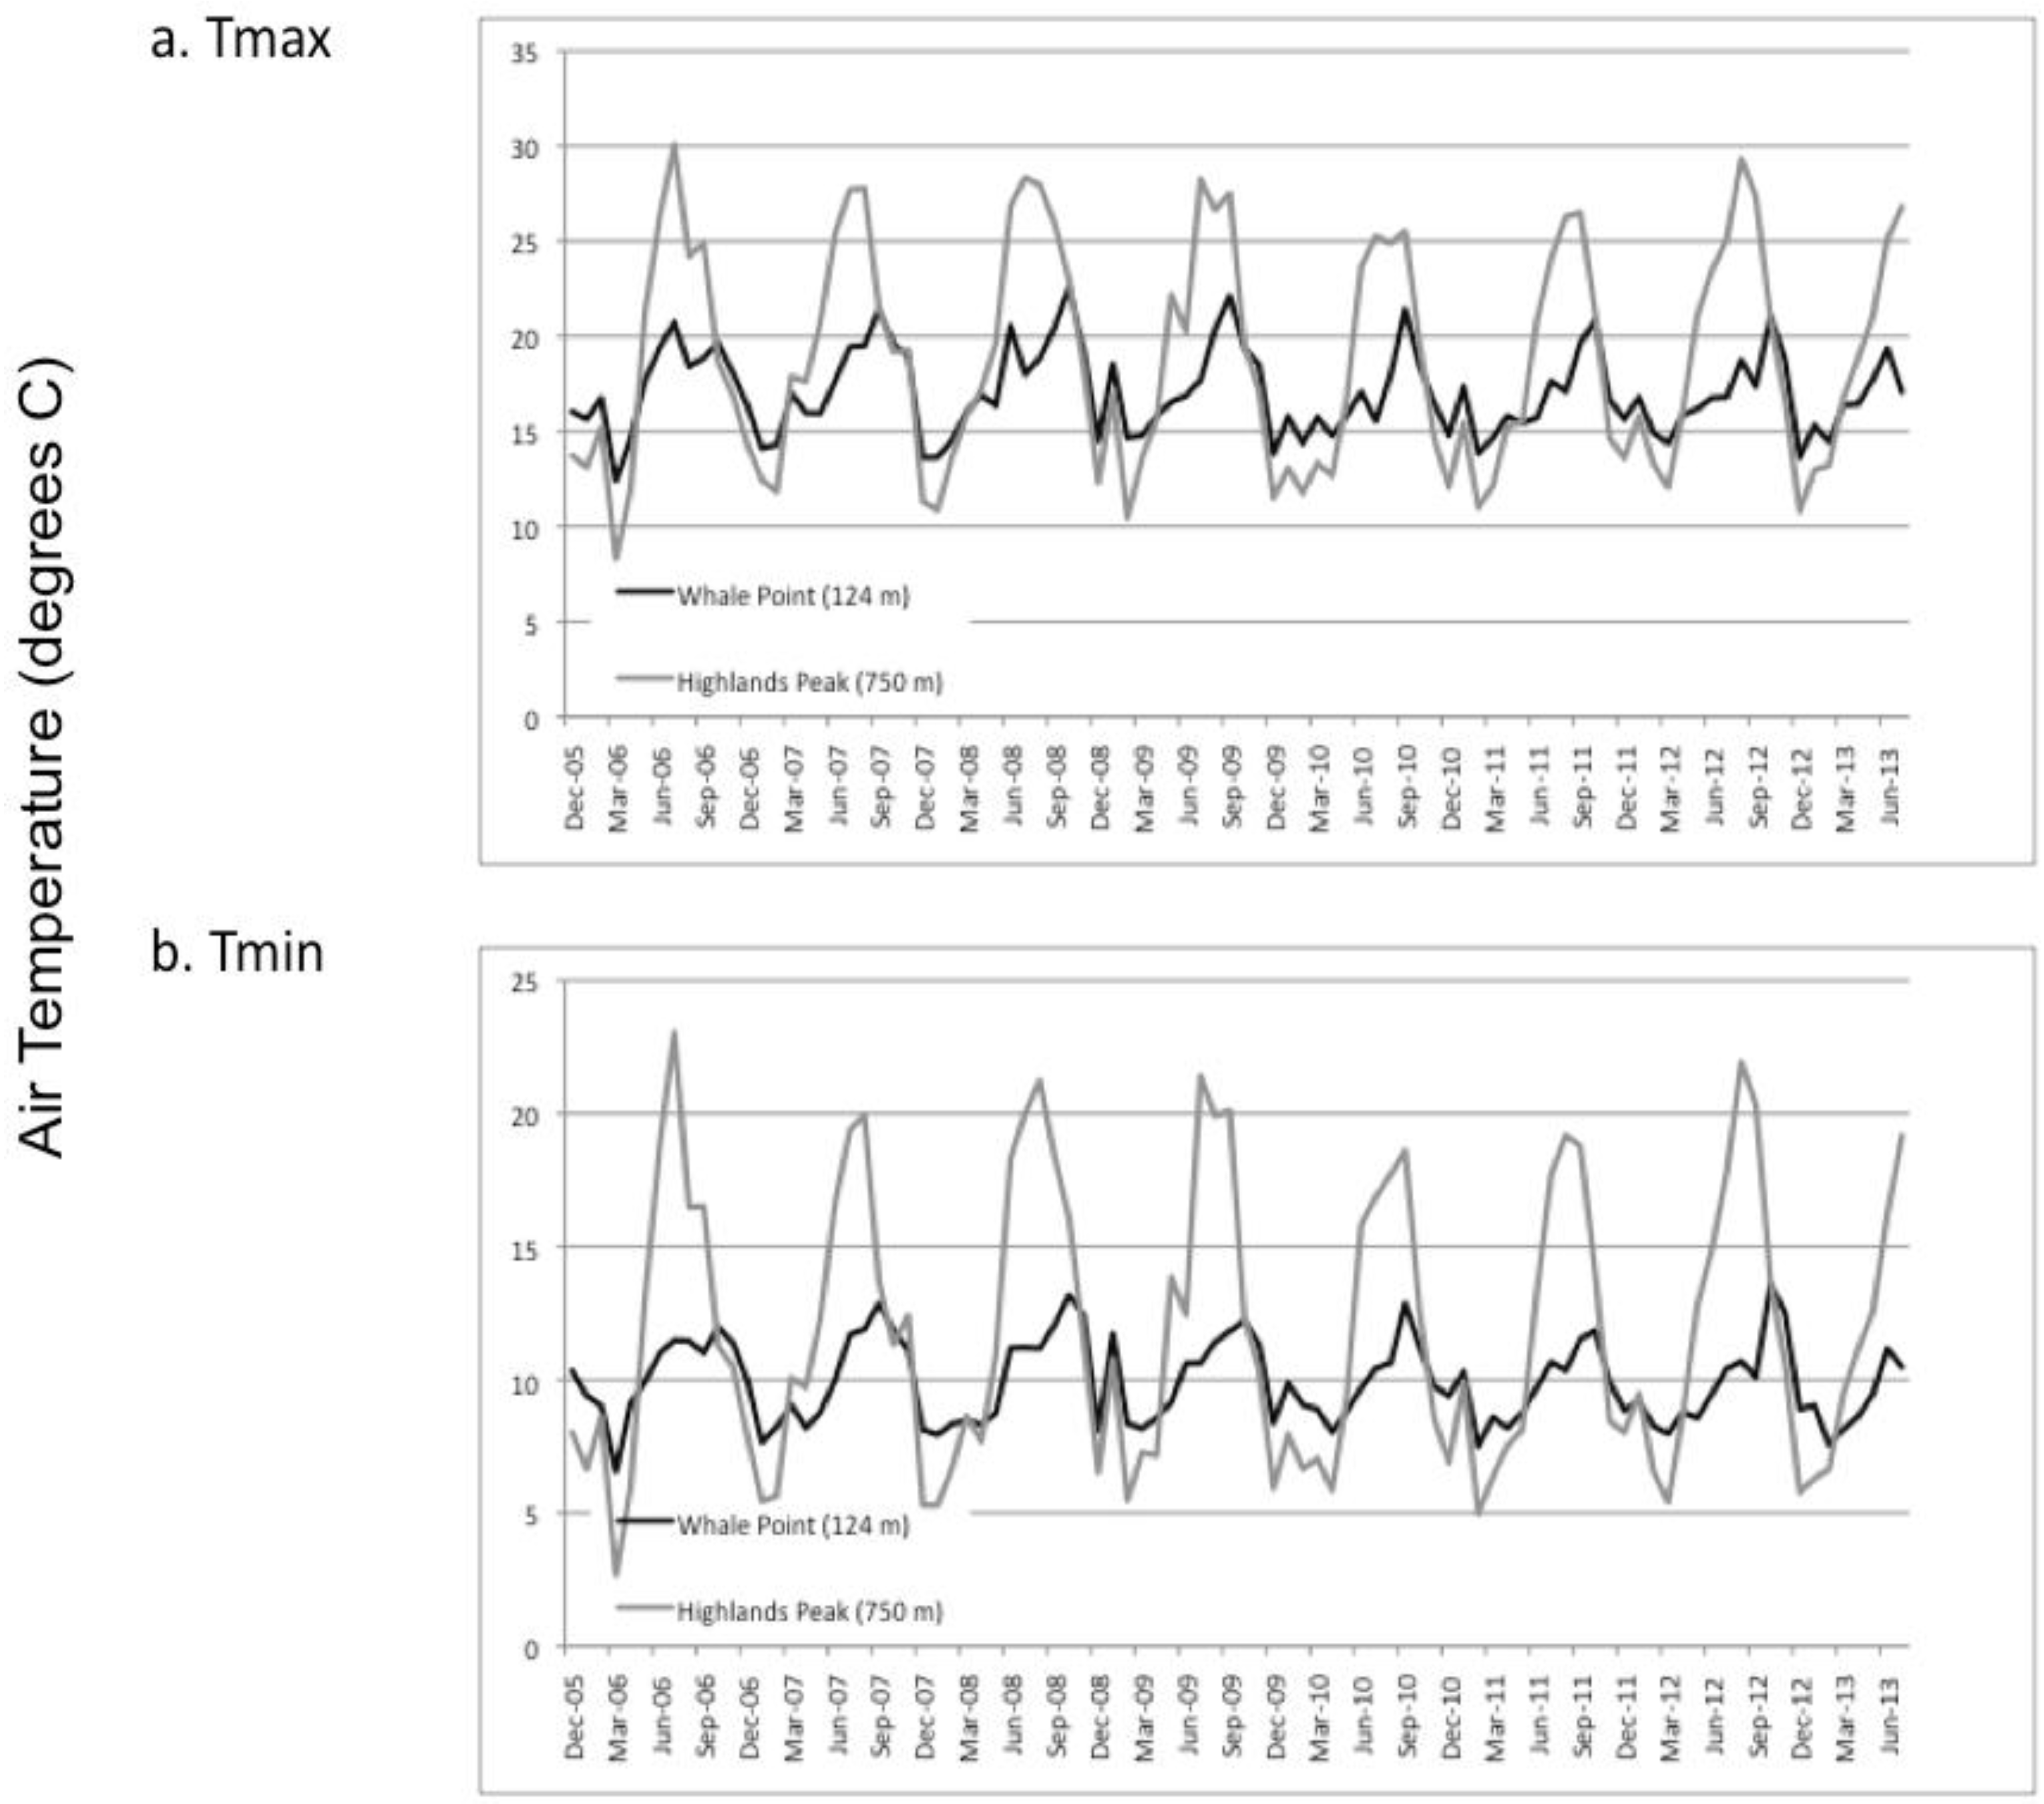
Figure 7.
Monthly temperature extremes at two BCR stations from 2006 to 2013. (a) monthly maximum, (b) monthly minimum.
Figure 7.
Monthly temperature extremes at two BCR stations from 2006 to 2013. (a) monthly maximum, (b) monthly minimum.
Nevertheless, it is common to observe temperature inversions on the Central Coast that frequently result from the persistent marine layer, and which remain very stable between May and October [
8]. Summer fog is common below about 600 m (2000 feet) elevation [
4]. Nonetheless, diurnal heating and cooling of ecological habitats along the Big Sur coast and higher into the Santa Lucia mountains involves a complex series of elevational gradients and topographic variations. In general, steep slopes of coastal scrub vegetation mixed with open grasslands starting just above sea level give way to mixed hardwood (oak) forests at around 600 m elevation, which in turn transition to pine (
Pinus ponderosa and
Pinus coulteri) woodlands at around 900 m (3000 feet) elevation. In the canyon bottoms and on the lower parts of north-facing slopes, coast redwood (
Sequoia sempervirens) stands are able to grow. As can be discerned from a comparison of monthly average temperature records from BCR at 124 m and 750 m elevation stations (
Figure 7), the moderating effect of frequent on-shore sea breezes and the marine layer reduce the diurnal and seasonal temperature range enormously at the lower (coastal scrub) elevation. An expansion upward in elevation of these coastal cooling temperature trends could force mixed hardwood and pine forests to contract further into the mountain ridge tops.

