Article

Culture Mediates Climate Opinion Change: A System Dynamics Model of Risk Perception, Polarization, and Policy Effectiveness

1
Julie Ann Wrigley Global Futures Laboratory, Arizona State University, Tempe, AZ 85287, USA
2
Division of Politics, Administration and Justice, California State University-Fullerton, Fullerton, CA 92834, USA
3
Department of Environmental Social Sciences, Doerr School of Sustainability, Stanford University, Stanford, CA 94305, USA
4
Department of Ecology and Evolutionary Biology, University of Tennessee-Knoxville, Knoxville, TN 37996, USA
5
School of Life Sciences, Arizona State University, Tempe, AZ 85287, USA
6
Department of Psychology, College of Arts & Sciences, Rhode Island College, Providence, RI 02908, USA
7
Department of Plant Biology, University of Vermont, Burlington, VT 05405, USA
8
Department of Computer Science, University of Vermont, Burlington, VT 05405, USA
9
Gund Institute for Environment, University of Vermont, Burlington, VT 05405, USA
10
Vermont Complex Systems Institute, University of Vermont, Burlington, VT 05405, USA
*
Authors to whom correspondence should be addressed.
Climate 2025, 13(9), 194; https://doi.org/10.3390/cli13090194
Submission received: 16 July 2025 / Revised: 8 September 2025 / Accepted: 10 September 2025 / Published: 17 September 2025

Abstract

Despite the growing impacts of climate change worldwide, achieving consensus on climate action remains a challenge partly because of heterogeneity in perceptions of climate risks within and across countries. Lack of consensus has hindered global collective action. We use a system dynamics approach to examine how interactions among cultural, socio-political, psychological, and institutional factors shape public support or opposition for climate mitigation policy. We investigate the conditions under which the dominant public opinion about climate policy can shift within a 20-year time frame. We observed opinion shifts in 20% of simulations, primarily in individualistic cultural contexts with high perceived climate risk. Changing the dominant opinion was especially difficult to achieve in collectivistic cultures, as we observed no shifts in dominant opinion within the parameter ranges examined. Our study underscores the importance of understanding how cultural context mediates the approaches needed to effectively mobilize collective climate action.

1. Introduction

Anthropogenic climate change has been recognized for over a century [1]. Yet, large-scale actions to address climate change are inadequate to avoid dangerous climate change and societal disruption [2]. This is partly because public opinion about the risks of climate change varies across individuals and countries, hindering collective action. Broad support for climate action is vital to the implementation of mitigation policies and the adoption of climate-friendly lifestyles [3,4,5].
Understanding the mechanisms that shape climate policy opinions and dynamics is essential for promoting global and local climate action [3]. Public opinion about climate change, including the level of risk it poses, varies globally across different cultural and political contexts, as well as with individual exposure to the impacts of climate change [6,7]. While direct experiences with extreme weather events can heighten individual awareness of climate change [8,9], this relationship depends on the cultural and socio-political contexts in which individuals are embedded [10,11]. A recent survey by the European Commission finds that 87% of EU residents consider climate action to be a top priority for their government [12]. In contrast, in 2023, only 37% of Americans ranked climate change as a top priority for the President and Congress. In the U.S., climate change was ranked 17th out of 21 national issues. Climate change opinions also diverge within countries—especially as the issue has become increasingly politicized [13].
We use a system dynamics approach to address three major gaps in current studies of climate public opinion. First, we account for the dynamic and interdependent relationships among individual and contextual factors—cultural, institutional, socio-political, and psychological [6,14,15]. Existing models show mixed evidence regarding the role of culture [16,17,18] and personal experience [19,20,21] on climate opinions. These inconsistencies may reflect limited consideration of the interactions among socio-political context, existing policy, and cognitive factors.
Second, we elaborate the mechanisms by which polarization shapes public opinion dynamics. Partisan polarization about climate opinion has been widely studied [22,23,24]. In particular, ideological polarization (defined here as ‘the strengthening of opinions so as to be resistant to change’) and affective polarization (defined here as ‘emotional warmth towards those with shared opinions and coldness towards those with differing opinions’) are two distinct pathways by which polarization might influence people’s beliefs about climate risks. Ideological polarization shapes how personal experiences impact one’s opinions [25] and affective polarization alters one’s patterns of social interaction [26]. However, prevailing models primarily emphasize either ideological or affective polarization, though they are likely to play different roles in belief formation and change; but see [27] for a recent paper that addresses both in the context of cooperative action. Ideological polarization has been linked to motivated reasoning, e.g., in [28], and confirmation bias [29], which lead individuals to selectively incorporate information that reinforces their preexisting beliefs. Affective polarization will influence who individuals interact with, and thus the range of opinions and experiences they are exposed to. We include both ideological and affective polarization in our model to examine their distinct influence on public opinion dynamics.
Third, prior public opinion models often assume a binary distribution of opinions (or behaviors), like support vs. opposition [30,31,32,33]. We incorporate a neutral group to more closely approximate a continuum of attitudes [34].
We develop a system dynamics model to examine how cultural, socio-political, psychological, and institutional factors shape public opinion around climate mitigation policy. Specifically, we investigate under what conditions dominant public views might shift toward supporting climate policy over a 20-year time frame. We adopt this time horizon because it is long enough to capture meaningful social and political change while still being relevant to near-term climate decision-making. Our objective is to explore opinion dynamics under various qualitative assumptions and parameter values, rather than to predict or validate real-world behaviors. We examine how cultural orientations (individualistic vs. collectivistic), ideological and affective polarization, and the policy landscape shape the relationship between individual climate concern and public support for climate policy. System dynamics simulation modeling provides an integrative mathematical framework to model interactions and feedback among various factors, linking macro-level processes to micro-level phenomena [35,36]. We use an institutional framework [10] to integrate multiple factors across cultural, socio-political, policy, and psychological perspectives, capturing the evolving patterns of public opinion dynamics in response to different contexts over time.

2. Literature Review: Experience of Extreme Events Interact with Cultural, Socio-Political, and Policy Context to Shape Public Opinion

Experiences with climate-related extreme events can heighten climate risk perception [9,37], but socio-political and cultural factors also play a crucial role [11,38,39]. As Slovic noted, “Risk does not exist independent of our minds and culture” [40] (p. 690). The reception, interpretation, and diffusion of risk signals depend on how a society communicates climate risks, which is in turn shaped by interpersonal interactions, socio-political contexts, and cultural orientations [41].

2.1. Psychological Factors: Tradeoff Between Perceived Climate Risks and Perceived Economic Costs of Mitigation

Increasing temperatures [42], floods [43], sea-level rise [44], and other extreme events [45] heighten the salience of climate change and are associated with increased climate concern; for reviews see [21,46]. Recent studies find that more frequent experience of extreme events and temperatures increase an individual’s likelihood of supporting climate change legislation [47,48,49,50]. However, empirical research also demonstrates that the relationship between experiences of extreme events and risk perceptions can be mediated by preexisting beliefs, which in turn are shaped by partisan social identities, leading to motivated reasoning and biased assimilation; for a review see [21].
Recent papers have modeled the relationship between experience of extreme events [43,51,52] or risk perceptions with public opinion [29,32,43,44,53,54,55,56].
We extend this work by also accounting for the perceived economic costs of mitigation. Research has shown that while support for climate policy tends to be widespread, willingness to pay for climate policies is much lower [57] and decreases as the costs rise [58,59]. The type of policy instrument also matters: publics tend to be more supportive of “pull” policies (e.g., subsidies) than “push” policies (e.g., taxes) [59]. Carbon taxes, in particular, tend to be less supported than a range of other climate policy levers [60]. We capture these tradeoffs observed in the empirical literature by assuming that climate risk perceptions only increase climate policy support when perceived climate risks outweigh the perceived economic costs of mitigation policies. We conceptualize this comparison as occurring within individuals’ subjective evaluations—people intuitively weigh their sense of climate threat against their sense of economic burden, creating a psychological tradeoff even across different types of costs. We model this as a relative risk perception, which is a ratio comparing individuals’ subjective assessment of climate threat severity against their subjective assessment of economic burden from mitigation. This approach reflects how individuals psychologically weigh competing concerns when evaluating policy support, even when those concerns involve different types of costs and benefits.

2.2. Cultural Factors: Individualistic vs. Collectivistic

Culture encompasses patterns of thinking, feeling, and behavior arising from shared beliefs and value systems within human groups [61]. Extensive literature indicates that culture plays a crucial role in shaping individual attitudes and responses to climate change [62,63]. For instance, some climate opinion simulation models show that different cultures lead to different patterns in how people change their climate opinions and sustainable behaviors [32,64] and to different preferences for information sources [65].
We propose that individualistic and collectivistic cultures differ in the relative weight given to the different factors influencing their opinions about climate mitigation policy; specifically, in their reliance on experience of extreme events versus the opinions of others with whom they interact. In individualistic cultures, ties between people are loose [61]. People have personal goals that can outweigh collective ones because personal needs, rights, and contracts tend to be prioritized [66,67]. Thus, people in an individualistic culture may give more weight to information they observe themselves and less weight to the opinions of others. In contrast, a collectivistic culture is a society in which people are integrated into strong, cohesive and loyal in-groups from birth onwards [61]. People in a collectivistic culture tend to align their personal goals with general social norms, obligations, and duties [66,67]. For this reason, people in collectivistic cultures may give relatively more weight to the opinions of others that they interact with, than to their personal observations.

2.3. Institutional Factors: Perceived Benefits and Costs of Climate Policy

Public policies influence the resources, incentives, and capacities of social groups [68,69,70], thereby influencing public opinion. We use ‘climate policies’ to refer to policies that support mitigation and adaptation efforts (e.g., renewable energy subsidies, carbon pricing, or infrastructure for low-carbon technologies). Conversely, we use ‘fossil fuel policies’ to refer to policies that maintain or expand reliance on fossil fuels (e.g., subsidies for fossil fuel production, tax breaks for extraction industries, or regulatory support for continued fossil fuel use). Individuals are more likely to support policies from which they directly benefit or that are aligned with their opinions and beliefs and are more likely to oppose policies that impose costs or are not aligned with their opinions and beliefs [71]. Recent research shows that policies that support the fossil fuel industry lead to slower adoption of renewable energy and weaker public support for climate initiatives [72]. On the other hand, removing support for the fossil fuel industry by, for instance, reducing fossil fuel subsidies, could align public incentives with climate goals, making mitigation policies more effective and potentially more palatable [73].
Introducing new climate-friendly policies often catalyzes new opinions and behaviors, creating reinforcing feedback loops that strengthen public support over time [74,75,76]. Examples include subsidies for electric vehicles [77], residential solar panels [78], and the introduction of bike lanes [79]. These dynamics are reinforced as changing public opinions and behaviors lead to increased demand for, or acceptance of, more stringent policies [33,52,79]. Therefore, changing the costs and benefits that people face by phasing out fossil fuel subsidies while implementing new climate mitigation policies is crucial for increasing public support.
We propose that the effectiveness of current climate and fossil fuel policies influences how stable membership is within opinion groups. For example, if a government enacts climate policies that successfully reduce climate risks while also removing fossil fuel subsidies, members of the group opposed to climate policies (‘opposition group’) may shift to a neutral or supportive stance more quickly, whereas members of the group supportive of climate policies (‘support group’) may remain committed to their opinion group for longer periods. Such shifts occur as individuals recognize and benefit from the broader advantages of climate policies such as cost savings, convenience, and personal preferences. In addition, policies that are consistent with a group’s beliefs act as a reinforcing feedback, strengthening the opinion group and making opinion change less likely and policies that are not aligned with a group’s beliefs can weaken opinions, facilitating change in opinion group membership.

2.4. Socio-Political Factors: Ideological and Affective Political Polarization

Individuals often sort themselves by ideology and group identities, aligning with their partisan attachments [80,81,82,83]. Strong partisan affiliation can lead to both ideological and affective polarization. Ideological polarization strengthens political opinions, leading to resistance to belief updating even with compelling evidence because of biased assimilation of information [84,85]. Affective polarization, conversely, fosters positive attitudes towards in-group members and negative attitudes toward out-group members, influencing social interactions. For instance, individuals in polarized societies are less likely to date, hire, or live with those from opposing parties [26,86,87].
We model ideological polarization as inertia in opinion change due to strong convictions, and affective polarization as increasing the likelihood of interacting with members of one’s own opinion group (often referred to as homophily). For example, in a society with high ideological and low affective polarization, individuals interact frequently with different opinion groups, yet persist in their beliefs for extended periods despite these interactions. By varying these two parameters, we can investigate how different types of polarization alter climate policy opinion dynamics.

3. Research Design and Methodology

3.1. System Dynamics Model

Our simulation model is intended to contribute to our understanding of the dynamics of changes in dominant opinion rather than to predict historical events or future outcomes. Our objective is to describe how different social systems affect the dynamics of public opinion about climate policy. We use a system dynamics model to examine the behavior of a social system over time, focusing on causal relationships between system components that result in interactions and feedback loops [88,89]. This approach allows us to explore the aggregate impacts of interacting individual, socio-political, policy, and cultural factors on climate opinion dynamics. Recent climate models have used a system dynamics approach to explore how individual risk perception [53], socio-political influences [90], introduction of environmental-friendly technology [52], and policy [30] can change individuals’ opinions and behaviors. We expand on existing climate opinion dynamics models by including both ideological and affective polarization in individualistic and collectivistic cultural contexts.

3.2. Basic Rules of Opinion Changes and Equations

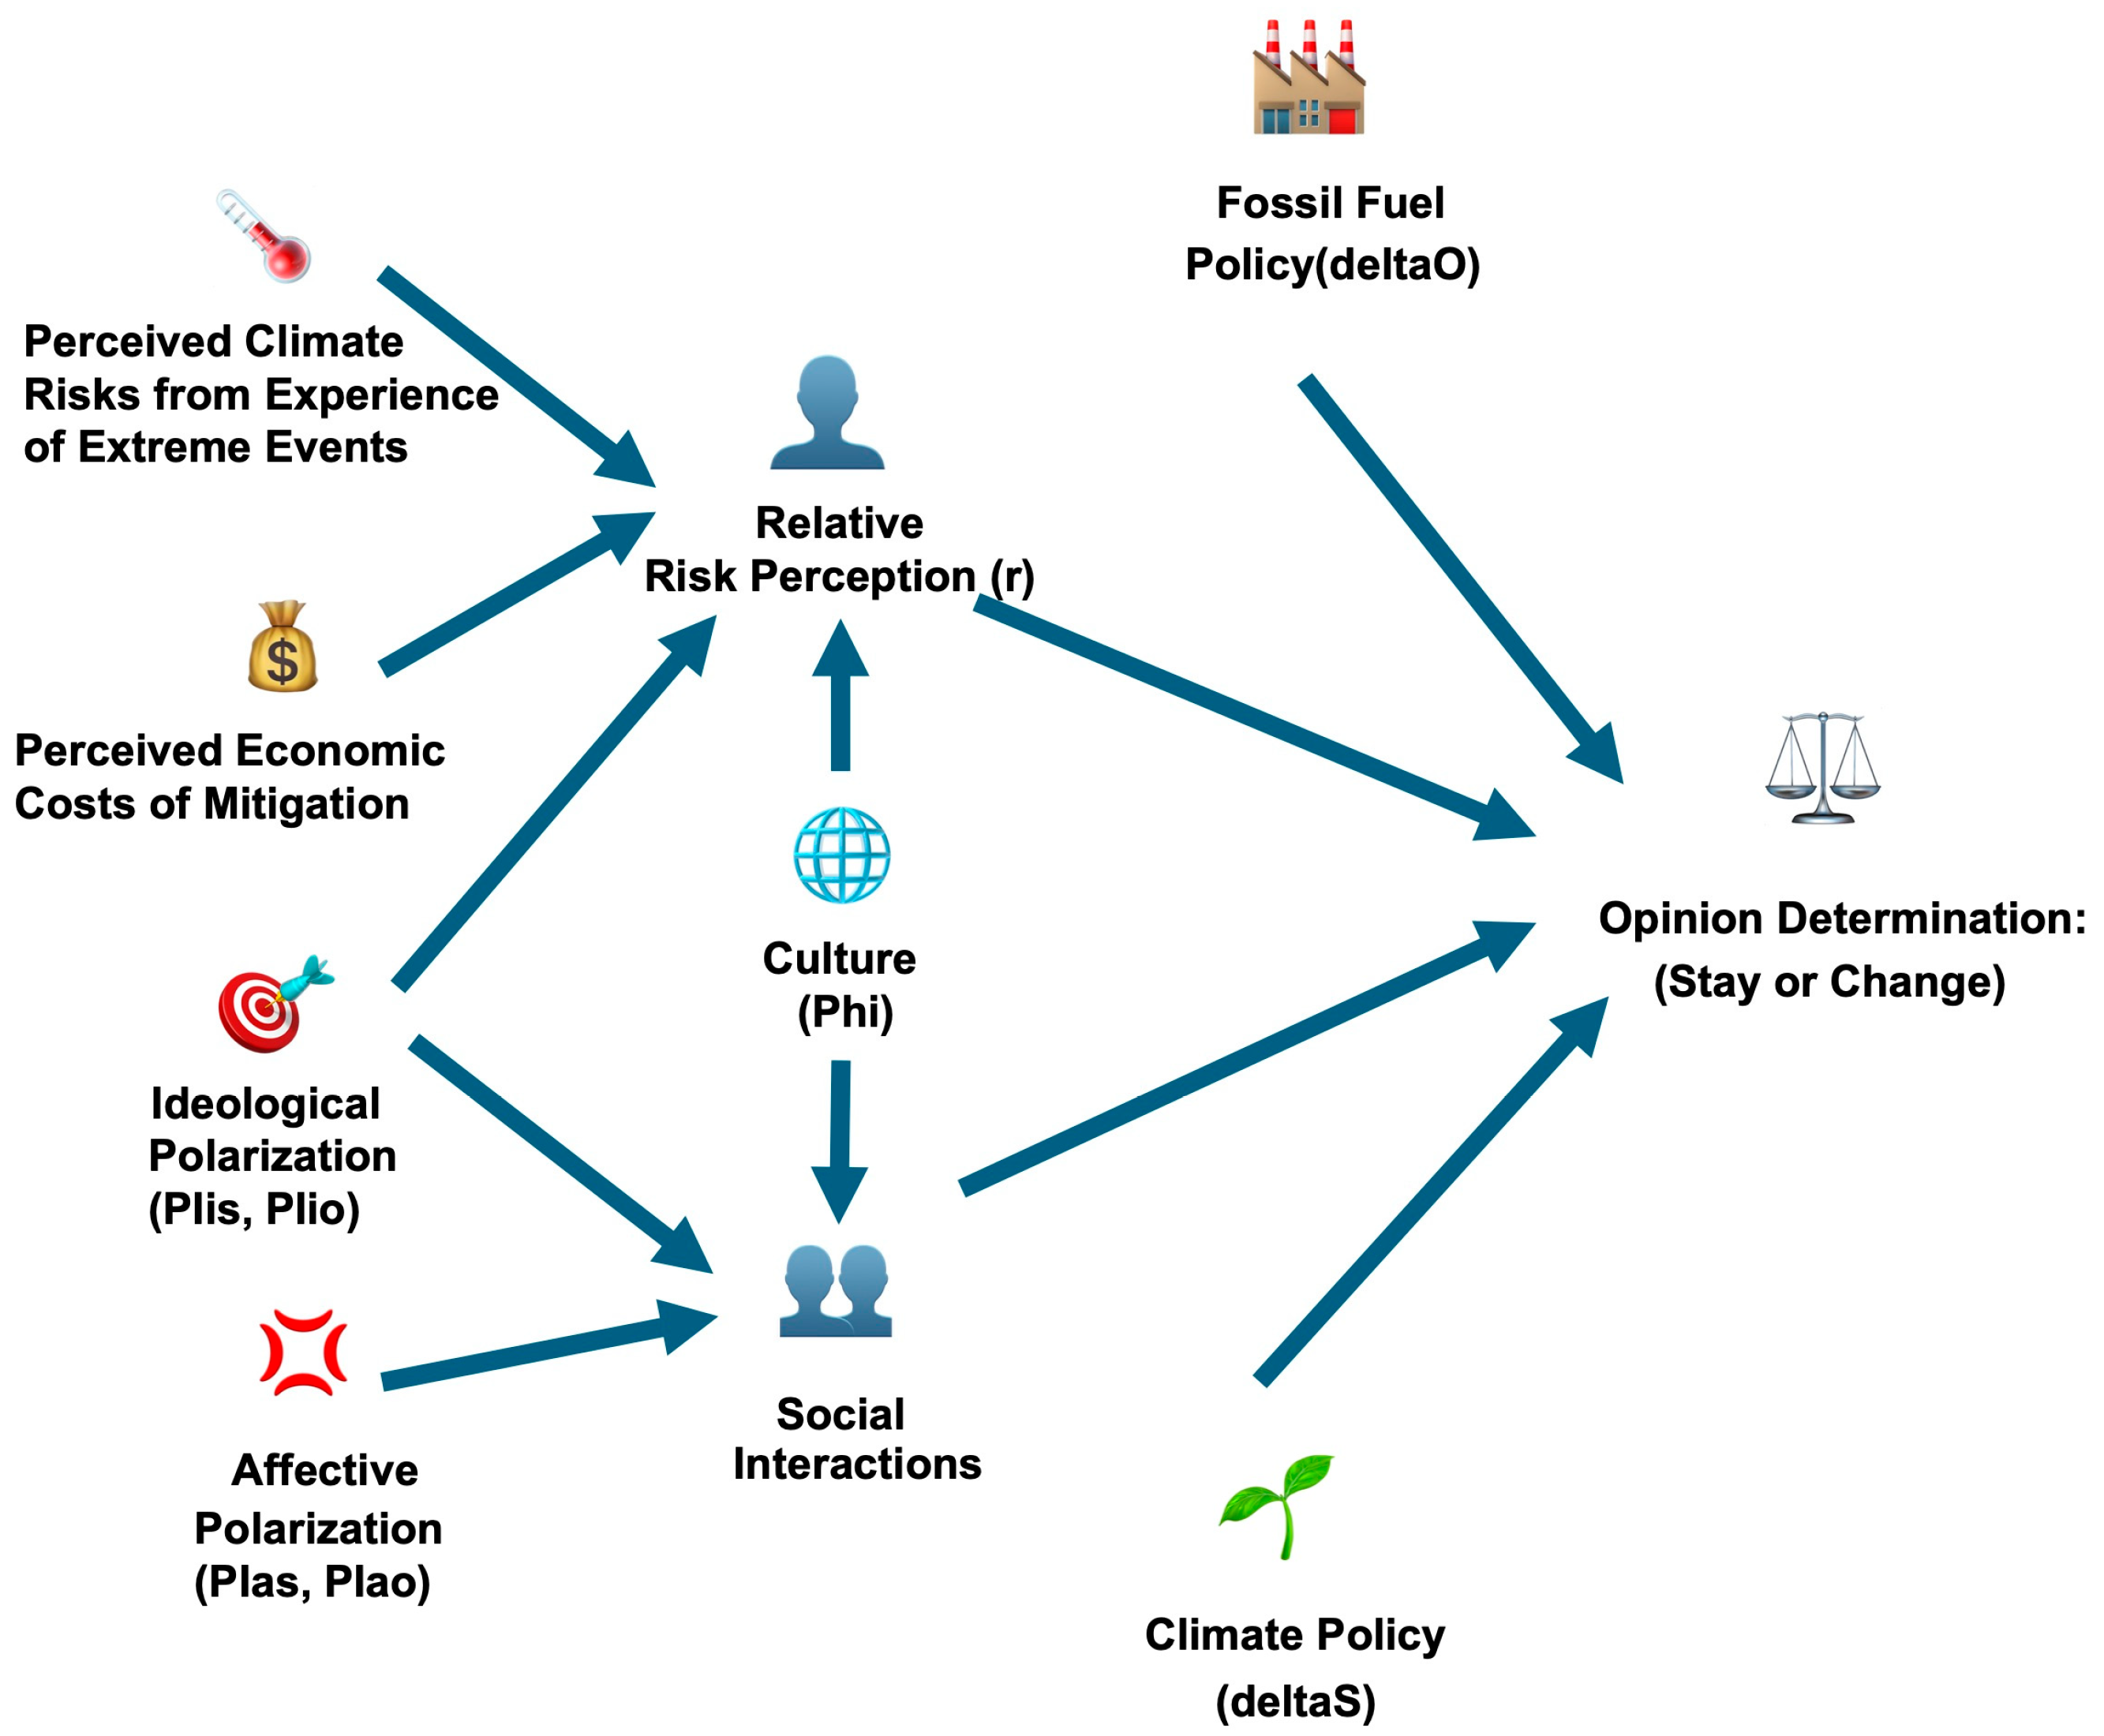
The model proposes that the two key factors driving changes in opinion about climate policy are (1) social interactions with others and (2) relative risk perception, which represents the perceived impact of personal experiences of climate-driven extreme events compared to the perceived economic costs of mitigation. This model has three opinion groups: supporters (Ns), opposers (No), and neutrals (Nn). The model assumes that there is no movement directly from support to opposition or vice versa. Supporters or opposers must first move to the neutral group, then from the neutral group to support or opposition. This constraint reflects the time people typically need to resolve cognitive dissonance before shifting to an opposing position [91]. We interpret the neutral state as representing the period of dissonance resolution.
The state variable for each opinion group is the fraction of the total fixed population of 1000 in each group. The model considers only two dynamic state variables: the fraction of supporters and the fraction of opposers. Because the total population is fixed, the size of the neutral group is determined by subtracting the sum of the opposition and support groups from 1000. Figure 1 illustrates how climate risk perception and social interactions influence opinion and is shaped by cultural values, socio-political polarizations, and policies. In Section 3.2.1 below we develop a model for opinion group dynamics that accounts for relative risk perception based on personal experiences. In Section 3.2.2 and Section 3.2.3 we develop a model that includes social interactions and policy effectiveness on opinion group dynamics. In Section 3.2.4 we combine these two models and include both personal experience and social interactions and it is this combined model we analyze in the subsequent sections.

3.2.1. Relative Risk Perception: Perceived Climate Risks and Perceived Economic Costs of Mitigation

Our model captures the tradeoff between perceived climate risks and perceived economic costs of mitigation through a relative risk perception parameter (r, dimensionless). This parameter is the ratio of perceived severity of climate impacts to perceived economic costs of mitigation from the neutral group’s perspective, because the neutral group serves as the intermediary for opinion shifts, with flows in and out of the neutral group determined by relative risk perception. Throughout this paper, we refer to the numerator of r as perceived climate risk and the denominator as perceived economic risk. When r is greater than 1, perceived climate risk is greater than the perceived economic risk of mitigation costs. When r is less than 1, perceived economic risk is greater than perceived climate risk.
The relative risk perception parameter affects the rates at which individuals change opinion groups. For the simplest model (and the one we employ here), r is fixed and constant, but more complicated models could allow r to vary over time to account for changing climatic or economic conditions. When r = 2, for instance, perceived climate risks are twice as severe as perceived economic costs, and opinion shifts more rapidly toward the support group. Specifically, individuals move from neutral to support more quickly, and from support to neutral more slowly (since 1/r = ½). Individuals also move from neutral to opposition more slowly, and from opposition to neutral more quickly.
Ideological polarization of support (PIis, dimensionless) and opposition (PIio, dimensionless) groups biases their perceived climate risks by altering their perception of climate impacts and mitigation costs. Even if the relative risk perception is 1, the support group tends to perceive climate risks as more severe than the mitigation costs, whereas the opposition group tends to view mitigation costs as more severe than climate risks, due to biased assimilation. Thus, the support group’s perception of the mitigation costs compared to climate risks (1/r) is discounted by its polarization level: (1/r) × (1 – PIis). Similarly, the opposition group’s perception of climate risks compared to the mitigation costs is discounted by its polarization level: r × (1 – PIio).
This model assumes that a fraction of the population is amenable to opinion change per unit time, given perceived experience of extreme climate events and mitigation costs (Rho, unit: 1/time). However, ideological polarization within the support and opposition groups also modifies the rate at which their members can change. If the ideological polarization for the support group (PIis) is high, individuals are more likely to keep their current opinions. Thus, high ideological polarization slows the rate at which people move from support to neutral by a factor of Rho × (1 – PIis). Similarly, if the ideological polarization for the opposition group (PIio) is high, this slows the rate at which individuals move from opposition to neutral by a factor of Rho × (1 – PIio) (See equations below).
Table 1 summarizes all parameters used in relative risk perception. The underlying model for impacts of personal experience is a linear set of two ordinary differential equations with constant perceived risk from climate impacts and mitigation costs. The model has a single globally stable equilibrium with all solutions going to that equilibrium independent of initial conditions.
dNs/dt = (1) Flow into Support from Neutral due to greater concern about the impact of climate-related extreme events compared to mitigation cost − (2) Flow out from Support to Neutral due to greater concern about mitigation cost compared to climate-related extreme events
= (1) r × Rho x (1 − Ns − No) − (2) (1/r) × (1 − PIis) × Rho × (1 − PIis) × Ns
dNo/dt = (3) Flow into Opposition from Neutral due to greater concern about mitigation cost compared to extreme events − (4) Flow out from Opposition to Neutral due to greater concern about extreme events compared to mitigation cost
= (3) (1/r) × Rho × (1 − Ns − No) − (4) r × (1 − PIio) × Rho × (1 − PIio) × No

3.2.2. Social Interactions

Our model assumes that increased interactions between individuals in different opinion groups lead to more rapid transitions in individuals’ opinions. A larger proportion of individuals in one group will generally cause individuals from the other groups to shift towards the larger opinion group. There are five independent parameters in the social-interaction model: Beta, PIis, PIio, PIas, and PIao. Beta represents the fraction of interactions that, in a well-mixed society without polarization, would lead someone to change their current opinion based on social interactions. We assume the fraction of interactions which lead to opinion change can be reduced through two processes. First, strong ideological polarization (PIis and PIio) reinforces individuals’ adherence to existing opinions, driving persistent retention of preexisting opinions even after direct exposure to opposing arguments from a group with different opinions. Second, strong affective polarization within support (PIas) and opposition (PIao) groups will result in homophily, reducing the number of people with differing opinions that one encounters. If affective polarization is high and ideological polarization is low, then groups will interact less frequently but may still change their opinions due to these interactions. If ideological polarization is high and affective polarization is low, there will be many interactions with members outside their group, which may also be enough to overcome their strong opinions.
To provide a more precise example, if the support group exhibits both strong ideological and affective polarization, this group is: (1) less likely to change their opinion due to strong opinions and (2) less likely to interact with individuals in the opposition group thus reducing exposure to differing opinions: Beta × (1 − PIis) × (1 − PIas). Since interactions are mutual, if the opposition group also has strong affective polarization, the likelihood of the support group interacting with the opposition group decreases even further. Thus, the total rate at which the support group changes opinion after interactions with the opposition group is No × Beta × (1 − PIis) × (1 − PIas) × (1 − PIao) × Ns. Table 2 summarizes all parameters applied in social interactions.

3.2.3. Policy Effectiveness

The parameters deltaS and deltaO represent the effectiveness of current policies in maintaining opinion group membership. DeltaS reflects benefits from climate policies (e.g., renewable energy incentives), which encourage supporters to maintain their position, while deltaO reflects benefits from fossil fuel policies (e.g., industry subsidies), which encourage opponents to maintain their position. These two parameters are a determinant of the time frame in which individuals leave their opinion group, independent of other factors in the model. Larger values for deltaS and deltaO suggest less movement between groups. For example, climate policy encourages climate supporters to stay in the supporter opinion group longer (larger deltaS), while the phasing-out of the fossil fuel policy could encourage those in the climate opposition group to shift toward a neutral stance (smaller deltaO). Table 2 summarizes the parameters used to capture policy effectiveness. The underlying model for impacts of social interactions and policy effectiveness is a non-linear (quadratic) set of two ordinary differential equations.
dNs/dt = (5) Flow into Support from Neutral due to the interactions with the Support group − (6) Flow out from Support to Neutral due to social interactions with the Opposition group − (7) Support’s flow rate based on the effectiveness of climate policy
= (5) (1 − Ns − No) × Beta × Ns − (6) (1 − PIis) × No × Beta × (1 − PIas) × (1 − PIao) × Ns − (7) Ns/deltaS
dNo/dt = (8) Flow into Opposition from Neutral due to the interactions with the Opposition group − (9) Flow out from Opposition to Neutral due to the interactions with the Support group – (10) Opposition’s flow rate based on the effectiveness of fossil fuel policy
= (8) (1 − Ns − No) × Beta × No − (9) (1 − PIio) × Ns × Beta × (1 − PIas) × (1 − PIao) × No − (10) No/deltaO
This model of social interactions and policy effectiveness has several locally stable equilibria. None of the stable equilibria have both opinion groups present. In some equilibria, all individuals are either in the support group or the opposition group with a long-term solution depending upon initial conditions specified by a separatrix (a curve that goes from the origin through an unstable equilibrium). For other parameter values, a locally stable equilibrium arises in which the neutral group remains along with either the support group or the opposition group. In other words, the support or opposition opinion group has a size less than the total population size P and the remaining population is in the neutral opinion group. In this situation, which group disappears and which remains present depends upon initial conditions.

3.2.4. Combined Model

In the combined model integrating the relative risk perception and social interactions, we use Phi to represent cultural influences. The parameter Phi, ranging between 0 and 1, determines the relative weight given to relative risk perception versus social interactions that affects movement into and out of each opinion group. Phi close to 1 indicates that the decision is mostly based on experience-based relative risk perception, capturing a highly individualistic culture. Phi close to 0 indicates that the decision is mostly based on social interactions, capturing a collective culture. Thus, the weight of social interactions is 1 − Phi.
Figure 2 illustrates the integrated framework combining culturally weighted relative risk perceptions and social interactions. This combined model has a somewhat more complex set of dynamics than either of the models with relative risk perception or social interactions alone, in that there can be, depending upon parameters, equilibria in which both support and opposition groups are present, and equilibria in which only a single opinion group is present.
dNs/dt = Phi × (1) Flow into Support from Neutral due to higher concern about the impact of climate extreme events compared to climate mitigation cost − Phi × (2) Flow out from Support to Neutral due to higher concern about climate mitigation cost compared to the impact of climate extreme events + (1 − Phi) × (5) Flow into Support from Neutral due to the interactions with the support group − (1 − Phi) × (6) Flow out from Support to Neutral due to social interactions with the opposition group − (7) Support’s flow rate based on the effectiveness of climate policy
= Phi × r × rho × (P − Ns − No) − Phi × (1/r) × (1 − PIis) × rho × (1 − PIis) × Ns + (1 − Phi) × (P − Ns − No) × Beta × Ns/P − (1–Phi) × (1 − PIis) × No × Beta × (1 − PIas) × (1 − PIao) × Ns/P − Ns/deltaS
dNo/dt = Phi × (3) Flow into Opposition from Neutral due to higher concern about the impact of climate extreme events compared to climate mitigation cost − Phi × (4) Flow out from Opposition to Neutral due to higher concern about the impact of climate extreme events compared to climate mitigation cost + (1 − Phi) × (8) Flow into Opposition from Neutral due to the interactions with the opposition group − (1 − Phi) × (9) Flow out from Opposition to Neutral due to the interactions with the support group − (10) Opposition’s flow rate based on the effectiveness of fossil fuel policy
= Phi × (1/r) × Rho × (1 − Ns − No) − Phi × r × (1 − PIio) × Rho × (1 − PIio) × No + (1 − PIio) × (1 − Ns − No) × Beta × No − (1 − PIio) × Ns × Beta × (1 − PIas) × (1 − PIao) × No − No/deltaO

3.3. Methods

The combined model was simulated using the system dynamics modeling tool Stella (Stella Architect, version 4.0, isee systems). System dynamics models provide an integrative, mathematical framework to capture interactions and feedback loops among various processes. They can link micro-level processes to macro-level phenomena [35,36]. Our model explores the dynamics of the climate opinion groups arising from different sets of parameters. We estimated the values for cultural (Phi), ideological (PIis, PIio), and affective polarization (PIas, PIao) parameters using data from the World Population Review [92], the Edelman Trust Barometer [93], and Boxell et al. [94]. We synthesized these data and associated parameters into a unified analytical graph (Appendix A.) to visualize cross-country variations. We describe in detail how we operationalize the different indices and integrate them into a single graph in Appendix A. We created scenarios for the relative risk perception ratio (r) and policy effectiveness parameters (deltaS, deltaO) choosing these as fixed in any single scenario for analysis, with different distributions of the initial population fraction in each opinion group.
We conducted sensitivity analyses in Stella on the total of eight parameters over 20 years for twelve scenarios. Sensitivity analysis is a method used to understand how variations in input parameters affect model outcomes. It involves systematically adjusting key model components—in this case, the eight parameters—to observe how much the results change. This helps identify which parameters have the most influence on the likelihood of a switch in the dominant group (defined as containing the highest fraction of the population of any opinion group), whether it be the support group or the opposition group, in a 20-year time frame.
We used our sensitivity analysis results to carry out classification decision tree analysis. Classification decision tree analysis is a useful method for predicting certain outcomes based on a set of predictors, especially when the relationship between predictors and the response is non-linear. This method helps identify which parameters are most critical in leading a support or opposition group to become or remain dominant when a climate opposition or support group is initially dominant.
To perform a decision tree analysis, we first convert the sensitivity results into categories. We categorized Phi values (creating a new categorical parameter, Cphi), with 0.1–0.3 as ‘collectivistic’, 0.4–0.6 as ‘mixed’, and 0.7–0.9 as ‘individualistic’. Similarly, PIis, PIio, PIas, and PIao, values were grouped into categories with 0.1 and 0.3 as ‘Low’, 0.4 to 0.6 as ‘Medium’, and 0.7 to 0.9 as ‘High’, yielding the new categorical CPIis, CPIio, CPIas, and CPIao parameters. We used categorial values of Phi to clearly delineate the cultural orientations. We then created a new categorical outcome variable indicating whether the support or opposition group becomes the dominant group after 20 years, even if they were not dominant initially. For example, if the support group’s population exceeds both the opposition and neutral groups after 20 years, starting with an initial distribution of 35% support, 40% opposition, and 25% neutral, the variable is coded as ‘Ns.’ If either the neutral or opposition group’s population exceeds both the support and the other group, it is coded as ‘Nn or No,’ respectively. Likewise, if the initial condition is 40% support, 35% opposition, and 25% neutral, and the opposition group exceeds both the support and neutral groups after 20 years, the outcome is coded as ‘No’. Otherwise, the outcome is coded as ‘Nn or Ns’.
We used R (R version 4.5.1; packages: rpart version 4.1.24) to create classification decision trees for each initial condition scenario. We simplified the initial classification trees generated from our simulation results by tuning the parameter “cp” (the complexity parameter). This parameter prunes the size of the tree so that the tree splits that remain are meaningful in terms of a given error tolerance and avoids overfitting the data [95].

4. Analysis Scenarios and Results

4.1. Analysis Scenarios

We consider two different initial conditions: first, a society in which the climate opposition group is marginally dominant, such as some Eastern European countries like Poland and Romania [96], Turkey [97], and Iran [98]. In this scenario, we set the climate support group at 35%, climate opposition group at 40%, and neutral group at 25% of the population as the initial condition for the simulations. As a second initial condition, we considered a society in which the climate support group is marginally dominant, such as in the U.S, Western European countries, and Eastern Asia countries [99]. In this scenario, we set the support group at 40% of the population, while climate opposition and neutral groups comprised 35% and 25%, respectively, as the initial condition for the simulations.
Each initial condition is considered across three different scenarios:
(a)
Scenario 1. Individuals in the neutral group perceive the severity of climate impacts as equal to perceived economic costs of mitigation (r = 1), with no differential effectiveness of climate and fossil fuel policies (deltaS = deltaO = 3).
(b)
Scenario 2. Individuals in the neutral group perceive either the severity of climate impacts or economic costs of mitigation as higher (r varies across 0.25, 0.3, 0.5, 2, 3, 4), with no differential effectiveness of climate and fossil fuel policies (deltaS = deltaO = 3).
(c)
Scenario 3. Individuals in the neutral group perceive either the severity of climate impacts or the economic costs of mitigation as higher (r varies across 0.25, 0.3, 0.5, 2, 3, 4), and the effectiveness of current climate and fossil fuel policies affects opinion group stability, with policy effectiveness mediating the time individuals spend in their respective opinion groups (deltaS and deltaO vary between 2, 3, 4).
In each scenario, we apply different combinations of cultural influence (Phi), ideological polarization (PIis, PIio), and affective polarization (PIas, PIao).

4.2. Analysis Results

We compare the decision tree analysis results between two different initial conditions (one with support at 35% and opposition at 40%, and the other with support at 40% and opposition at 35%) across three different scenarios.
(a)
Scenario 1. The sensitivity analysis of both initial conditions for this first scenario indicates that, out of 3125 cases, there were no instances in which a dominant group changed within the next 20 years. In other words, ideological and affective polarization did not influence the switch of the dominant climate opinion group in either individualistic or collectivistic countries.
(b)
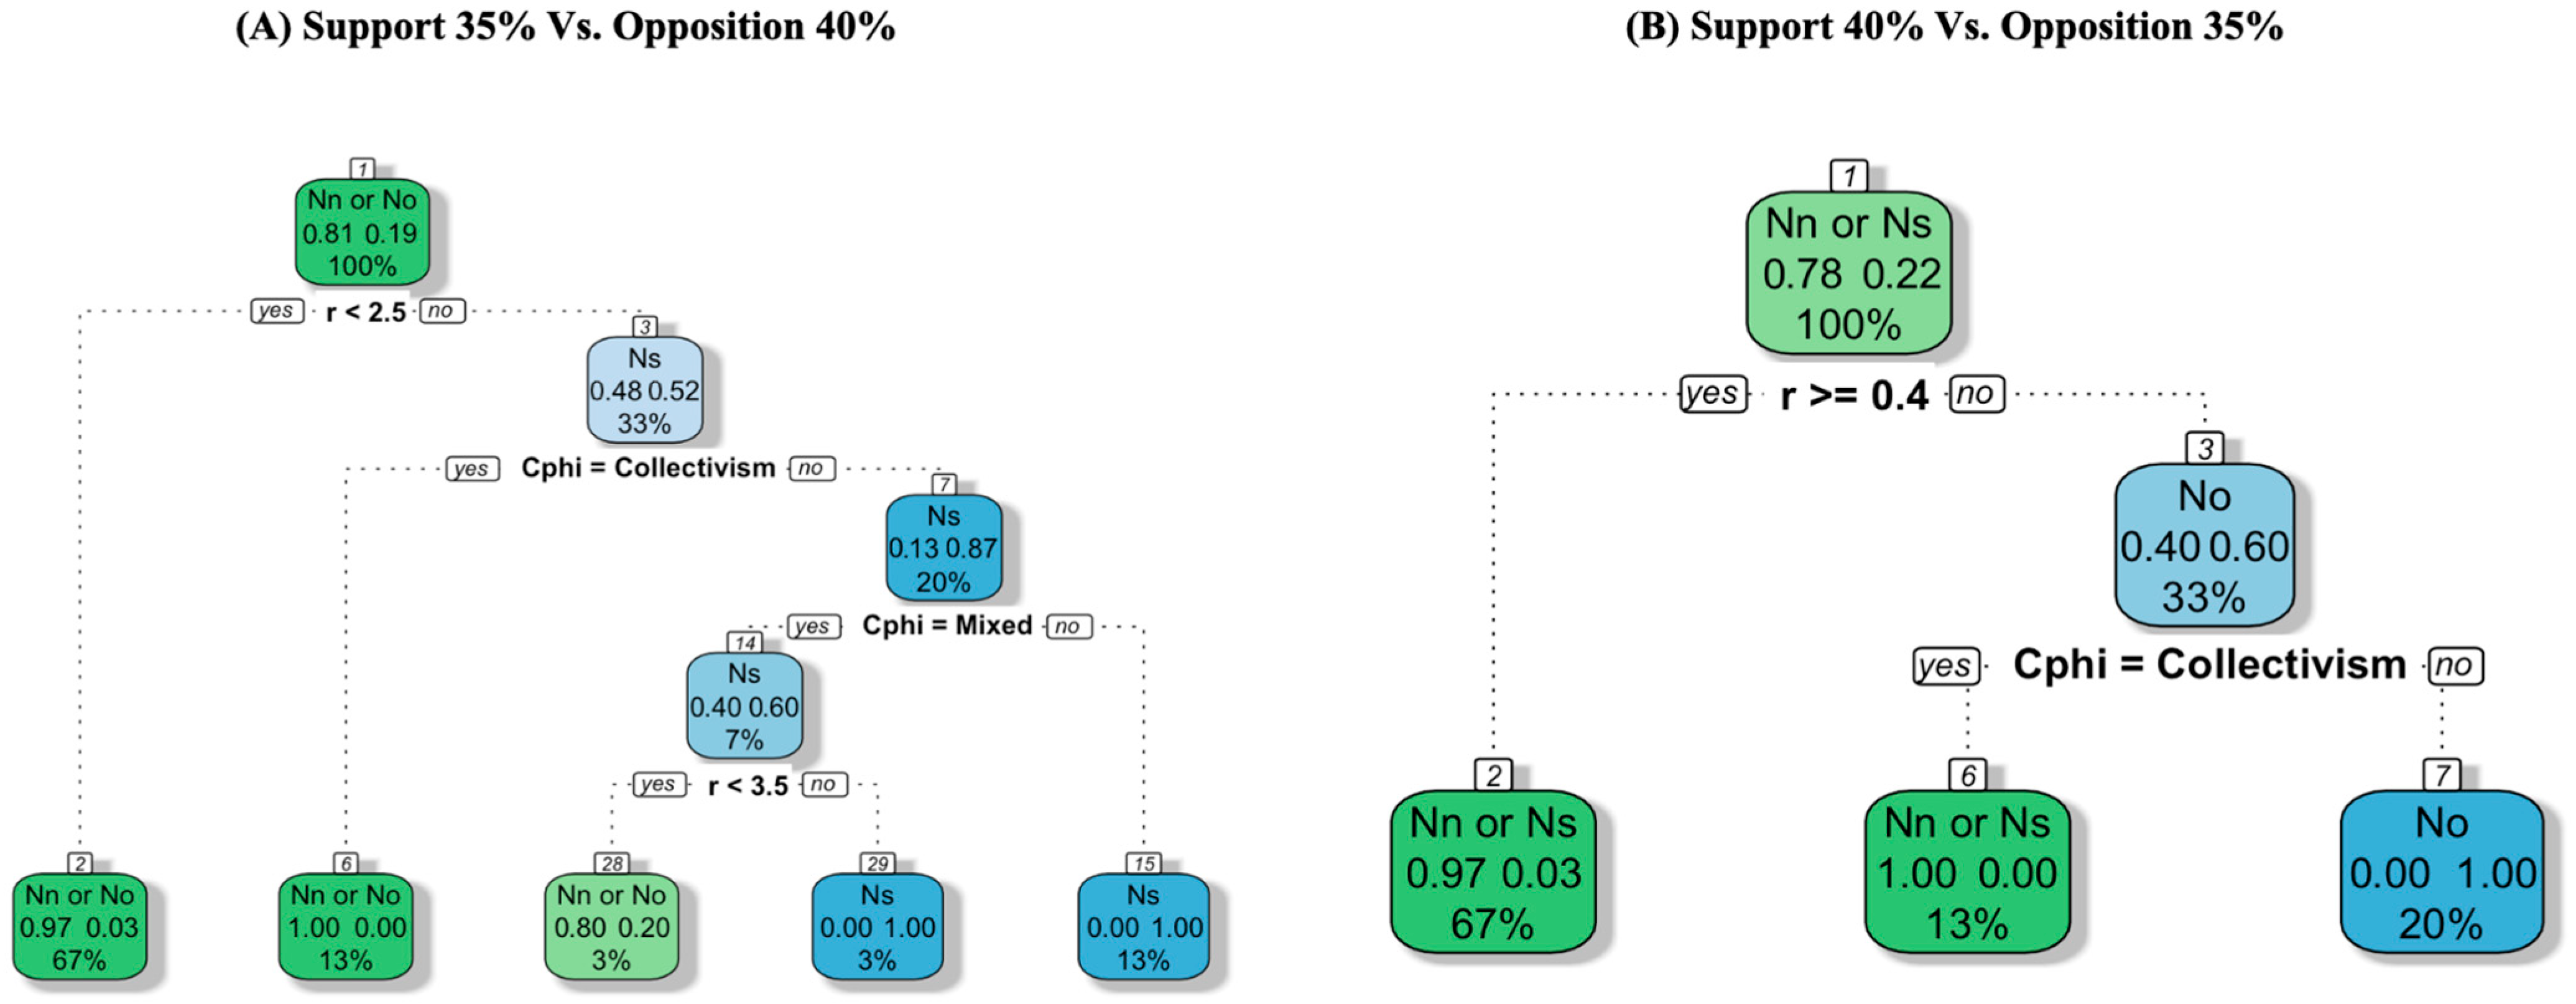
Scenario 2. The sensitivity analysis shows that when the opposition opinion is initially larger, 19.3% of model runs (3626 out of 18,750) resulted in the support group becoming dominant within the next 20 years. When the support opinion is initially larger, 22.0% of model runs (4125 out of 18,750) resulted in the opposition group becoming dominant within the next 20 years. The decision tree analysis for this scenario is in Figure 3.
The classification decision tree results for both initial conditions (Figure 3) show that the relative risk perception (r) of perceived climate risk versus perceived economic costs of mitigation and the culture (Cphi) are the most important factors in determining the dominant opinion group after 20 years. With higher initial levels of the opposition group (Figure 3A) there are two cases in which the support group can become dominant: (i) if individuals in the neutral group perceive climate risk as more than 2.5 times as severe as the economic costs of mitigation (i.e., r ≥ 2.5) and live in an individualistic culture, or (ii) if r ≥ 3.5 and culture is mixed individualistic-collectivistic. In contrast, with higher initial levels of the support group (Figure 3B), there is only one case in which the opposition group can become dominant: if individuals in the neutral group perceive economic costs of mitigation as more than 2.5 times as severe as climate risk (i.e., r < 0.4) and live in an individualistic or mixed culture.
These pathways reveal that the conditions for dominant opinion shifts are culturally dependent and that shifts in dominant opinion are difficult in collectivistic cultures. When opposition initially dominates, support can only become dominant under relatively strong perceived climate risk (r ≥ 2.5) in an individualistic culture, or with even stronger perceived climate risk (r ≥ 3.5) in mixed cultures. Conversely, when support initially dominates, opposition can become dominant only under strong perceived economic costs of mitigation (r < 0.4) in individualistic or mixed cultures. Collectivistic cultures showed no pathways to changes in dominance within the parameter ranges examined.
(c)
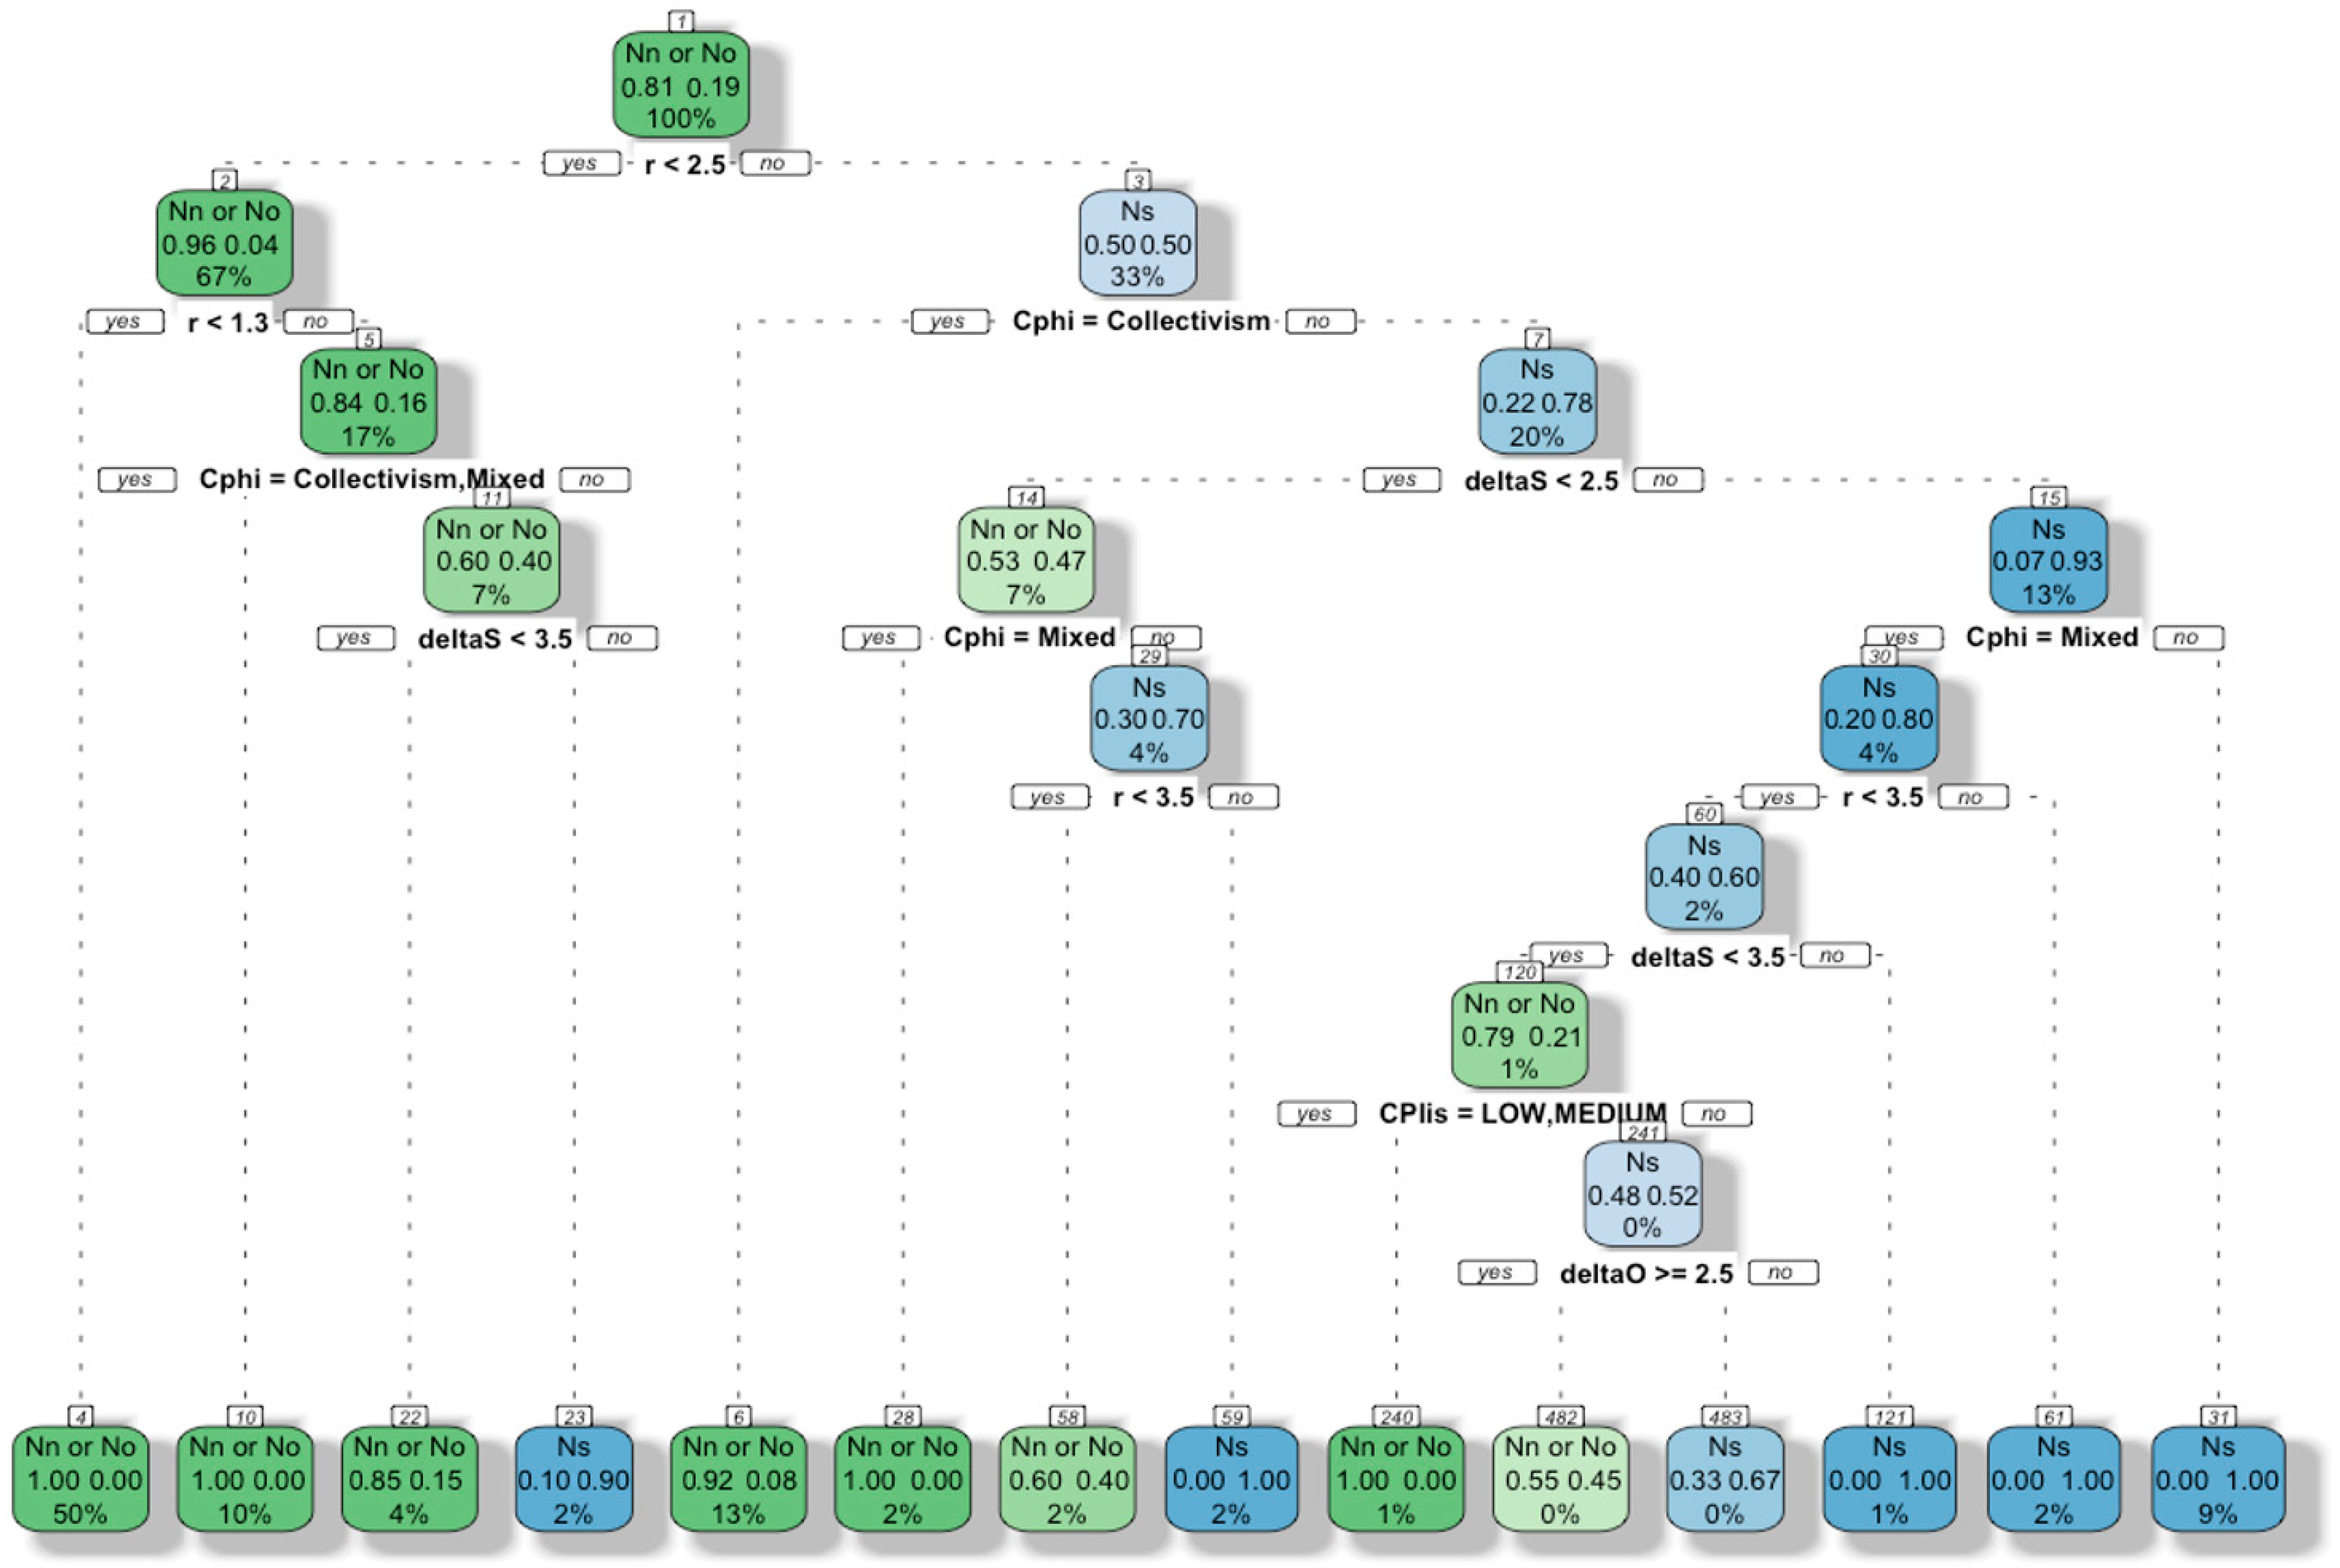
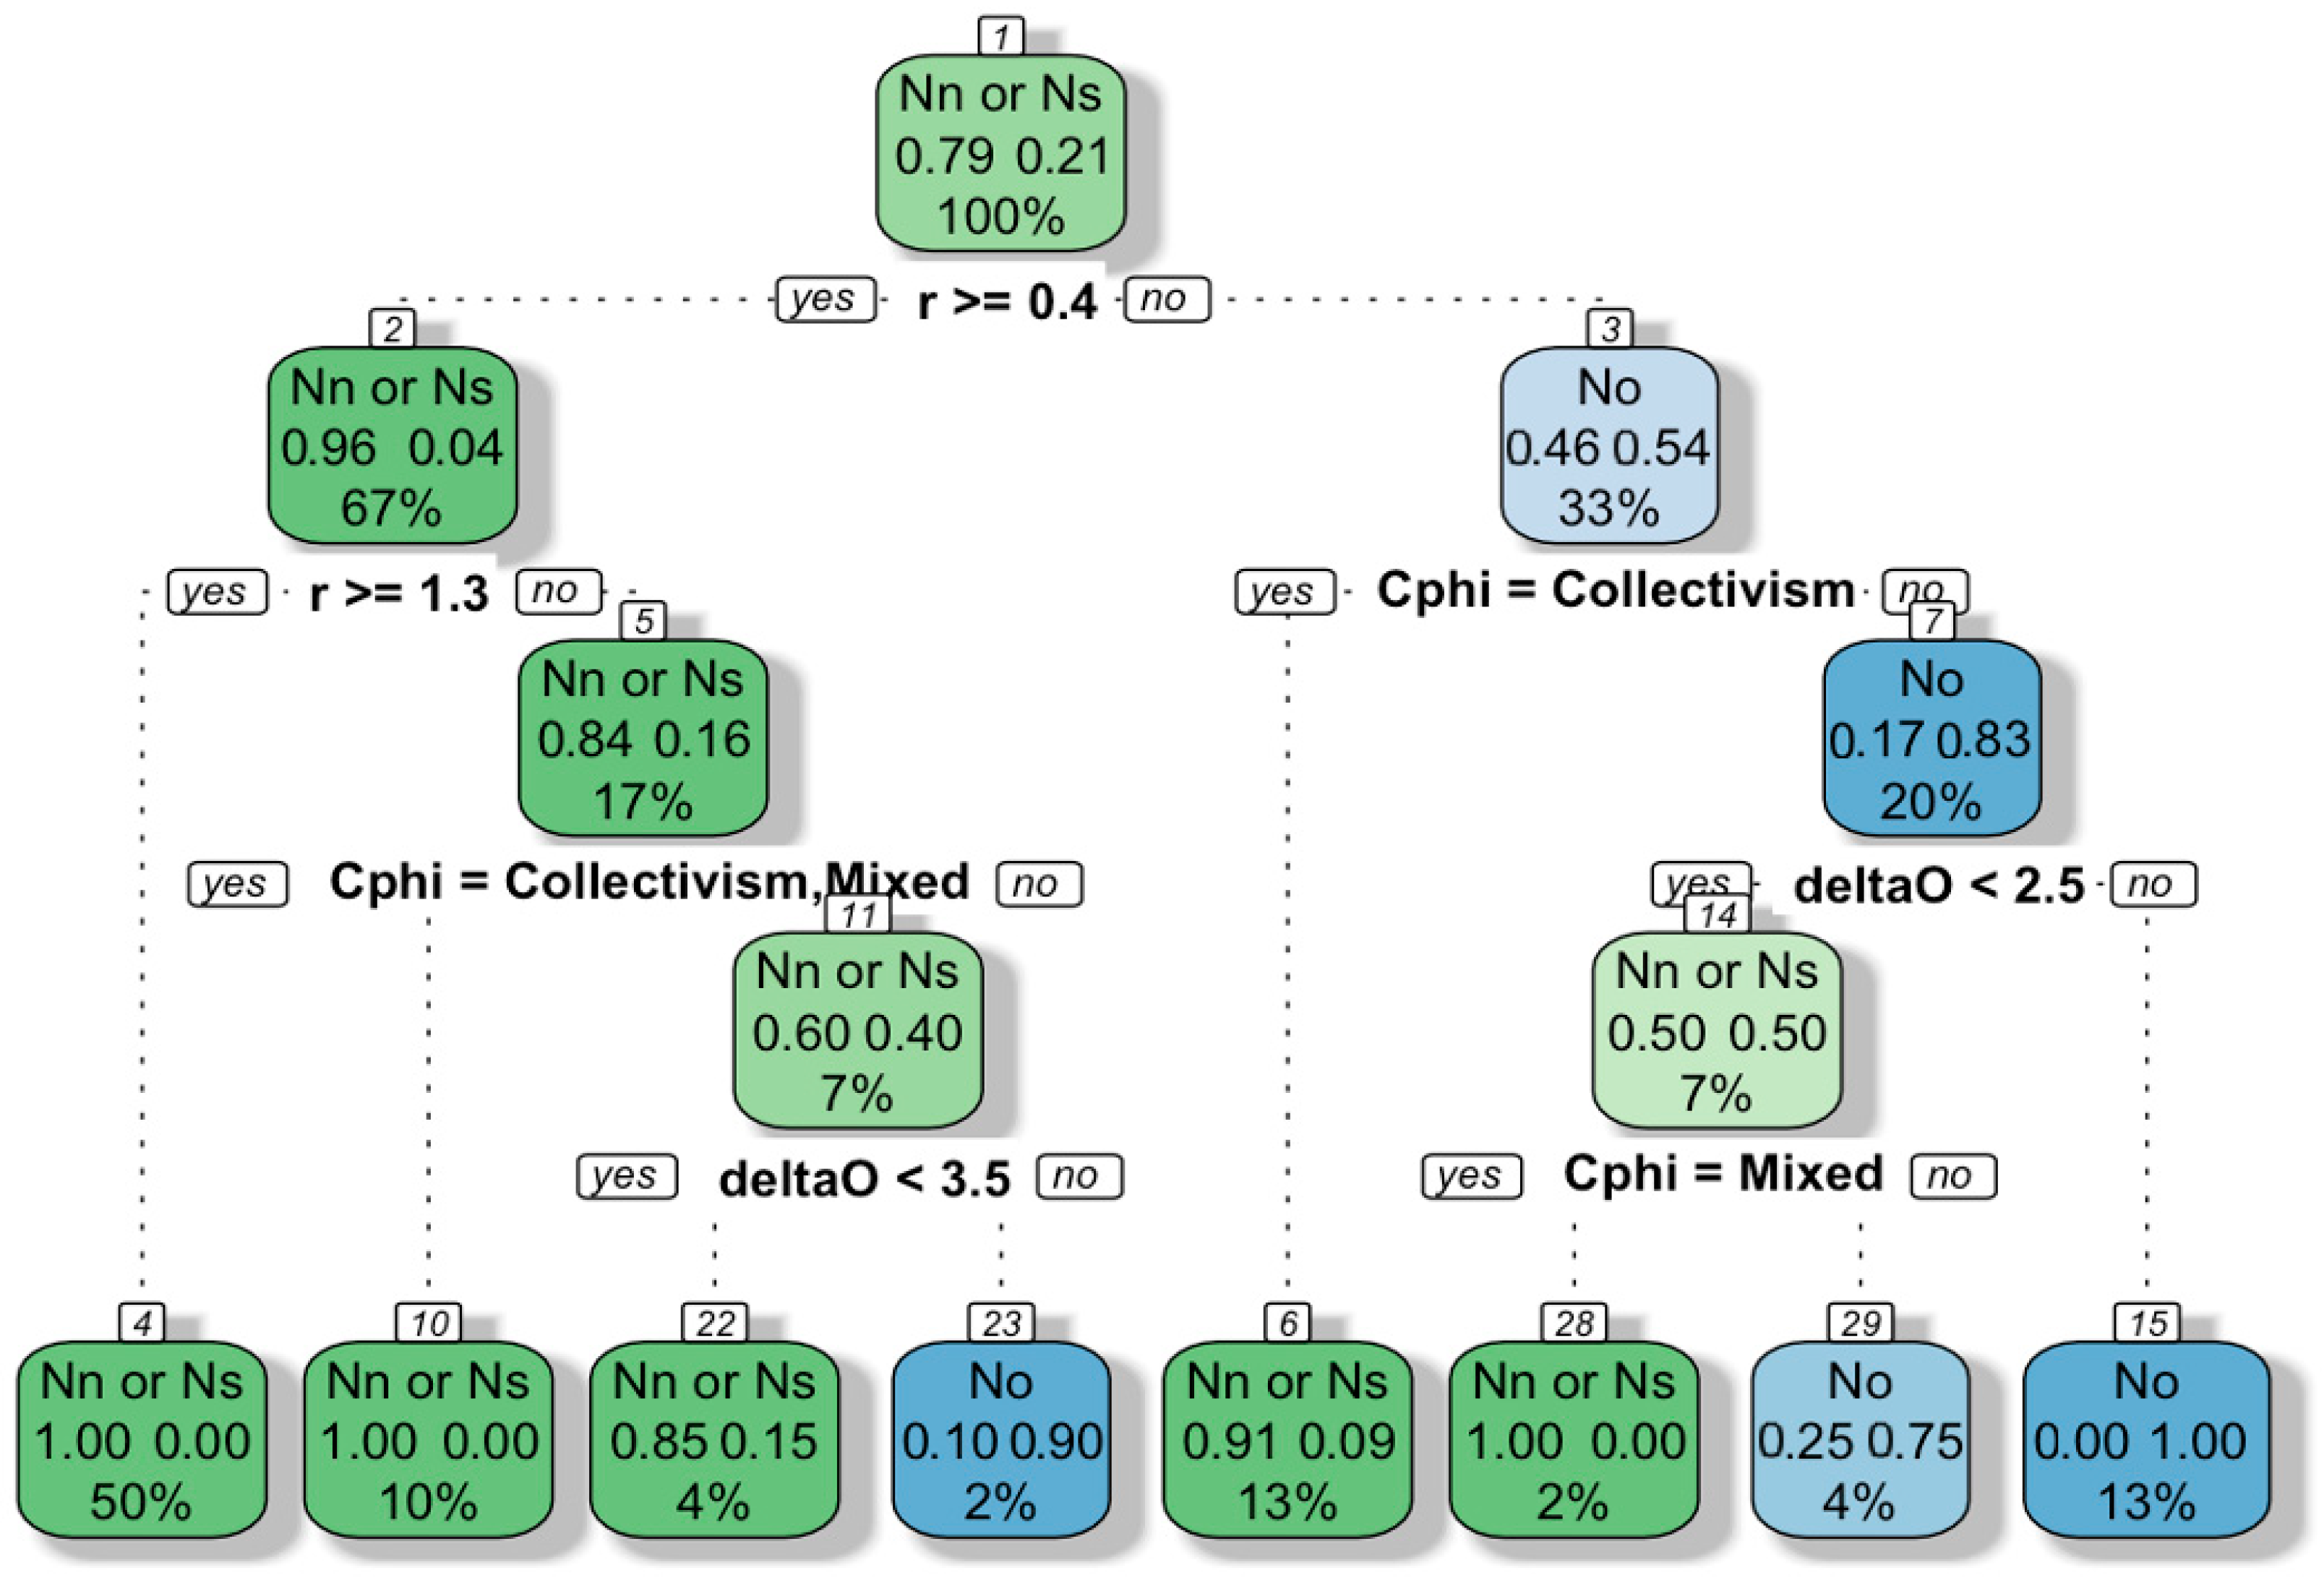
Scenario 3. The sensitivity analysis shows that when the opposition opinion is initially larger, 19.3% of model runs (32,643 out of 168,750) resulted in the support group becoming dominant within the next 20 years. When the support group is initially larger, 20.1% of model runs (34,740 out of 168,750) resulted in the opposition group becoming dominant within the next 20 years. The decision tree analysis for this scenario is in Figure 4 and Figure 5.
The classification decision tree results for the scenario 3 conditions with opposition initially dominant (Figure 4), show that the relative risk perception, the culture (Cphi) and the effectiveness of climate policies (deltaS) are the most important factors in determining whether the support group becomes dominant within 20 years. There are four cases in which the support group can become dominant: (i) if the relative risk perception r is ≥ 2.5, and the culture is individualistic, with an effective climate policy that retain supporters (deltaS ≥ 2.5); (ii) if the relative risk perception r is ≥3.5, and the culture is mixed with a relatively effective climate policy that retains supporters (deltaS ≥ 2.5); (iii) if the relative risk perception r ≥ 3.5 and culture is individualistic; or (iv) if the relative risk perception r is in the range 1.3 ≤ r < 2.5, and culture is individualistic with highly effective climate policies that retain supporters (deltaS ≥ 3.5).
These pathways reveal that the conditions for dominant opinion shifts are still culturally dependent and that shifts in dominant opinion are difficult in collectivistic cultures. When opposition initially dominates, support can only become dominant under relatively high relative risk perceptions (r ≥ 2.5) in an individualistic culture, or with even higher relative risk perceptions (r ≥ 3.5) in mixed cultures. However, the effectiveness of climate policy helps the support group to be dominant when the relative risk perception is relatively moderate (1.3 ≤ r < 2.5) in an individualistic culture. Collectivistic cultures show no pathways to changes in dominance within the parameter ranges examined.
The classification decision tree results for the scenario 3 conditions with support initially dominant indicates three pathways by which the opposition group becomes dominant (Figure 5). Two of these (rightmost nodes in Figure 5) occur when individuals perceive economic costs of mitigation as more than 2.5 times greater than the severity of climate impacts (r < 0.4) and live in an individualistic or mixed society. When fossil fuel policies are effective (deltaO > 2.5, 13% of simulations), the opposition group consistently achieves dominance (100% of simulations). When fossil fuel policies are less effective (deltaO < 2.5, 4% of simulations), the opposition group still becomes dominant in most cases (about 75% of simulations on that branch), but this outcome is restricted to individualistic societies.
The third pathway for opposition-group dominance (2% of simulations) occurs when the perceived economic cost of mitigation is slightly higher than perceived severity of climate impacts (0.4 ≤ r < 1.3), the culture is individualistic, and fossil fuel policies are very effective (deltaO ≥ 3.5). Under these conditions, the opposition group becomes dominant in the majority of the simulations (90% of simulations on this branch).

5. Discussion

Our study examines the impact of psychological, social, cultural and institutional factors on shifts in the dominant public opinion regarding climate policy over a time period of 20 years. We find that shifts in dominant opinion are relatively rare, especially without high levels of perceived climate risk (relative to economic risk) or effective policies. Even when perceived climate risks outweigh perceived economic risk and policies are effective (for the initially subdominant group), only 20% of model runs result in changes in opinion dominance. This aligns with Druckman and Leeper’s [100] observation that public opinion remains stable over time without strong external drivers.
We also find that psychological factors and policy can influence opinion dynamics differently across cultural contexts. Table 3 provides a summary of the likelihood of changes in opinion dominance based on a large number of simulations starting from different initial conditions. In our simulations, cultural values, experiences with climate change, and policy effectiveness can shift dominant opinions. Mixed cultures require a stronger ratio of perceived climate risks compared to perceived economic costs of mitigation (r ≥ 3.5) and higher policy effectiveness (deltaO or deltaS ≥ 3.5) to induce opinion changes than in individualistic cultures (r ≥ 2.5 and deltaO ≥ 3.5 or deltaS ≥ 3.5). In collectivistic cultures, dominant opinions remain stable within the simulated parameter ranges, as initial population distributions often establish social norms that resist change. The results echo real-world observations. For instance, Australia and France, which have strong individualistic cultures (Appendix A), have shown increased public support for climate mitigation policies alongside rising experiences of natural disasters [101]. In contrast, Indonesia, a strong collectivistic country (Appendix A), has not exhibited a corresponding increase in support despite heightened disaster exposure in recent years [102]. These divergent patterns may reflect distinct sociocultural or institutional mechanisms shaping public opinion, underscoring the need for context-specific analyses of climate policy dynamics. In particular, collectivistic cultures may require stronger interventions or more frequent events to overcome strong social norms, but once these are overcome, opinion change could happen rapidly.
The stability of dominant opinions in collectivistic cultures reflects a distinct opinion dynamic. While individualistic cultures exhibit gradual opinion shifts, collectivistic cultures often rapidly consolidate majority stances once minority support crosses a threshold [103]. In such contexts, dominant opinions function as social norms that in turn shape policy preferences more than individual risk assessments [104]. Illustrating this dynamic, India, with a strong collectivistic culture (Appendix A), experienced a swift surge in public support for climate mitigation policies following a prolonged period of stagnation—a shift coinciding with the government’s implementation of robust communication strategies and targeted policy interventions [102]. Our model provides insights into these dynamics and a framework for future studies to explore different patterns of shifting climate opinion across cultural contexts.
The impact of culture on opinion dynamics underscores the importance of tailoring interventions to the specific context to effectively increase public support for climate policy. For an individualistic culture, for example, increasing scientific literacy may enhance shifts in climate-related opinions. Building scientific literacy fosters the ability for individuals to critically evaluate climate-related information and relate it to personal experience and perceptions of climate risk [105,106]. Curricula in the U.S. depend heavily on local and state policies and politics [107]. In contrast, the European Union has introduced unified policies across member states to provide high-quality education and training focused on sustainability, climate change, environmental protection, and biodiversity, in addition to existing climate education programs such as Repair Cafés, biodiversity-focused Erasmus+ projects, and related initiatives [108].
For countries with mixed cultural orientations, increasing the immediate and visible benefits of climate mitigation policies could build public support, if they involve simultaneously phasing out policies subsidizing fossil fuels. However, phasing out these policies could be challenging due to strong opposition from the fossil fuel industry and other policy beneficiaries. Ultimately, cost reductions enabled by advances in technology, coupled with subsidies that foster economies of scale, may be required to achieve change in dominant opinion. For opposing industries, a staged approach to adopting greener technologies can help reorient them toward a sustainable society [109].
For collectivistic cultures, framing climate change as a public issue that centers on group-oriented concerns—and communicating both personal and community benefits of action—can expand support across the political spectrum. Furthermore, a solutions-oriented framing has been shown to be effective in mobilizing public participation and organizing collective efforts [110].
Perception of the severity of climate impacts relative to perception of the economic costs of mitigation play a significant role in shaping public opinion. However, these perceptions may be influenced by misinformation or oversimplified narratives in some contexts, contributing to the view that mitigation policies disproportionately harm economic interests [111]. In contrast, research shows that climate change could reduce global GDP by 5–15% by 2100 if unaddressed [112,113]. This highlights the potential benefits of education programs on the economic impacts of climate change, both globally and locally, to correct misperceptions and foster public support for collective climate action.
Interestingly, one result from our model analysis is that ideological and affective polarization have minimal influence on shifts in opinion dynamics at the time scale we are considering. Affective polarization (homophily) leads people to interact more with their own opinion group, and ideological polarization (entrenchment) makes opinion change more difficult. These factors tended to reinforce dominant opinion dynamics rather than leading to change.
This study is intended to identify patterns in how cultural, socio-political and psychological factors might influence how and when large shifts in climate public opinion happen using a simple model with a small set of key parameters. Since our model utilizes a limited set of social parameters and cultural contexts, our results do not fully capture opinion dynamics. Future research might incorporate further social factors (e.g., media influences and misinformation) and validate the qualitative behavior of the model using longitudinal surveys to achieve a more comprehensive understanding of the social system and its opinion dynamics. Additionally, our model treats perceived climate risk and perceived economic risk as static throughout the 20 years of the model. Our model also did not allow for feedback between the dominant opinion group and policy effectiveness. Future research could integrate this additional feedback, for example, linking our opinion dynamics model with climate and economic models to allow perceived climate and economic risks to be treated as dynamic parameters that evolve along with public opinion and policies. Ultimately, this framework could be integrated with a climate model to examine interactions between the human behavioral and biophysical climate systems to highlight the importance of dynamic feedback between these systems in mitigating climate change.
The dynamics of climate opinion as modeled here parallel those of other contested issues such as vaccination and masking in the epidemiological context of infectious disease. In this case, for example, relative risk perception might reflect the perceived benefits of vaccination (e.g., reduced likelihood and severity of infection) versus the perceived costs (e.g., adverse health effects, monetary expense). A critical difference between the epidemiological and climate cases, however, lies in the time scales and information flows that shape perceptions. Climate change and mitigation are slow processes characterized by substantial inertia, with individuals having little ability to directly influence outcomes. In contrast, infectious disease dynamics unfold much more rapidly, and individuals may have a greater sense of control over behaviors such as vaccination or masking that immediately alter their risk perceptions. The model we present here, however, is applicable to modeling opinion dynamics across a diverse set of processes, including both climate change and infectious disease.

Author Contributions

Conceptualization, Y.A.S., S.M.C., L.J.G., A.K., K.L. and B.B.; methodology, Y.A.S.; L.J.G., A.K. and B.B.; software, Y.A.S., L.J.G. and B.B.; validation, Y.A.S., L.J.G., A.K. and B.B.; formal analysis, Y.A.S., L.J.G. and B.B.; investigation, Y.A.S., L.J.G., A.K. and B.B.; resources, Y.A.S. and A.K.; data curation, Y.A.S., L.J.G. and B.B.; writing—original draft preparation, Y.A.S.; writing—review and editing, Y.A.S., S.M.C., L.J.G., A.K., K.L. and B.B.; visualization, Y.A.S. and K.L.; supervision, L.J.G., A.K. and B.B.; project administration, Y.A.S. and A.K.; funding acquisition, Y.A.S., S.M.C., K.L. and B.B. All authors have read and agreed to the published version of the manuscript.

Funding

Brian Beckage and Katherine Lacasse were supported by the National Science Foundation through Award #2436120. Sara M. Constantino was supported by the National Science Foundation through Award #2049796. Yoon Ah Shin was supported by the Julie Ann Wrigley Global Futures Laboratory and the New Carbon Economy Consortium.

Acknowledgments

We used Claude Sonnet 4 to provide feedback on manuscript drafts and to assist with spelling and grammar.

Conflicts of Interest

The authors declare no conflict of interest.

Appendix A. Synthesized Graph of Culture, Ideological, and Affective Polarization Across Countries

Appendix A.1. Data Management

We used the cultural index for 119 countries, as identified by World Population Review, on a scale of 1 to 100. An index value closer to 100 indicates an individualistic culture, while a value closer to 1 indicates a collectivist culture. The index we used was measured in 2023. We shifted the cultural index scale to be from 0.01 to 1 by dividing by 100.
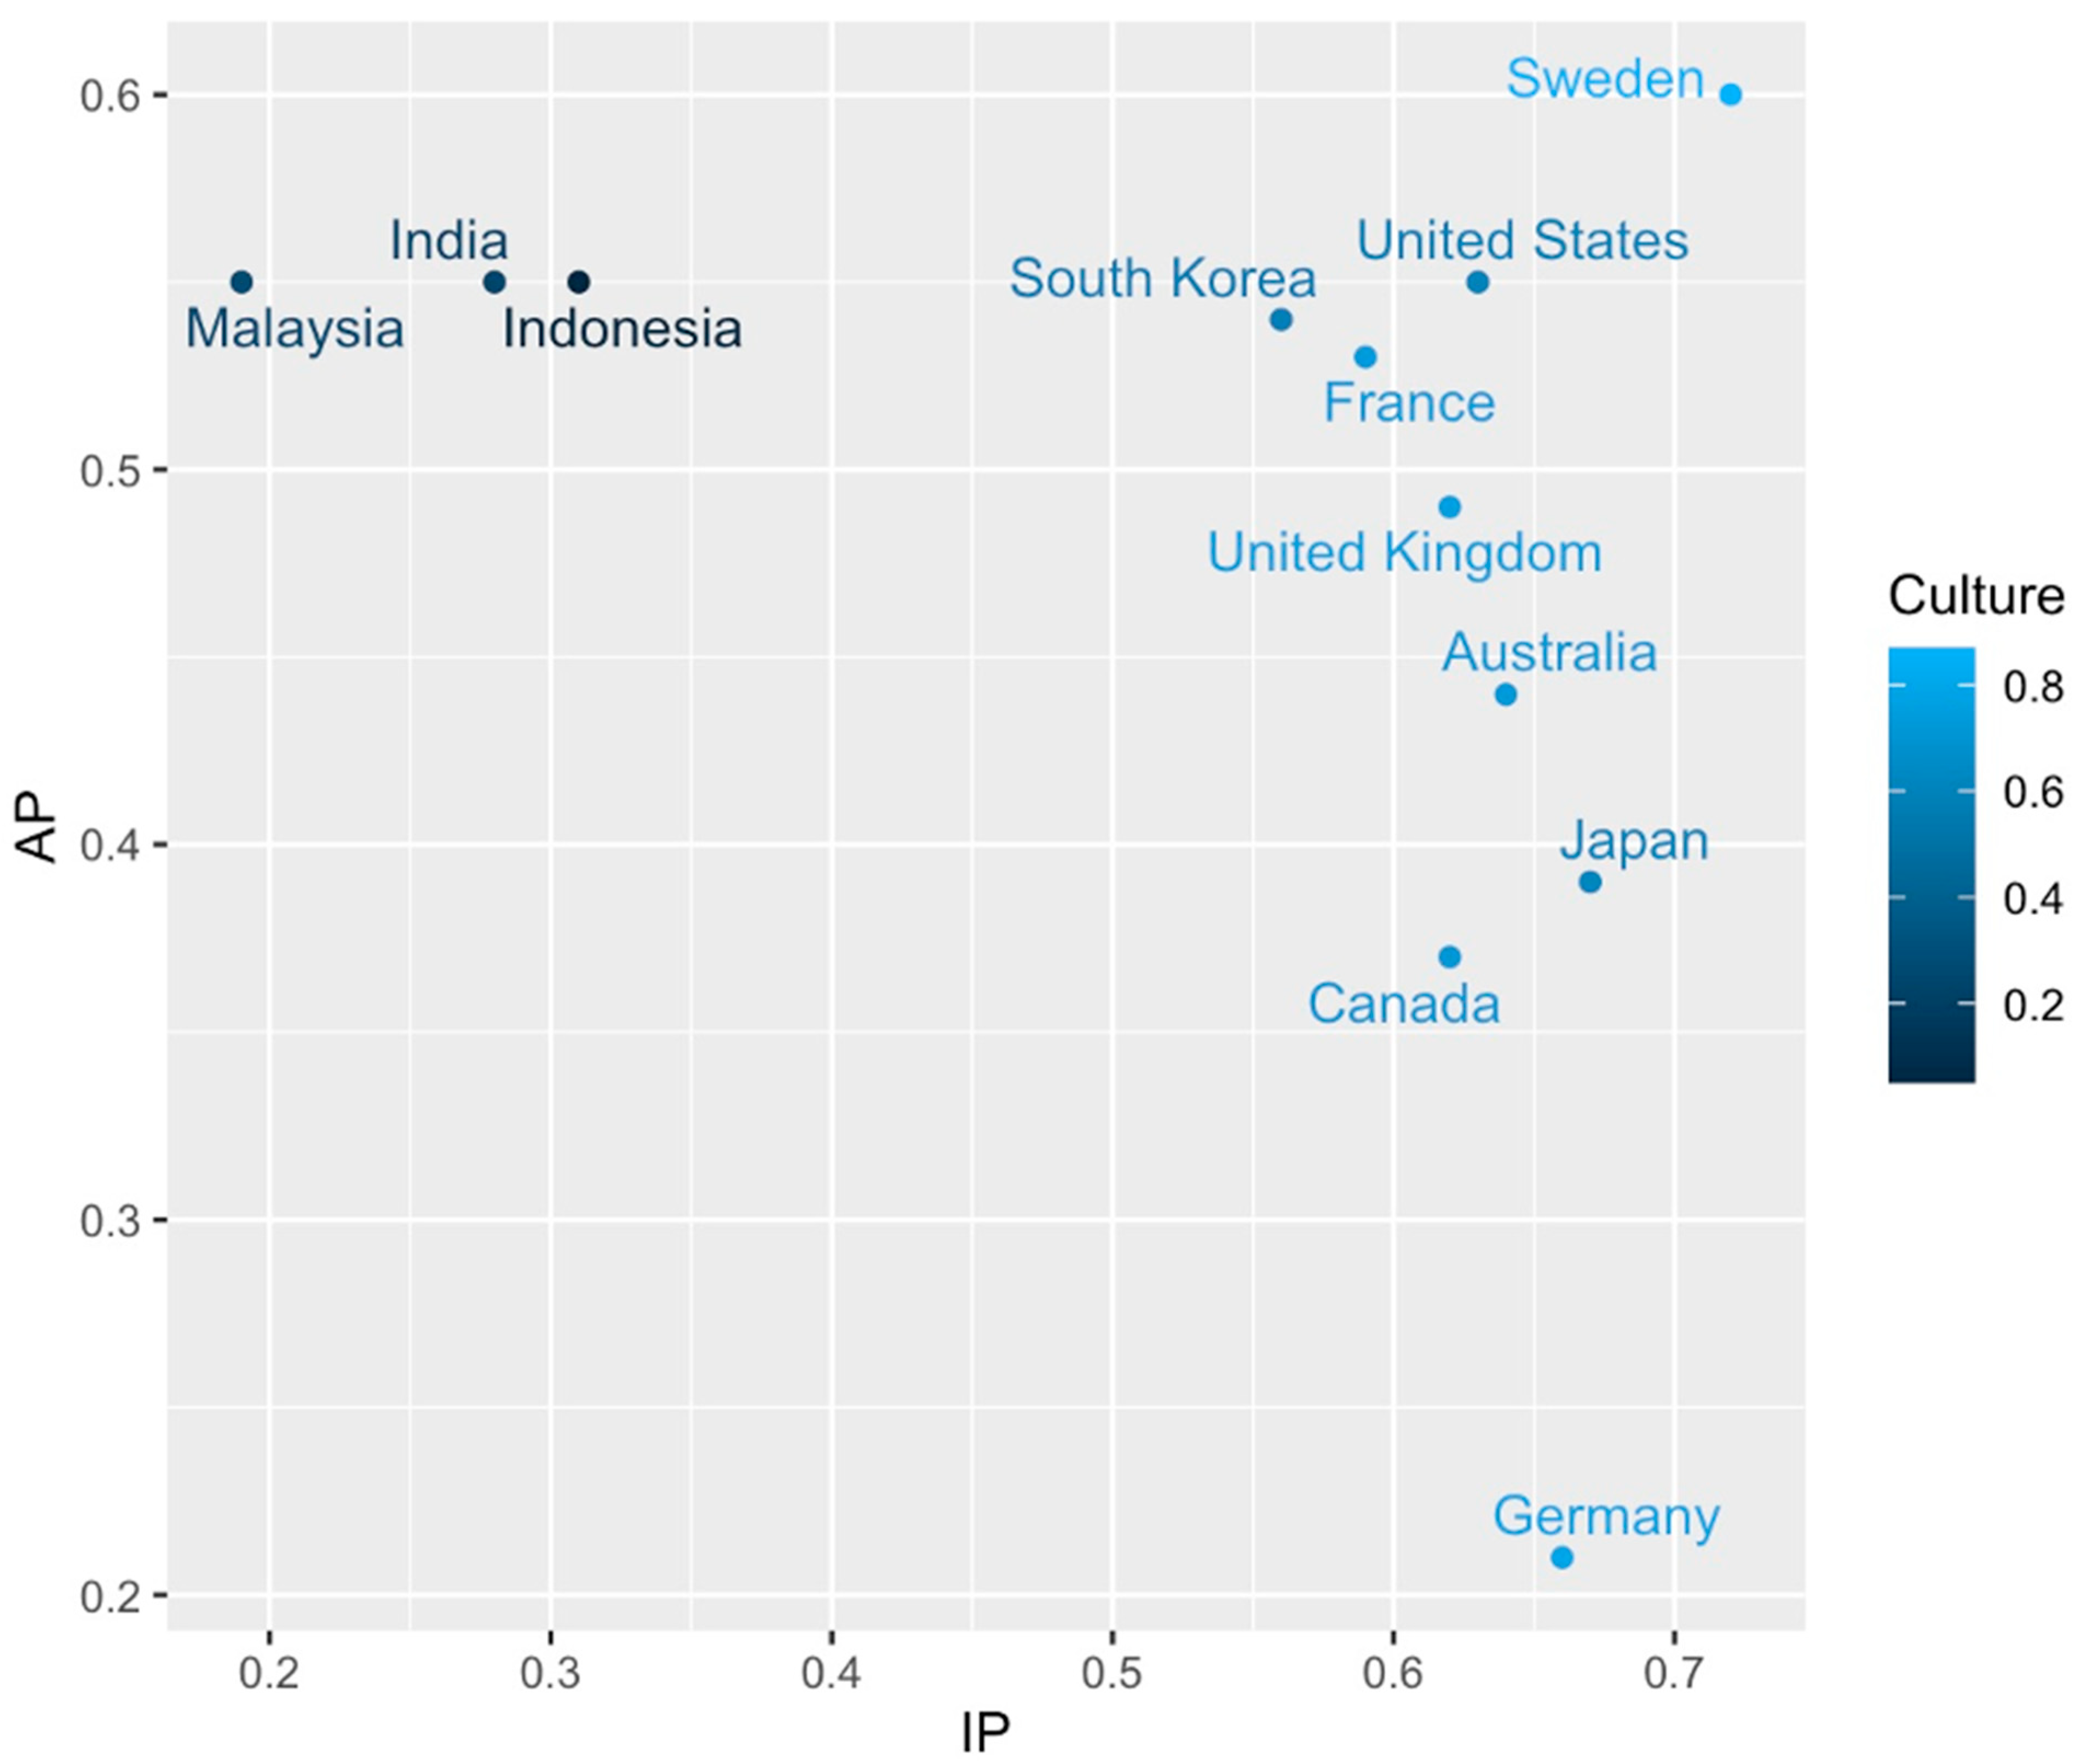
We used an ideological polarization index from the 2023 Edelman Trust Barometer [1], which measures the ideological polarization rates of 28 countries on a scale from 0 to 10 (page 16). The 2023 Edelman Trust Barometer measured the ideological polarization index with two different questions: the level of entrenched (X-axis) and the level of divided (Y-axis). However, they do not provide the dataset with exact values for each aspect of ideological polarization. We utilized the website ‘Graphreader’ “URL: https://www.graphreader.com/ (accessed on 12 August 2024)”. to estimate X-axis and Y-axis points for each country, and we calculated the diagonal distance to use as our ideological polarization index. And then we standardized those values to a range between 0 and 1. Based on our estimations from the 2023 Edelman Trust Barometer, Sweden shows the highest degree of ideological polarization (approximately 0.72), while Malaysia shows the lowest (approximately 0.19).
We used the affective polarization index from Boxell et al. [2], which measures affective polarization rates for 12 OECD countries. The index values are from 2020 and are presented in Figure 1, Trends in Affective Polarization by Country on a scale from 1 to 100. Since Boxell et al. do not provide the dataset with exact values for the affective polarization shown in Figure 1, we used the website ‘Graphreader’ “URL: https://www.graphreader.com/ (accessed on 12 August 2024)”. to estimate the polarization level for each country, and then we standardized the estimated values to a 0–1 range. According to our estimates of Figure 1, Sweden shows the highest degree of affective polarization (approximately 0.6), while Germany displays the lowest degree (approximately 0.21). We recognized that using the 12 OECD countries does not include East, South, and Southeast Asian countries. We referred to other sources to understand South Korea [3], India, Indonesia, and Malaysia ’s political contexts [4]. We inferred affective polarization estimates based on authors’ comparison with countries with a similar level of affective polarization.
The graph below is designed to assist readers in understanding differences across countries by illustrating varying levels of culture, ideological polarization, and affective polarization in the context of our model rather than to make any specific predictions.

Appendix A.2. Synthesized Graph

Based on the integrated data, the sampled countries can be categorized into six provisional groups:
  • High ideological and affective polarization (individualistic culture): Sweden, France
  • High ideological and affective polarization (mixed culture): South Korea, United States
  • High ideological polarization, moderate affective polarization (individualistic culture): United Kingdom, Australia, Canada
  • High ideological polarization, moderate affective polarization (mixed culture): Japan
  • High ideological polarization, low affective polarization (individualistic culture): Germany
  • Low ideological polarization, high affective polarization (collectivist culture): Malaysia, India, Indonesia
These classifications reflect current data trends but should be interpreted as time-bound snapshots, as polarization metrics and cultural index may shift gradually with evolving societal contexts.
Figure A1. The horizontal axis (X) represents ideological polarization (IP), while the vertical axis (Y) denotes affective polarization (AP). The top right quadrant highlights countries with high ideological and high affective polarization. The bottom right quadrant shows countries with high ideological but low affective polarization. The top left quadrant indicates countries with low ideological but high affective polarization. The bottom left quadrant represents countries with low ideological and low affective polarization. Dot color corresponds to cultural orientation, with darker hues indicating stronger collectivist tendencies and lighter hues reflecting higher degrees of individualism.
Climate 13 00194 g0a1

Appendix A.3. Related References to the Synthesized Graph

  • Institute, E.T. Edelman Trust Barometer Global Report; Edelman Trust Institute, 2023; pp. 1–71.
  • Boxell, L.; Gentzkow, M.; Shapiro, J.M. Cross-Country Trends in Affective Polarization 2021.
  • Institute of Korean Studies; Shin, H.; Yang, J.; Hahm, S.D. Affective Polarization in the 2022 South Korean Presidential Election: Causes and Consequences. Korea Obs. - Inst. Korean Stud. 2024, 55, 273–296, doi:10.29152/ Edelman.2024.55.2.273.
  • Carothers, T.; O’Donohue, A. Political Polarization in South and Southeast Asia: Old Divisions, New Dangers; 2020; p. 108.

Appendix B. Disclosure Elements

References

  1. Corfee-Morlot, J.; Maslin, M.; Burgess, J. Global Warming in the Public Sphere. Philos. Trans. Math. Phys. Eng. Sci. 2007, 365, 2741–2776. [Google Scholar] [CrossRef] [PubMed]
  2. Savitsky, G.; Burnett, G.; Beckage, B. Carbon, Climate, and Collapse: Coupling Climate Feedbacks and Resource Dynamics to Predict Societal Collapse. Systems 2025, 13, 727. [Google Scholar] [CrossRef]
  3. Zafar, S.; Ammara, S. Variations in Climate Change Views across Europe: An Empirical Analysis. J. Clean. Prod. 2024, 442, 141157. [Google Scholar] [CrossRef]
  4. Bromley-Trujillo, R.; Poe, J. The Importance of Salience: Public Opinion and State Policy Action on Climate Change. J. Public Policy 2020, 40, 280–304. [Google Scholar] [CrossRef]
  5. Schaffer, L.M.; Oehl, B.; Bernauer, T. Are Policymakers Responsive to Public Demand in Climate Politics? J. Public Policy 2022, 42, 136–164. [Google Scholar] [CrossRef]
  6. Hornsey, M.J.; Harris, E.A.; Bain, P.G.; Fielding, K.S. Meta-Analyses of the Determinants and Outcomes of Belief in Climate Change. Nat. Clim. Change 2016, 6, 622–626. [Google Scholar] [CrossRef]
  7. Doell, K.C.; Pärnamets, P.; Harris, E.A.; Hackel, L.M.; Bavel, J.J.V. Understanding the Effects of Partisan Identity on Climate Change. Curr. Opin. Behav. Sci. 2021, 42, 54–59. [Google Scholar] [CrossRef]
  8. Damasio, A.R. Descartes’ Error: Emotion, Reason, and the Human Brain; Grosset/Putnam: New York, NY, USA, 1994. [Google Scholar]
  9. Risen, J.L.; Critcher, C.R. Visceral Fit: While in a Visceral State, Associated States of the World Seem More Likely. J. Pers. Soc. Psychol. 2011, 100, 777–793. [Google Scholar] [CrossRef] [PubMed]
  10. North, D. Understanding the Process of Economic Change; Princeton University Press: Princeton, NJ, USA, 2005. [Google Scholar]
  11. Constantino, S.M.; Sparkman, G.; Kraft-todd, G.T.; Bicchieri, C.; Centola, D.; Shell-duncan, B. Scaling Up Change: A Critical Review and Practical Guide to Harnessing Social Norms for Climate Action. Psychol. Sci. Public Interes. 2022, 23, 50–97. [Google Scholar] [CrossRef]
  12. European Commission. Progress Report 2024: Climate Action Leading the Way—From Plans to Implementation for a Green and Competitive Europe. 2024. Available online: https://climate.ec.europa.eu/document/download/7bd19c68-b179-4f3f-af75-4e309ec0646f_en?filename=CAPR-report2024-web.pdf (accessed on 11 September 2025).
  13. Tyson, A.; Funk, C.; Kennedy, B. What the Data Says about Americans’ Views of Climate Change. Pew Research Center. 2023. Available online: https://www.pewresearch.org/short-reads/2023/08/09/what-the-data-says-about-americans-views-of-climate-change/ (accessed on 11 September 2025).
  14. Poortinga, W.; Whitmarsh, L.; Steg, L.; Böhm, G.; Fisher, S. Climate Change Perceptions and Their Individual-Level Determinants: A Cross-European Analysis. Glob. Environ. Change 2019, 55, 25–35. [Google Scholar] [CrossRef]
  15. Rojas, H.; Valenzuela, S. A Call to Contextualize Public Opinion-Based Research in Political Communication. Polit. Commun. 2019, 36, 652–659. [Google Scholar] [CrossRef]
  16. Xiang, P.; Zhang, H.; Geng, L.; Zhou, K.; Wu, Y. Individualist–Collectivist Differences in Climate Change Inaction: The Role of Perceived Intractability. Front. Psychol. 2019, 10, 187. [Google Scholar] [CrossRef]
  17. Chan, H.-W.; Udall, A.M.; Tam, K.-P. Effects of Perceived Social Norms on Support for Renewable Energy Transition: Moderation by National Culture and Environmental Risks. J. Environ. Psychol. 2022, 79, 101750. [Google Scholar] [CrossRef]
  18. Vu, T.V. Individualism and Climate Change Policies: International Evidence. J. Econ. Dev. 2023, 25, 22–36. [Google Scholar] [CrossRef]
  19. Borick, C.P.; Rabe, B.G. Personal Experience, Extreme Weather Events, and Perceptions of Climate Change. In Oxford Research Encyclopedia of Climate Science; Oxford University Press: Oxford, UK, 2017. [Google Scholar]
  20. Reser, J.P.; Bradley, G.L. The Nature, Significance, and Influence of Perceived Personal Experience of Climate Change. WIREs Clim. Change 2020, 11, e668. [Google Scholar] [CrossRef]
  21. Howe, P.D. Extreme Weather Experience and Climate Change Opinion. Curr. Opin. Behav. Sci. 2021, 42, 127–131. [Google Scholar] [CrossRef]
  22. Bohr, J. Is It Hot in Here or Is It Just Me? Temperature Anomalies and Political Polarization over Global Warming in the American Public. Clim. Change 2017, 142, 271–285. [Google Scholar] [CrossRef]
  23. Falkenberg, M.; Galeazzi, A.; Torricelli, M.; Marco, N.D.; Larosa, F.; Sas, M.; Mekacher, A.; Pearce, W.; Zollo, F.; Quattrociocchi, W.; et al. Growing Polarization around Climate Change on Social Media. Nat. Clim. Change 2022, 12, 1114–1121. [Google Scholar] [CrossRef]
  24. Cakanlar, A. Breaking Climate Change Polarization. J. Public Policy Mark. 2024, 43, 276–294. [Google Scholar] [CrossRef]
  25. Stanley, M.L.; Henne, P.; Yang, B.W.; Brigard, F.D. Resistance to Position Change, Motivated Reasoning, and Polarization. Polit. Behav. 2020, 42, 891–913. [Google Scholar] [CrossRef]
  26. Iyengar, S.; Sood, G.; Lelkes, Y. Affect, Not Ideology: A Social Identity Perspective on Polarization. Public Opin. Q. 2012, 76, 405–431. [Google Scholar] [CrossRef]
  27. Vasconcelos, V.V.; Constantino, S.M.; Dannenberg, A.; Lumkowsky, M.; Weber, E.; Levin, S. Segregation and Clustering of Preferences Erode Socially Beneficial Coordination. Proc. Natl. Acad. Sci. USA 2021, 118, e2102153118. [Google Scholar] [CrossRef]
  28. Sobkowicz, P. Opinion Dynamics Model Based on Cognitive Biases of Complex Agents. J. Artif. Soc. Soc. Simul. 2018, 21, 8. [Google Scholar] [CrossRef]
  29. Steiglechner, P.; Keijzer, M.A.; Smaldino, P.E.; Moser, D.; Merico, A. Noise and Opinion Dynamics: How Ambiguity Promotes pro-Majority Consensus in the Presence of Confirmation Bias. R. Soc. Open Sci. 2024, 11, 231071. [Google Scholar] [CrossRef] [PubMed]
  30. Dumas, M.; Rising, J.; Urpelainen, J. Political Competition and Renewable Energy Transitions over Long Time Horizons: A Dynamic Approach. Ecol. Econ. 2016, 124, 175–184. [Google Scholar] [CrossRef]
  31. Bury, T.M.; Bauch, C.T.; Anand, M. Charting Pathways to Climate Change Mitigation in a Coupled Socio-Climate Model. PLoS Comput. Biol. 2019, 15, e1007000. [Google Scholar] [CrossRef] [PubMed]
  32. Eker, S.; Reese, G.; Obersteiner, M. Modelling the Drivers of a Widespread Shift to Sustainable Diets. Nat. Sustain. 2019, 2, 725–735. [Google Scholar] [CrossRef]
  33. Konc, T.; Drews, S.; Savin, I.; van den Bergh, J.C.J.M. Co-Dynamics of Climate Policy Stringency and Public Support. Glob. Environ. Change 2022, 74, 102528. [Google Scholar] [CrossRef]
  34. Balenzuela, P.; Pinasco, J.P.; Semeshenko, V. The Undecided Have the Key: Interaction-Driven Opinion Dynamics in a Three State Model. PLoS ONE 2015, 10, e0139572. [Google Scholar] [CrossRef]
  35. Meadows, D.H. Thinking in Systems: A Primer; Chelsea Green Publishing: White River Junction, VT, USA, 2008; ISBN 978-1-60358-055-7. [Google Scholar]
  36. Castellano, C.; Fortunato, S.; Loreto, V. Statistical Physics of Social Dynamics. Rev. Mod. Phys. 2009, 81, 591–646. [Google Scholar] [CrossRef]
  37. Weber, E.U. Evidence-Based and Description-Based Perceptions of Long-Term Risk: Why Global Warming Does Not Scare Us. Clim. Change 2006, 77, 103–120. [Google Scholar] [CrossRef]
  38. Weber, E.U. What Shapes Perceptions of Climate Change? Wiley Interdiscip. Rev. Clim. Change 2010, 1, 332–342. [Google Scholar] [CrossRef]
  39. Weber, E.U. What Shapes Perceptions of Climate Change? New Research since 2010. Wiley Interdiscip. Rev. Clim. Change 2016, 7, 125–134. [Google Scholar] [CrossRef]
  40. Slovic, P. Perception of Risk: Reflections on the Psychometric Paradigm. In Social Theories of Risk; Krimsky, S., Golding, D., Eds.; Praeger: Westport, CT, USA, 1992; pp. 117–152. [Google Scholar]
  41. van der Linden, S. Determinants and Measurement of Climate Change Risk Perception, Worry, and Concern; Social Science Research Network: Rochester, NY, USA, 2017. [Google Scholar]
  42. Sugerman, E.R.; Li, Y.; Johnson, E.J. Local Warming Is Real: A Meta-Analysis of the Effect of Recent Temperature on Climate Change Beliefs. Curr. Opin. Behav. Sci. 2021, 42, 121–126. [Google Scholar] [CrossRef]
  43. Haer, T.; Botzen, W.J.W.; Aerts, J.C.J.H. The Effectiveness of Flood Risk Communication Strategies and the Influence of Social Networks—Insights from an Agent-Based Model. Environ. Sci. Policy 2016, 60, 44–52. [Google Scholar] [CrossRef]
  44. Smith, E.K.; Wiedermann, M.; Donges, J.F.; Heitzig, J.; Winkelmann, R. Concern and Anticipation of Sea-Level Rise Provide Grounds for Social Tipping Towards Climate Action. 2022. Available online: https://www.research-collection.ethz.ch/entities/publication/561d0834-78f6-400a-960c-7c71e5ace9fd (accessed on 11 September 2025).
  45. Konisky, D.M.; Hughes, L.; Kaylor, C.H. Extreme Weather Events and Climate Change Concern. Clim. Change 2016, 134, 533–547. [Google Scholar] [CrossRef]
  46. Sisco, M.R. The Effects of Weather Experiences on Climate Change Attitudes and Behaviors. Curr. Opin. Environ. Sustain. 2021, 52, 111–117. [Google Scholar] [CrossRef]
  47. Lee, G.E.; Loveridge, S.; Winkler, J.A. The Influence of an Extreme Warm Spell on Public Support for Government Involvement in Climate Change Adoptation. Ann. Am. Assoc. Geogr. 2018, 108, 718–738. [Google Scholar]
  48. Bromley-Trujillo, R.; Holman, M.; Sandoval, A. Hot Districts, Cool Legislation: Evaluating Agenda Setting in Climate Change Bill Sponsorship in US States. State Polit. Policy Q. 2019, 19, 375–395. [Google Scholar] [CrossRef]
  49. Böhmelt, T. Environmental Disasters and Public-Opinion Formation: A Natural Experiment. Environ. Res. Commun. 2020, 2, 081002. [Google Scholar] [CrossRef]
  50. Hoffmann, R.; Muttarak, R.; Peisker, J.; Stanig, P. Climate Change Experiences Raise Environmental Concerns and Promote Green Voting. Nat. Clim. Change 2022, 12, 148–155. [Google Scholar] [CrossRef]
  51. Müller, P.M.; Heitzig, J.; Kurths, J.; Lüdge, K.; Wiedermann, M. Anticipation-Induced Social Tipping: Can the Environment Be Stabilised by Social Dynamics? Eur. Phys. J. Spec. Top. 2021, 230, 3189–3199. [Google Scholar] [CrossRef]
  52. Moore, F.C.; Lacasse, K.; Mach, K.J.; Shin, Y.A.; Gross, L.J.; Beckage, B. Determinants of Emissions Pathways in the Coupled Climate–Social System. Nature 2022, 603, 103–111. [Google Scholar] [CrossRef] [PubMed]
  53. Beckage, B.; Gross, L.J.; Lacasse, K.; Carr, E.; Metcalf, S.S.; Winter, J.M.; Howe, P.D.; Fefferman, N.; Franck, T.; Zia, A.; et al. Linking Models of Human Behaviour and Climate Alters Projected Climate Change. Nat. Clim. Change 2018, 8, 79–84. [Google Scholar] [CrossRef]
  54. Kraan, O.; Dalderop, S.; Jan, G.; Nikolic, I. Energy Research & Social Science Jumping to a Better World: An Agent-Based Exploration of Criticality in Low- Carbon Energy Transitions. Energy Res. Soc. Sci. 2019, 47, 156–165. [Google Scholar] [CrossRef]
  55. Kapeller, M.L.; Jäger, G. Threat and Anxiety in the Climate Debate—An Agent-Based Model to Investigate Climate Scepticism and Pro-Environmental Behaviour. Sustainability 2020, 12, 1823. [Google Scholar] [CrossRef]
  56. Giardini, F.; Vilone, D. Opinion Dynamics and Collective Risk Perception: An Agent-Based Model of Institutional and Media Communication About Disasters. JASSS- J. Artif. Soc. Soc. Simul. 2021, 24, 4. [Google Scholar] [CrossRef]
  57. Bakaki, Z.; Bernauer, T. Citizens Show Strong Support for Climate Policy, but Are They Also Willing to Pay? Clim. Change 2017, 145, 15–26. [Google Scholar] [CrossRef]
  58. Bechtel, M.M.; Scheve, K.F. Mass Support for Global Climate Agreements Depends on Institutional Design. Proc. Natl. Acad. Sci. USA 2013, 110, 13763–13768. [Google Scholar] [CrossRef]
  59. Drews, S.; Van Den Bergh, J.C.J.M. What Explains Public Support for Climate Policies? A Review of Empirical and Experimental Studies. Clim. Policy 2016, 16, 855–876. [Google Scholar] [CrossRef]
  60. Fairbrother, M. Public Opinion about Climate Policies: A Review and Call for More Studies of What People Want. PLoS Clim. 2022, 1, e0000030. [Google Scholar] [CrossRef]
  61. Hofstede, G. Culture’s Consequences: Comparing Values, Behaviors, Institutions, and Organizations Across Nations, 2nd ed.; Sage Publications: Thousand Oaks, CA, USA, 2001. [Google Scholar]
  62. Shi, J.; Visschers, V.H.M.; Siegrist, M. Public Perception of Climate Change: The Importance of Knowledge and Cultural Worldviews. Risk Anal. 2015, 35, 2183–2201. [Google Scholar] [CrossRef] [PubMed]
  63. Xue, W.; Hine, D.W.; Marks, A.D.G.; Phillips, W.J.; Zhao, S. Cultural Worldviews and Climate Change: A View from China. Asian J. Soc. Psychol. 2016, 19, 134–144. [Google Scholar] [CrossRef]
  64. Pettifor, H.; Wilson, C.; Mccollum, D.; Edelenbosch, O.Y. Modelling Social in Fl Uence and Cultural Variation in Global Low-Carbon Vehicle Transitions. Glob. Environ. Change 2017, 47, 76–87. [Google Scholar] [CrossRef]
  65. Khosrowjerdi, M.; Sundqvist, A.; Byström, K. Cultural Patterns of Information Source Use: A Global Study of 47 Countries. J. Assoc. Inf. Sci. Technol. 2020, 71, 711–724. [Google Scholar]
  66. Triandis, H.C.; McCusker, C.; Hui, C.H. Multimethod Probes of Individualism and Collectivism. J. Pers. Soc. Psychol. 1990, 59, 1006–1020. [Google Scholar] [CrossRef]
  67. Triandis, H.C.; Gelfand, M.J. Converging Measurement of Horizontal and Vertical Individualism and Collectivism. J. Pers. Soc. Psychol. 1998, 74, 118–128. [Google Scholar] [CrossRef]
  68. Skocpol, T. Protecting Soldiers and Mothers: The Political Origins of Social Policy in the United States; Belknap Press of Harvard University Press: Cambridge, MA, USA, 1992. [Google Scholar]
  69. Pierson, P. When Effect Becomes Cause: Policy Feedback and Political Change. World Polit. 1993, 45, 595–628. [Google Scholar] [CrossRef]
  70. Pierson, P. Politics in Time: History, Institution, and Social Analysis; Princeton University Press: Princeton, NJ, USA, 2004. [Google Scholar]
  71. Lerman, A.E.; McCabe, K.T. Personal Experience and Public Opinion: A Theory and Test of Conditional Policy Feedback. J. Polit. 2017, 79, 624–641. [Google Scholar] [CrossRef]
  72. Parry, I.W.H.; Black, S.; Vernon-Lin, N. Still Not Getting Energy Prices Right: A Global and Country Update of Fossil Fuel Subsidies 2021. International Monetary Fund. 2021. Available online: https://www.elibrary.imf.org/view/journals/001/2021/236/001.2021.issue-236-en.xml (accessed on 11 September 2025).
  73. Merrill, L.; Bridle, R.; Gerasimchuk, I.; Touchette, Y.; Gagnon-Lebrun, F.; Lontoh, L.; Sharma, S.; Gass, P.; Sanchez, L.; Klimscheffskij, M.; et al. Making the Switch: From Fossil Fuel Subsidies to Sustainable Energy; International Institute for Sustainable Development. 2017. Available online: https://www.iisd.org/publications/report/making-switch-fossil-fuel-subsidies-sustainable-energy (accessed on 11 September 2025).
  74. Constantino, S.M.; Pianta, S.; Rinscheid, A.; Frey, R.; Weber, E.U. The Source Is the Message: The Impact of Institutional Signals on Climate Change–Related Norm Perceptions and Behaviors. Clim. Change 2021, 166, 35. [Google Scholar] [CrossRef]
  75. Syropoulos, S.; Sparkman, G.; Constantino, S.M. The Expressive Function of Public Policy: Renewable Energy Mandates Signal Social Norms. Philos. Trans. R. Soc. B Biol. Sci. 2024, 379, 20230038. [Google Scholar] [CrossRef]
  76. Shin, Y.A.; Constantino, S.M.; Beckage, B.; Lacasse, K. Climate Change and Opinion Dynamics Models: Linking Individual, Social, and Institutional Level Changes. Curr. Opin. Behav. Sci. 2025, 64, 101528. [Google Scholar] [CrossRef]
  77. Edelenbosch, O.Y.; Mccollum, D.L.; Pettifor, H.; Wilson, C. Interactions between Social Learning and Technological Learning in Electric Vehicle Futures. Environ. Res. Lett. 2018, 13, 124004. [Google Scholar] [CrossRef]
  78. Rai, V.; Robinson, S.A. Agent-Based Modeling of Energy Technology Adoption: Empirical Integration of Social, Behavioral, Economic, and Environmental Factors. Environ. Model. Softw. 2015, 70, 163–177. [Google Scholar]
  79. Kaaronen, R.O.; Strelkovskii, N. Cultural Evolution of Sustainable Behaviors: Pro-Environmental Tipping Points in an Agent-Based Model. One Earth 2020, 2, 85–97. [Google Scholar] [CrossRef]
  80. Levendusky, M. The Microfoundations of Mass Polarization. Polit. Anal. 2009, 17, 162–176. [Google Scholar]
  81. Mason, L. ‘I Disrespectfully Agree’: The Differential Effects of Partisan Sorting on Social and Issue Polarization. Am. J. Polit. Sci. 2015, 59, 128–145. [Google Scholar]
  82. Mason, L.; Wronski, J. One Tribe to Bind Them All: How Our Social Group Attachments Strengthen Partisanship. Polit. Psychol. 2018, 39, 257–277. [Google Scholar]
  83. Stewart, A.J.; Plotkin, J.B.; McCarty, N. Inequality, Identity, and Partisanship: How Redistribution Can Stem the Tide of Mass Polarization. Proc. Natl. Acad. Sci. USA 2021, 118, e2102140118. [Google Scholar]
  84. Lodge, M.; Taber, C.S. The Rationalizing Voter; Cambridge University Press: Cambridge, UK, 2013. [Google Scholar]
  85. Druckman, J.N. Communicating Policy-Relevant Science. PS Polit. Sci. Polit. 2015, 48, 58–69. [Google Scholar] [CrossRef]
  86. Huber, G.; Malhotra, N. Political Homophily in Social Relationships: Evidence from Online Dating Behavior. J. Polit. 2017, 79, 269–283. [Google Scholar] [CrossRef]
  87. Shafranek, R.M. Political Considerations in Nonpolitical Decisions: A Conjoint Analysis of Roommate Choice. Polit. Behav. 2021, 43, 271–300. [Google Scholar] [CrossRef]
  88. Bala, B.K.; Arshad, F.M.; Noh, K.M. System Dynamics: Modelling and Simulation; Springer, Singapore: Singapore, 2017. [Google Scholar] [CrossRef]
  89. Lade, S.J.; Andries, J.M.; Currie, P.; Rocha, J.C. Dynamical System Modelling. In Routledge Handbook of Research Methods for Social-Ecological Systems; Routledge: Abingdon, UK, 2021; pp. 359–370. [Google Scholar]
  90. Perri, S.; Levin, S.; Cerasoli, S.; Porporato, A. Socio-Political Dynamics in Clean Energy Transition. Environ. Res. Lett. 2024, 19, 074017. [Google Scholar] [CrossRef]
  91. Wolff, L.; Taddicken, M. Disinforming the Unbiased: How Online Users Experience and Cope with Dissonance after Climate Change Disinformation Exposure. New Media Soc. 2024, 26, 2699–2720. [Google Scholar] [CrossRef]
  92. World Population Review. Individualistic Countries. 2025. Available online: https://worldpopulationreview.com/country-rankings/individualistic-countries (accessed on 11 September 2025).
  93. Edelman Trust Institute. Edelman Trust Barometer Global Report: Trust and the Crisis of Grievance. 2025. Available online: https://www.edelman.com/sites/g/files/aatuss191/files/2025-01/2025%20Edelman%20Trust%20Barometer_Final.pdf (accessed on 11 September 2025).
  94. Boxell, L.; Gentzkow, M.; Shapiro, J.M. Cross-Country Trends in Affective Polarization. Rev. Econ. Stat. 2024, 106, 557–565. [Google Scholar] [CrossRef]
  95. Therneau, T.M.; Atkinson, E.J. An Introduction to Recursive Partitioning Using the RPART Routines (R Package Vignette); CRAN. 2023. Available online: https://cran.r-project.org/web/packages/rpart/vignettes/longintro.pdf (accessed on 11 September 2025).
  96. Witajewska-Baltvilka, B.; Helepciuc, F.-E.; Mangalagiu, D.; Todor, A. Politicization of Climate Change and Central and Eastern European Countries’ Stance towards the European Green Deal. Glob. Environ. Change 2024, 89, 102932. [Google Scholar] [CrossRef]
  97. Elgendy, K.; Tastan, K. Turkey’s Climate Opportunities and Challenges. Chatham House. 2022. Available online: https://www.chathamhouse.org/2022/05/turkeys-climate-opportunities-and-challenges (accessed on 11 September 2025).
  98. Atefinia, F.; Mirnezami, S.R. Exploring Iranian Sentiments on the Paris Agreement: Insights from Twitter. Heliyon 2025, 11, e42716. [Google Scholar] [CrossRef]
  99. Leiserowitz, A.; Carman, J.; Buttermore, N.; Neyens, L.; Rosenthal, S.; Marlon, J.; Schneider, J.W.; Mulcahy, K. International Public Opinion on Climate Change. Yale Program on Climate Change Opinion. 2022. Available online: https://climatecommunication.yale.edu/publications/international-public-opinion-on-climate-change-2022/ (accessed on 11 September 2025).
  100. Druckman, J.N.; Leeper, T.J. Is Public Opinion Stable? Resolving the Micro/Macro Disconnect in Studies of Public Opinion. Daedalus 2012, 141, 50–68. [Google Scholar] [CrossRef]
  101. European Investment Bank. 94% of Europeans Support Measures to Adapt to Climate Change, According to EIB Survey; European Investment Bank. 2024. Available online: https://www.eib.org/en/press/all/2024-406-94-of-europeans-support-measures-to-adapt-to-climate-change-according-to-eib-survey (accessed on 11 September 2025).
  102. Xavier, C.; Nachiappan, K. Tracks to Transition: India’s Global Climate Strategy Centre for Social and Economic Progress. 2023. Available online: https://csep.org/wp-content/uploads/2023/10/Tracks-to-transition.pdf (accessed on 11 September 2025).
  103. Muthukrishna, M.; Schaller, M. Are Collectivistic Cultures More Prone to Rapid Transformation? Computational Models of Cross-Cultural Differences, Social Network Structure, Dynamic Social Influence, and Cultural Change. Personal. Soc. Psychol. Rev. 2020, 24, 103–120. [Google Scholar] [CrossRef]
  104. Zou, X.; Tam, K.-P.; Morris, M.W.; Lee, S.; Lau, I.Y.-M.; Chiu, C. Culture as Common Sense: Perceived Consensus versus Personal Beliefs as Mechanisms of Cultural Influence. J. Pers. Soc. Psychol. 2009, 97, 579–597. [Google Scholar] [CrossRef] [PubMed]
  105. Limaye, V.S.; Grabow, M.L.; Stull, V.J.; Patz, J.A. Developing A Definition Of Climate And Health Literacy. Health Aff. 2020, 39, 2182–2188. [Google Scholar] [CrossRef] [PubMed]
  106. Lubej, M.; Petraš, Ž.; Kirbiš, A. Measuring Climate Knowledge: A Systematic Review of Quantitative Studies. iScience 2025, 28, 111888. [Google Scholar] [CrossRef] [PubMed]
  107. Cho, R. Climate Education in the U.S.: Where It Stands, and Why It Matters. Columbia Climate School. 2023. Available online: https://news.climate.columbia.edu/2023/02/09/climate-education-in-the-u-s-where-it-stands-and-why-it-matters/ (accessed on 11 September 2025).
  108. European Commission. Learning for the green transition and sustainable development. European Commission. 2025. Available online: https://education.ec.europa.eu/focus-topics/green-education/learning-for-the-green-transition (accessed on 11 September 2025).
  109. Edwards, L.; Cox, S. Cap and Adapt: Failsafe Policy for the Climate Emergency. In The Perennial Turn Contemporary Essays from the Field; Vitek, B., Ed.; New Perennials: Middlebury, VT, USA, 2020; Volume 11, p. 68. [Google Scholar]
  110. Uppalapati, S.S.S.; Ansah, P.O.O.; Campbell, E.; Gour, N.; Thier, K.; Kotcher, J.; Maibach, E. A Global Review of Research on Effective Advocacy and Communication Strategies at the Intersection of Climate Change and Health 2023. Available online: https://climatecommunication.gmu.edu/wp-content/uploads/2023/11/Climate-and-Health-Literature-Review-Final.pdf (accessed on 11 September 2025).
  111. Kennedy, B.; Tyson, A. How Americans View Climate Change and Policies to Address the Issue; Pew Research Center. 2024. Available online: https://www.pewresearch.org/science/2024/12/09/how-americans-view-climate-change-and-policies-to-address-the-issue/ (accessed on 11 September 2025).
  112. Kotz, M.; Levermann, A.; Wenz, L. The Economic Commitment of Climate Change. Nature 2024, 628, 551–557. [Google Scholar] [CrossRef] [PubMed]
  113. Bilal, A.; Känzig, D. The Macroeconomic Impact of Climate Change: Global vs. Local Temperature. National Bureau of Economic Research. 2024. Available online: https://www.nber.org/system/files/working_papers/w32450/w32450.pdf (accessed on 11 September 2025).
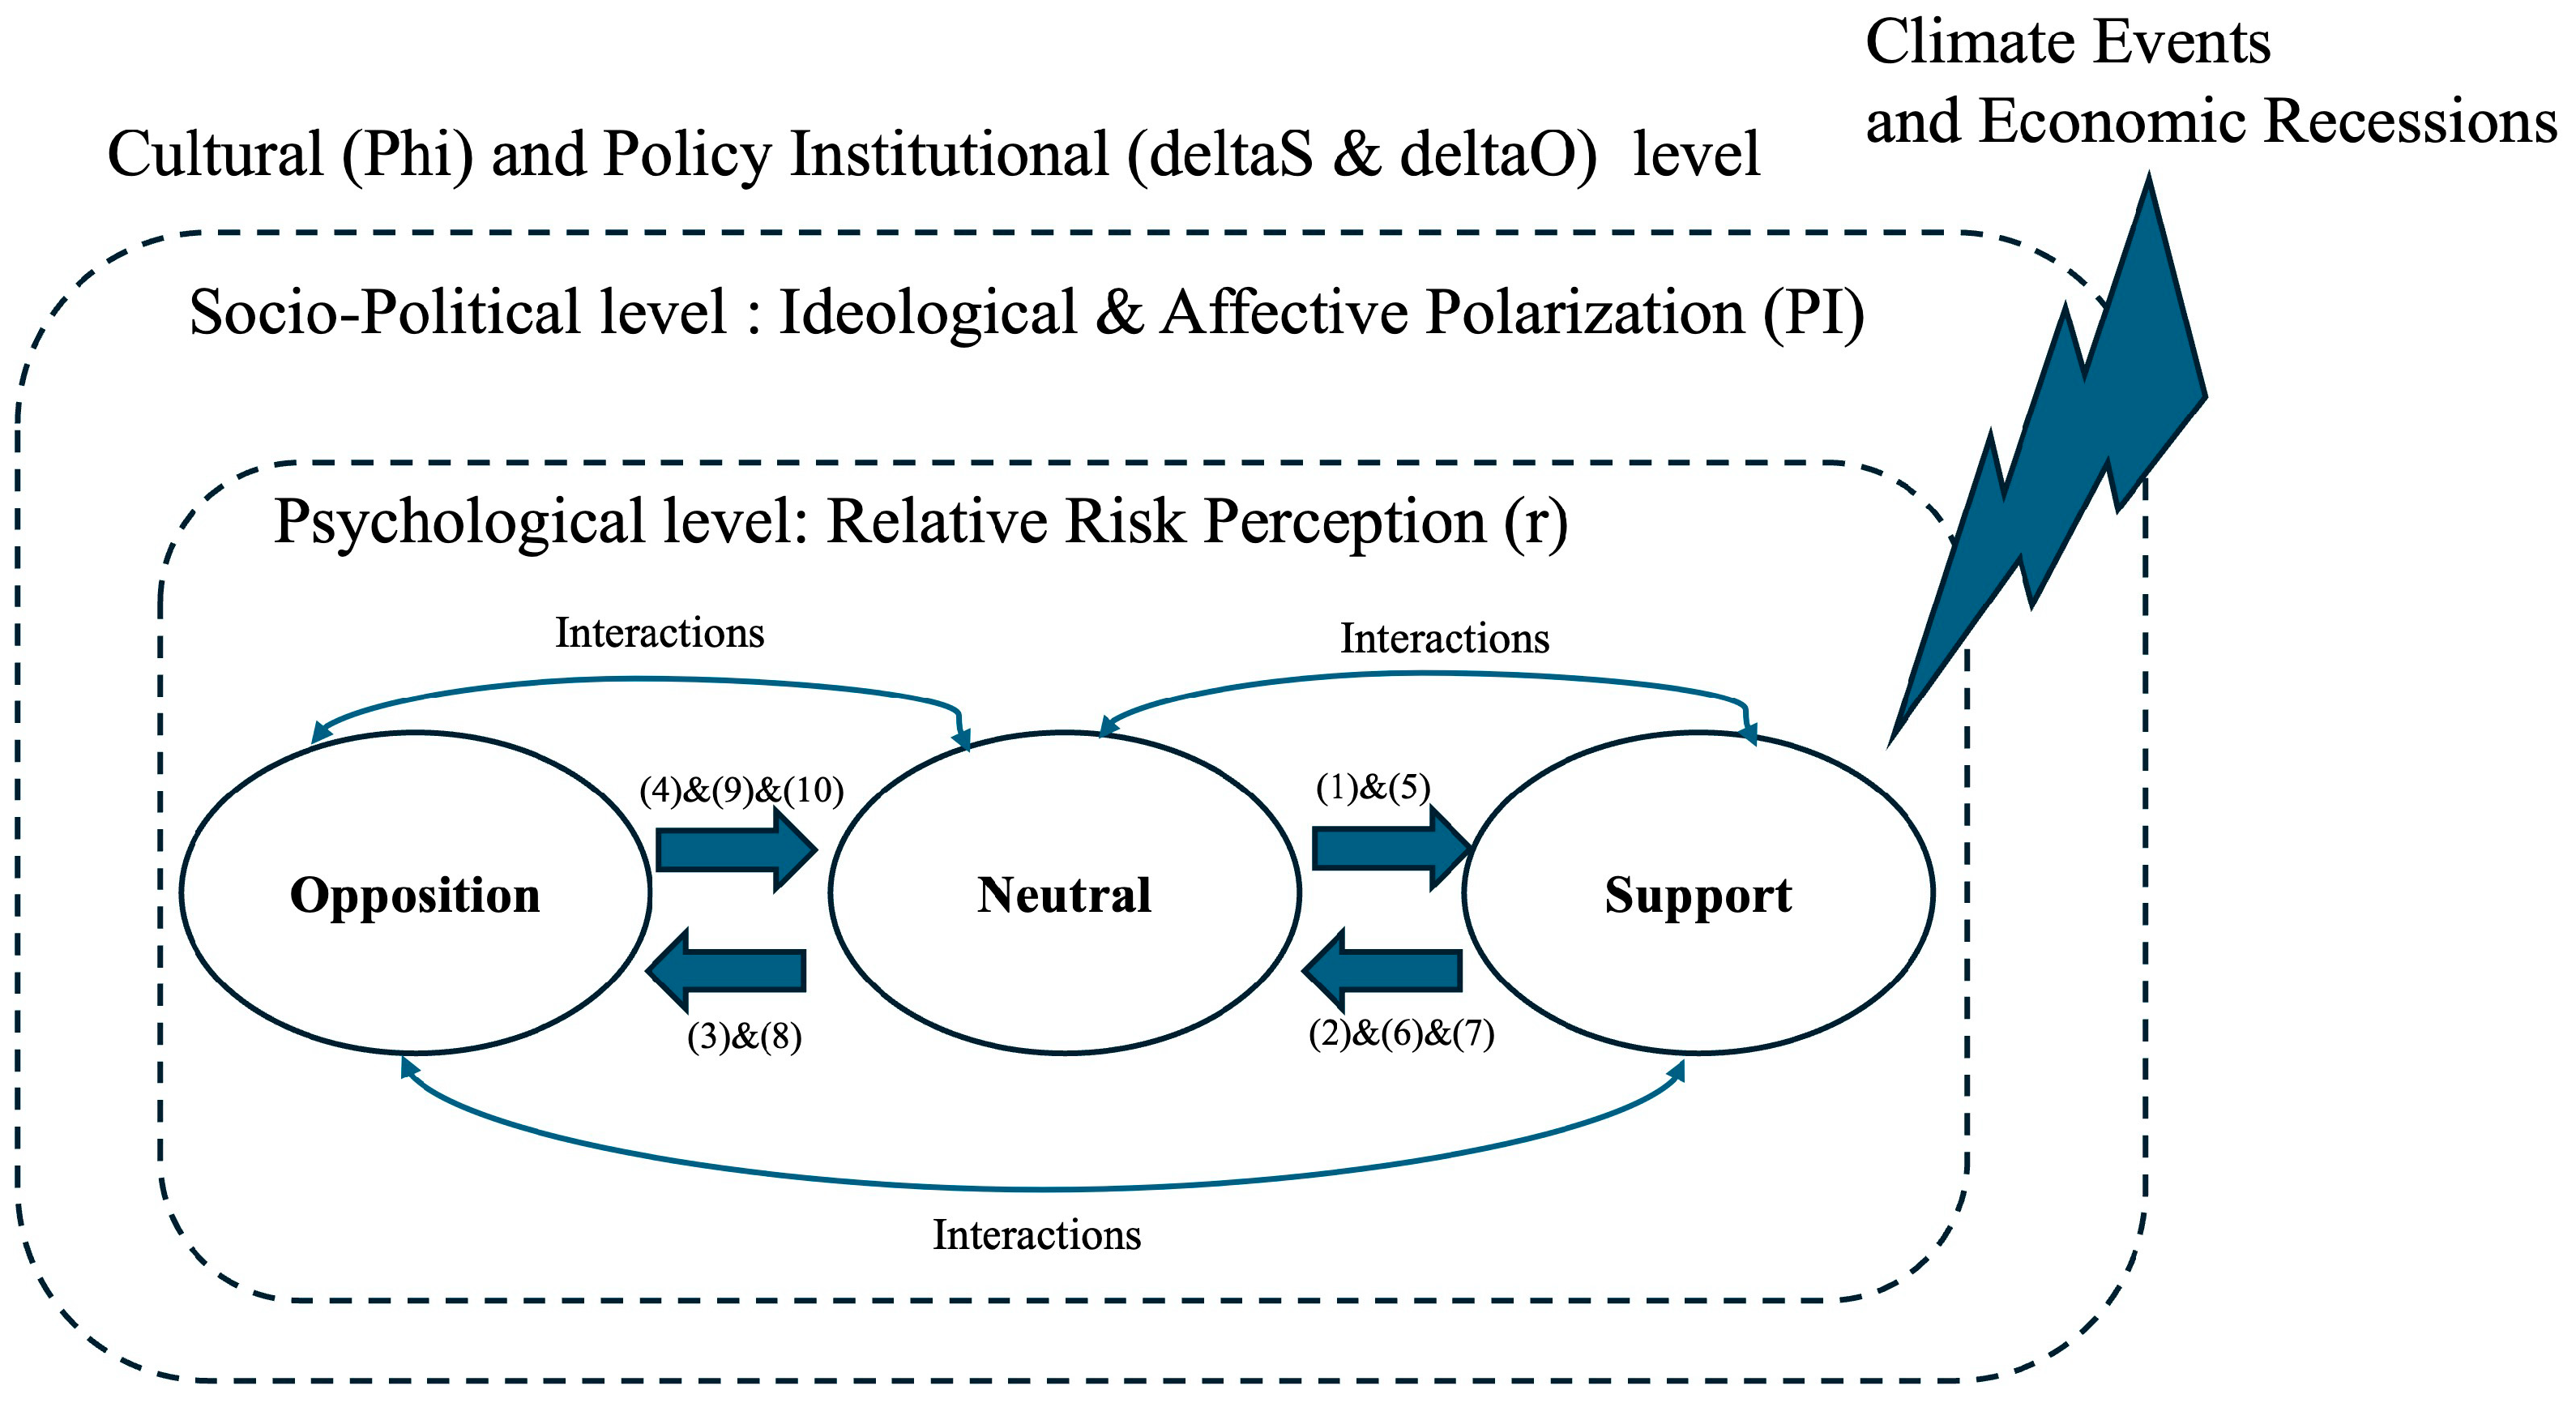
Figure 1. Research Framework. We illustrate how individuals in opinion groups change their views. The transitions between the three opinion groups—opposition, neutral, and support—are influenced by institutional, socio-political, and psychological factors. Each arrow between the opinion groups indicates the direction of opinion changes, and the lower-case letters on the arrows correspond to the equations in the Methods. Individual opinion changes occur due to: (1) relative risk perception and (2) social interactions with members of the three opinion groups. Each arrow represents the direction of opinion change for the groups and denotes the associated equations through (1) to (10) discussed through Section 3.2.1, Section 3.2.2 and Section 3.2.3.
Climate 13 00194 g001
Figure 2. Climate Policy Opinion Formation Framework. We illustrate how experience of extreme events, social interactions, and policy effectiveness influence whether individuals do or do not change their opinions on climate change policies. Arrows denote the directional influence of psychological, socio-political, and cultural factors. Perceived climate risk can change opinions such that greater experience of climate-related extreme events leads more individuals to join the support opinion group but higher perceived economic costs of mitigation lead more individuals to join the opposition opinion group. Ideological polarization leads supporters to overweight perceived severity of climate impacts and opposers to overweight the perceived economic cost of mitigation in determining their relative risk perception. Ideological polarization also reinforces people’s existing beliefs even after direct exposure to opposing arguments from opposing groups. Affective polarization alters who individuals interact with such that they are more likely to interact with those in their opinion group than others. Culture determines whether opinions are more heavily shaped by individual relative risk perception or by social interactions. The effectiveness of climate policy and fossil fuel policy determine how long individuals stay within the support or opposition opinion groups before shifting towards a neutral opinion.
Climate 13 00194 g002
Figure 3. Decision tree results for scenario 2 under two initial conditions: (A) 35% support and 40% opposition, and (B) 40% support and 35% opposition. Internal nodes show parameters (e.g., relative risk perception r and cultural type Cphi) that partition simulations into branches. Each decision node splits the data into two branches: left if the condition is satisfied, and right if it is not. For example, in the first (top) branch of panel (A), if r < 2.5 the decision goes left; if r ≥ 2.5 the decision goes right. Terminal nodes (bottom row) show final outcomes after 20 years. The numbers in terminal nodes indicate the proportion of simulations where the initially minority group becomes dominant (second number) versus where other groups remain dominant (first number). The bottom percentage shows what fraction of all simulations followed that particular pathway. Dominance is defined as being the largest of the three opinion groups. Each terminal node is labeled to highlight whether the initially smaller group overtakes the initially larger group. In panel (A), where opposition initially dominates, nodes show whether support (Ns) becomes largest or other groups remain dominant (Nn or No). In panel (B), where support initially dominates, nodes show whether opposition (No) becomes largest or other groups remain dominant (Nn or Ns). The numerical pairs in each terminal node represent the proportion achieving “other group dominance” (first number) versus “initial minority group dominance” (second number). For example, the leftmost node in panel (A) shows 97% of simulations maintained other group dominance while 3% achieved support dominance, representing the pathway followed by 67% of all simulations. We note that the overall percentage of outcome categories may differ from the percentage of observations in terminal nodes (leaves) predicted for those categories because leaf classification uses a majority threshold (e.g., 50%), creating a step function where terminal nodes predicted as one class may still contain minority cases of other classes.
Climate 13 00194 g003
Figure 4. Decision tree analysis results for scenario 3 under initial conditions of 35% support and 40% opposition. Each internal node indicates a parameter (e.g., relative risk perception r, cultural type Cphi, effectiveness of climate policies deltaS, or fossil fuel policies deltaO) that partitions the simulations into different branches. Please see the caption for Figure 3 for a detailed explanation of the branching structure, and what each entry in the nodes represents.
Climate 13 00194 g004
Figure 5. Decision tree analysis results with initial conditions of 40% support and 35% opposition. Each internal node indicates a parameter (e.g., relative risk perception r, cultural type Cphi, effectiveness of fossil fuel policy deltaO) that partitions the simulations into different branches. Please see Figure 3 caption for an explanation of the branching structure, and what each entry in the nodes represents.
Climate 13 00194 g005
Table 1. Variables and Parameters for Relative Risk Perception.
Variables/
Parameters
DefinitionRangeUnit
NsFraction in the support groupBetween 0–1Dimensionless
NoFraction in the opposition groupBetween 0–1Dimensionless
Nn = 1 − Ns − NoFraction in the neutral groupBetween 0–1Dimensionless
rRelative risk perception: Ratio of perceived severity of climate impacts (perceived climate risk) to perceived economic costs of mitigation (perceived economic risk) for the neutral groupNo limitDimensionless
RhoRate at which a group is amenable to changing opinion (fraction per unit time) 0.21/Time
PIis and PIioIdeological polarization of support and opposition groups Between 0–1Dimensionless
Table 2. Variables and Parameters for Social Interactions and Policy.
Variables/
Parameters
DefinitionRangeUnit
BetaThe fraction of interactions needed to change one’s opinion0.151/Time
PIas and PIaoSupport group and opposition groups’ affective polarizationBetween 0–1Dimensionless
deltaS and deltaOEffectiveness of climate policies (deltaS) and fossil fuel policies (deltaO) in maintaining opinion group membership. Larger values indicate a stronger policy that causes individuals to remain longer in their respective opinion groups, independent of other model factors.2, 3 or 4Time
Table 3. Analysis Results Summary.
Cultural TypeClimate Risk ThresholdPolicy Benefit RequirementsOpinion Change Likelihood
IndividualisticModerate relative risk perception
(r ≥ 2.5)
Policy benefits are required only when relative risk perception is not sufficient.High
(Responsive to evidence)
MixedHigh relative risk perception
(r ≥ 3.5)
Requires highly effective policies
(either deltaS or deltaO ≥ 3.5)
Moderate
(Conditional response)
CollectivisticRelative risk perception does not affect opinionPolicy effectiveness insufficient to overcome dominant social normsLow
(Stable dominant opinions)
Disclaimer/Publisher’s Note: The statements, opinions and data contained in all publications are solely those of the individual author(s) and contributor(s) and not of MDPI and/or the editor(s). MDPI and/or the editor(s) disclaim responsibility for any injury to people or property resulting from any ideas, methods, instructions or products referred to in the content.