Article

The Impacts of Changes in Near-Term Climate Forcers on East Asia’s Climate

Climate Change Research Team, National Institute of Meteorological Sciences, Seogwipo-si 63568, Jeju-do, Republic of Korea
*
Author to whom correspondence should be addressed.
Climate 2025, 13(9), 191; https://doi.org/10.3390/cli13090191
Submission received: 25 July 2025 / Revised: 10 September 2025 / Accepted: 10 September 2025 / Published: 16 September 2025
(This article belongs to the Special Issue New Perspectives in Air Pollution, Climate, and Public Health)

Abstract

This study investigates the impacts of near-term climate forcers (NTCFs) and ozone precursor emissions on particulate matter (PM2.5) concentrations in East Asia (EA). Our analysis used the Coupled Model Intercomparison Project Phase 6 Aerosols and Chemistry Model Intercomparison Project (AerChemMIP) dataset to assess the potential changes in air quality under varying emission scenarios for the present day (1995–2014) and near-term future (2015–2054). Present-day PM2.5 concentrations in EA averaged 14.3 ± 2.6 μg/m3, with significant regional variation: East China (32.43 μg/m3), Korea (13.71 μg/m3), and Japan (7.51 μg/m3). A reduction in historical NTCF emissions would lower PM2.5 concentrations by approximately 43% across EA, whereas reducing O3 precursors would yield an approximately 10% decrease. Under the SSP370 scenario, PM2.5 concentrations are projected to increase by 16% in the near-term future (2045–2054). However, robust NTCF mitigation could reduce PM2.5 levels by approximately 40%, primarily by decreasing sulfate and organic aerosols, which are the dominant contributors of historical PM2.5 variability. Despite substantial projected improvements, achieving the World Health Organization’s stringent air quality guidelines remains challenging, highlighting the necessity for enhanced emissions control targeting key pollutant sources. These insights are crucial to East Asian policymakers aiming to implement effective air quality management strategies.

1. Introduction

The trend of fine particulate matter (PM2.5) concentrations increasing poses a significant threat to human societies, especially in developing countries in East Asia (EA). Prolonged exposure to elevated levels of PM2.5 has been identified as a primary contributing factor to a wide range of adverse health consequences, including diminished life expectancy [1]. This has resulted in substantial economic pressure on public health systems, as evidenced by numerous studies [2,3,4]. The Global Burden of Disease study estimates that air pollution is responsible for more than four million premature deaths annually [2,4,5,6,7]. These studies have generally reported a positive correlation among PM2.5, temperature, and global warming, which has introduced further complexity in resolving this problem [1,8,9]. Previous studies have quantified the health benefits of climate change mitigation through reduced air pollution [10]. The estimated levels of PM2.5 depend on societal development [11], demographic shifts—particularly the aging population—and the extent to which climate change mitigation efforts address shared sources of greenhouse gas and air pollutant emissions, such as those resulting from the combustion of fossil fuels. In light of these considerations, it is imperative to comprehensively understand the factors contributing to PM2.5 concentrations in the present-day period and in future warmer climates, considering both climate change mitigation policies and air quality regulations.
In recent decades, policy interventions have been implemented to mitigate air pollutant emissions associated with reduced exposure to PM2.5 concentrations [12,13,14]. However, despite these efforts, PM2.5 concentrations have continued to increase in many regions worldwide. Previous studies have indicated that air pollutants can pose a significant threat to human health even at concentrations below generally considered safe limits [15]. Considering this, the World Health Organization (WHO) has revised its air quality guidelines (AQGs), updating them in September 2021. The new AQGs have decreased the annual mean PM2.5 concentration threshold from 10 μg/m3 (as previously defined in the 2005 AQGs) to 5 μg/m3. Moreover, the new AQGs may contribute to achieving the United Nations 2032 sustainable development goal 11: sustainable cities and communities [16,17]. It would be beneficial to prevent exposure that is detrimental to human health by exceeding the WHO AQGs [18], with the aspirational goal of reducing premature death from PM2.5 by two-thirds by 2030. There is an urgent need for bold and prompt actions to address the present health crisis caused by air pollution.
Recent studies have demonstrated an increase in research focusing on the sources and impacts of PM2.5, highlighting the pressing need for effective mitigation strategies. Despite widespread recognition of PM2.5’s dangers, a significant portion of existing research has focused on short-term events, typically spanning one to five years. This emphasis frequently overlooks the long-term impacts of specific source emissions and their contributions to PM2.5 levels [19,20]. Consequently, there is an urgent need for policy-oriented research that assesses long-term projections of air quality changes and the effectiveness of emission reduction strategies. It is anticipated that quantitative reductions in PM2.5 concentrations will occur as a result of implemented policies [21,22]. However, it is crucial to interpret these anticipated reductions in the context of the WHO AQGs, which establish set stringent air quality standards. A comprehensive understanding of the alignment between future PM2.5 levels and these guidelines is imperative for evaluating the health benefits of improved air quality.
This study employs the Coupled Model Intercomparison Project Phase 6 (CMIP6) Aerosols and Chemistry Model Intercomparison Project (AerChemMIP) dataset to conduct a comparative analysis of single-element reduction experiments, incorporating future timeframes to evaluate the potential impacts of various emission reduction scenarios. By addressing both short- and long-term perspectives, this research endeavors to contribute to a more comprehensive understanding of the dynamics of PM2.5 and to inform effective policy decisions for air quality management. Historical increases in aerosols and tropospheric ozone exhibit spatially inhomogeneous distributions, as accompanied by region-specific temperature and precipitation responses. Furthermore, the potential effects of air quality regulations on the future climate vary significantly across regions. Considering these factors, the AerChemMIP experiments primarily focus on understanding atmospheric composition changes caused by near-term climate forcers (NTCFs) and other anthropogenic gases (e.g., O3 precursors) and their impact on climate change [23]. A comparison of reference and perturbation simulations will provide the basis for assessing the effects of air quality policies over the coming decades. Our analysis focuses on the impacts of PM with a diameter of 2.5 microns or less (PM2.5) on premature mortality. While exposure to PM2.5 also causes various morbidity and health impacts, mortality is influenced by both ozone exposure and climate change itself. This study is not intended to be exhaustive. The mortality burden attributable to PM2.5 is consistently found to be significantly higher than that of other environmental factors [24], highlighting the substantial health-related benefits anticipated from climate change mitigation, particularly in the near term. The findings of this study aim to provide valuable insights for policymakers and the general public.

2. Materials and Methods

2.1. AerChemMIP Experiments

To analyze the patterns of future air quality changes associated with NTCF and O3 precursor reduction, three historical experiments (histSST, histSST-piNTCF, and histSST-piO3) and three future experiments (ssp370SST, ssp370SST-lowNTCF, and ssp370SST-lowO3) have been selected for this study (Table 1). The “SST” experiments prescribe sea surface temperature and sea ice distributions, allowing for the separation of changes in atmospheric composition from coupled climate feedback. Also, other components used the same configuration from the original historical and SSP3-7.0 simulations (a high-forcing scenario based on a “regional rivalry” pathway, SSP3 [23]). Furthermore, each perturbation experiment included the combined effect of reductions in emissions of NTCFs (-piNTCF and -lowNTCF) and O3 precursors (-piO3 and -lowO3). These mitigation scenarios follow the sustainability pathway represented by SSP1, which represents a sustainable development pathway characterized by rapid adoption of clean technologies (Figure 1; [20,25]).
The three models (GISS-E2-1-G, MRI-ESM2-0, and UKESM1-0-LL) are selected based on the availability of monthly mean output data (all six experiments) from the Earth System Grid Federation (ESGF [26]; https://esgf-node.llnl.gov/search/cmip6/, accessed on 24 July 2025) at their native horizontal resolution (which is approximately 135 km depending on the modeling center). Among this ensemble, the UKESM1 model data are the result of our research team’s participation in AerChemMIP. Within the scope of this study, we use the first realization (r1i1p1f1) of each perturbation experiment. This choice is constrained by data availability, since not all models could provide multi-member ensembles due to their computational cost and experimental design [27,28]. These three models have been demonstrated to be capable of capturing the temporal and spatial changes in anthropogenic emissions over East Asian regions [29].
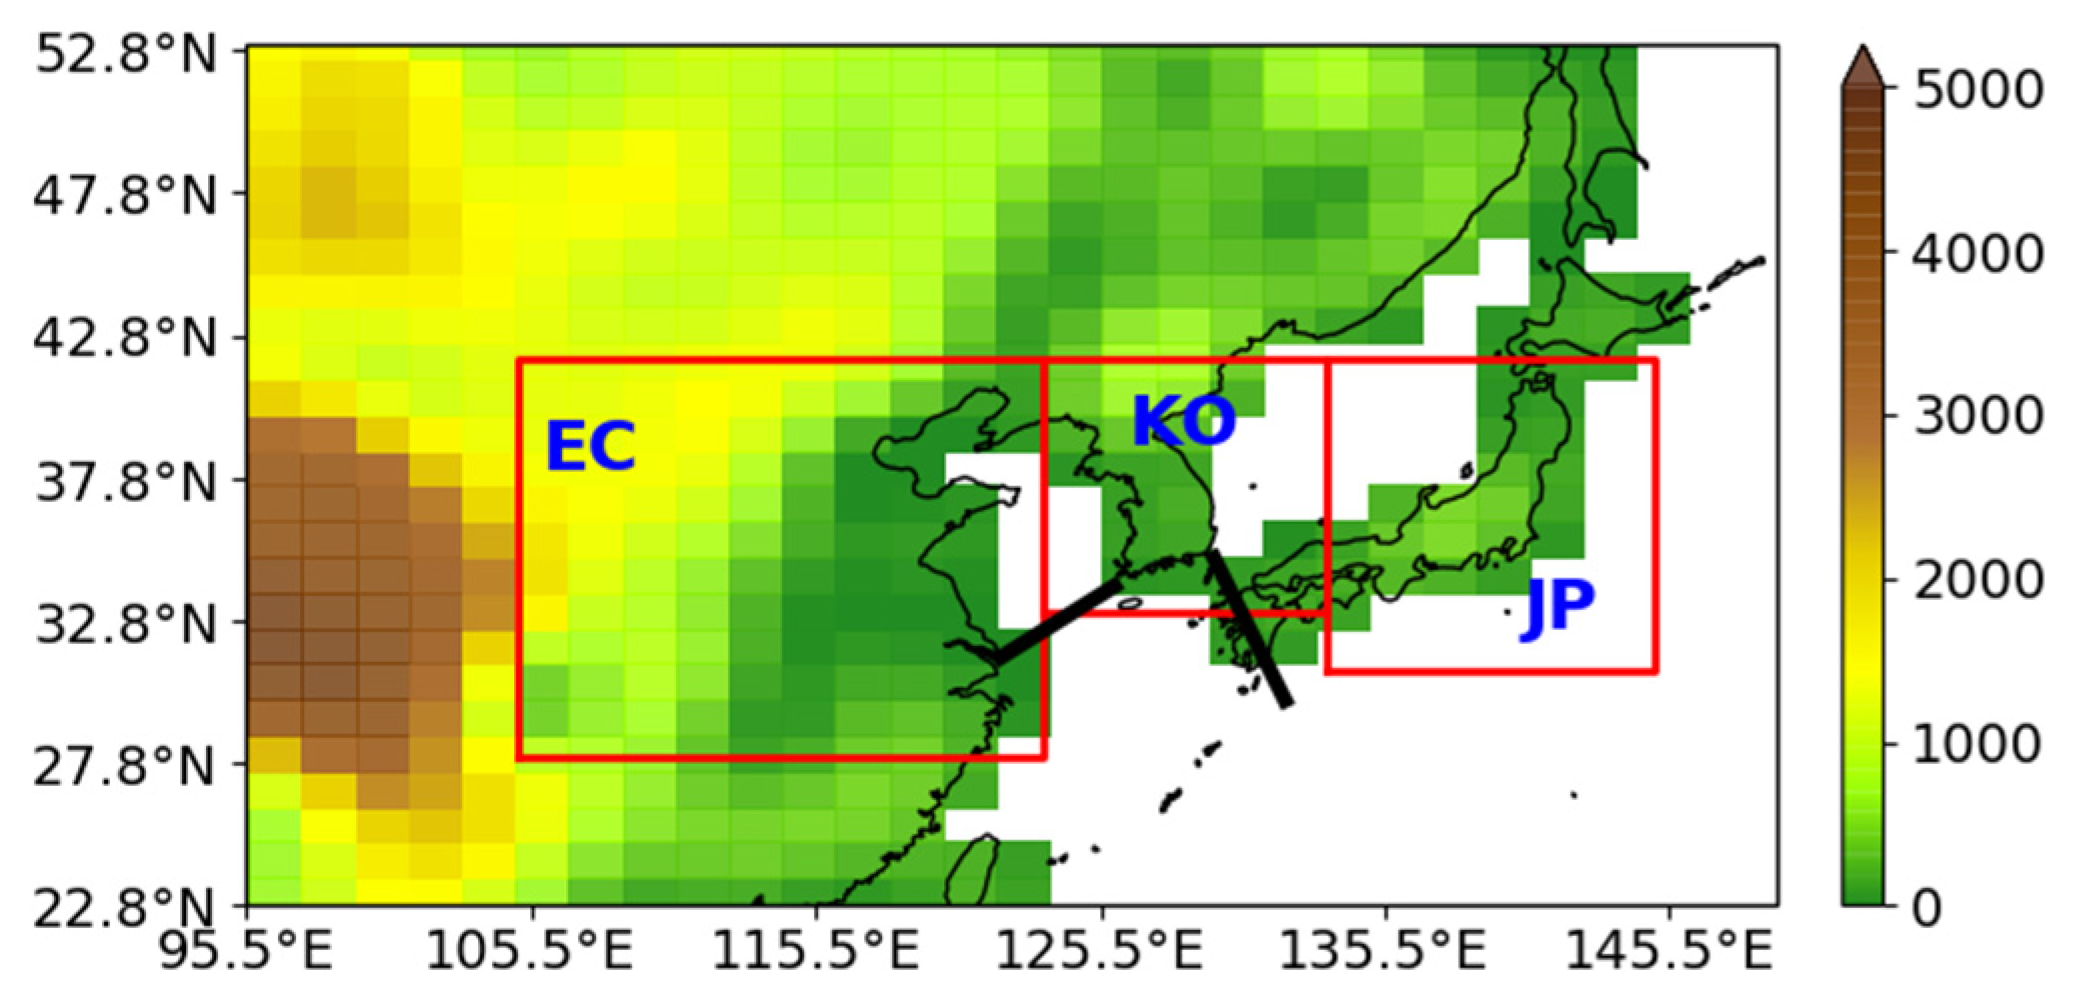
To facilitate analysis, all data are spatially re-gridded to a 1.875° × 1.25° grid (UKEMS1-0-LL resolution) using the bilinear interpolation method. No bias adjustment or statistical downscaling is applied, as the primary goal of this study is to evaluate large-scale emission changes in PM2.5 concentrations rather than reproducing local-scale values. Figure 2 illustrates the three subregional domains and the terrain height of EA, as analyzed in this study. The red squares denote East China (EC), Korea (KO), and Japan (JP). This study involved a comprehensive investigation of the characteristics of the three East Asian subregions. The emission inventories underlying SSP3-7.0 are developed by integrated assessment modeling teams and harmonized across models and scenarios [25], but regional discrepancies and uncertainties remain due to differences in data availability and rapid emission changes in East Asia [30]. While our analysis captures the climate model response to the prescribed emissions, the absolute magnitude of projected PM2.5 concentrations should be interpreted with caution.

2.2. PM2.5 Air Quality Index

For the three models that do not directly provide total PM2.5 concentrations, we followed previous studies [31,32] to estimate total PM2.5 concentrations (Equation (1)). In this equation, black carbon (BC), OA, SO4, DU, and SS represent the surface mass mixing ratios of BC, organic aerosol (OA), sulfur aerosol (SO4), dust (DU), and sea-salt (SS) particles, respectively. The conversion factors of 0.1 and 0.2 represent the contributions of DU and SS to the PM2.5 size fraction, respectively [33,34,35]. Notably, these factors depend on the specific aerosol scheme and simulated aerosol size distribution in a particular model. While this PM2.5 approximation method involves inherent uncertainty, it facilitates both a comprehensive and uniform estimation of PM2.5 across all models.
PM2.5 = BC + OA + SO4 + (0.1 × DU) + (0.25 × SS)
Additionally, the analyzed regions are classified into seven categories based on the WHO AQGs of September 2021 (Table 2) to define changes in air quality levels. The new WHO AQGs are ambitious and reflect the significant impact of air pollution on global health [30]. Higher air quality index (AQI) values indicate severe air pollution and potentially higher health risks, which can lead to a significant financial burden on society. For example, a value of “0 (AQG)” denotes a favorable air quality level with minimal or no potential risks to public health, while interim target 1 indicates that air pollution may increase mortality risk by 5 to 7 times compared to the AQG level.

3. Results

3.1. Contribution of NTCF and O3 Precursor Emissions to Present-Day Air Quality

Evaluation of the present-day (PD; 1995–2014) period provides confidence in the reliability of the climate model and its responses to future emissions. To this end, simulated PM2.5 concentrations in the PD period are compared with ground-based observations from 20 monitoring sites in China, South Korea, and Japan (Table S1). The CMIP6 ensemble captures the large-scale spatial variability reasonably well (positive correlations between ensemble and observation with a p-value of 0.0004), although localized underestimation is evident in parts of northern China (Figure S1).
Figure 3 presents the estimated changes in the annual mean PM2.5 concentration for the historical period from 1850 to 2014. The observed historical increase in PM2.5 during this period is predominantly attributable to the substantial increase in anthropogenic aerosol and aerosol precursor emissions [36]. The estimated PM2.5 concentrations exhibited analogous trends until 1950. As shown in Figure 3, the impact of the substantial increase in BC, OA, and SO4 components became apparent after the 1950s. The current average PM2.5 concentration in the present-day period is approximately 14.3 ± 2.6 μg/m3 (AQI = 3) for the EA region. A comparison between histSST and the corresponding perturbation experiment (histSST-piNTCF minus histSST) revealed a substantial reduction in PM2.5 concentrations, with a decrease of approximately 43% (−6.14 μg/m3) across the EA region during the PD period in the histSST-piNTCF simulation. Additionally, a comparatively negligible change of approximately −10.0% (1.29 μg/m3) in PM2.5 concentration is observed in the histSST-piO3. These results indicate that combined anthropogenic aerosol emissions (NTCFs) substantially impact PM2.5 concentrations during the PD period, contributing to a two-level increase in the WHO AQI across the EA region. Furthermore, according to the pre-2021 WHO AQGs (PM2.5 concentrations below 10 μg/m3), the recommended levels would have been achieved without NTCF emissions. However, under the 2021 WHO AQI classification, this concentration now corresponds to a level 1 AQI.
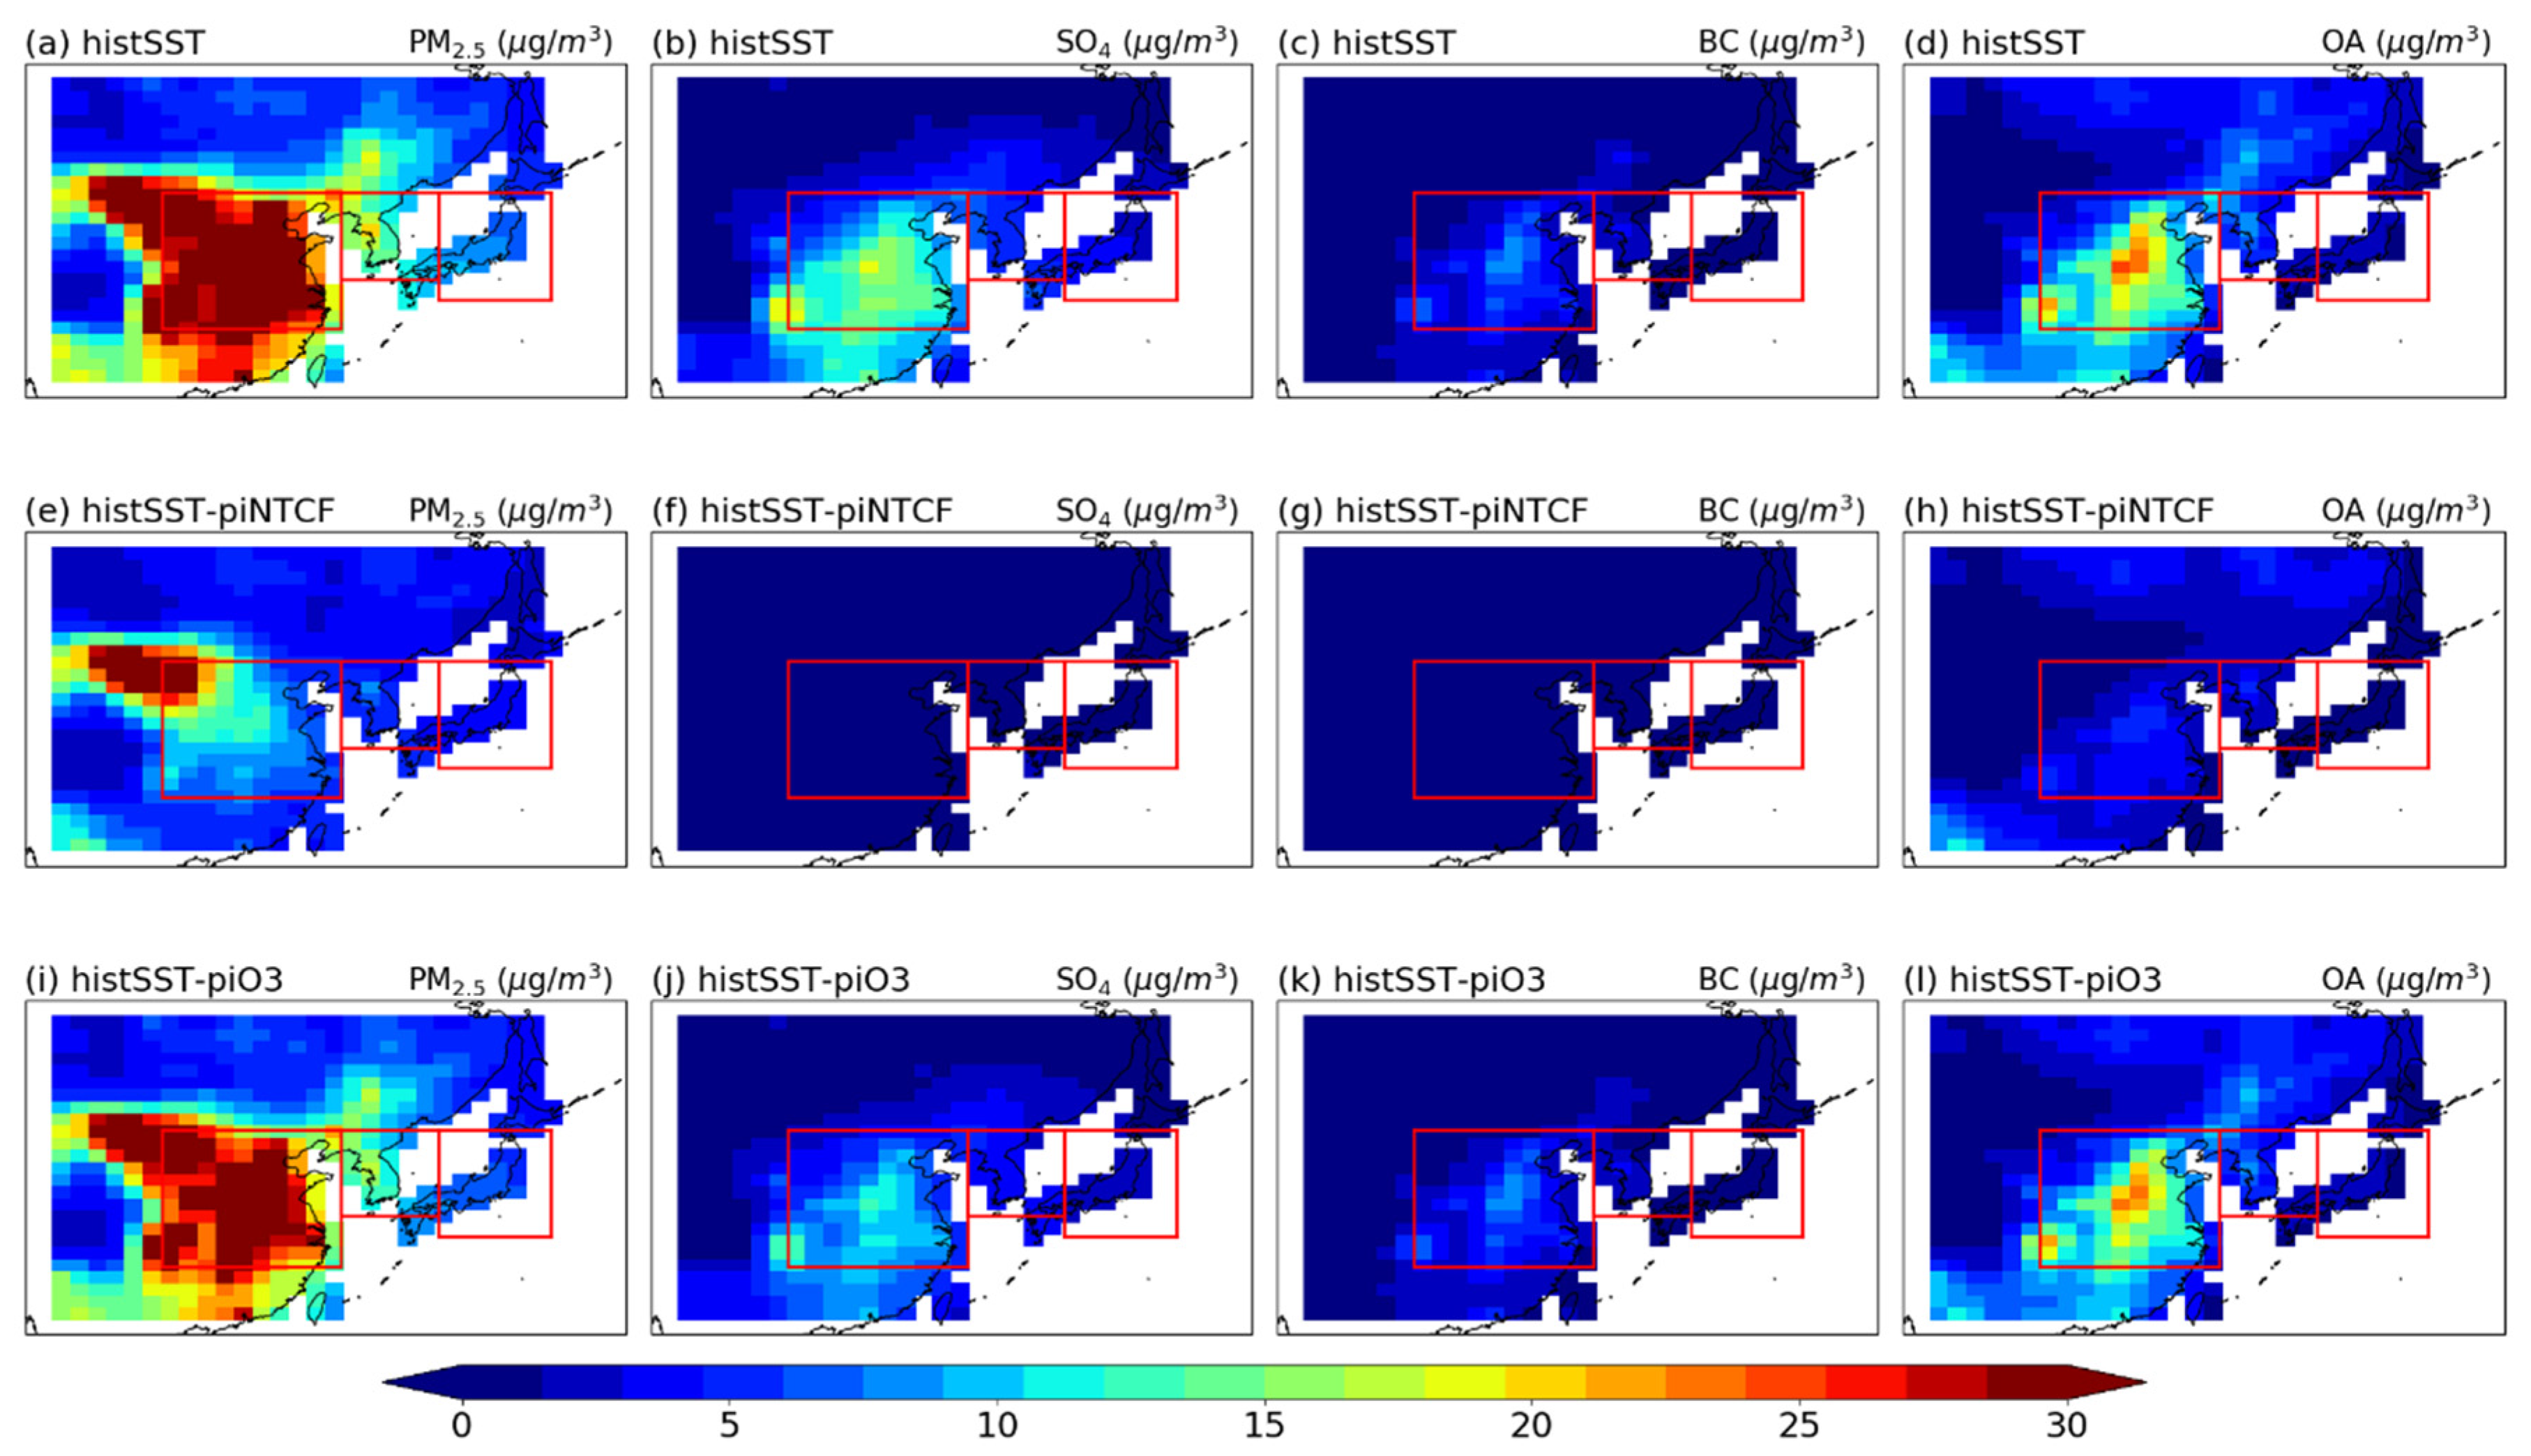
As demonstrated in Figure 4, changes in regional PM2.5 concentrations and their major contributing components resulting from reductions in historical emissions of NTCF and O3 precursors are evident. The EC region exhibited the most substantial PM2.5 concentrations (32.43 μg/m3), approximately double that observed in the EA region. Conversely, the PM2.5 concentrations in KO (13.71 μg/m3) and JP (7.51 μg/m3) are lower than those in EA (Figure 4a). Furthermore, the AQI levels in the three subregions are 4, 2, and 1 in EC, KO, and JP, respectively. This analysis indicates that even in JP, where regional emissions of major components are notably low (Figure 4b–d), air pollutant levels during the PD period are severe enough to exceed the WHO AQGs. Furthermore, the decline in historical NTCF emissions led to a substantial decrease in PM2.5 concentrations, with reductions of approximately 64.6%, 64.6%, and 51.8% in the EC (11.49 μg/m3; AQI = 2), KO (4.85 μg/m3; AQI = AQG), and JP (3.62 μg/m3; AQI = AQG) regions (Figure 4e), respectively. It is evident from Figure 3 that the three major components (BC, OA, and SO4) underwent significant changes due to reductions in NTCF emissions. Changes in SO4 (Figure 4b,f) and OA (Figure 4d,h) emissions account for approximately 87% of the historical variations in PM2.5 across all subregions.
Furthermore, the simulation indicates that reducing O3 precursor emissions to pre-industrial levels (histSST-piO3 experiment) would result in a 10% decrease in PM2.5 concentrations in EA (13.11 ± 2.3 μg/m3) during the PD period, primarily attributable to reductions in OA and SO4. This reduction corresponds to approximately 10.8%, 13.1%, and 14.5% in EC (28.92 μg/m3), KO (11.91 μg/m3), and JP (6.42 μg/m3), respectively. Similarly, the changes in OA (Figure 4b,j) and SO4 (Figure 4d,l) emissions account for the changes in PM2.5 concentrations during the PD period, which are attributable to the influence of O3 precursors. This analysis indicates that the emissions of O3 precursors exhibit a negligible impact compared to that of NTCF during the PD period. However, the EC region continues to experience substantial air pollution (Figure 4i), as indicated by level 4 of AQI classification. Overall, the comprehensive analysis underscores the pivotal role of OA and SO4 concentrations, resulting from anthropogenic aerosol emissions, in determining PM2.5 concentrations during the PD period.

3.2. Impact of Mitigation Efforts on Future PM2.5 Changes

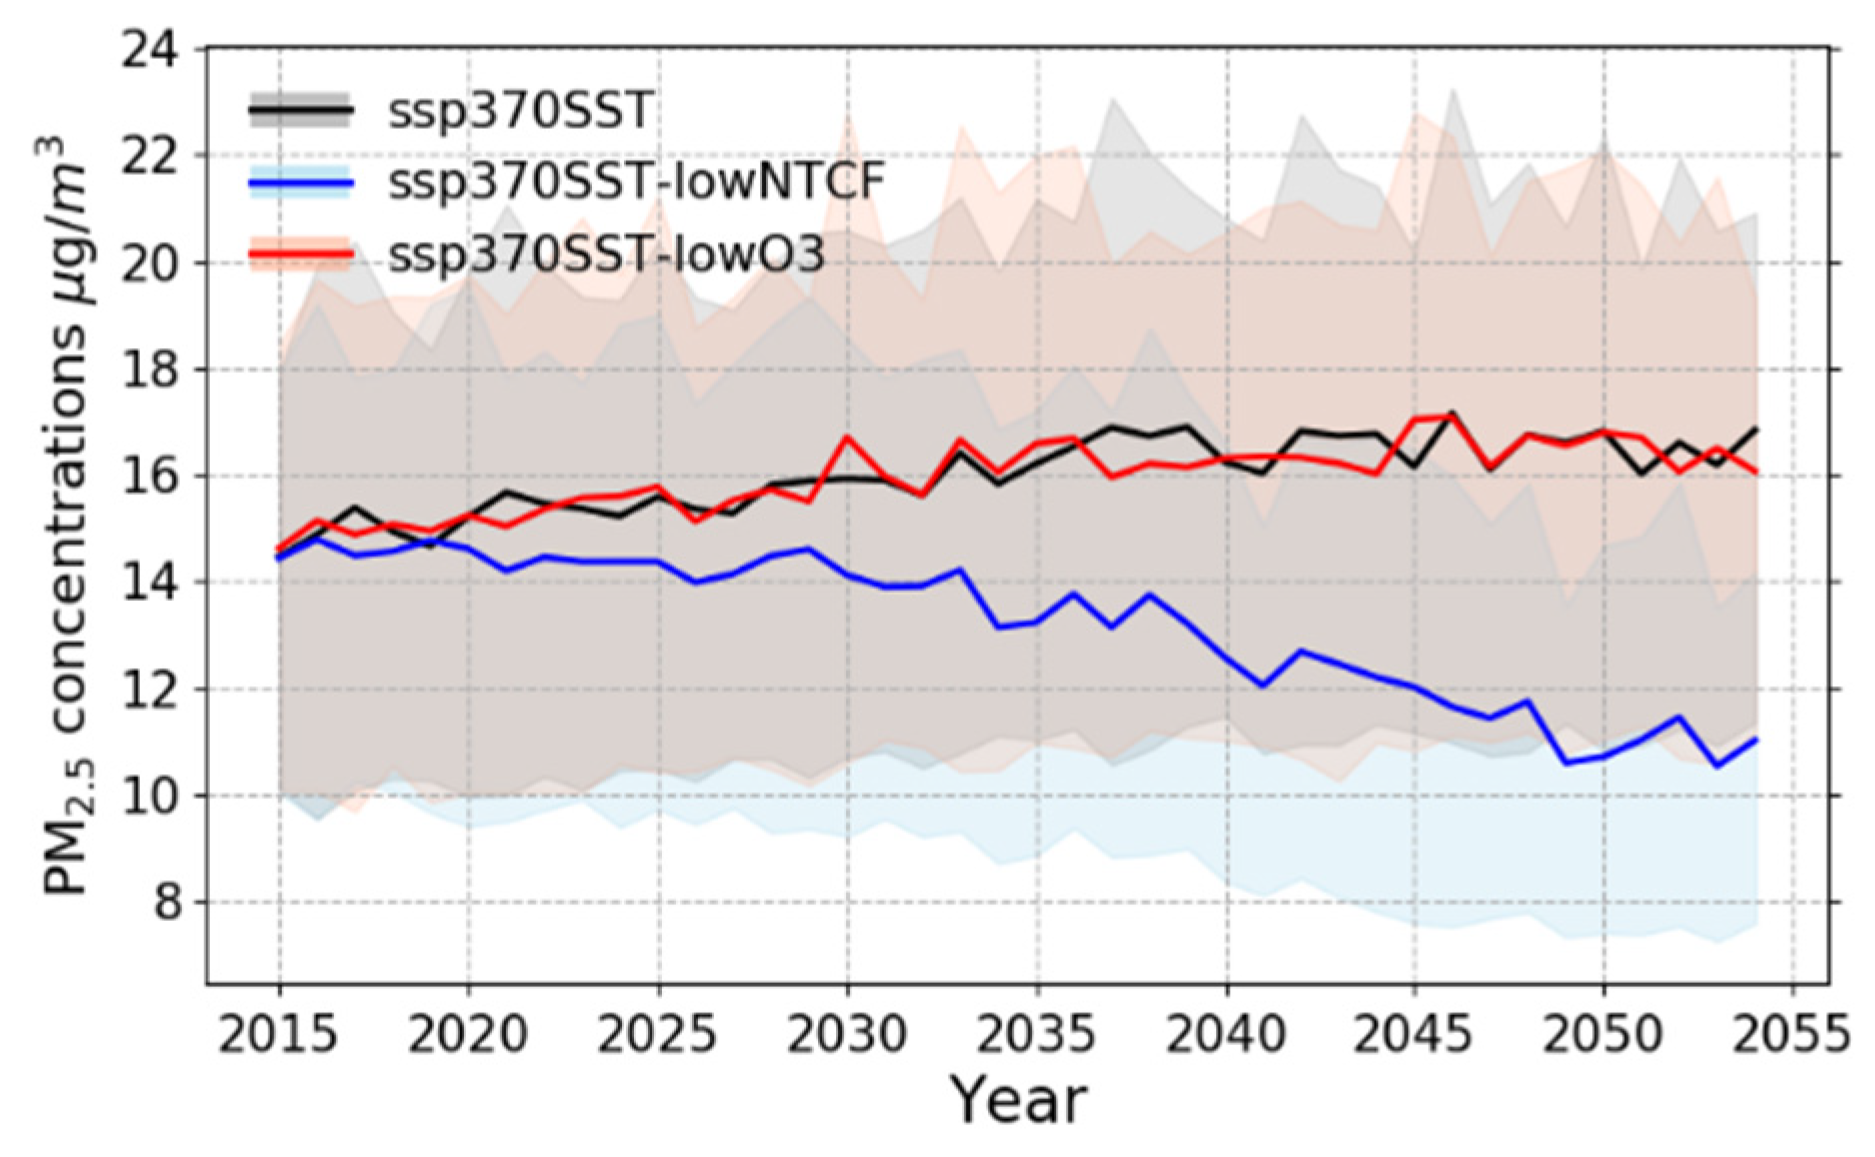
Figure 5 illustrates the simulated changes in annual mean PM2.5 concentrations based on the ssp370SST experiment and its associated perturbation experiments (ssp370SST-lowO3 and ssp370SST-lowNTCF) for the period 2015–2054. Under the ssp370 scenario, PM2.5 concentrations in the EA region are projected to increase by 16% (approximately 2 μg/m3) in the near term, compared to that of the PD period (ssp370SST minus histSST). This increasing trend is accompanied by heightened emissions of BC, SO4, and OA, with the AQI of EA region remaining in level 3 category. Conversely, a substantial decline in PM2.5 concentrations of up to 40% (Figure 5) is projected in the EA region under the strong mitigation scenario (ssp370SST-lowNTCF minus ssp370SST) during the near-term future period (2045–2054). Under the low NTCF scenario, projected PM2.5 concentrations in EA for the near future are estimated to be approximately 11.21 ± 0.8 μg/m3, corresponding to an AQI classified as level 2. This result indicates that, despite significant reductions in NTCF emissions under the SSP1 scenario, emission levels are expected to remain comparable to those observed in the late 1900s. Consequently, the likelihood of meeting the WHO AQG classification in the near-term future appears low. Furthermore, this analysis indicates that reductions in two of the three primary components (SO4 and OA) account for over 60% of the total decrease in PM2.5 levels. This finding underscores the need to strengthen emission reduction efforts targeting the key factors influencing air quality within current policy frameworks to achieve the AQG level. In the low O3 scenario, projected PM2.5 concentrations in EA for the near-term future correspond to an AQI of level 3. This analysis indicates that the low O3 scenario does not significantly impact PM2.5 concentrations in the near-term future. In conclusion, these findings indicate that reducing individual component precursors has a limited effect on improving PM2.5 levels, consistent with previous studies reporting minimal benefits from targeting the reduction in individual components.
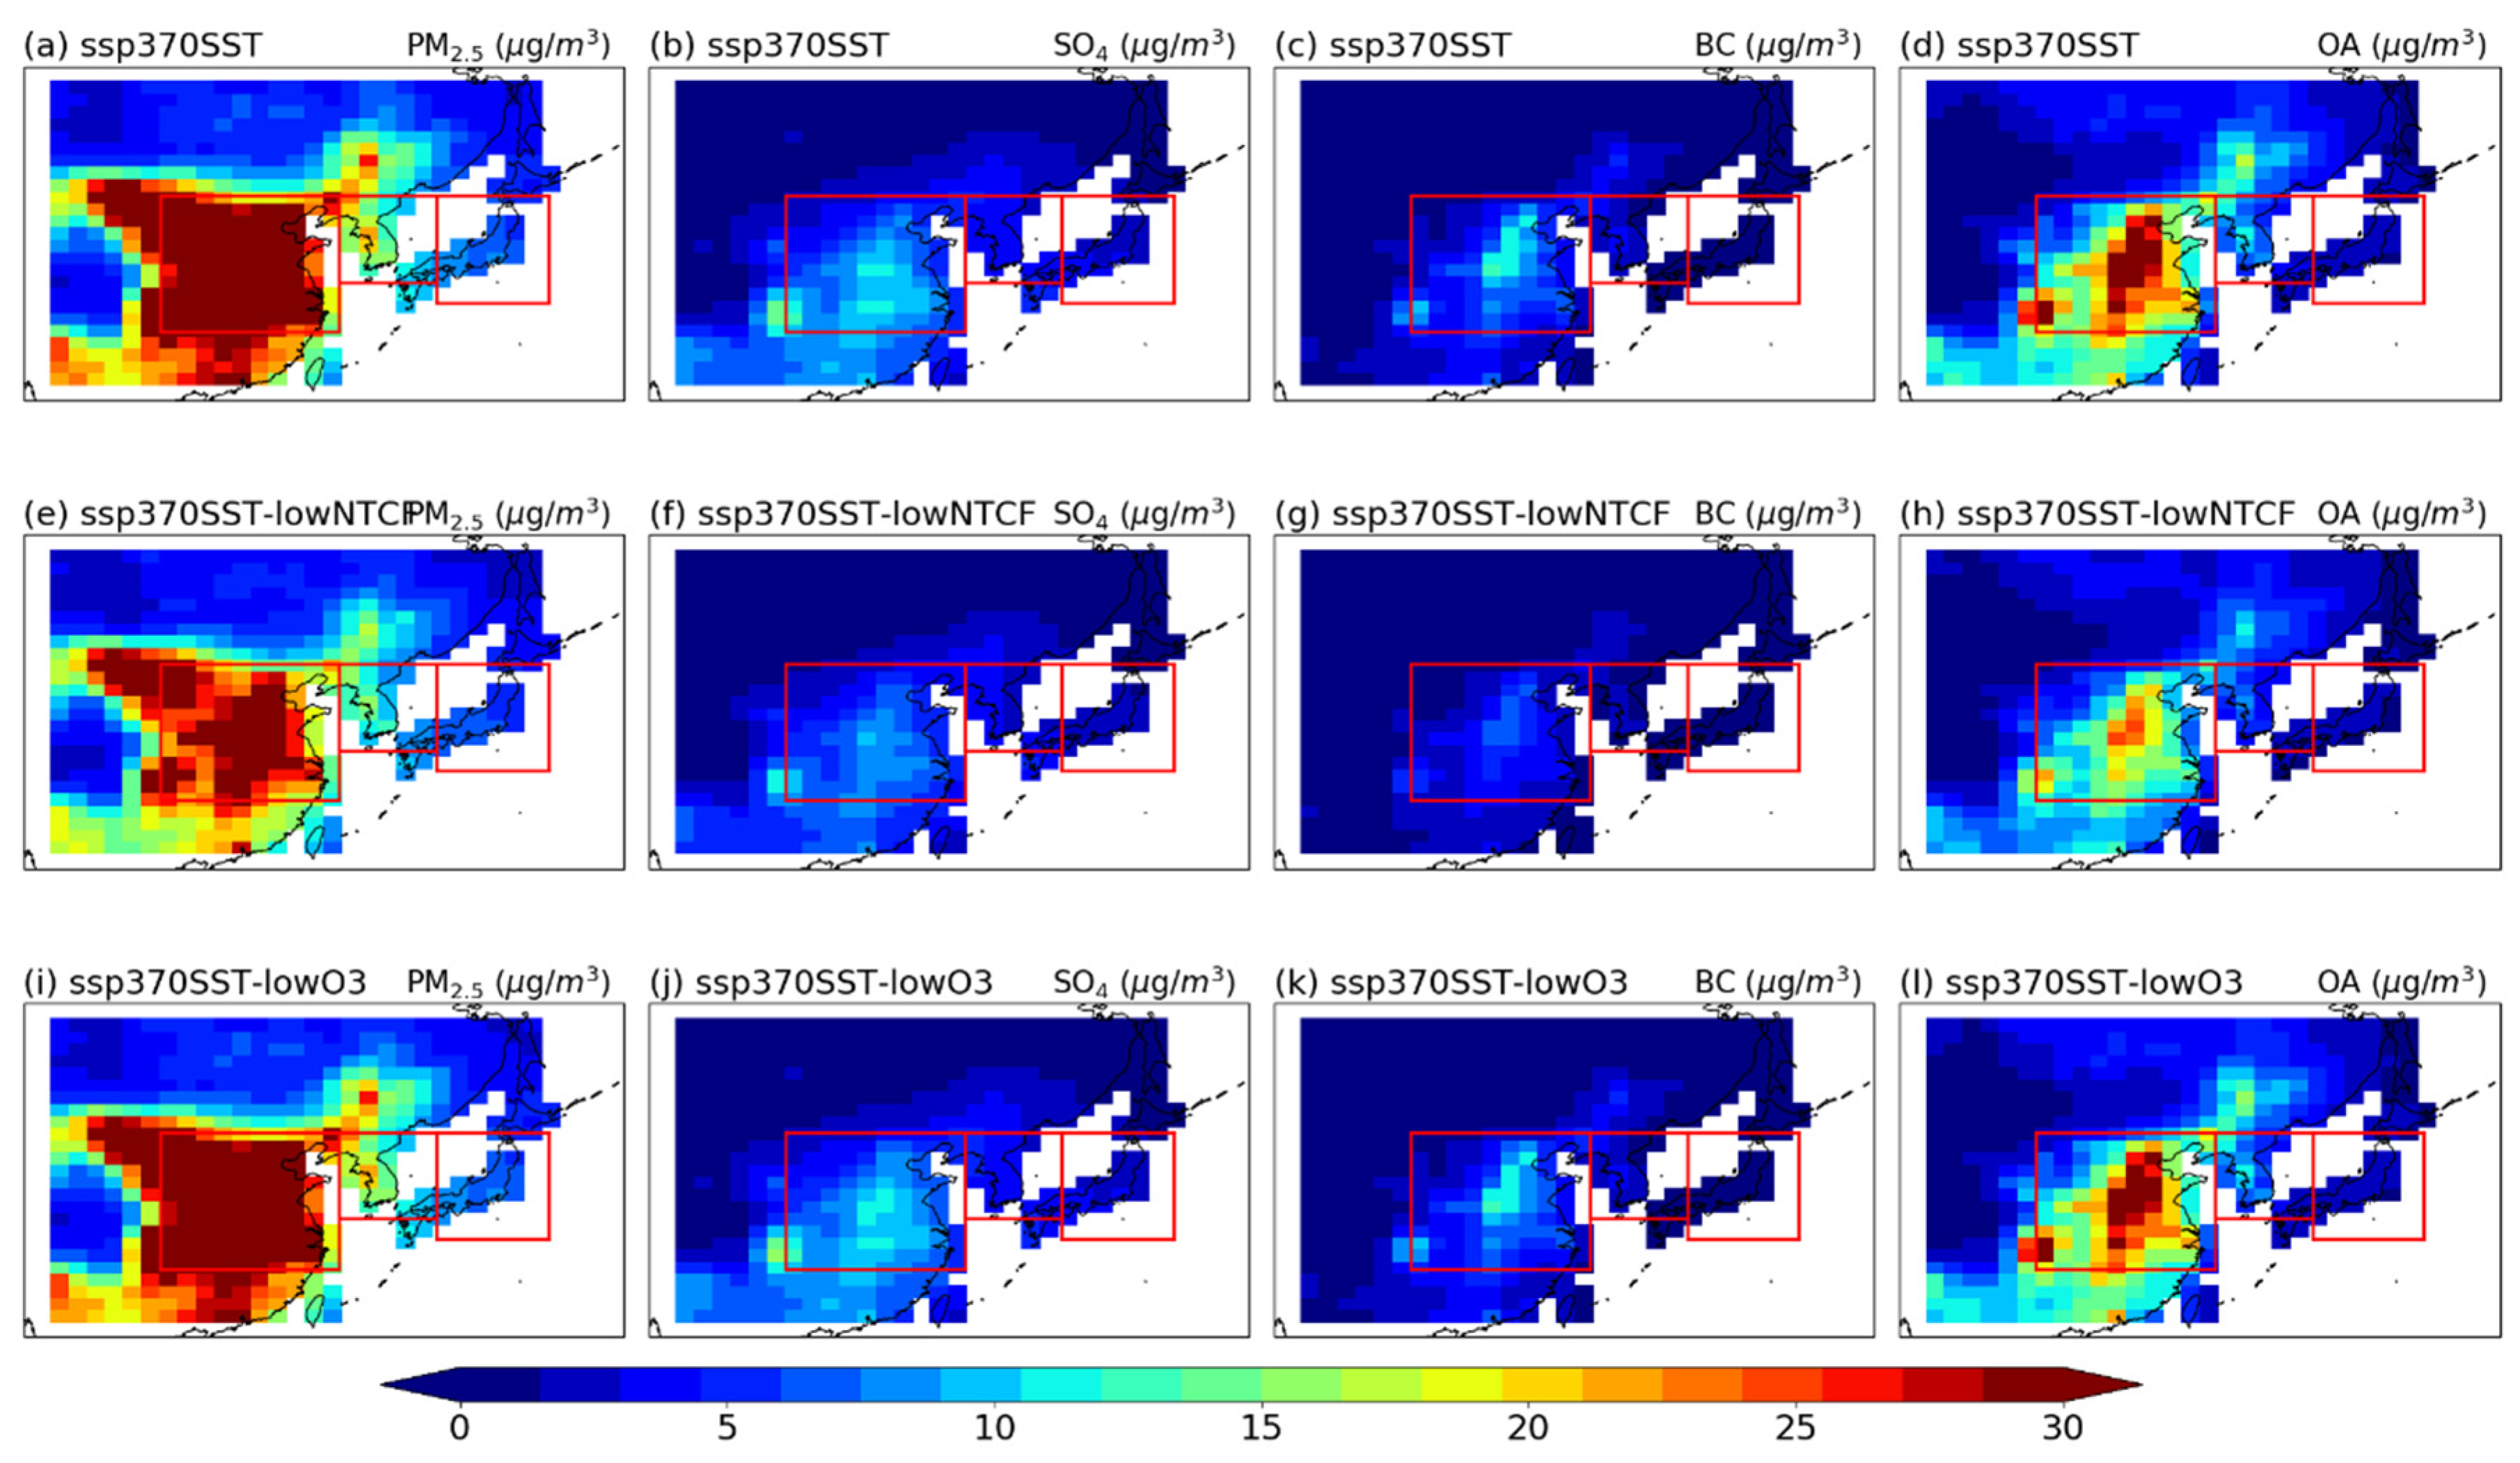
Figure 6 illustrates the spatial distribution of projected future changes in PM2.5 levels across EA under the SSP370 scenario, including reduction scenarios for NTCF and ozone precursor emissions. The spatial patterns resemble those observed during the current climate period, with the highest projected PM2.5 concentration of 35 µg in the EC region, corresponding to an AQI level of 5. This concentration is nearly double that in the EA region. In the KO and JP regions, PM2.5 concentrations are predicted to increase by approximately 2 μg/m3 under the SSP370 scenario in the near future. Although this increase is not sufficient to raise the AQI level by one category, it underscores the persistent challenges posed by air pollution. The observed consistency of these spatial distributions with the PD periods highlights the significance of major emission sources in shaping future air quality.
The strong NTCF mitigation scenario in the ssp370SST-lowNTCF experiment demonstrates substantial reductions in PM2.5 concentrations, with decreases of 11.21 ± 0.8 μg/m3 (~20% relative to the PD period) during the near-term future period (2045–2054). Projections indicate that future PM2.5 concentrations in EA under the NTCF emission reduction policies are expected to decrease by approximately 20–40% compared to those of the SSP370 scenario. The EC region is projected to undergo the most substantial reduction, exceeding 40%, followed by the KO and JP regions, which are expected to experience reductions of approximately 30%. These decreases are primarily attributed to reductions in BC, OA, and SO4 (Figure 6f–h).
Notably, reductions in OA and SO4 contribute approximately 50–60% of the overall decrease in PM2.5 concentrations in the EA region under the NTCF emission reduction policy. In the EC region, the reduction in OA is particularly significant, accounting for approximately 70% of the decrease in PM2.5 concentrations (Figure 6h). In contrast, PM2.5 concentrations are projected to remain largely unchanged under air quality improvement policies that focus solely on reducing ozone precursors. Given the short atmospheric residence time of these substances, which include both aerosols and ozone precursors, the analysis suggests that while reductions in precursors may directly affect key components, the chemical effects of changes in ozone precursors are more pronounced. This interpretation aligns with previous studies [29,32] demonstrating greater variability in the responses of specific aerosols and chemical constituents at the regional scale.
Furthermore, the decline in historical NTCF emissions has led to a substantial decrease in PM2.5 concentrations, with estimated reductions of approximately 64.6%, 64.6%, and 51.8% for the EC (11.49 μg/m3; AQI = 2), KO (4.85 μg/m3; AQI = AQG), and JP (3.62 μg/m3; AQI = AQG) regions (Figure 4e), respectively. Consideration of the three primary components (BC, OA, and SO4) displayed in Figure 4 reveals that changes in SO4 (Figure 4b,f) and OA (Figure 4d,h) emissions resulting from NTCF reductions account for approximately 87% of the historical fluctuations in PM2.5 across all subregions.

4. Discussion

This study investigates the impact of NTCFs and O3 precursor emissions on PM2.5 concentrations in EA. Using the CMIP6 AerChemMIP dataset, we perform a comprehensive analysis of both historical trends (1850–2014) and near-term future (2015–2054) across three subregions: EC, KO, and JP. The analysis result shows that the present-day (1995–2014) average PM2.5 concentration across EA is 14.3 ± 2.6 μg/m3, and there are substantial regional variations exhibited across the EC (32.43 μg/m3), KO (13.71 μg/m3), and JP (7.51 μg/m3) regions. These levels correspond to the WHO AQI levels of 4, 2, and 1, respectively, all of which exceed the WHO’s most stringent AQGs. This study demonstrates that NTCF emissions significantly impact PM2.5 levels, with potential reductions of approximately 43% compared to only approximately 10% from reductions in O3 precursors. Projections under the SSP3-7.0 scenario indicate that PM2.5 concentrations are expected to increase by 16% in the near-term future. However, the implementation of robust NTCF mitigation policies (ssp370SST-lowNTCF) has the potential to reduce future PM2.5 levels by approximately 40% across EA, with EC potentially experiencing reductions exceeding 40%. Despite the substantial projected improvements under strong mitigation scenarios, our study concludes that achieving the WHO’s most stringent AQGs remains challenging. The findings underscore the importance of developing and implementing enhanced multi-pollutant mitigation strategies where pollution levels remain critically high even under mitigation scenarios.
This study found AQI levels of 3, 4, 2, and 1 for PM2.5 concentrations in the histSST scenario in the EA, EC, KO, and JP regions, respectively. All of these concentrations exceed WHO AQGs, with EC experiencing particularly severe pollution (AQI = 4). In the absence of air quality improvement policies (ssp370SST scenario), PM2.5 concentrations are 16.51 ± 0.9 μg/m3 (AQI = 3) in EA, 36.11 μg/m3 (AQI = 5) in EC, 13.11 μg/m3 (AQI = 2) in KO, and 7.09 μg/m3 (AQI = 1) in JP. These concentrations represent increases of approximately 1~4 μg/m3 in PM2.5 levels compared to those of the histSST scenario. Notably, the PM2.5 concentrations in EC, indicated by an AQI of 5, signify severe air pollution exceeding the WHO target level. To assess the impact of these pollutants, a comparative analysis of PM2.5 concentrations under the lowNTCF scenario showed concentrations ranging from 11.21 ± 0.8 μg/m3 in EA to 27.38 μg/m3 in EC, 11.17 μg/m3 in KO, and 5.96 μg/m3 in JP. Specifically, in EC, the AQI 5 in the ssp370SST scenario is reduced to AQI 3 in the lowNTCF scenario, indicating a 24.2% decrease in PM2.5 concentrations. This reduction is the most significant compared to that of other regions. In the EA region, a one-level reduction in AQI is observed, accompanied by a 21.4% decrease in PM2.5 concentrations due to reduced NTCFs. The AQI in the KO region is recorded at level 2 with a 24.0% decrease in PM2.5 concentrations as a result of reducing NTCFs. To investigate the underlying causes of this additional pollution, PM2.5 concentrations in the lowO3 scenario were examined. PM2.5 concentrations were recorded at 16.56 ± 0.8 μg/m3 (AQI = 3) in EA, 36.12 μg/m3 (AQI = 5) in EC, 14.74 μg/m3 (AQI = 2) in KO, and 7.1 μg/m3 (AQI = 1) in JP. These results are analogous to the PM2.5 concentrations in the ssp370SST scenario, suggesting that the impact of O3 on air quality improvement policies is likely negligible. Overall, PM2.5 concentrations in EA, EC, and KO (excluding JP) remained severe under the low-NTCF scenario (AQI levels of 2 or higher), corresponding to values two to three times that of the WHO AQGs. This study’s results indicate that a substantial reduction in NTCFs is needed to efficiently lower PM2.5 concentrations in EA. Policymakers and researchers should consider this and carefully formulate appropriate air quality improvement policies for EA and KO. As Turnock et al. [37] has also noted, climate change will substantially impact regional NTCFs. This consideration must be incorporated into the design of mitigation strategies aimed at reducing anthropogenic emissions. Additionally, this study enhances clarity and flow by linking large-scale climate modeling to practical air quality and health policy targets in East Asia. By comparing projected concentrations to the updated WHO AQGs, it offers unique insights that extend beyond previous CMIP6-based research.
However, this study has several limitations that should be addressed in future work. First, the analysis is based on a limited number of CMIP6 AerChemMIP models with single realizations, which constrains the ability to fully quantify internal climate variability and model uncertainty. Including multi-model and multi-member ensembles in future analysis would provide a more robust characterization of uncertainty and increase confidence in the results. Considering this, future research directions are highly feasible due to CMIP7 fast tracks, which include many foundational experiments related to AerChemMIP [38]. Second, while this study focuses on large-scale responses, the coarse spatial resolution of global climate models limits their ability to resolve fine-scale variability and complex topographic influences over East Asia. Future studies should examine potential regional-scale changes by considering the specific physical processes of atmospheric chemistry and aerosol interactions in individual models. Also, it will be necessary to consider applying a downscaling method to improve the spatial resolution. Finally, although we briefly discuss the potential feedback effects of NTCF reductions on regional climate, a more detailed investigation into the interactions among emission reductions, atmospheric composition, and climate variables such as temperature and precipitation is needed. Addressing these aspects will lead to a more comprehensive understanding of the co-benefits and trade-offs of NTCF mitigation strategies in East Asia.
Furthermore, reducing sulfate aerosols (SO) and organic aerosols (OAs) has been shown to effectively lower PM2.5 concentrations. However, this may also lead to unintended climatic consequences. Reducing sulfate aerosols could increase shortwave radiation reaching the Earth’s surface, which could potentially accelerate global warming if greenhouse gas mitigation efforts are not implemented simultaneously. This highlights the importance of considering the co-benefits of air quality policies within the broader context of climate change mitigation. Therefore, our findings should not be interpreted as a simple endorsement of prioritizing sulfate reductions alone. Instead, they emphasize the necessity for integrated strategies that address both greenhouse gases and air pollutants, maximizing air quality benefits while minimizing negative climate effects. Future policy frameworks must carefully balance these factors.

Supplementary Materials

The following supporting information can be downloaded at: https://www.mdpi.com/article/10.3390/cli13090191/s1, Figure S1: (a) Spatial distribution of PM2.5 concentrations from CMIP6 ensemble used in this study with 20 ground-based monitoring data (white circles) for PD period. (b) Scatter plot and regression line of simulated and observed PM2.5 concentration at 20 sites; Table S1: Annual mean PM2.5 concentrations at each ground-based monitoring cites in China, South Korea, and Japan used in previous studies (Ikeda et al., 2014 [39], Wang et al., 2015 [40]).

Author Contributions

Conceptualization, H.M.S., P.-H.C. and K.-O.B.; Methodology, H.M.S. and J.-H.L.; Software, J.-H.L.; Validation, J.K. and P.-H.C.; Formal analysis, H.M.S., P.-H.C. and K.-O.B.; Investigation, J.-H.L.; Resources, J.-H.L.; Data curation, J.-H.L.; Writing—original draft, H.M.S.; Writing—review & editing, H.M.S., H.L., P.-H.C. and K.-O.B.; Visualization, J.-H.L. and J.K.; Project administration, H.M.S.; Funding acquisition, K.-O.B. All authors have read and agreed to the published version of the manuscript.

Funding

This research was funded by the Korea Meteorological Administration Research and Development Program “Development and Assessment of Climate Change Scenario” under Grant (KMA2018-00321).

Conflicts of Interest

The authors declare no conflict of interest.

References

  1. Cohen, A.J.; Brauer, M.; Burnett, R.; Anderson, H.R.; Frostad, J.; Estep, K.; Balakrishnan, K.; Brunekreef, B.; Dandona, L.; Dandona, R.; et al. Estimates and 25-year trends of the global burden of disease attributable to ambient air pollution: An analysis of data from the global burden of diseases study 2015. Lancet 2017, 389, 1907–1918. [Google Scholar] [CrossRef]
  2. World Health Organization. WHO global air quality guidelines. In Particulate Matter (PM2.5 and PM10), Ozone, Nitrogen Dioxide, Sulfur Dioxide and Carbon Monoxide; World Health Organization: Geneva, Switzerland, 2021. [Google Scholar]
  3. Im, U.; Bauer, S.E.; Frohn, L.M.; Geels, C.; Tsigaridis, K.; Brandt, J. Present-day and future PM2.5 and O3-related global and regional premature mortality in the EVAv6.0 health impact assessment model. Environ. Res. 2023, 216, 114702. [Google Scholar] [CrossRef]
  4. Murray, C.J.L.; Aravkin, A.Y.; Zheng, P.; Abbafati, C.; Abbas, K.M.; Abbasi-Kangevari, M.; Abd-Allah, F.; Abdelalim, A.; Abdollahi, M.; Abdollahpour, I.; et al. Global burden of 87 risk factors in 204 countries and territories, 1990–2019: A systematic analysis for the global burden of disease study 2019. Lancet 2020, 396, 1223–1249. [Google Scholar] [CrossRef] [PubMed]
  5. Burnett, R.; Chen, H.; Szyszkowicz, M.; Fann, N.; Hubbell, B.; Pope, C.A.; Apte, J.S.; Brauer, M.; Cohen, A.; Weichenthal, S.; et al. Global estimates of mortality associated with long-term exposure to outdoor fine particulate matter. Proc. Natl. Acad. Sci. USA 2018, 115, 9592–9597. [Google Scholar] [CrossRef] [PubMed]
  6. Vohra, K.; Vodonos, A.; Schwartz, J.; Marais, E.A.; Sulprizio, M.P.; Mickley, L.J. Global mortality from outdoor fine particle pollution generated by fossil fuel combustion: Results from GEOS-Chem. Environ. Res. 2021, 195, 110754. [Google Scholar] [CrossRef]
  7. Hoffmann, B.; Boogaard, H.; Nazelle, A.D.; Andersen, Z.J.; Abramson, M.; Brauer, M.; Brunekreef, B.; Forastiere, F.; Huang, W.; Kan, H.; et al. WHO air quality guidelines 2021–Aiming for healthier air for all: A joint statement by medical, public health, scientific societies and patient representative organisations. Int. J. Public Health 2021, 66, 1604465. [Google Scholar] [CrossRef] [PubMed]
  8. Fiore, A.M.; Naik, V.; Leibensperger, E.M. Air quality and climate connections. J. Air Waste Manag. Assoc. 2015, 65, 645–685. [Google Scholar] [CrossRef] [PubMed]
  9. Jacob, D.J.; Winner, D.A. Effect of climate change on air quality. Atmos. Environ. 2009, 43, 51–63. [Google Scholar] [CrossRef]
  10. Karlsson, M.; Alfredsson, E.; Westling, N. Climate policy co-benefits: A review. Clim. Policy 2020, 20, 292–316. [Google Scholar] [CrossRef]
  11. Rao, S.; Kilmont, Z.; Smith, S.J.; Dingenen, R.V.; Dentener, F.; Bouwman, L.; Riahi, K.; Amann, M.; Bodirsky, B.L.; Vuuren, D.P.V.; et al. Future air pollution in the Shared Socio-economic Pathways. Glob. Environ. Change 2017, 42, 346–358. [Google Scholar]
  12. Turnock, S.T.; Butt, E.W.; Richardson, T.B.; Mann, G.W.; Reddington, C.L.; Forster, P.M.; Haywood, J.; Crippa, M.; Janssens-Maenhout, G.; Johnson, C.E.; et al. The impact of European legislative and technology measures to reduce air pollutants on air quality, human health and climate. Environ. Res. Lett. 2016, 11, 024010. [Google Scholar] [CrossRef]
  13. Silver, B.; Conibear, L.; Reddington, C.L.; Knote, C.; Arnold, S.R.; Spracklen, D.V. Pollutant emission reductions deliver decreased PM2.5 -caused mortality across China during 2015–2017. Atmos. Chem. Phys. 2020, 20, 11683–11695. [Google Scholar]
  14. Wang, Y.; Hu, J.; Huang, L.; Li, T.; Yue, X.; Xie, X.; Liao, H.; Chen, K.; Wang, M. Projecting future health burden associated with exposure to ambient PM2.5 and ozone in China under different climate scenarios. Environ. Int. 2022, 169, 107542. [Google Scholar] [CrossRef]
  15. Wu, X.; Braun, D.; Schwartz, J.; Kioumourtzoglou, M.A.; Dominici, F. Evaluating the impact of long-term exposure to fine particulate matter on mortality among the elderly. Sci. Adv. 2020, 6, eaba5692. [Google Scholar] [CrossRef] [PubMed]
  16. Amann, M.; Klimont, Z.; Wagner, F. Regional and global emissions of air pollutants: Recent trends and future scenarios. Annu. Rev. Environ. Resour. 2013, 38, 31–55. [Google Scholar] [CrossRef]
  17. Zhao, Y.; Li, B.; Ni, J.; Liu, L.; Niu, X.; Liu, J.; Shao, J.; Du, S.; Chu, L.; Jin, J.; et al. Global spatial and temporal patterns of fine particulate concentrations and exposure risk assessment in the context of SDG indicator 11.6.2. Ecol. Indic. 2023, 155, 111031. [Google Scholar] [CrossRef]
  18. Shaddick, G.; Thomas, M.L.; Mudu, P.; Ruggeri, G.; Gumy, S. Half the world’s population are exposed to increasing air pollution. NPJ Clim. Atmos. Sci. 2020, 3, 23. [Google Scholar] [CrossRef]
  19. Shi, Z.; Song, C.; Liu, B.; Lu, G.; Xu, J.; Vu, T.V.; Elliott, R.J.R.; Li, W.; Bloss, W.J.; Harrison, R.M. Abrupt but smaller than expected changes in surface air quality attributable to COVID-19 lockdowns. Sci. Adv. 2021, 7, eabd6696. [Google Scholar] [CrossRef]
  20. Xu, L.; Zhang, J.; Sun, X.; Xu, S.; Shan, M.; Yuan, Q.; Liu, L.; Du, Z.; Liu, D.; Xu, D.; et al. Variation in concentration and sources of black carbon in a megacity of China during the COVID-19 pandemic. Geophys. Res. Lett. 2020, 47, e2020GL090444. [Google Scholar]
  21. Sangkham, S.; Phairuang, W.; Sherchan, S.P.; Pansakun, N.; Munkong, N.; Sarndhon, K.; Islam, M.A.; Sakunkoo, P. An update on adverse health effects from exposure to PM2.5. Environ. Adv. 2024, 18, 100603. [Google Scholar] [CrossRef]
  22. Chen, J.; Zheng, D.; Wen, W.; Wieser, L.; Kiesewetter, G.; Wang, C.; Zhang, S.; Lin, H. Temporal trend of cause-specific mortality burden attributable to ambient PM2.5 from different sectors and fuel types across Chinese provinces during 2015–2022. Environ. Res. 2025, 285, 122507. [Google Scholar] [CrossRef]
  23. Collins, W.J.; Lamarque, J.F.; Schulz, M.; Boucher, O.; Eyring, V.; Hegglin, M.I.; Maycock, A.; Myhre, G.; Prather, M.; Shindell, D.; et al. AerChemMIP: Quantifying the effects of chemistry and aerosols in CMIP6. Geosci. Model Dev. 2017, 10, 585–607. [Google Scholar] [CrossRef]
  24. Romanello, M.; McGushin, A.; Napoli, C.D.; Drummond, P.; Hughes, N.; Jamart, L.; Kennard, H.; Lampard, P.; Rodriguez, B.S.; Arnell, N.; et al. The 2021 report of the Lancet countdown on health and climate change: Code red for a healthy future. Lancet 2021, 398, 1619–1662. [Google Scholar] [CrossRef]
  25. Gidden, M.J.; Riahi, K.; Smith, S.J.; Fujimori, S.; Luderer, G.; Kriegler, E.; Vuuren, D.P.V.; Berg, M.V.D.; Feng, L.; Klein, D.; et al. Global emissions pathways under different socioeconomic scenarios for use in CMIP6: A dataset of harmonized emissions trajectories through the end of the century. Geosci. Model Dev. 2019, 12, 1443–1475. [Google Scholar] [CrossRef]
  26. Williams, D.N.; Balaji, V.; Cinquini, L.; Denvil, S.; Duffy, D.; Evans, B.; Ferraro, R.; Hansen, R.; Lautenschlager, M.; Trenham, C. A global repository for planet-sized experiments and observations. Bull. Am. Meteorol. Soc. 2016, 97, 803–816. [Google Scholar] [CrossRef]
  27. Erying, V.; Bony, S.; Meehl, G.A.; Senior, C.A.; Stevens, B.; Stouffer, R.J.; Taylor, K.E. Overview of the coupled model intercomparison project phase 6 (CMIP6) experimental design and organization. Geosci. Model Dev. 2016, 9, 1937–1958. [Google Scholar] [CrossRef]
  28. Deser, C.; Phillips, A.S.; Bourdette, V.; Teng, H. Uncertainty in climate change projections: The role of internal variability. Clim. Dyn. 2012, 38, 527–546. [Google Scholar]
  29. Ren, L.; Yang, Y.; Wang, H.; Wang, P.; Yue, X.; Liao, H. Co-benefits of mitigating aerosol pollution to future solar and wind energy in China toward carbon neutrality. Geophys. Res. Lett. 2024, 51, e2024GL109296. [Google Scholar]
  30. Feng, L.; Smith, S.J.; Braun, C.; Crippa, M.; Gidden, M.J.; Hoesly, R.; Klimont, Z.; van Marle, M.; van den Berg, M.; van der Werf, G.R. The generation of gridded emissions data for CMIP6. Geosci. Model Dev. 2020, 13, 461–482. [Google Scholar] [CrossRef]
  31. Turnock, S.T.; Allen, R.J.; Andrews, M.; Bauer, S.E.; Deushi, M.; Emmons, L.; Good, P.; Horowitz, L.; John, J.G.; Michou, M.; et al. Historical and future changes in air pollutants from CMIP6 models. Atmos. Chem. Phys. 2020, 20, 14547–14579. [Google Scholar] [CrossRef]
  32. Shim, S.; Sung, H.; Kwon, S.; Kim, J.; Lee, J.; Sun, M.; Song, J.; Ha, J.; Byun, Y.; Kim, Y.; et al. Regional features of long-term exposure to PM2.5 air quality over Asia under SSP scenarios based on CMIP6 models. Int. J. Environ. Res. Public Health 2021, 18, 6817. [Google Scholar] [CrossRef]
  33. Fiore, A.M.; Naik, V.; Spracklen, D.V.; Steiner, A.; Unger, N.; Prather, M.; Bergmann, D.; Cameron-Smith, P.J.; Cionni, I.; Collins, W.J.; et al. Global air quality and climate. Chem. Soc. Rev. 2012, 41, 6663–6683. [Google Scholar] [CrossRef]
  34. Silva, R.A.; West, J.J.; Lamarque, J.F.; Shindell, D.T.; Collins, W.J.; Faluvegi, G.; Folberth, G.A.; Horowitz, L.W.; Nagashima, T.; Naik, V.; et al. Future global mortality from changes in air pollution attributable to climate change. Nat. Clim. Change 2017, 7, 647–651. [Google Scholar] [CrossRef]
  35. Allen, R.J.; Turnock, S.; Nabat, P.; Neubauer, D.; Lohmann, U.; Olivié, D.; Oshima, N.; Michou, M.; Wu, T.; Zhang, J.; et al. Climate and air quality impacts due to mitigation of non-methane near-term climate forcers. Atmos. Chem. Phys. 2020, 20, 9641–9663. [Google Scholar] [CrossRef]
  36. Hoesly, R.M.; Smith, S.J.; Feng, L.; Klimont, Z.; Janssens-Maenhout, G.; Pitkanen, T.; Seibert, J.J.; Vu, L.; Andres, R.J.; Bolt, R.M.; et al. Historical (1750–2014) anthropogenic emissions of reactive gases and aerosols from the Community Emissions Data System (CEDS). Geosci. Model Dev. 2018, 11, 369–408. [Google Scholar] [CrossRef]
  37. Turnock, S.T.; Allen, R.; Archibald, A.T.; Dalvi, M.; Folberth, G.; Griffiths, P.T.; Keeble, J.; Robertson, E.; O’Connor, F.M. The future climate and air quality response from different near-term climate forcer, climate, and land-use scenarios using UKESM1. Earth’s Future 2022, 10, e2022EF002687. [Google Scholar] [CrossRef]
  38. Dunne, J.P.; Hewitt, H.T.; Arblaster, J.; Bonou, F.; Boucher, O.; Cavazos, T.; Durack, P.J.; Hassler, B.; Juckes, M.; Miyakawa, T.; et al. An evolving coupled model intercomparison project phase 7 (CMIP7) and Fast Track in support of future climate assessment. EGUsphere 2024, 18, 1–51. [Google Scholar] [CrossRef]
  39. Ikeda, K.; Yamaji, K.; Kanaya, Y.; Taketani, F.; Pan, X.; Komazaki, Y.; Kurokawa, J.; Ohara, T. Sensitivity analysis of source regions to PM2.5 concentration at Fukue Island, Japan. J. Air Waste Manag. 2014, 64, 445–452. [Google Scholar] [CrossRef]
  40. Wang, Y.Q.; Zhang, X.Y.; Sun, J.Y.; Zhang, X.C.; Che, H.Z.; Li, Y. Spatial and temporal variations of the concentrations of PM10, PM2.5 and PM1 in China. Atmos. Chem. Phys. 2015, 15, 13585–13598. [Google Scholar] [CrossRef]
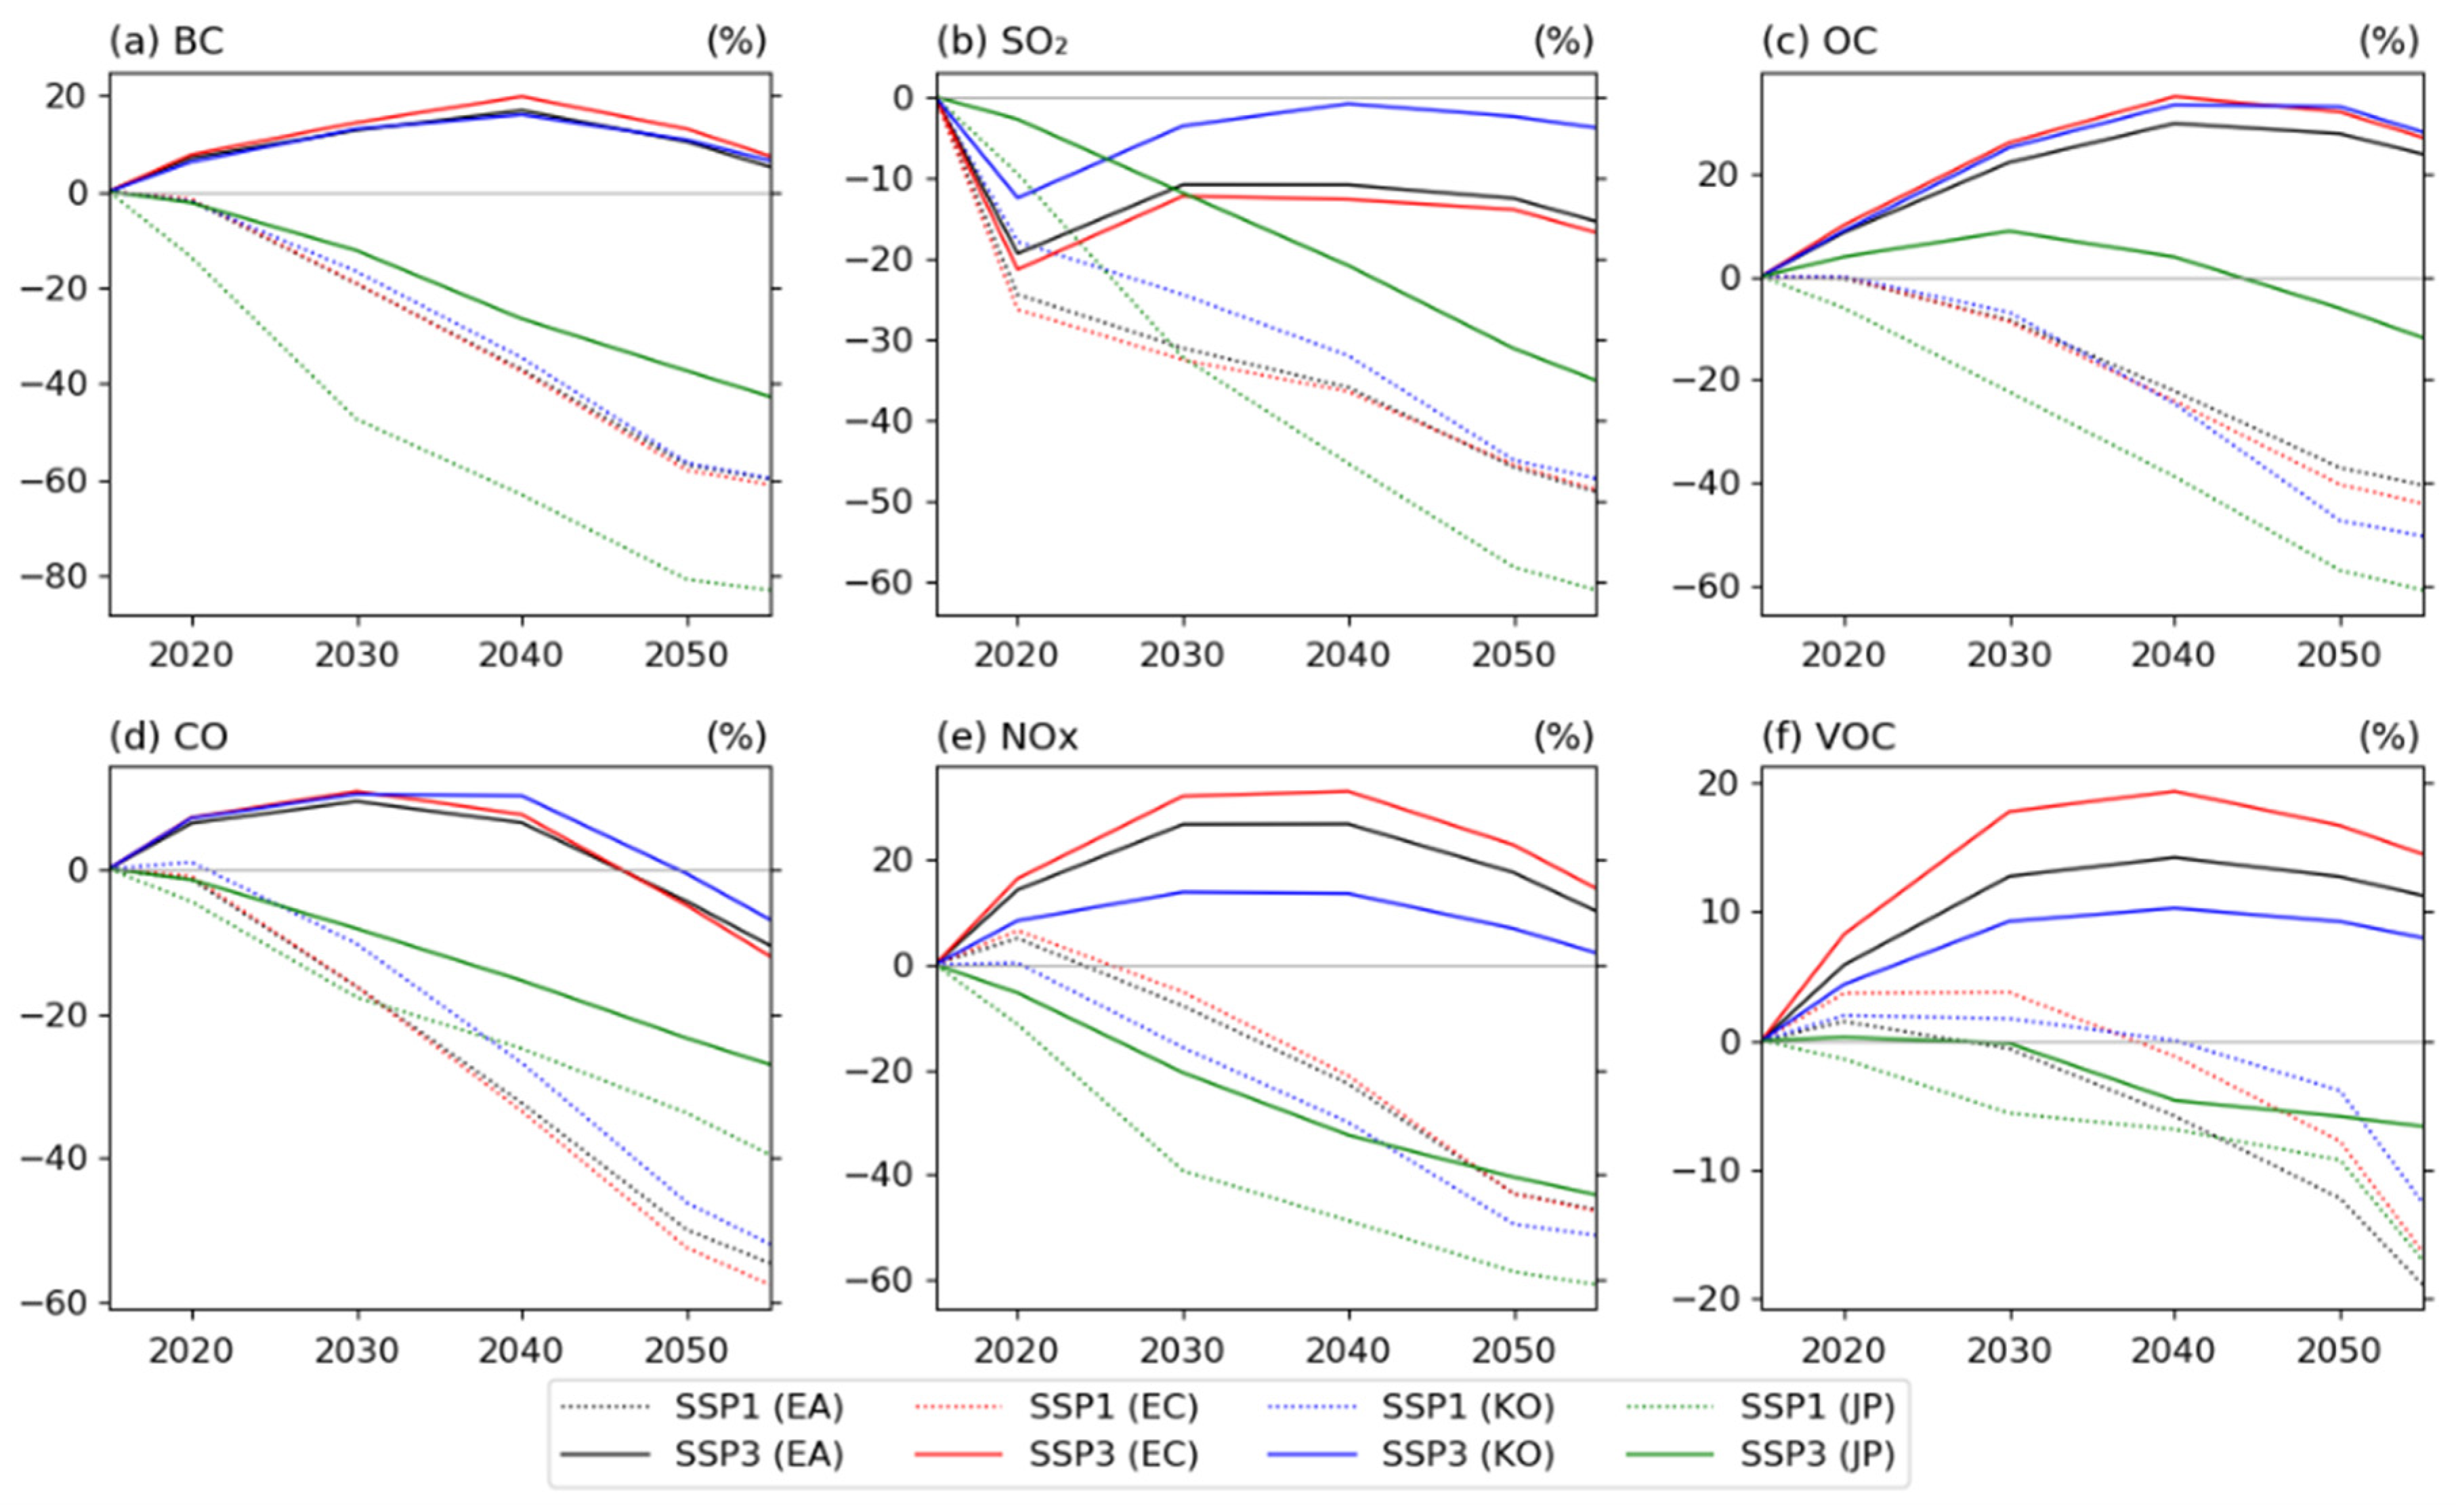
Figure 1. Time series of averaged emissions of (a) black carbon (BC), (b) sulfur dioxide (SO2), (c) organic carbon (OC), (d) carbon monoxide (CO), (e) nitrogen oxides (NOx), and (f) volatile organic compounds (VOCs) from 2015 to 2054 under SSP3 (solid) and SSP1 (dotted line) scenarios over East Asia (EA; black), East China (EC; red), Korea (KO; blue), and Japan (JP, green). The Y-axis indicates the percentage change in near-term climate forcer (NTCF) mitigation.
Climate 13 00191 g001
Figure 2. Three subregional domains overlaid with the terrain height (unit: m) over EA, as analyzed in this study. Each red square denotes the EC, KO, and JP regions.
Climate 13 00191 g002
Figure 3. Time series of annual mean PM2.5 concentration between the control experiment (histSST; black) and the perturbation experiments (histSST-piNTCF; blue, and histSST-piO3; red) during the historical period (1850–2014) over EA regions. The shaded area indicates the range of multi-model ensembles of each scenario. Concentrations are expressed in μg/m3.
Climate 13 00191 g003
Figure 4. Spatial distribution of annual mean surface PM2.5 concentrations (first column) and their major components (SO4, second column; BC, third column; and OA, fourth column) from the histSST (ad, top row), histSST-piNTCF (eh, middle row), and histSST-piO3 (il, bottom row) experiments for the present-day period (1995–2014). Red squares indicate the EC, KO, and JP regions from left to right.
Climate 13 00191 g004
Figure 5. Time series of annual mean PM2.5 concentration changes from the ssp370SST experiment (black) and perturbation experiments (ssp370SST-lowNTCF, blue; ssp370SST-lowO3, red) for the future period (2015–2100) over the EA regions. The shaded area indicates the range of multi-model ensembles of each scenario. Concentrations are expressed in μg/m3.
Climate 13 00191 g005
Figure 6. Spatial distribution of annual mean surface PM2.5 concentrations (first column) and their major components (SO4, second column; BC, third column; and OA, fourth column) from the ssp370SST (ad, top row), ssp370SST-lowNTCF (eh, middle row), and ssp370SST-lowO3 (il, bottom row) experiments for the present-day period (1995–2014). Red squares indicate the EC, KO, and JP regions from left to right.
Climate 13 00191 g006
Table 1. Summary of the AerChemMIP experiments used in this study. Detailed descriptions of these experiments are available in Collins et al. [23].
Experiment Name
(Time Period)
Key Forcing Setup
histSST
(1850–2014)
Prescribed observed sea surface temperature (SST) and sea ice; anthropogenic and natural emissions follow historical records
histSSP-piNTCFSame as histSST but with NTCF emissions fixed at 1850 levels
histSSP-piO3Same as histSST but with ozone precursor emissions fixed at 1850 levels
ssp370SST
(2015–2100)
Future emissions follow SSP3-7.0 scenario; SST and sea ice prescribed from coupled CMIP6 simulations
ssp370SST-lowNTCFSame as ssp370SST but with strong NTCF mitigation (reduced aerosols, precursors)
ssp370SST-lowO3Same as ssp370SST but with low ozone precursor emissions
Table 2. Air quality index category for PM2.5 based on World Health Organization (WHO) guidelines.
WHO LevelsPM2.5 (μg/m3)Annual PM2.5 Breakpoints Based on Air Quality Guidelines (AQGs) and Interim Targets
6Exceeds target levels>50Exceeds WHO PM2.5 guidelines by more than ten times
5Exceeds target levels35–50Exceeds WHO PM2.5 guidelines by seven to ten times
4Interim target 125–35Exceeds WHO PM2.5 guidelines by five to seven times
3Interim target 215–25Exceeds WHO PM2.5 guidelines by three to five times
2Interim target 310–15Exceeds WHO PM2.5 guidelines by two to three times
1Interim target 45–10Exceeds WHO PM2.5 guidelines by one to two times
0Air quality guideline0–5Meets WHO PM2.5 guidelines
Disclaimer/Publisher’s Note: The statements, opinions and data contained in all publications are solely those of the individual author(s) and contributor(s) and not of MDPI and/or the editor(s). MDPI and/or the editor(s) disclaim responsibility for any injury to people or property resulting from any ideas, methods, instructions or products referred to in the content.