Article

How Climate Ambition and Technology Choices Shape Water Use in the Power Generation Sector

by
Panagiotis Fragkos
,
Eleftheria Zisarou
* and
Kristina Govorukha
E3Modelling S.A., PO 11523 Athens, Greece
*
Author to whom correspondence should be addressed.
Climate 2025, 13(9), 174; https://doi.org/10.3390/cli13090174
Submission received: 10 July 2025 / Revised: 25 August 2025 / Accepted: 25 August 2025 / Published: 27 August 2025
(This article belongs to the Section Climate and Environment)

Abstract

The power generation sector is a major contributor to global greenhouse gas (GHG) emissions and a significant consumer of freshwater, due to the extensive water use in cooling processes of thermoelectric power plants. While net-zero strategies increasingly focus on eliminating emissions to mitigate climate change, the critical role of water as a key sustainability resource remains underexplored and often underrepresented in mitigation scenarios, strategies, and policy frameworks. This study examines the impact of power sector decarbonization on global and regional electricity-related water demand under two climate ambition scenarios: continuation of current climate policies (CP) and a net-zero emission (NZ) scenario where countries implement their net-zero pledges by 2050 or later. Using the PROMETHEUS energy system model, we quantify how different climate ambitions could affect global and regional water demand, considering different levels of cooling technology evolution. Results show that water demand is not only driven by how much energy is produced but by the technology mix used to generate electricity. The findings highlight the significant co-benefits of power sector decarbonization for reducing water needs and ensuring freshwater resource sustainability, underscoring the importance of integrating water management into climate policy frameworks. This integrated perspective is critical for policymakers, energy system planners, and water resource managers aiming to balance ambitious climate goals with sustainable water use amid growing climate and resource challenges.

Graphical Abstract

1. Introduction

Global warming is driving an urgent shift toward deep decarbonization, with many countries committing to net-zero targets by mid-century. While global initiatives like the Paris Agreement and the Nationally Determined Contributions (NDCs) are advancing climate action by targeting reductions in greenhouse gas (GHG) emissions, they often overlook another critical dimension related to water sustainability [1]. This gap is particularly evident in the power sector, which is both a major emitter of GHGs and a large consumer of freshwater resources. Thermal power generation, including coal, natural gas, oil, and nuclear, requires substantial volumes of water for cooling, accounting for large amounts of global freshwater withdrawals, especially in fossil fuel-dependent economies [2].
As countries decarbonize their energy systems, shifts in the energy mix can lead to unintended water stress if water-intensive technologies are deployed without integrated planning. While renewable technologies such as solar and wind have low water footprints, others, such as bioenergy and concentrated solar power (CSP), can be highly water-intensive [3]. Despite these risks, most NDCs do not explicitly address the water implications of their energy transition strategies, particularly the water requirements associated with mitigation pathways [4], raising concerns about long-term sustainability and resilience, mostly in water-stressed regions.
This oversight is particularly problematic at the national or even sub-national level, where water availability, energy infrastructure, and climate impacts may vary significantly. For instance, in India, where 80% of electricity is generated from thermal sources, water scarcity is already causing power plant shutdowns during summer months, threatening both energy access and economic productivity [5]. At the same time, China faces regional imbalances, with water-scarce northern provinces hosting the bulk of coal-fired capacity, intensifying the strain on already depleted river basins such as the Yellow River [6,7]. The potential shift of the European Union toward dispatchable low-carbon technologies (e.g., nuclear and biomass) raises concerns over thermal cooling needs in EU countries already vulnerable to heatwaves and droughts, such as France and Spain [8]. Similarly, in the United States, regions such as California have experienced power generation curtailments due to drought-related water shortages, underscoring that even advanced economies face interlinked water/energy/climate challenges [9]. These regional disparities underscore the need for integrated assessments that align energy system planning with local water availability and cooling technology evolution, to avoid reinforcing environmental or socio-economic inequalities.
Energy system models and Integrated Assessment Models (IAMs) play a critical role in analysing the multi-dimensional implications of climate policies, including their cross-sectoral and resource-related impacts. However, the water implications of decarbonizing electricity systems remain underexplored within IAM-based frameworks and mitigation scenarios. Most previous assessments of water/energy interactions have relied on technology-level water footprint analysis [10], hydrological models [11], or country- and region-specific case studies using power plant inventory data [12]. Other global-scale studies assessed the impacts of water withdrawals for electricity generation [13] and water use by technology [14], while the role of the regional dimension has been assessed recently [15]. While those studies are useful, they are often detached from broader policy scenarios or long-term energy system transformations, as they typically evaluate water withdrawal and consumption by power generation technologies, but outside of an integrated policy context or without considering future technology diffusion and market responses. As such, they offer limited insights into how real-world decarbonization strategies, especially those embedded in NDCs and net-zero targets, may reshape water use through massive changes in the electricity sector.
This study advances the literature by using PROMETHEUS, a technology-rich and extensively used IAM [16,17], to provide a dynamic, policy-relevant assessment of potential electricity-related water demand under contrasting climate policy scenarios. The study addresses three main limitations identified in the literature: (i) the lack of comparative regional analysis across major emitters with distinct water-energy challenges (EU, China, India), (ii) the insufficient attention to how cooling technology adaptation can influence water consumption of power system transitions, and (iii) the absence of scenario-based assessments linking long-term climate ambition to water sustainability outcomes. This study not only quantifies future water demand in the electricity sector but also sheds light on where and under which policy and technological conditions water stress may intensify or ease. Findings offer actionable insights to policymakers, industries, and relevant stakeholders for designing energy transition strategies that are both climate-aligned and water-resilient.

2. Materials and Methods

2.1. Tools

The global Integrated Assessment Model PROMETHEUS is used to assess the water-energy implications of alternative climate policy scenarios. PROMETHEUS is designed to evaluate the complex interactions between energy demand, supply, energy prices, and environmental policies at the regional and global level.
PROMETHEUS [17] provides detailed projections of energy demand, supply, power generation mix, energy-related carbon emissions, energy prices, and future investment covering the global energy system. It is a fully fledged energy demand and supply simulation model aiming at addressing energy system analysis, energy price projections, power generation planning, and climate change mitigation policies. The model contains relations and/or exogenous variables for all the main quantities that are of interest in the context of general energy and climate analysis. These include demographic and economic activity indicators, primary and final energy consumption by main fuel, fuel resources and prices, CO2 emissions, and technology dynamics for power generation, road transport, hydrogen production, and end-use technologies.
The model incorporates environmentally oriented emission abatement technologies (like renewable energy technologies, electric vehicles, carbon capture and storage, energy efficiency) and various energy and climate policy instruments. The latter includes both market-based instruments, such as cap-and-trade systems with differential application per region and sector, as well as regulatory measures focusing on specific carbon-emitting activities (i.e., CO2 standards for cars, blending mandates, etc.). PROMETHEUS is designed to provide medium- and long-term climate change mitigation planning and system restructuring, on both the energy demand and the supply sides. The model currently produces analytical quantitative results in the form of detailed energy balances in the period 2020 to 2050. It can support the impact assessment of specific energy and environment policies and measures applied at regional and global levels, including price signals such as taxation, subsidies, technology, and energy efficiency promoting policies, RES supporting policies, environmental policies, and technology standards.

2.2. Representation of Water Demand in PROMETHEUS

PROMETHEUS estimates operational water demand in the power sector using an ex post approach by combining data on water intensity per electricity generation and cooling technology with the model’s endogenously projected electricity generation mix over time. Operational water demand refers to water required during electricity production, primarily for cooling, cleaning, and flue gas desulfurization [18], but excludes upstream water demand related to fuel extraction or processing.
In the current analysis, potential constraints in the water quantity or quality are not considered. This study quantifies both water withdrawals (total water extracted from natural sources) and water consumption (the portion of water not returned to the source, typically lost through evaporation) across power generation technologies for the different climate policy scenarios [19].
The analysis accounts for key cooling technologies such as once-through/open-loop cooling (freshwater or seawater), recirculating/wet towers, cooling ponds, and dry cooling (minimal or zero water use, as heat is dissipated using air). Thermal-power technologies can operate with all four cooling systems, featuring a large variation in water requirements depending on the employed cooling technology. The operation of solar PV and wind power has no or minimal water needs, while hydropower is assumed to withdraw no water but to consume considerable amounts. The key input data associated with water demand include water withdrawal and consumption coefficients differentiated by power generation technology and shares of each of the different cooling technologies over time. Estimates of water intensity coefficients for operational water use vary across sources, but here we use the water demand coefficients reported by the comprehensive study [18]. The estimation of electricity-related water demand is electricity output-based. This means that the water withdrawal and consumption factors are associated with the produced electricity, assuming a constant relationship between water inputs and electricity outputs, in time and between regions. However, there are signs of improvement in water coefficients over time, and thus we use the maximum values proposed by [18] for 2015 and the minimum values for 2050, with a linear interpolation in between.
The data on cooling technology shares have been taken from [20], with the base year cooling shares adopted for existing capacities built prior to 2015 and the exogenous cooling shares transition linearly towards the ‘Future’ shares. The different cooling systems are characterized by different water-related features. Once-through open cooling systems have significantly high water withdrawals and low water consumption, since cooling water is discharged back to the original source after removing the excess heat of the power plant. Recirculating wet towers have lower water withdrawal, as cooling water is collected and recirculated in the plant, but higher water consumption due to evaporation losses through the tower. Pond-cooled technologies stand between once-through systems and recirculating towers, as they work with an open-loop system, and the cooling pond is concerned with evaporation losses. Finally, dry towers use air as a coolant so that no water is required to remove the excess heat from the power plant.
Electricity generation in PROMETHEUS is projected in five-year intervals and disaggregated by technology, region, and cooling system. The straightforward formula that links electricity generation per technology (from the model’s endogenous output), the cooling technology shares (exogenous assumptions), and water intensity coefficients ( k m 3 of water withdrawn or consumed per EJ of electricity generated from [18]), is shown below:
W a t e r   U s e r ,   t =   i ,   j E L C P R O D i ,   j ,   r ,   t     a i ,   j ,   t
where
  • E L C P R O D i , j , r , t : Electricity generation (EJ) from generation technology i, in region r and year t and cooling technology j
  • a i ,   j ,   t : Water withdrawal or consumption coefficient for that technology/cooling combination
PROMETHEUS is well-suited for water/energy nexus assessment as it offers a detailed, technology-rich representation of the global energy system with endogenous responses to climate policy, fuel prices, and technological learning. Its disaggregated power sector structure enables the tracking of electricity generation by technology and cooling system type, allowing for robust estimation of operational water withdrawal and consumption under different climate policy scenarios.

2.3. Scenarios

To explore the implications of varying levels of climate policy ambition on water demand in the power sector, this work simulates two contrasting scenarios using the PROMETHEUS model. As electricity generation is among the most water-intensive sectors globally, particularly for thermal-based technologies, the ambition of climate mitigation policies can significantly influence future water use. The two core climate scenarios are as follows:
  • Current Policies (CP): This scenario includes all those climate and energy policies and regulations that have been legally adopted and are currently implemented globally. It reflects the policy status quo as captured in [21,22].
  • Net-Zero (NZ): This scenario includes the full implementation of the Nationally Determined Contributions (NDCs) by 2030 and the Long-Term Low-Emission Development Strategies (LT-LEDS), including the national net-zero pledges by mid-century. The net-zero scenario (NZ) assumes that all countries and regions will implement their long-term targets as officially announced in their LT-LEDS.
The CP scenario reflects the short-term policy ambitions embedded in actual, already implemented policies or concrete policy targets that have been formally announced. It includes current national policies and their expected impact on emissions in the near term. This scenario serves as a business-as-usual path (baseline) where countries maintain their existing policies (meaning no significant policy change or additional policy ambitions post-2030). Beyond 2030, the CP scenario assumes that the historical rate of improvement in CO2 emissions per unit of GDP (as observed in the decade 2020–2030) is maintained through 2050.
The NZ scenario incorporates the implementation of both the NDCs and the LTTs. This scenario represents a more ambitious approach to climate action and is designed to explore the impact of enhanced policy ambitions integrated in NDCs and LTTs. The NDCs aim at achieving a specific emissions reduction target by 2030. However, these commitments might be subject to implementation risks depending on the level of political dedication, funding, and institutional capacity. The long-term pledges aim for deep decarbonization but are generally not backed by specific policies and measures at the time of their announcements, though they represent an important policy direction. In the NZ scenario, the long-term targets are incorporated as linear pathways, transitioning from the 2030 NDC targets to the LTT target.
In all policy scenarios (CP and NZ), common assumptions are used about the future development of main socio-economic drivers (population and GDP), based on widely used databases such as Eurostat [23], UN population datasets [24], Shared Socio-economic Pathways-SSP2 [25], and IMF [26]. Moreover, harmonized assumptions are incorporated about energy technologies (including capital costs, operating costs, lifetimes, efficiencies, and learning rates) derived from the IEA’s World Energy Outlook 2024 [27] and historical data from the World Bank when relevant [28]. These harmonized data inputs ensure consistency across scenarios while allowing PROMETHEUS to capture global and regional variations in energy systems over time.
Rather than relying on cost-optimized global carbon budgets, this policy design reflects a more politically grounded approach, including the implementation of national climate targets and plans like the NDCs. This enhances the policy relevance of our results, particularly for informing implementation and progress tracking of climate commitments. To examine the role of technological adaptation and development in reducing water stress in the electricity sector, each climate scenario is combined with one of the following cooling system pathways:
  • Static Cooling (S): Assumes no change in the distribution of cooling technologies over time. The shares of once-through, recirculating, dry, and seawater cooling systems remain fixed at their 2015 levels, based on the ‘Base year’ values reported by [20] over the whole study period.
  • Adaptive Cooling (A): Assumes a gradual shift towards less-water-intensive cooling technologies. Starting from the 2015 ‘Base year’ values, the shares of cooling technologies evolve linearly to the ‘Future’ values from [20] by 2050, reflecting potential adaptation to water scarcity and policy incentives.
These assumptions are applied consistently across all regions, but the initial 2015 shares vary by country. The resulting scenario matrix is shown in Table 1 and allows disentangling the individual and combined effects of climate policy ambition and cooling technology adaptation by 2050.

3. Results

3.1. Static Case

3.1.1. Does Electricity Production Growth Drive Water Pressure?

The analysis shows that the relationship between electricity and water demand is highly policy- and technology-dependent. Water demand from the power sector depends both on the overall electricity generation but also on the energy/technology mix composition. The results (Figure 1) show that while electricity demand rises over 2020–2050 in both scenarios, the associated water demand diverges. In the CP scenario, global electricity demand is projected to increase from 93EJ in 2020 to 159EJ in 2050 (+71%), accompanied by a rise in electricity-related water use from 25 k m 3 to 32 k m 3 (+28%), suggesting a relative coupling between electricity and water consumption, as fossil fuels and thermal power dominate the power generation mix. In the baseline scenario, the power system does not have major structural change, with fossil-based thermal combustion systems remaining dominant, while the uptake of low-water alternatives (e.g., wind, solar PV) remains limited in scale. Thus, the baseline pathway locks the system into water-intensive infrastructure, reinforcing a feedback loop where both energy security and water availability are compromised. Without a transition to alternative power generation technologies or advanced cooling systems (e.g., dry cooling, hybrid cooling), the coupling between electricity growth and water pressure becomes a structural vulnerability, one that is especially critical under future climate considerations.
In contrast, the NZ scenario shows a different trend. Although electricity demand in 2050 is 73% higher than in 2020, water demand drops to 21 k m 3 which is a 16% reduction from 2020 levels and 35% below the CP scenario by mid-century. In this scenario, while electricity demand grows, the water use drops, not because of reduced energy services but due to structural shifts in the power generation mix toward low- or zero-water-intensive technologies such as wind and solar PV.
The results show that electricity demand growth alone does not fully determine water pressures. Instead, the composition of the energy system, particularly the cooling needs of different power generation technologies, is the dominant driver of water demand. Our findings align with other global studies [29,30], which show that water savings under mitigation pathways are achieved primarily by displacing water-intensive thermal generation [31]. This has important implications for policy. First, decarbonization strategies aligned with SDG 13 (Climate Action) [32] can deliver substantial co-benefits for SDG 6 (Clean Water and Sanitation) [33], especially in water-stressed regions. Energy system planning that ignores water implications risks locking in unsustainable resource dependencies. In sum, the water/energy nexus is not a question of ‘how much energy’ but ‘what kind of energy’, as the shift in technology and cooling strategies can decouple energy services from water consumption and withdrawals, an essential insight for integrated planning under climate change.

3.1.2. How the Power Generation Mix Influences Water Consumption and Withdrawals?

Water is a critical yet often overlooked dimension of power sector decarbonization. While the global shift to low-carbon energy systems focuses on reducing emissions, it can also reshape the water footprint of electricity production in profound ways. Our focus is on operational water consumption, a resource-intensive aspect of power generation that varies across technologies. Coal, gas, oil, nuclear, and biomass plants primarily rely on steam-cycle cooling systems, making them highly water-intensive. In contrast, solar PV and wind require negligible water for their operation, making them critical for sustainable transitions.
Currently, global water consumption from electricity generation is dominated by coal-fired power, which accounts for 55% of the total. This is primarily because coal plants operate on steam cycles and require large volumes of water for cooling, especially in once-through cooling systems, where water is withdrawn, used to cool steam, and then discharged. Nuclear plants follow with an 18% share of global electricity-related water consumption as they follow steam-based thermodynamic cycles and demand significant water for cooling. Gas-fired plants account for a 16% share, particularly combined-cycle plants that also rely on steam condensation. This composition reflects the current thermal-heavy power mix and limited deployment of low-water alternatives. By 2050, under the CP scenario, while total electricity demand increases, the water consumption mix remains highly thermal-intensive. Coal continues to play a major role, but its share declines to 19% in 2050 (following the projected decline of coal-fired generation, especially in developed economies), while coal with carbon capture and storage (CCS) adds a further 12%. CCS systems require additional energy for their operation and often involve additional cooling, increasing water consumption compared to conventional thermal plants. Gas with and without CCS follows with a share of 30% (7% and 23%, respectively) while nuclear expands its share to 28%, indicating its continued use for electricity production. All the above show that in a scenario with limited climate ambition, water demand remains structurally tied to thermal power plants.
In contrast, the net-zero scenario shows a different structure of water use by mid-century. Fossil-based generation drops sharply due to ambitious climate policies, with the share of unabated coal falling to just 7% of the water footprint of the electricity sector (Figure 2). However, the drastic reduction in fossil-based water demand is counterbalanced by the increased use of other water-intensive but low-carbon technologies. Nuclear energy becomes the single largest water consumer in the electricity sector, accounting for 37% of global water use. This is because nuclear power plants remain highly dependent on cooling water to manage the reactor core and condense steam. Biomass also increases its share to 12%, primarily due to the uptake of BECCS (bioenergy with carbon capture and storage), which combines biomass combustion with CCS infrastructure, intensifying water needs. The deployment of water-intensive solar thermal technologies (e.g., concentrated solar power/CSP) in some regions where direct normal irradiation is high, by mid-century, makes solar an important contributor to global water demand for electricity needs.
While the net-zero pathway massively reduces total water consumption compared to the baseline, due to the phase-out of fossil-based thermal technologies and the deployment of solar PV and wind, some low-carbon technologies still carry significant water burdens. In the net-zero scenario, advancements such as the use of dry cooling systems, hybrid cooling technologies, and water-efficient CCS designs are assumed to play a modest role in improving the water intensity of certain technologies. However, these innovations are not yet widespread enough to eliminate the trade-offs inherent in the deployment of nuclear or BECCS. Other studies corroborate these findings, as [34] found that scenarios relying heavily on nuclear and CCS tend to increase freshwater withdrawals unless offset by technology improvements. Similarly, the IPCC Special Report on 1.5   ° C [35] warns of increased water stress in pathways that depend on large-scale BECCS. Our modeling results reaffirm those concerns and suggest that early and sustained investment in low-water renewables, especially solar and wind, offers the clearest co-benefits for climate and water resources.

3.2. The Adaptive Case

3.2.1. To What Extent Can Adaptive Cooling Strategies Reduce Water Demand in the Power Sector Under Current Policies?

Until now, most global assessments of water use in the power sector have relied on static assumptions about cooling technologies, assuming constant water intensity coefficients throughout the projection period. However, this approach can obscure critical insights about the potential for technological adaptation to reduce water stress, especially in a warming and electrifying world. Our extended model-based analysis introduces the adaptive scenario, in which deployment of less water-intensive cooling systems, such as dry, recirculating, and seawater cooling, increases progressively over time, based on empirical trends reported in Section 2.2. This is compared to the static case, where the 2015 shares of cooling technologies remain constant until 2050.
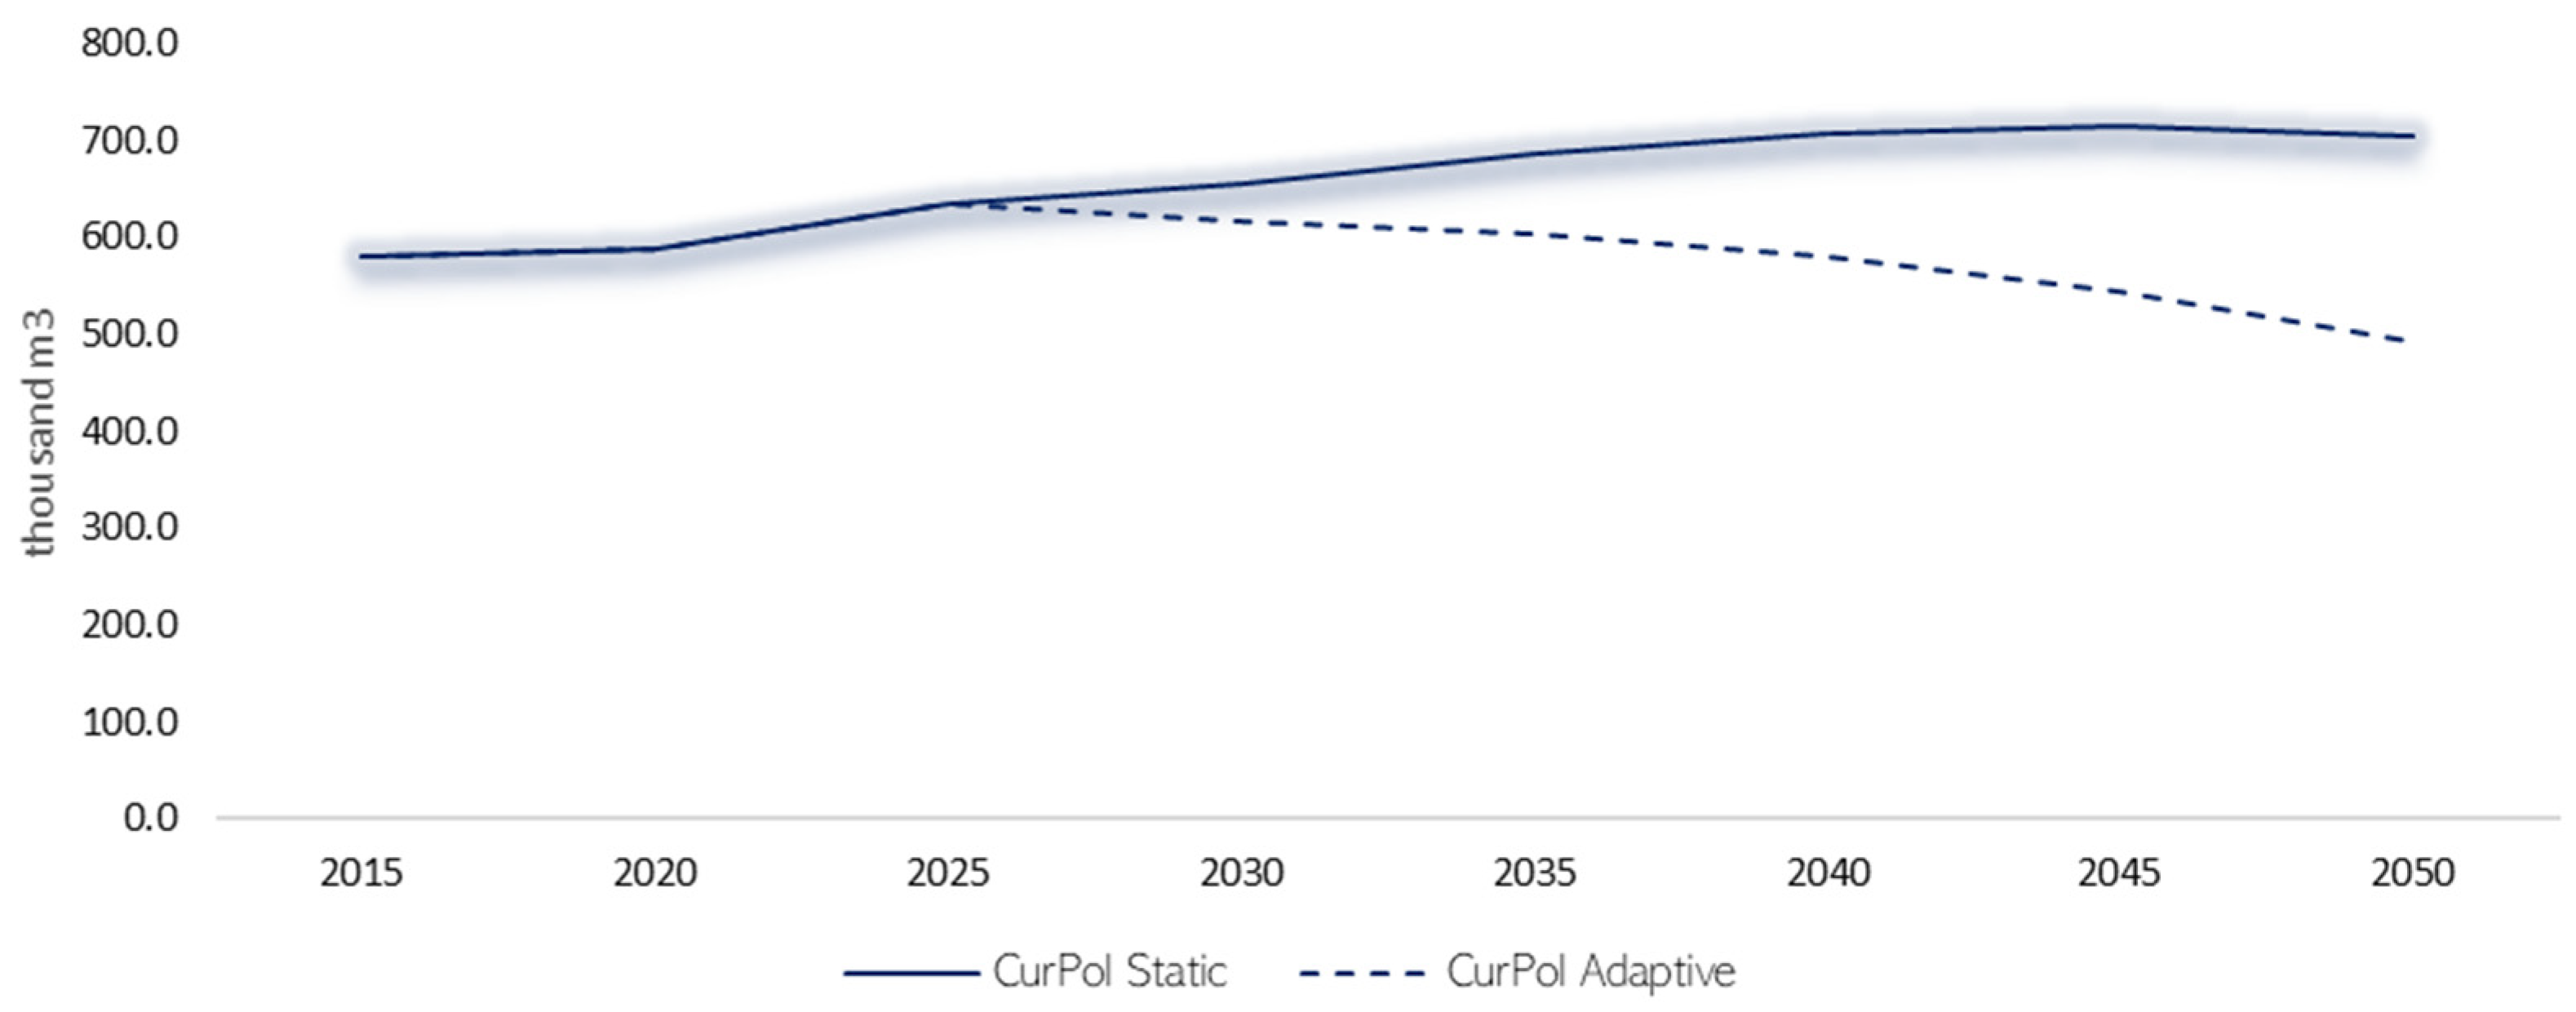
Under the baseline, the differences between the adaptive and the static cooling pathways become evident after 2025 (Figure 3). This signals a fundamental shift in how water consumption and withdrawals evolve when flexibility in water use is introduced. By 2030, total water withdrawals in the adaptive case decline 6% below the static case, while by 2050, this reduction expands to about 30%, a drop that reflects the deep structural changes in the technology choices for cooling technologies when constraints are dynamically incorporated. Our results show that in the transition towards more water-efficient systems based on local conditions and stressors, the power sector becomes significantly less water-intensive, even without high climate policy ambitions. Other global assessments [36,37,38] also echo the growing imperative to align energy and water strategies in a warming world.
Turning to the regional dynamics, it is observed that the global trend is far from uniform, as policy environments, energy mixes, and technological trajectories differ sharply across major emitters. In the European Union, adaptive and static pathways show the smallest differences as the region experiences an early and comprehensive shift away from water-intensive thermal generation. Coal is almost entirely phased out by 2050, and nuclear electricity generation remains relatively stable between 2020 and 2050. In the decade 2040–2050, the reductions in water withdrawals increase due to the shift towards more efficient water technologies in power plants [39,40]. This is a clear example that technological adaptation can lead to reductions in water withdrawal. Biomass-based water withdrawals decrease slightly, consistent with moderate use of bioenergy and strong policy support for non-thermal renewables (Figure 4). These results resonate with previous EU-focused studies [41,42,43,44,45], which argue that climate goals and energy transitions are increasingly being achieved with technologies that decouple energy production from freshwater dependence. Our results show that for the EU, adapting cooling technologies is a key strategy to reduce water stress in the energy sector, particularly for its remaining thermal-intensive technologies such as nuclear and biomass.
By contrast, India would have significant benefits from adaptive cooling as water withdrawals from coal-fired plants are projected to drop by about 19 k m 3 while nuclear withdrawals decline by 4 k m 3 by mid-century. However, India’s energy system under current policies continues to expand to meet India’s increasing energy requirements, and thermal generation (in particular coal) retains a substantial share of the power mix, supporting energy access and affordability (Figure 5). Consequently, the relative reduction in water use is dampened by the scale of system expansion. Nonetheless, India’s case shows how adaptive cooling assumptions can reduce the water impacts of power system growth, especially when aligned with cooling efficiency upgrades [43].
In China, the adaptive case results in the largest absolute reductions in water withdrawals by 2050 (Figure 6), driven by sharp declines in cooling water needs for coal without CCS (a reduction of about 38 k m 3 ) and nuclear power plants (a reduction of 13 k m 3 ). This is the outcome of both a strategic pivot away from water-intensive thermal generation and the deployment of alternative low-water options like solar PV, wind, and advanced cooling. The magnitude of change suggests that cooling flexibility in China could play a key role in mitigating water stress and improving climate and water resilience, a finding that is aligned with recent studies that emphasize China’s exposure to water scarcity [41,42].
The differences between regional dynamics highlight that even under current policies, adaptive cooling assumptions unlock substantial co-benefits, most notably in water savings and environmental stress reduction. In China and India, where both water scarcity and reliance on thermal-based power plants are high, adaptive scenarios result in meaningful decoupling of water demand from energy growth. In the EU, where policy already favors low-water renewable energy technologies, adaptive flexibility plays a lesser but still reinforcing role. The evidence-based findings underscore that cooling technology choices, though often overlooked, could shape the future energy/water/climate nexus, especially in regions with ambitious climate transition targets and constrained water availability.

3.2.2. What Is the Impact of the Adaptive Case in a Net-Zero World?

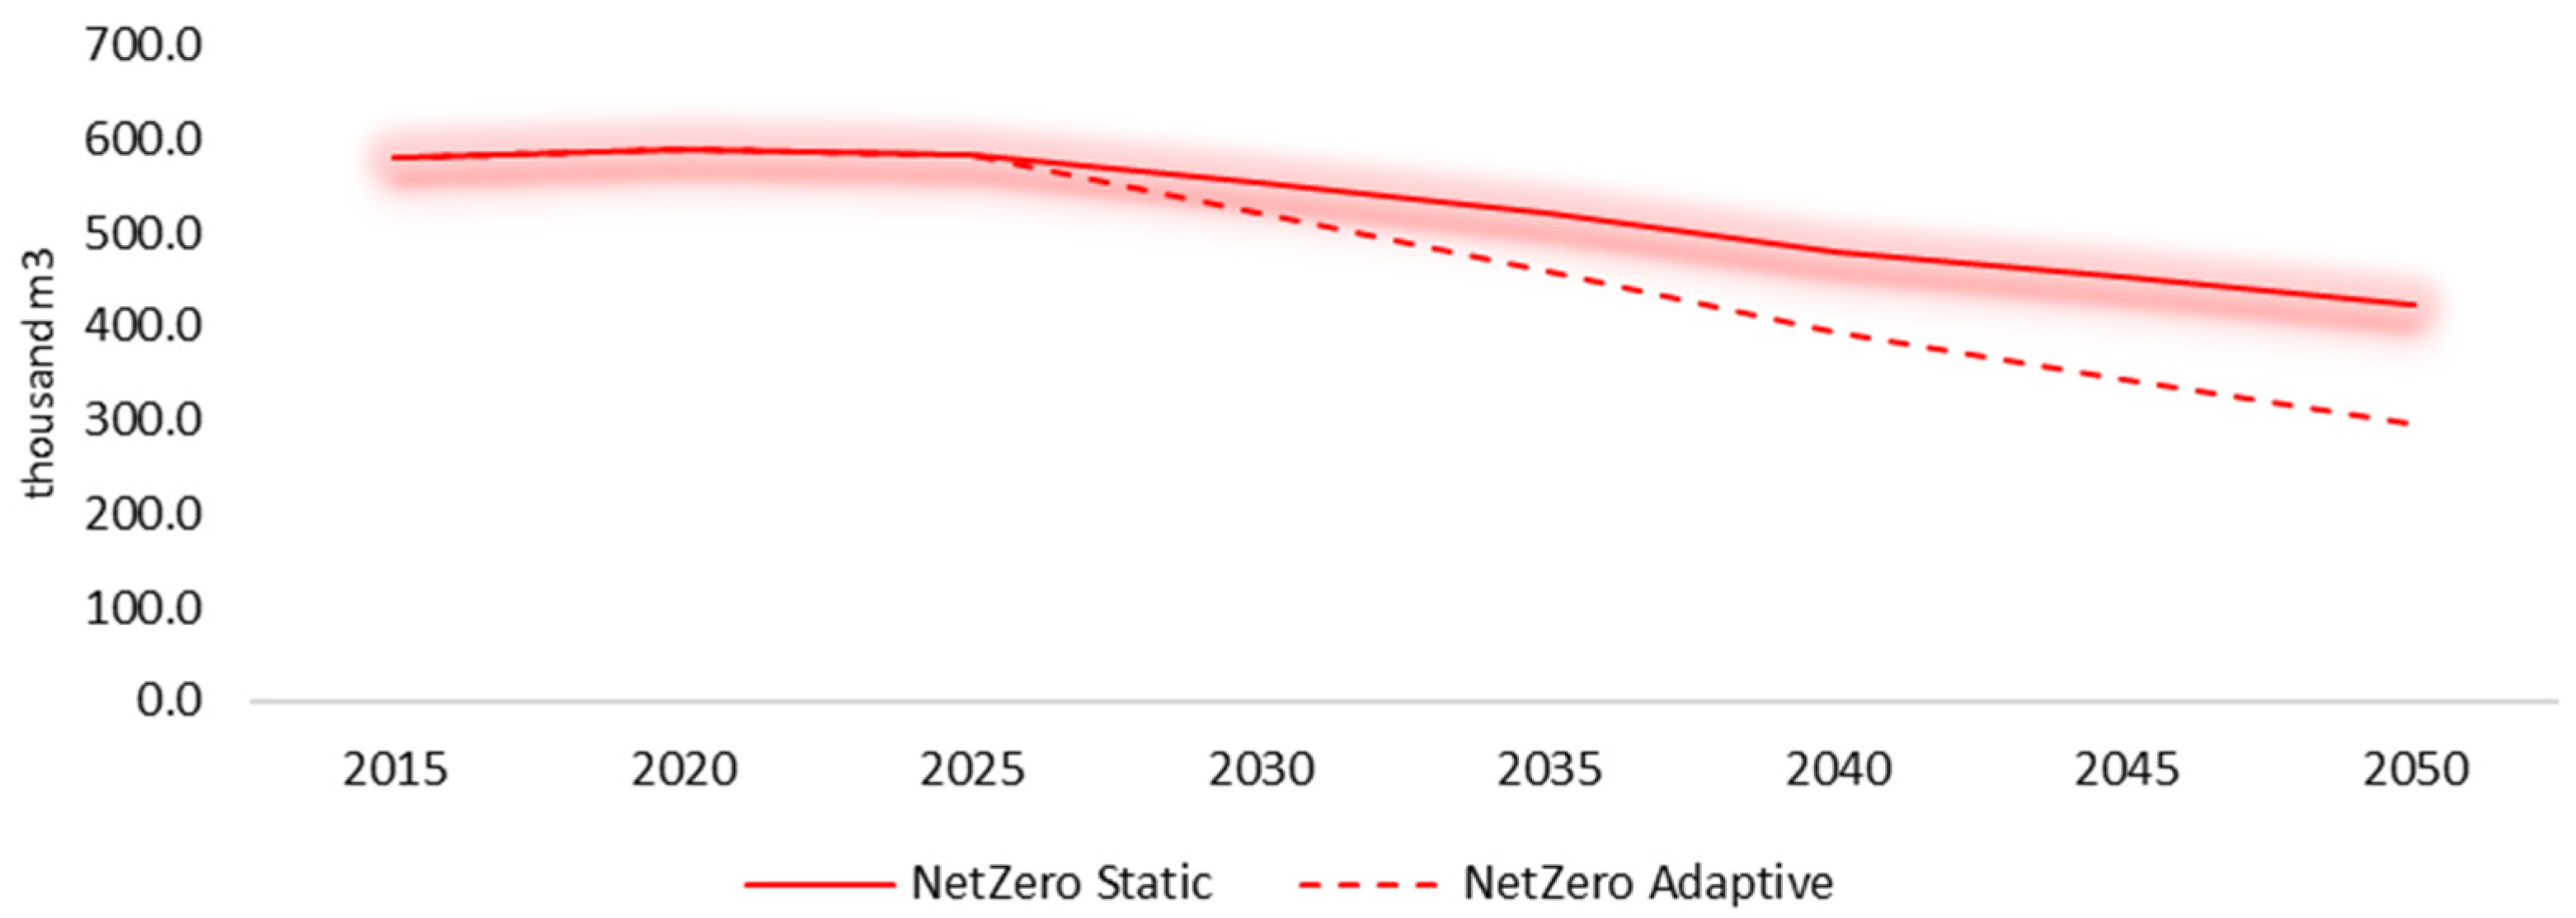
In the NZ scenario, the implementation of evolving cooling technologies in the power sector results in a large-scale reduction in water withdrawals, outperforming static scenarios. By 2050, global water withdrawals under the adaptive case are projected to fall by 50% relative to 2020 levels, compared to a 28% reduction under the static case. This signals that the adaptive case offers a more water-efficient evolution of the energy system, owing to its dynamic selection of cooling technologies based on local water availability, fuel mix, and thermal efficiency (Figure 7). Unlike the static approach, which locks each generation technology to a static cooling configuration, the adaptive framework incorporates system feedback, enabling more optimal, context-sensitive technology choices as climate and water constraints intensify [46,47]. The analysis shows that while net-zero policies inherently reduce the water footprint of the electricity sector by pushing fossil fuels out of the mix, the adaptive cooling strategy offers additional water efficiency benefits.
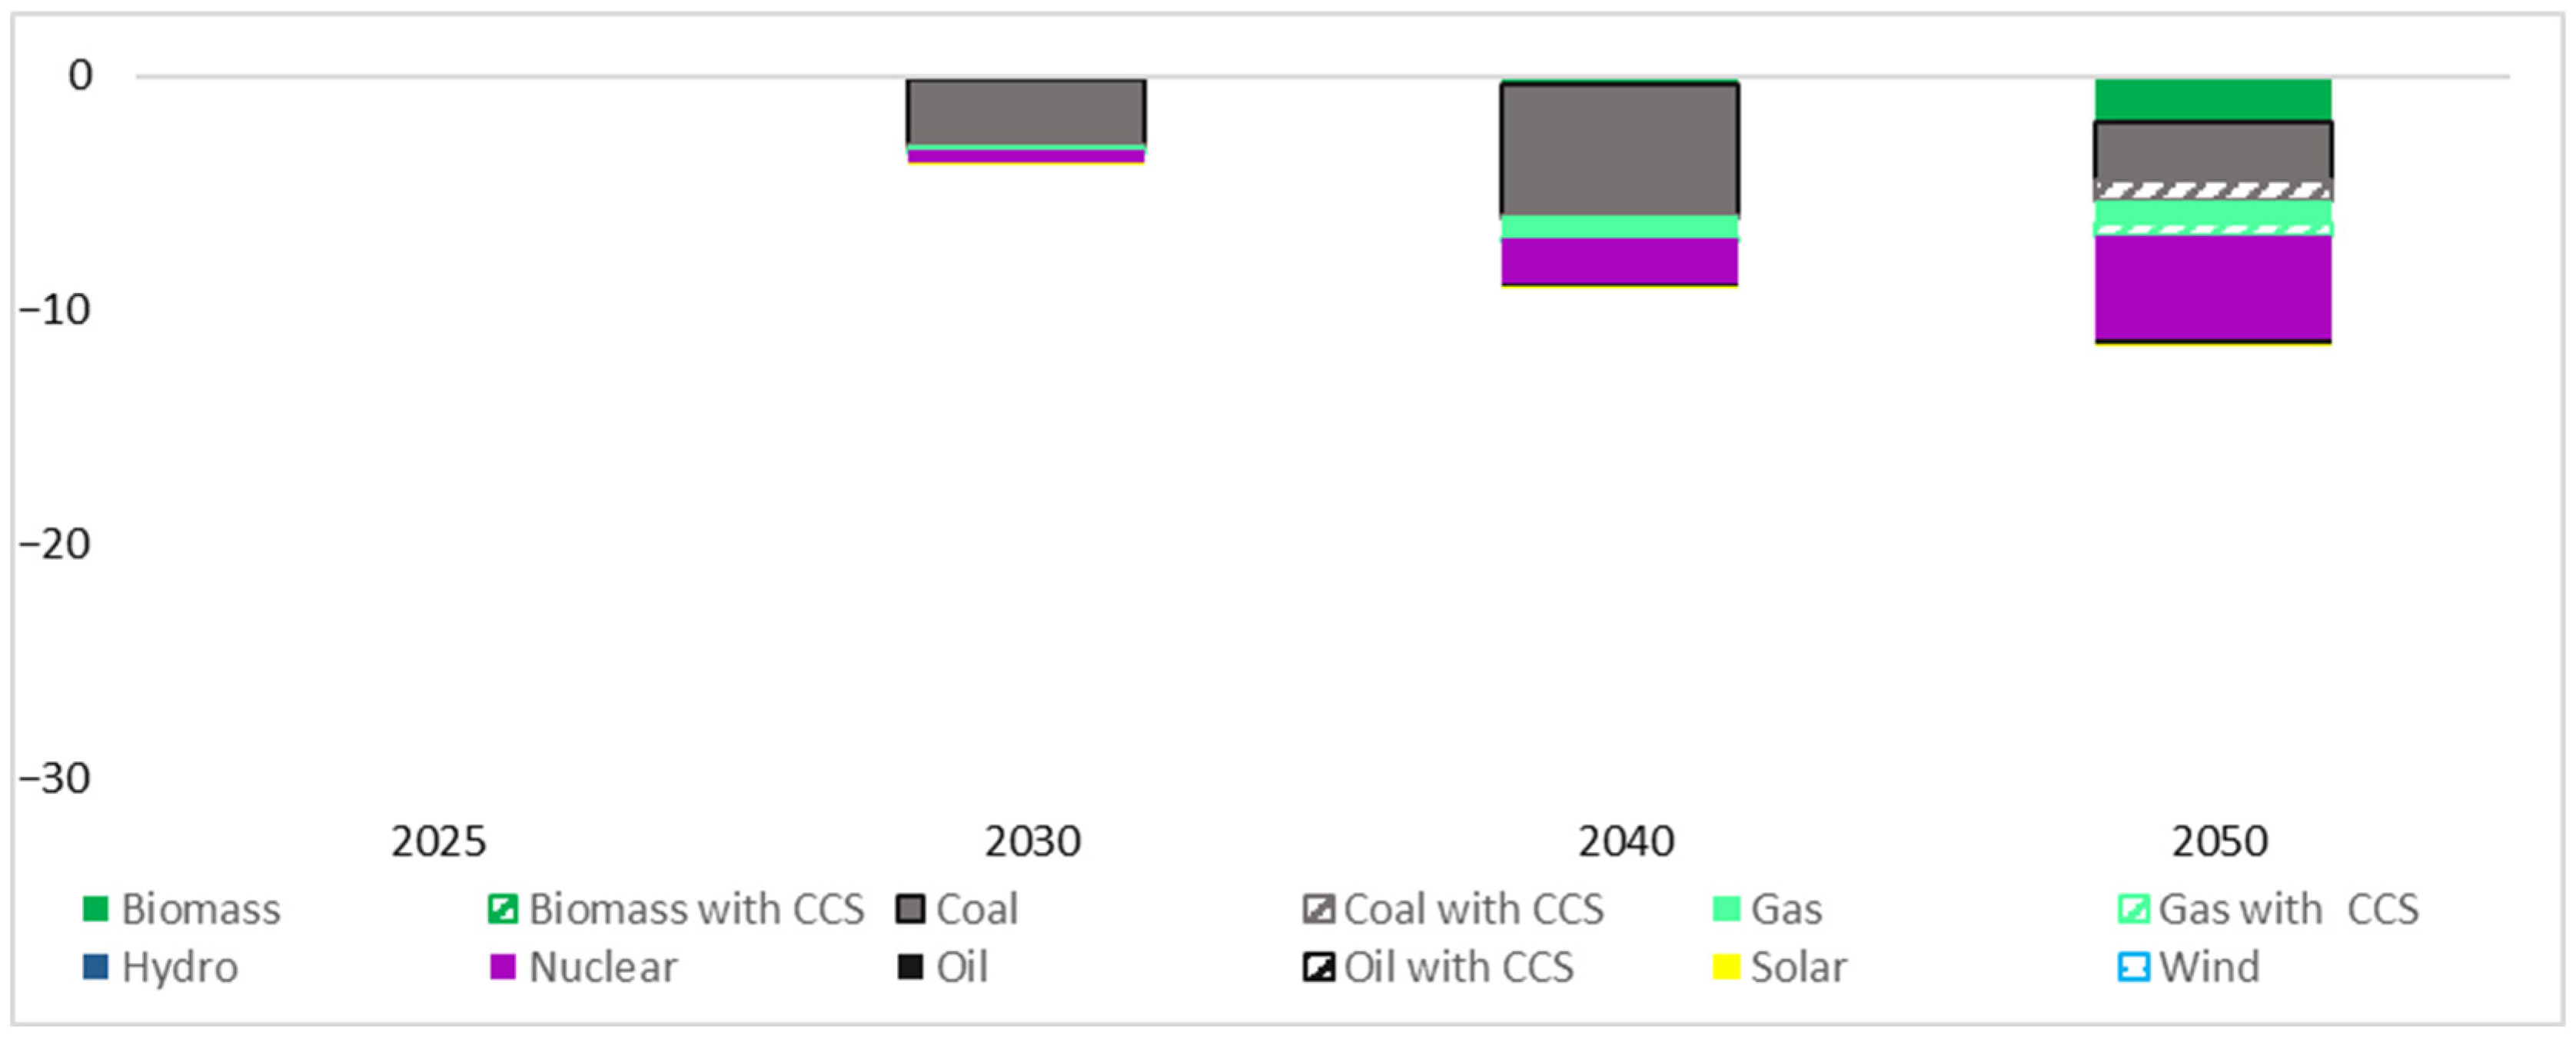
In the EU, the transition to net-zero leads to a steep decline in fossil fuel generation, with renewables forming the backbone of the system. Nonetheless, even by 2050, some thermal plants, such as nuclear and biomass with CCS, will still operate to provide firm capacity and system stability. This small share becomes disproportionately important in water terms. Under the adaptive case, where more efficient or dry cooling systems are introduced, water withdrawals from nuclear drop by about 3   k m 3 in 2040 and by 5 k m 3 in 2050 compared to the static cooling scenario. For biomass with CCS, which is introduced after 2040 to meet net-zero emission goals, water withdrawals drop by 5 k m 3 in 2050 (Figure 8). This trend suggests that although net-zero policies reduce the size of the thermal fleet, adaptive cooling significantly enhances the water efficiency of the remaining plants. By 2050, this efficiency becomes more pronounced because the dispatchable units, few but important, must operate with minimal environmental impact. EU policymakers should integrate water cooling technology upgrades and standards into long-term decarbonization strategies, particularly for nuclear refurbishments or new carbon removal units, as these will shape not only emissions but also water sustainability in the region.
In India, the adaptive strategy has even higher co-benefits. Nuclear power plants reduce their water withdrawals by 4.5   k m 3 in 2050, compared to the static case, while under current policies, the same adaptive shift yields more limited savings (Figure 9). This confirms that the water benefits of adaptive cooling increase in parallel with more ambitious mitigation. Coal-fired power plants remain significant in India’s power mix until the mid-2040s; this means that adaptive cooling leads to larger water demand reductions from coal plants in 2040 (5.6 k m 3 ) compared to 2050 (2.6 k m 3 ), as the power system shifts to nuclear and other low-carbon sources. This underlines the importance of early action on cooling system upgrades to maximize water savings, as the effectiveness of adaptive cooling is dynamic and evolves with the generation mix. For India, which faces high water stress and strong electricity demand growth, embedding water-efficient cooling requirements in new builds and retrofits, especially for future nuclear and gas plants, is essential. The evidence-based results show that those savings represent a key difference between sustainable and resource-intensive net-zero implementation.
In China, the adaptive scenario shows that by 2050, nuclear plants will withdraw 19 k m 3 less water than in the static case, more than double the 8 k m 3 difference observed in 2040. This illustrates the growing role of nuclear in China’s net-zero power mix, coupled with the shift of cooling systems toward low-withdrawal designs under such adaptive assumptions. Similarly, gas-fired generation avoids about 8 k m 3 of water withdrawals in 2050 in the adaptive case (Figure 10). This not only suggests that the adaptive pathway introduces more efficient cooling systems but also reflects broader technological improvements, including the adoption of air-cooled systems, hybrid cooling, and sweater-based systems in coastal installations.

4. Discussion

A central question underpinning the energy/water nexus is whether rising energy demand necessarily translates into higher water pressure. The study shows that this is not inherently the case. While electricity generation increases in both scenarios explored (current policies and net-zero), the associated water demand diverges sharply, as it crucially depends on the power generation mix. This reinforces the growing consensus in the literature that the energy form or technology type used is the critical determinant of water impacts and not only the volume of electricity production.
Under the continuation of current climate policies, the global power sector remains heavily dependent on thermal generation technologies, many of which rely on water-intensive steam cycles and legacy once-through or wet cooling systems. This results not only in increasing emissions, but in rising water consumption and withdrawals, particularly in countries where fossil capacity is still expanding without large investment in low-water intensity technologies. The absence of binding water-efficiency mandates or integrated water/energy governance means that power systems, especially in emerging economies, develop in a water-blind way, with infrastructure decisions made primarily on the basis of costs without considering overall environmental sustainability. While some decarbonization efforts occur under current policies, they are largely insufficient to drive structural shifts in water consumption, as renewable energy deployment does not proceed at a rapid enough scale to displace the thermal backbone of the global power system. The analysis shows that many regions, especially those with growing energy demand and urbanization, are locked in this water dependence path under their current climate policies, increasing vulnerability to hydrological variability and intensifying the trade-offs between power generation, agriculture, water, and ecosystems.
The net-zero scenario is based on the accelerated phase-out of unabated fossil fuels, combined with deeper uptake of renewable energy. This directly reduces water withdrawals and water demand, as technologies like wind and solar PV have minimal water requirements. However, results show that the picture is complicated by the composition of the power mix and the temporal dynamics of transition. In particular, the rise of dispatchable low-carbon technologies, including biomass with and without CCS, nuclear, and gas with CCS, introduces significant heterogeneity in water intensity. These technologies often rely on thermoelectric conversion and, without cooling innovation, can impose substantial water consumption despite their low-carbon intensity. The net-zero scenario shows that climate policy ambition alone is not a safeguard. If pursued with outdated water cooling infrastructures, the net-zero future could paradoxically increase water stress, particularly in regions with limited freshwater access or cooling flexibility.
Under the static case, nuclear power and CCS-equipped plants become the key drivers of global electricity-related water use, especially in a net-zero world. Nuclear power emerges as a solution to decarbonize the power system, but it is water-intensive and increases water consumption and withdrawals. This is consistent with earlier works [13,14], which caution that without innovation in cooling systems, climate ambition could intensify water stress. Similarly, CCS technologies, particularly in conjunction with coal or biomass, offer emissions reductions but increase water consumption due to the energy penalty and steam needs, leading to what [47] calls ‘climate myopia’ in long-term planning. Our results offer analytical scientific evidence that climate ambition alone does not resolve water pressure and that technological pathways matter a lot.
However, not all clean technologies pose this dilemma. Our study shows that renewable-based systems, particularly solar PV and wind, would lead to significant water savings in a net-zero future. These technologies, which operate with minimal or no water consumption and withdrawals, rise significantly in the net-zero scenario, offsetting the water requirement of thermal systems/technologies. This pattern confirms the conclusions of [18] and more recent assessments by [2], which advocate for a ‘water-smart’ energy transition. Interestingly, while the deployment of renewables often dominates the policy conversation for climate reasons, our study highlights that decarbonization through renewables has another important co-benefit, as it is the most effective strategy to reduce long-term water consumption and stress.
The modeling analysis shows that the adoption of adaptive cooling technologies can deliver meaningful water savings, even in the Current Policy scenario without ambitious climate policy. In regions where fossil and nuclear power plants persist, retrofitting existing infrastructure with water-efficient technologies, such as dry or hybrid cooling, can reduce water withdrawals and water demand significantly. For example, in India and China, adaptive cooling leads to measurable reductions in water withdrawals from coal- and gas-fired power plants. This result aligns with practical assessments from [43] and national energy plans in South Asia, which have recognized the growing risks of thermal plant shutdowns due to water shortages. While these adaptive measures require capital investments, they represent a cost-effective mitigation tool that can buy time while renewable energy technologies are scaled up.
The effectiveness of adaptive cooling technologies to reduce water withdrawals becomes even more pronounced under the net-zero scenario, particularly in specific regions. The analysis shows that the combination of NDCs, LTTs, and adaptive cooling technology deployment is a powerful lever for reducing electricity-related water withdrawals globally. While the net-zero transition inherently drives structural changes in energy systems, these gains can be compromised if thermal power infrastructure continues to rely on conventional water-intensive cooling. When adaptive technologies are massively deployed, they unlock significant reductions in water consumption. As climate ambition increases, these adaptive choices become more aligned with energy system planning, phasing in low-water thermal solutions at scale.
India emerges as one of the biggest beneficiaries of the adaptive net-zero pathway. India is a region with a rising electricity demand and a heavy presence of coal-fired power plants. The adaptive case demonstrates significant reductions in freshwater use, driven by the adoption of dry cooling systems, especially for newer fossil and CCS units. The NDCs and LTTs of India recognize the growing nexus between energy security and water availability. Still, our findings show that without embedding technological adaptability in cooling infrastructure, India’s mitigation pathway risks creating a new dependency, clean energy with unsustainable water consumption. Adaptive deployment thus safeguards both decarbonization and water security.
China’s net-zero commitment by 2060, paired with its rapid economic transformation, leads to a pronounced shift towards renewables and nuclear, alongside biomass with CCS. Under static assumptions, this generates continued water withdrawals, especially in northern inland provinces where water scarcity is already acute. In contrast, adaptive strategies enable China to transition biomass and coal-fired CCS units to hybrid or air-cooled systems, particularly in arid regions. Moreover, seawater cooling becomes viable along the eastern coast, displacing freshwater withdrawals. While nuclear and CCS technologies remain water-intensive by design, adaptive cooling technologies can mitigate their impact through better system design and siting choices.
Despite its decarbonization leadership and strong uptake of renewable energy, the EU’s net-zero scenario sees an increased role for nuclear and biomass with CCS, which may pose localized water risks. However, results show that the adaptive case significantly lowers water withdrawals by 2050, highlighting how smart thermal management and efficient cooling systems, combined with strong climate ambition, can decouple decarbonization from water intensification. Southern EU member states, especially Italy, Spain, and Greece, benefit from shifting away from wet cooling under heatwave and drought stress. Adaptive planning for water cooling should complement the EU’s Green Deal, climate regulations, and taxonomy-aligned investments by ensuring that green infrastructure is also water-resilient.
Our analysis shows that some low-carbon technologies are water-intensive. Coal and biomass with CCS and nuclear retain high intrinsic water requirements due to their thermodynamic nature. Adaptive cooling can reduce but not eliminate these demands. This implies that water-efficient renewables (solar PV, wind) should be prioritized in net-zero strategies wherever feasible, especially in water-constrained geographies. Moreover, without adaptive cooling, the deployment of CCS may create water-related stresses and vulnerabilities, especially in arid inland regions.
While many studies support that technological adaptation is key to managing the energy/water nexus [19,20,37], some raise concerns that adaptive cooling may be sufficient on its own, especially under extreme climate conditions that reduce cooling efficiency [48]. These perspectives point to the need for the design and development of system-level resilience strategies that combine technology adaptation with diversification of energy sources and water reuse strategies. Our findings build on this body of work by providing a quantified, scenario-based analysis that shows how adaptive cooling interacts with ambitious climate targets, offering a tangible pathway to reduce trade-offs between climate and water resources. For policymakers, this underscores that technology choices in the electricity sector and cooling strategies must be jointly optimized within decarbonization plans and not treated separately.

5. Conclusions

This study examined how global and regional water consumption from the electricity sector evolves under different climate policy scenarios and technology assumptions for water cooling. Specifically, we combine detailed energy system projections from the PROMETHEUS model with technology-specific water consumption and withdrawal coefficients from [20] to quantify potential future water demand in the power sector until 2050 under alternative climate policy scenarios. With this approach, we assess how energy choices and technology evolution affect water use across global and regional scales, highlighting the crucial role of the power mix and the technology adaptation in shaping the energy/water nexus. Importantly, our results also reveal that while advanced cooling systems reduce freshwater requirements [49], they can do so at the expense of plant efficiency, requiring higher fuel input per unit of electricity generated. This trade-off underlines the need to evaluate water efficiency and energy efficiency jointly, particularly for thermal technologies that persist under both current policies and net-zero scenarios.
To build on this work, future research should further explore regional differences in water and energy systems, as water availability and energy choices vary a lot between countries and their examination would help understand more closely which areas are most at risk of water stress due to energy transitions and where adaptive strategies could be most effective for tailored policy and technology solutions. Importantly, while some regions may experience increased rainfall due to climate change, this does not necessarily reduce water-related risks for the power sector. Seasonal variability, mismatches between water abundance and power plant locations, and rising electricity demands could still create water stress even under a net-zero scenario. Moreover, incorporating hydrological modeling, such as the effects of drought, river flow reductions, and increased evaporation, would enhance realism and help identify where water scarcity may become a critical constraint to power generation in the future. Including these effects would make the analysis more realistic by identifying whether water scarcity could limit power generation in the future. Considering that the power sector is not the only sector using water, the inclusion of agriculture and industry as activities that depend on the same water sources would help identify potential conflicts and solutions for more balanced resource management on a system-wide scale.
If the above issues are addressed, future work could provide more detailed, policy-relevant insights into how to decarbonize the power sector without putting pressure on water systems, which is essential for ensuring that climate policy is not only low-carbon but also resource-efficient and sustainable.

Author Contributions

Conceptualization, P.F. and E.Z.; methodology, P.F.; validation, P.F. and E.Z.; formal analysis, P.F. and E.Z.; data curation, P.F., E.Z. and K.G.; writing—original draft preparation, P.F., E.Z. and K.G.; writing—review and editing, P.F., E.Z. and K.G.; visualization, P.F. and E.Z. All authors have read and agreed to the published version of the manuscript.

Funding

This research was funded by the GoNexus project under the European Union Horizon Programme call H2020-LC-CLA-2018-2019-2020, Grant Agreement Number 101003722.

Data Availability Statement

Data are available upon request.

Conflicts of Interest

The authors declare no conflicts of interest.

References

  1. Mevono Mvogo, D. Water Under the Paris Agreement: An Unexploited Potential? Liverp. Law Rev. 2024, 45, 409–424. [Google Scholar] [CrossRef]
  2. Ke, J.; Khanna, N.; Zhou, N. Analysis of water–energy nexus and trends in support of the sustainable development goals: A study using longitudinal water–energy use data. J. Clean. Prod. 2022, 371, 133448. [Google Scholar] [CrossRef]
  3. IEA. Clean Energy Can Help to Ease the Water Crisis; IEA: Paris, France, 2023; Available online: https://www.iea.org/commentaries/clean-energy-can-help-to-ease-the-water-crisis (accessed on 20 March 2025).
  4. International Renewable Energy Agency. IRENA Renewable Energy in the Water, Energy & Food Nexus. 2015. Available online: https://www.irena.org/-/media/Files/IRENA/Agency/Publication/2015/IRENA_Water_Energy_Food_Nexus_2015.pdf (accessed on 20 March 2025).
  5. UNDP-SIWI Water Governance Facility. Water Interactions for Consideration in NDC Enhancement and Implementation; SIWI: Stockholm, Switzerland, 2020. [Google Scholar]
  6. Luo, T.; Krishnan, D.; Sen, S. Parched Power: Water Demands, Risks, and Opportunities for India’s Power Sector; World Resources Institute: Washington, DC, USA, 2018. [Google Scholar]
  7. World Bank. Technical Assessment: Yellow River Basin Ecological Protection and Environmental Pollution Control Program (P172806). 2022. Available online: https://documents1.worldbank.org/curated/en/099045103102228376/pdf/Final0Technica0l0Program000P172806.pdf (accessed on 24 August 2025).
  8. Zhang, F.; Jin, G.; Liu, G. Evaluation of virtual water trade in the Yellow River Delta, China. Sci. Total Environ. 2021, 784, 147285. [Google Scholar] [CrossRef] [PubMed]
  9. Zohrabian, A.; Sanders, K.T. Assessing the impact of drought on the emissions-and water-intensity of California’s transitioning power sector. Energy Policy 2018, 123, 461–470. [Google Scholar] [CrossRef]
  10. Nouri, N.; Balali, F.; Nasiri, A.; Seifoddini, H.; Otieno, W. Water withdrawal and consumption reduction for electrical energy generation systems. Appl. Energy 2019, 248, 196–206. [Google Scholar] [CrossRef]
  11. Shaikh, M.A.; Kucukvar, M.; Onat, N.C.; Kirkil, G. A framework for water and carbon footprint analysis of national electricity production scenarios. Energy 2017, 139, 406–421. [Google Scholar] [CrossRef]
  12. Van Vliet, M.T.; Wiberg, D.; Leduc, S.; Riahi, K. Power-generation system vulnerability and adaptation to changes in climate and water resources. Nat. Clim. Change 2016, 6, 375–380. [Google Scholar] [CrossRef]
  13. Larsen, M.A.D.; Drews, M. Water use in electricity generation for water-energy nexus analyses: The European case. Sci. Total Environ. 2019, 651, 2044–2058. [Google Scholar] [CrossRef]
  14. Hejazi, M.I.; Edmonds, J.; Clarke, L.; Kyle, P.; Davies, E.; Chaturvedi, V.; Wise, M.; Patel, P.; Eom, J.; Calvin, K. Integrated assessment of global water scarcity over the 21st century under multiple climate change mitigation policies. Hydrol. Earth Syst. Sci. 2014, 18, 2859–2883. [Google Scholar] [CrossRef]
  15. Fricko, O.; Parkinson, S.C.; Johnson, N.; Strubegger, M.; van Vliet, M.T.H.; Riahi, K. Energy sector water use implications of a 2 °C climate policy. Environ. Res. Lett. 2016, 11, 034011. [Google Scholar] [CrossRef]
  16. Jin, Y.; Behrens, P.; Tukker, A.; Scherer, L. Water use of electricity technologies: A global meta-analysis. Renew. Sustain. Energy Rev. 2019, 115, 109391. [Google Scholar] [CrossRef]
  17. Guivarch, C.; Le Gallic, T.; Bauer, N.; Fragkos, P.; Huppmann, D.; Jaxa-Rozen, M.; Keppo, I.; Kriegler, E.; Krisztin, T.; Marangoni, G.; et al. Using large ensembles of climate change mitigation scenarios for robust insights. Nat. Clim. Chang. 2022, 12, 428–435. [Google Scholar] [CrossRef]
  18. Fragkos, P.; Kouvaritakis, N.; Capros, P. Incorporating Uncertainty into World Energy Modelling: The PROMETHEUS Model. Environ. Model. Assess. 2015, 20, 549–569. [Google Scholar] [CrossRef]
  19. Macknick, J.; Newmark, R.; Heath, G.; Hallett, K.C. A Review of Operational Water Consumption and Withdrawal Factors for Electricity Generating Technologies; Prepared Under Task No. DOCC.1005; National Renewable Energy Laboratory: Golden, CO, USA, 2011. Available online: https://docs.nrel.gov/docs/fy11osti/50900.pdf (accessed on 30 July 2025).
  20. Mouratiadou, I.; Biewald, A.; Pehl, M.; Bonsch, M.; Baumstark, L.; Klein, D.; Popp, A.; Luderer, G.; Kriegler, E. The impact of climate change mitigation on water demand for energy and food: An integrated analysis based on the Shared Socio-economic Pathways. Environ. Sci. Policy 2016, 64, 48–58. [Google Scholar] [CrossRef]
  21. Kyle, P.G.; Davies, E.G.; Dooley, J.J.; Smith, S.J.; Clarke, L.; Edmonds, J.A.; Hejazi, M.I. Influence of climate change mitigation technology on global demands of water for electricity generation. Int. J. Greenh. Gas Control 2013, 13, 112–123. [Google Scholar] [CrossRef]
  22. IAMCOMPACT. Expanding Integrated Assessment Modelling: Comprehensive and Comprehensible Science for Sustainable, Co-created Climate Action. 2025. Available online: https://www.i2am-paris.eu/feasibility/landing (accessed on 12 June 2025).
  23. PARISREINFORCE. I2AM PARIS: Integrating Integrated Assessment Modelling in Support of the Paris Agreement. 2020. Available online: https://www.i2am-paris.eu/ (accessed on 24 February 2025).
  24. Eurostat. EUROPOP2019—Population Projections at Regional Level (2019–2100) (Short-Term Update 28 September 2022) [Data Set]. 2022. Available online: https://ec.europa.eu/eurostat/databrowser/explore/all/popul?lang=en&subtheme=proj.proj_19r (accessed on 30 October 2023).
  25. United Nations. World Population Prospects 2024: Dataset; United Nations Department of Economic and Social Affairs, Population Division: New York, NY, USA, 2024; Available online: https://population.un.org/wpp/ (accessed on 30 January 2025).
  26. US Bureau of Economic Analysis. Gross Domestic Product, Third Quarter 2024 (Second Estimate) and Corporate Profits (Preliminary). 2024. Available online: https://www.bea.gov/data/gdp/gross-domestic-product (accessed on 5 August 2025).
  27. International Monetary Fund. World Economic Outlook, 2023; Navigating Global Divergences: Washington, DC, USA, 2023; Available online: https://www.imf.org/en/Publications/WEO/Issues/2023/10/10/world-economic-outlook-october-2023 (accessed on 8 April 2024).
  28. IEA. World Energy Outlook 2024; IEA: Paris, France, 2024; Available online: https://www.iea.org/reports/world-energy-outlook-2024 (accessed on 24 August 2025).
  29. World Bank. Fossil Fuel Energy Consumption (% of Total). 2024. Available online: https://data.worldbank.org/indicator/EG.USE.COMM.FO.ZS (accessed on 5 August 2025).
  30. Wallis, P.J.; Ward, M.B.; Pittock, J.; Hussey, K.; Bamsey, H.; Denis, A.; Kenway, S.J.; King, C.W.; Mushtaq, S.; Retamal, M.L.; et al. The water impacts of climate change mitigation measures. Clim. Change 2014, 125, 209–220. [Google Scholar] [CrossRef]
  31. Sanders, K.T. Critical review: Uncharted waters? The future of the electricity-water nexus. Environ. Sci. Technol. 2015, 49, 51–66. [Google Scholar] [CrossRef]
  32. Licandeo, F.; Flores, F.; Feijoo, F. Assessing the impacts of economy-wide emissions policies in the water, energy, and land systems considering water scarcity scenarios. Appl. Energy 2023, 342, 121115. [Google Scholar] [CrossRef]
  33. United Nations. (n.d.). Goal 13: Take Urgent Action to Combat Climate Change and Its Impacts. United Nations Sustainable Development Goals. Available online: https://sdgs.un.org/goals/goal13 (accessed on 5 August 2025).
  34. United Nations. Goal 6: Ensure Availability and Sustainable Management of Water and Sanitation for All. United Nations Sustainable Development Goals. Available online: https://sdgs.un.org/goals/goal6 (accessed on 5 August 2025).
  35. Rosa, L.; Reimer, J.A.; Went, M.S.; D’Odorico, P. Hydrological limits to carbon capture and storage. Nat. Sustain. 2020, 3, 658–666. [Google Scholar] [CrossRef]
  36. Hoegh-Guldberg, O.; Jacob, D.M.; Taylor, M.; Bindi, S.; Brown, I.; Camilloni, A.; Diedhiou, R.; Djalante, K.L.; Ebi, F.; Engelbrecht, J.; et al. Impacts of 1.5 °C Global Warming on Natural and Human Systems. In Global Warming of 1.5 °C. An IPCC Special Report on the Impacts of Global Warming of 1.5 °C Above Pre-Industrial Levels and Related Global Greenhouse Gas Emission Pathways, in the Context of Strengthening the Global Response to the Threat of Climate Change, Sustainable Development, and Efforts to Eradicate Poverty; Masson-Delmotte, V., Zhai, P., Pörtner, H.-O., Roberts, D., Skea, J., Shukla, P.R., Pirani, A., Moufouma-Okia, W., Péan, C., Pidcock, R., et al., Eds.; 2018; in press; Available online: https://www.ipcc.ch/site/assets/uploads/sites/2/2019/05/SR15_Chapter3_SM_V6_for_web.pdf (accessed on 8 August 2025).
  37. Statista. Water Withdrawals per Capita Worldwide as of 2021, by Select Country (in Cubic Meters per Inhabitant). 2021. Available online: https://www.statista.com/statistics/263156/water-consumption-in-selected-countries/ (accessed on 12 June 2025).
  38. Khan, Z.; Linares, P.; García-González, J. Integrating water and energy models for policy driven applications. A review of contemporary work and recommendations for future developments. Renew. Sustain. Energy Rev. 2017, 67, 1123–1138. [Google Scholar] [CrossRef]
  39. Eldardiry, H.; Habib, E. Carbon capture and sequestration in power generation: Review of impacts and opportunities for water sustainability. Energy Sustain. Soc. 2018, 8, 6. [Google Scholar] [CrossRef]
  40. IPCC. Summary for Policymakers. In Climate Change 2023: Synthesis Report Contribution of Working Groups, I; II; III to the Sixth Assessment Report of the Intergovernmental Panel on Climate Change; Core Writing Team, Lee, H., Romero, J., Eds.; IPCC: Geneva, Switzerland, 2023; pp. 1–34. [Google Scholar] [CrossRef]
  41. IEA. Water-Energy Nexus; IEA: Paris, France, 2017; Available online: https://www.iea.org/reports/water-energy-nexus (accessed on 24 August 2025).
  42. Wu, H.; Zeng, X.; Zhang, L.; Liu, X.; Jiang, S.; Dong, Z.; Meng, X.; Wang, Q. Water-energy nexus embedded in coal supply chain of a coal-based city, China. Resour. Policy 2023, 85, 103812. [Google Scholar] [CrossRef]
  43. Gao, X.; Zhao, Y.; Lu, S.; Chen, Q.; An, T.; Han, X.; Zhuo, L. Impact of coal power production on sustainable water resources management in the coal-fired power energy bases of Northern China. Appl. Energy 2019, 250, 821–833. [Google Scholar] [CrossRef]
  44. World Bank. Climate Investment Opportunities in India’s Cooling Sector; International Bank for Reconstruction and Development/The World Bank: Washington, DC, USA, 2022; Available online: https://documents1.worldbank.org/curated/en/099920011222212474/pdf/P15743300f4cc10380b9f6051f8e7ed1147.pdf (accessed on 12 June 2025).
  45. Mikulčić, H.; Baleta, J.; Klemeš, J.J.; Wang, X. Energy transition and the role of system integration of the energy, water and environmental systems. J. Clean. Prod. 2021, 292, 126027. [Google Scholar] [CrossRef]
  46. Lilliestam, J.; Thonig, R.; Späth, L.; Caldés, N.; Lechón, Y.; Del Río, P.; Kiefer, C.; Escribano, G.; Touza, L.L. Policy pathways for the energy transition in Europe and selected European countries. In Update September 2019. MUSTEC Project Deliverable; SCCER JA IDEA, ETH Zürich: Zürich, Switzerland, 2019; Volume 7, Available online: https://media.realinstitutoelcano.org/wp-content/uploads/2021/11/lilliestam-etal-2019-policy-pathways-for-the-energy-transition-in-europe-and-selected-european-countries.pdf (accessed on 24 August 2025).
  47. Allen, M.R.; Dube, O.P.; Solecki, W.; Aragón-Durand, F.; Cramer, W.; Humphreys, S.; Kainuma, M.; Kala, J.; Mahowald, N.; Mulugetta, Y.; et al. Framing and Context. In Global Warming of 1.5 °C. An IPCC Special Report on the Impacts of Global Warming of 1.5 °C Above Pre-Industrial Levels and Related Global Greenhouse Gas Emission Pathways, in the Context of Strengthening the Global Response to the Threat of Climate Change, Sustainable Development, and Efforts to Eradicate Poverty; Masson-Delmotte, V., Zhai, P., Pörtner, H.-O., Roberts, D., Skea, J., Shukla, P.R., Pirani, A., Moufouma-Okia, W., Péan, C., Pidcock, R., et al., Eds.; Cambridge University Press: Cambridge, UK; New York, NY, USA, 2018; pp. 49–92. [Google Scholar] [CrossRef]
  48. Parkinson, S. Guiding urban water management towards 1.5 °C. npj Clean Water 2021, 4, 34. [Google Scholar] [CrossRef]
  49. Stillwell, A.S.; Webber, M.E. Novel methodology for evaluating economic feasibility of low-water cooling technology retrofits at power plants. Water Policy 2013, 15, 292–308. [Google Scholar] [CrossRef]
Figure 1. Electricity demand (upper Figure) and water demand (lower Figure) in the CP and NZ scenarios, from 2020 to 2050, PROMETHEUS results.
Climate 13 00174 g001
Figure 2. Global water consumption by power generation technology in the static case (in ‘000’ m3) in the CP (left) and the NZ (right) through 2015 and 2050, Source: PROMETHEUS results.
Climate 13 00174 g002
Figure 3. Global water withdrawal [in ‘000’ m3] in the Current Policies in the static and adaptive cases, from 2020 to 2050, source: PROMETHEUS model.
Climate 13 00174 g003
Figure 4. Absolute differences between Adaptive and Static scenarios under the current policies for the EU between 2025 and 2050 (in ‘000’ m3). No differences occur in 2025, source: PROMETHEUS model.
Climate 13 00174 g004
Figure 5. Absolute differences between Adaptive and Static scenarios under the current policies for India between 2025 and 2050 (in ‘000’ m3). No differences occur in 2025, source: PROMETHEUS model.
Climate 13 00174 g005
Figure 6. Absolute differences between Adaptive and Static scenarios under the current policies for China (in ‘000’ m3) between 2025 and 2050. No differences occur in 2025. Source: PROMETHEUS.
Climate 13 00174 g006
Figure 7. Global water withdrawal (in ‘000’ m3) in the Net-Zero scenario in the static and adaptive cases, source: PROMETHEUS model.
Climate 13 00174 g007
Figure 8. Absolute differences between Adaptive and Static scenarios under the Net-Zero scenario for the EU between 2025 and 2050 (in ‘000’ m3). No differences occur in 2025. Source: PROMETHEUS.
Climate 13 00174 g008
Figure 9. Absolute differences between Adaptive and Static scenarios under the Net-Zero scenario for India between 2025 and 2050 (in ‘000’ m3). No differences occur in 2025. Source: PROMETHEUS.
Climate 13 00174 g009
Figure 10. Absolute differences between Adaptive and Static scenarios under the Net-Zero scenario for China (in ‘000’ m3) between 2025 and 2050. No differences occur in 2025. Source: PROMETHEUS.
Climate 13 00174 g010
Table 1. Scenario descriptions.
Scenario NameClimate Policy AmbitionCooling Technology AssumptionsDescription
CP-StaticCurrent policiesStaticRepresents the continuation of current climate policies without new mitigation or adaptation efforts.
CP-AdaptiveCurrent PoliciesAdaptiveReflects the continuation of current climate policies, but with a technological response to water stress.
NZ-StaticNet-zeroStaticReflects ambitious climate policies without adaptation in cooling systems.
NZ-AdaptiveNet-zeroAdaptiveThis scenario assumes strong climate ambition and the uptake of water-efficient cooling technologies.
Disclaimer/Publisher’s Note: The statements, opinions and data contained in all publications are solely those of the individual author(s) and contributor(s) and not of MDPI and/or the editor(s). MDPI and/or the editor(s) disclaim responsibility for any injury to people or property resulting from any ideas, methods, instructions or products referred to in the content.