Article

Youth Perceptions of 1.5-Degree Lifestyle to Adapt to Climate Change: A Case Analysis of Japanese University Students

Graduate School of Media and Governance, Keio University, 5322 Endo, Fujisawa 252-0882, Kanagawa Prefecture, Japan
*
Author to whom correspondence should be addressed.
Climate 2025, 13(9), 171; https://doi.org/10.3390/cli13090171
Submission received: 12 June 2025 / Revised: 5 August 2025 / Accepted: 19 August 2025 / Published: 22 August 2025

Abstract

The 1.5-degree lifestyles aim to reduce household carbon footprints across six areas (food, housing, mobility, consumer goods, leisure, and services), as identified by IGES, relying on public efforts. This study seeks to understand Japanese university students’ perceptions of 1.5-degree lifestyles, their preferred actions for implementation at the individual, family, and community levels, and the top three enablers and barriers they face. Using a questionnaire based on the KIDA (knowledge, interest, desire, action) framework, which aligns with IGES’s six sectors, data from 244 responses collected via snowball sampling were analyzed. Results reveal low awareness of 1.5-degree lifestyles among Japanese university students, along with a moderate desire to learn more. Gender differences were significant, with females showing higher awareness, desire, and action compared to males. Three common barriers identified include challenges with work–life balance, economic concerns, and gaps between knowledge and action. Recommendations emphasize increasing youth awareness and encouraging action on 1.5-degree lifestyles through early environmental education, youth-focused communication (such as social media), and securing strong political support to help address practical challenges.

1. Introduction

According to the latest data from the World Meteorological Organization [1], 2024 was the hottest year on record globally. The global temperature from January to September 2024 was 1.54 °C (±0.13 °C) above pre-industrial levels [1]. Meanwhile, according to [2], Japan’s temperatures from June to August matched the record set in 2023 for the warmest summer since records began in 1898. In line with the Paris Agreement goal of keeping the global temperature rise below 1.5 degrees Celsius and well below 2 degrees Celsius, the Intergovernmental Panel on Climate Change (IPCC) reports that human activities have caused global temperatures to increase by about 1 degree Celsius compared to pre-industrial levels [3]. It is inevitable that the continued rise in global temperatures will have a significant impact on Earth’s environment and its species. The severe degradation of ecosystems, accelerated extinction rates, frequent hazards, and chain reactions are powerful and irreversible.
Climate change is a result of human activities, and humans must accept responsibility for their actions. In response to the 1.5-degree goal and broader climate issues, IGES proposed the concept of ‘1.5-degree lifestyles,’ emphasizing that transforming consumption patterns and dominant lifestyles is crucial for comprehensive climate strategies [4]. Individual lifestyle changes can produce relatively quick results, especially in six areas that do not heavily depend on infrastructure. These are actions we can take now, without waiting for systemic changes or infrastructure improvements [5]. Moreover, climate action is not only a technical issue but also a moral and ethical one. Choosing a low-carbon lifestyle reflects personal values and responsibility toward future generations.
The 1.5-degree lifestyle refers to a low-carbon or greener way of living that controls one’s carbon footprint to limit emissions and support sustainable development. The term ‘carbon footprint’ typically describes greenhouse gas emissions resulting from human activities related to production and consumption [6]. As indicated by IGES [4], the 1.5-degree lifestyle aims to reduce the carbon footprint across six key sectors identified by them. These sectors are areas where individual consumption patterns can be adapted to meet the 1.5-degree target. Specifically, they are (1) Nutrition (Foods): Emissions from food production, consumption, and waste; (2) Housing: Operational and embodied carbon of residential buildings; (3) Mobility (Transport): Emissions from daily transport and long-distance travel; (4) Consumer Goods: Lifecycle emissions of physical products; (5) Leisure: Emissions from entertainment activities; and (6) Services: Indirect emissions from service sectors. These six sectors account for over 75% of an individual’s lifestyle-related carbon emissions. The HOTorCOOL report examined the 1.5-degree lifestyle approach [7], which used a consumption-based accounting strategy to assess greenhouse gas emissions and potential mitigation strategies. It analyzed the lifestyle carbon footprints of ten countries—high-, middle-, and low-income—and identified key consumption areas with the greatest environmental impact. The reports measured and calculated the carbon footprints associated with daily life across these six sectors: nutrition, housing, mobility, consumer goods, leisure, and services [4,7]. This discussion aims to explore how individuals can modify their lifestyles to reduce their carbon footprint and contribute to achieving the goal of limiting global temperature rise to 1.5 degrees, also known as the 1.5-degree lifestyle.
Since perceptions shape mindsets and influence human behavior, young people are the future of humanity and will likely face the most severe impacts of climate change. Additionally, young people play a crucial role in driving social change, as their behaviors and values will influence future consumption patterns and sustainability standards. As they are more receptive to adopting new practices and responding to climate messaging, it is essential to understand their individual contributions to carbon reduction [8]. Understanding how young people contribute to reducing carbon emissions is crucial for the environment and sustainable development.
This study aligned with the six sectors identified by [4]. Its goal was to explore Japanese university students’ perceptions of 1.5-degree lifestyles, including identifying their preferred actions for practicing them and understanding the key enablers and barriers to adopting these lifestyles. The findings helped develop strategies to increase awareness of 1.5-degree lifestyles and create a more supportive environment for individuals to adopt them.
This research involves three literature review sections: (1) Japan’s Responses to Climate Change; (2) The Potential of a 1.5-Degree Lifestyle in Japan; and (3) Youth Perceptions of Climate Change. The upcoming Materials and Methods Section will detail the research methodology, followed by the Findings and Discussion Sections. Finally, this study concludes with a summary of this article, its limitations, and suggestions for future research.

1.1. Japan’s Responses to Climate Change

Japan has worked to meet its commitment to reduce greenhouse gas (GHG) emissions under the Kyoto Protocol but has achieved unsatisfactory results, according to the IPCC report [3,9]. However, the UN submitted a Greenhouse Gas Emission Reduction Target for 2030 [10], which aims to cut emissions by 26% from the 2013 level by 2030, in line with the Paris Agreement [11]. In 2020, Japan announced plans to become carbon neutral by 2050, seeking to reduce greenhouse gas emissions to net zero [12]. This includes developing renewable energy, improving energy efficiency, and promoting green technologies. Specifically, in the third supplementary budget for 2022, Japan established a JPY two trillion green innovation fund to increase research and development of green technologies, focusing on new energy technologies and Carbon Capture and Storage (CCS) Technology [13].
Furthermore, to support the financing of green projects, Japan has launched climate transition bonds, which are debt instruments used to raise capital for companies or entities moving toward a low-carbon, climate-resilient economy. The government has encouraged enterprises and local governments to issue climate transition bonds, aiming to promote the shift to a low-carbon economy through financial incentives [14]. Zhao et al. argued that climate transition bonds are a crucial component of Japan’s strategy to achieve its ambitious climate goals, including reducing greenhouse gas emissions and expanding renewable energy capacity [15]. Although Japan’s goal of reaching net-zero carbon emissions by 2050 demonstrates its strong commitment, shifting away from the previous monolithic and monopolistic energy policy toward a more democratic climate and energy strategy would help Japan achieve its carbon emissions target [16]. Young people play an essential role in this transition as future consumers, voters, and drivers of community-based climate action. Supporting their engagement is crucial for building a more inclusive and resilient low-carbon society.

1.2. The Potential of 1.5-Degree Lifestyles in Japan

The concept of 1.5-degree lifestyles has been promoted to encourage households and stakeholders to adopt them [17]. A workshop-based design game is an effective way to help participants understand how their actions impact carbon footprints and to discover practical strategies for low-carbon living. In a two-week participatory experiment conducted in four Japanese cities, Liu et al. identified household preferences for sixty-five carbon mitigation options, along with the main barriers and enablers affecting the adoption of low-carbon lifestyles [18]. The study concludes that transitioning to a 1.5-degree lifestyle will require policy support and community involvement to overcome socio-economic and infrastructure-related obstacles. Vadovics et al. carried out a similar experiment in five European countries, focusing on four mitigation options (giving up cars, meat, flying, and living spaces) [19]. The study revealed the challenges that hinder the adoption of low-carbon lifestyles across the EU, which are often pertinent to policymakers, suggesting that some policy adjustments are necessary. Watabe & Yamabe-Ledoux‘s research presented and used three different approaches to utilizing carbon footprints for various purposes, timeframes, and participant discussion formats to promote civic engagement in a 1.5-degree lifestyle [20]. The study highlighted the benefits and limitations of these three strategies, examining the components of citizen engagement in terms of mindset and behavioral change. It also argued that carbon footprint analysis has significant potential to support demand-side climate change mitigation through public participation, encouraging citizens to reflect on social and economic factors influencing their behavior and to explore alternative socio-economic systems.
The 1.5-degree lifestyle discussions mainly originate from Japan and Europe. The common theme in all these suggestions is that policies are necessary to support the effort to achieve the 1.5-degree target. According to studies [21,22], the shift to zero-carbon lifestyles goes beyond individual actions and requires comprehensive systemic change involving businesses, government, and society at large [18,23,24]. The primary goal of this research is to explore the views of the relatively younger generation (Japanese university students) on 1.5-degree lifestyles. Additionally, this study aims to identify the barriers and enablers they see and to determine strategies that could help facilitate the transition to a 1.5-degree lifestyle. These strategies are evaluated based on their impact on publicity, infrastructure development, and policy changes.

1.3. Youth Perception of Climate Change

Climate change poses a significant threat to the mental health of younger generations [25,26,27], and young people have expressed frustration with humanity, dissatisfaction with the current system, and anxiety about the future impacts of climate change [28,29]. Since Swedish climate activist Thunberg delivered a speech at the 2018 United Nations Climate Change Conference, a wave of youth climate activism known as ‘The Greta effect’ has emerged [30].
Since young people have been at the forefront of climate change activism [31], just as they have always led social movements [32,33], youth perception is extremely important in climate adaptation. Some scholars have suggested that addressing climate issues requires interventions and solutions that focus on the potential of young populations [34]. Youth contributions are vital for mobilizing climate action and maintaining climate change goals in the future [35], so supporting young people in actively responding to climate change may help prevent its consequences [27].
A nationwide survey of 17–19 year olds found that over 57.5% already feel the effects of climate change in their lives, and nearly 86% report feeling anxious about future consequences [36]. Although environmental awareness is generally high, public discourse and policy in Japan tend to favor technology-driven, top-down solutions over individual lifestyle changes [7]. Furthermore, while environmental education is included in school curricula [37], it often lacks depth in terms of lifestyle-based carbon literacy. Just as young people have led climate activism, they are also more open to new ideas and more forward-thinking. This study examined whether they can also lead the way in adopting 1.5-degree lifestyles. The youth perspective is crucial because they are not only victims of climate change but also the key generation responsible for solving the problem. Their voices can help shape a more sustainable and equitable future, generating momentum for innovation and change. Youth in the West recognize the importance of individual action on climate change but also express concerns about their limited power to influence systemic issues [29]. This study offers a more comprehensive understanding of how young people in Japan view climate-related behavior change.

2. Materials and Methods

2.1. Research Design

This study used a quantitative approach. Specifically, questionnaires were given based on the KIDA framework (short for knowledge, interest, desire, action) [38] to understand how Japanese university students perceive 1.5-degree lifestyles, as well as the barriers and enablers they see for adopting such lifestyles. To clarify, [38] developed the KIDA framework to help bridge the “awareness–action gap” by encouraging learners to move beyond passive knowledge toward emotional engagement and empowerment. The KIDA framework is used to structure experiential learning programs for youth and communities, promoting resilience-focused behavior change [39].
The questionnaire was designed to collect a broad range of quantitative data. It asked participants to answer from the perspectives of the individual, family, and community to examine differences among groups and individuals.
The study of three aspects of the literature review provides the foundation for creating questionnaires based on the KIDA framework, and the data collected can support the original research goals (Appendix A). Seven sections of questions have been developed: Section 1: Basic Information; Section 2: Knowledge; Section 3: Interest; Section 4: Desire; Section 5: Action; and Section 6: Enablers and Barriers to 1.5-degree Lifestyles. Additionally, this study uses correlation analysis, regression analysis, and content analysis to interpret the data and answer the research questions. Finally, recommendations are made based on the TGE framework (Technology, Governance, and Education) for families, communities, and individuals. The overall analysis framework is shown in Table 1.

2.2. Data Collection

The participants were recruited through purposive and snowball sampling methods and had to meet specific criteria: they needed to be currently enrolled at a Japanese university. The questionnaires were widely distributed at the university where the author teaches, primarily among students, with a QR code linking to the survey displayed in classrooms to further enhance participation. Additionally, the questionnaire was disseminated to other universities across Japan via social media. Respondents were then encouraged to share the survey with others who met the eligibility criteria, following a snowball sampling approach. This study employed a non-probability sampling method, specifically snowball sampling, which enabled the survey to be conducted rapidly and broadly. The data collection period extended from 13 June to 20 October 2024, with a total duration of 130 days. This approach resulted in 224 responses in total, including 127 females, 93 males, and 4 non-binary individuals, with no invalid responses.

2.3. Technical Details

This study used a Google Form to administer the questionnaire and converted it into a QR code to improve dissemination efficiency. Since all questions were mandatory, there were no unanswered responses. For the questionnaire data, this study utilized SPSS 29 software. Multiple rounds of raw data processing were performed using the Excel spreadsheet automatically generated from the Google Form responses, converting it into an appropriate format for further analysis in SPSS.

2.4. Data Analysis

Questionnaire analysis was used to examine the data collected. Statistical methods such as correlation and regression analyses were employed to test several hypotheses derived from the framework. For example, we hypothesize that (1) students who have received environmental education tend to demonstrate a higher level of knowledge; (2) a higher level of knowledge about the 1.5-degree lifestyle is positively linked to behavioral intention (desire); and (3) female students show a stronger desire to act than male students.
A Pearson correlation analysis was conducted to explore the relationships among key variables, such as gender, nationality (Japanese vs. international), and environmental education experience. This assessment revealed the direction and strength of bivariate relationships among the constructs. Each psychological construct, including “interest” and desire, was treated as a composite variable created by calculating the mean score of relevant Likert-scale items. Other variables such as “knowledge”, “gender”, “nationality”, and “whether the respondents had received environmental education” were dummy-coded for analysis.
To further quantify the predictive value of individual factors, a multiple linear regression analysis was conducted with “desire” as the dependent variable. The independent variables were “knowledge” and “interest”, which were measured using multi-item Likert scales and converted into composite scores via mean averaging. The control variables were “gender” (female, male, or non-binary), “nationality” (Japanese or non-Japanese), and “whether the respondents had received environmental education” at various levels (elementary, middle, high school, university, or no), with each variable dummy-coded for analysis. This regression model enabled this study to estimate the relative contribution of each predictor to behavioral intention while adjusting for potential confounding factors.
The regression model is expressed as follows:
Desireᵢ = β0 + β1·Knowledge_Yesᵢ + β2·Knowledge_Noᵢ + β3·Interestᵢ + β4·Gender_Femaleᵢ + β5·Gender_Maleᵢ + β6·Nationality_NonJPᵢ + β7·Edu_Elemᵢ + β8·Edu_Midᵢ + β9·Edu_Highᵢ + β10·Edu_Univᵢ + εᵢ
where Desireᵢ is the dependent variable, the behavioral intention level of respondents; Interestᵢ is the independent variable, the behavioral intention level of respondents; the dummy-coded variables capture categorical responses (e.g., knowledge, gender, and education level); and εᵢ is the error term or random disturbances.
This study also investigated relationships within various aspects of the KIDA framework. Additionally, by analyzing the most frequently chosen actions, enablers, and barriers, along with their correlations with other variables, this study aims to identify potential strategies to enhance youth perception and propose policy recommendations. Overall, the results will clarify whether the hypotheses are supported or if alternative outcomes emerge. This will help define the objective of this study, which is to understand participants’ perceptions of 1.5-degree lifestyles and the underlying patterns.

2.5. Ethical Considerations

This study was carried out in accordance with established ethical guidelines for research involving human participants. All respondents were informed of the research’s purpose prior to their participation. Participants were also made aware that their participation was voluntary. However, because it is difficult to remove anonymized survey data after submission, participants could not withdraw their answers once they had completed the survey. Informed consent was provided in digital written form at the top of the Google Form (questionnaire). When potential participants accessed the Google Form, they could see it. To protect confidentiality and ensure anonymity, all responses were stored securely and carefully. No identifiable information was included in this study, and all names remained anonymous. Although no pilot test was conducted, a pre-test was conducted within the laboratory to which the researcher belongs.

3. Results

This study’s findings are organized into three main sections: (1) Recognition of the 1.5-Degree Lifestyle; (2) Preferences for Actions to Change Lifestyle; and (3) Perceived Enablers and Barriers to Adopting a 1.5-Degree Lifestyle. Each section highlights key patterns and insights from the survey responses.

3.1. Recognition of 1.5-Degree Lifestyle

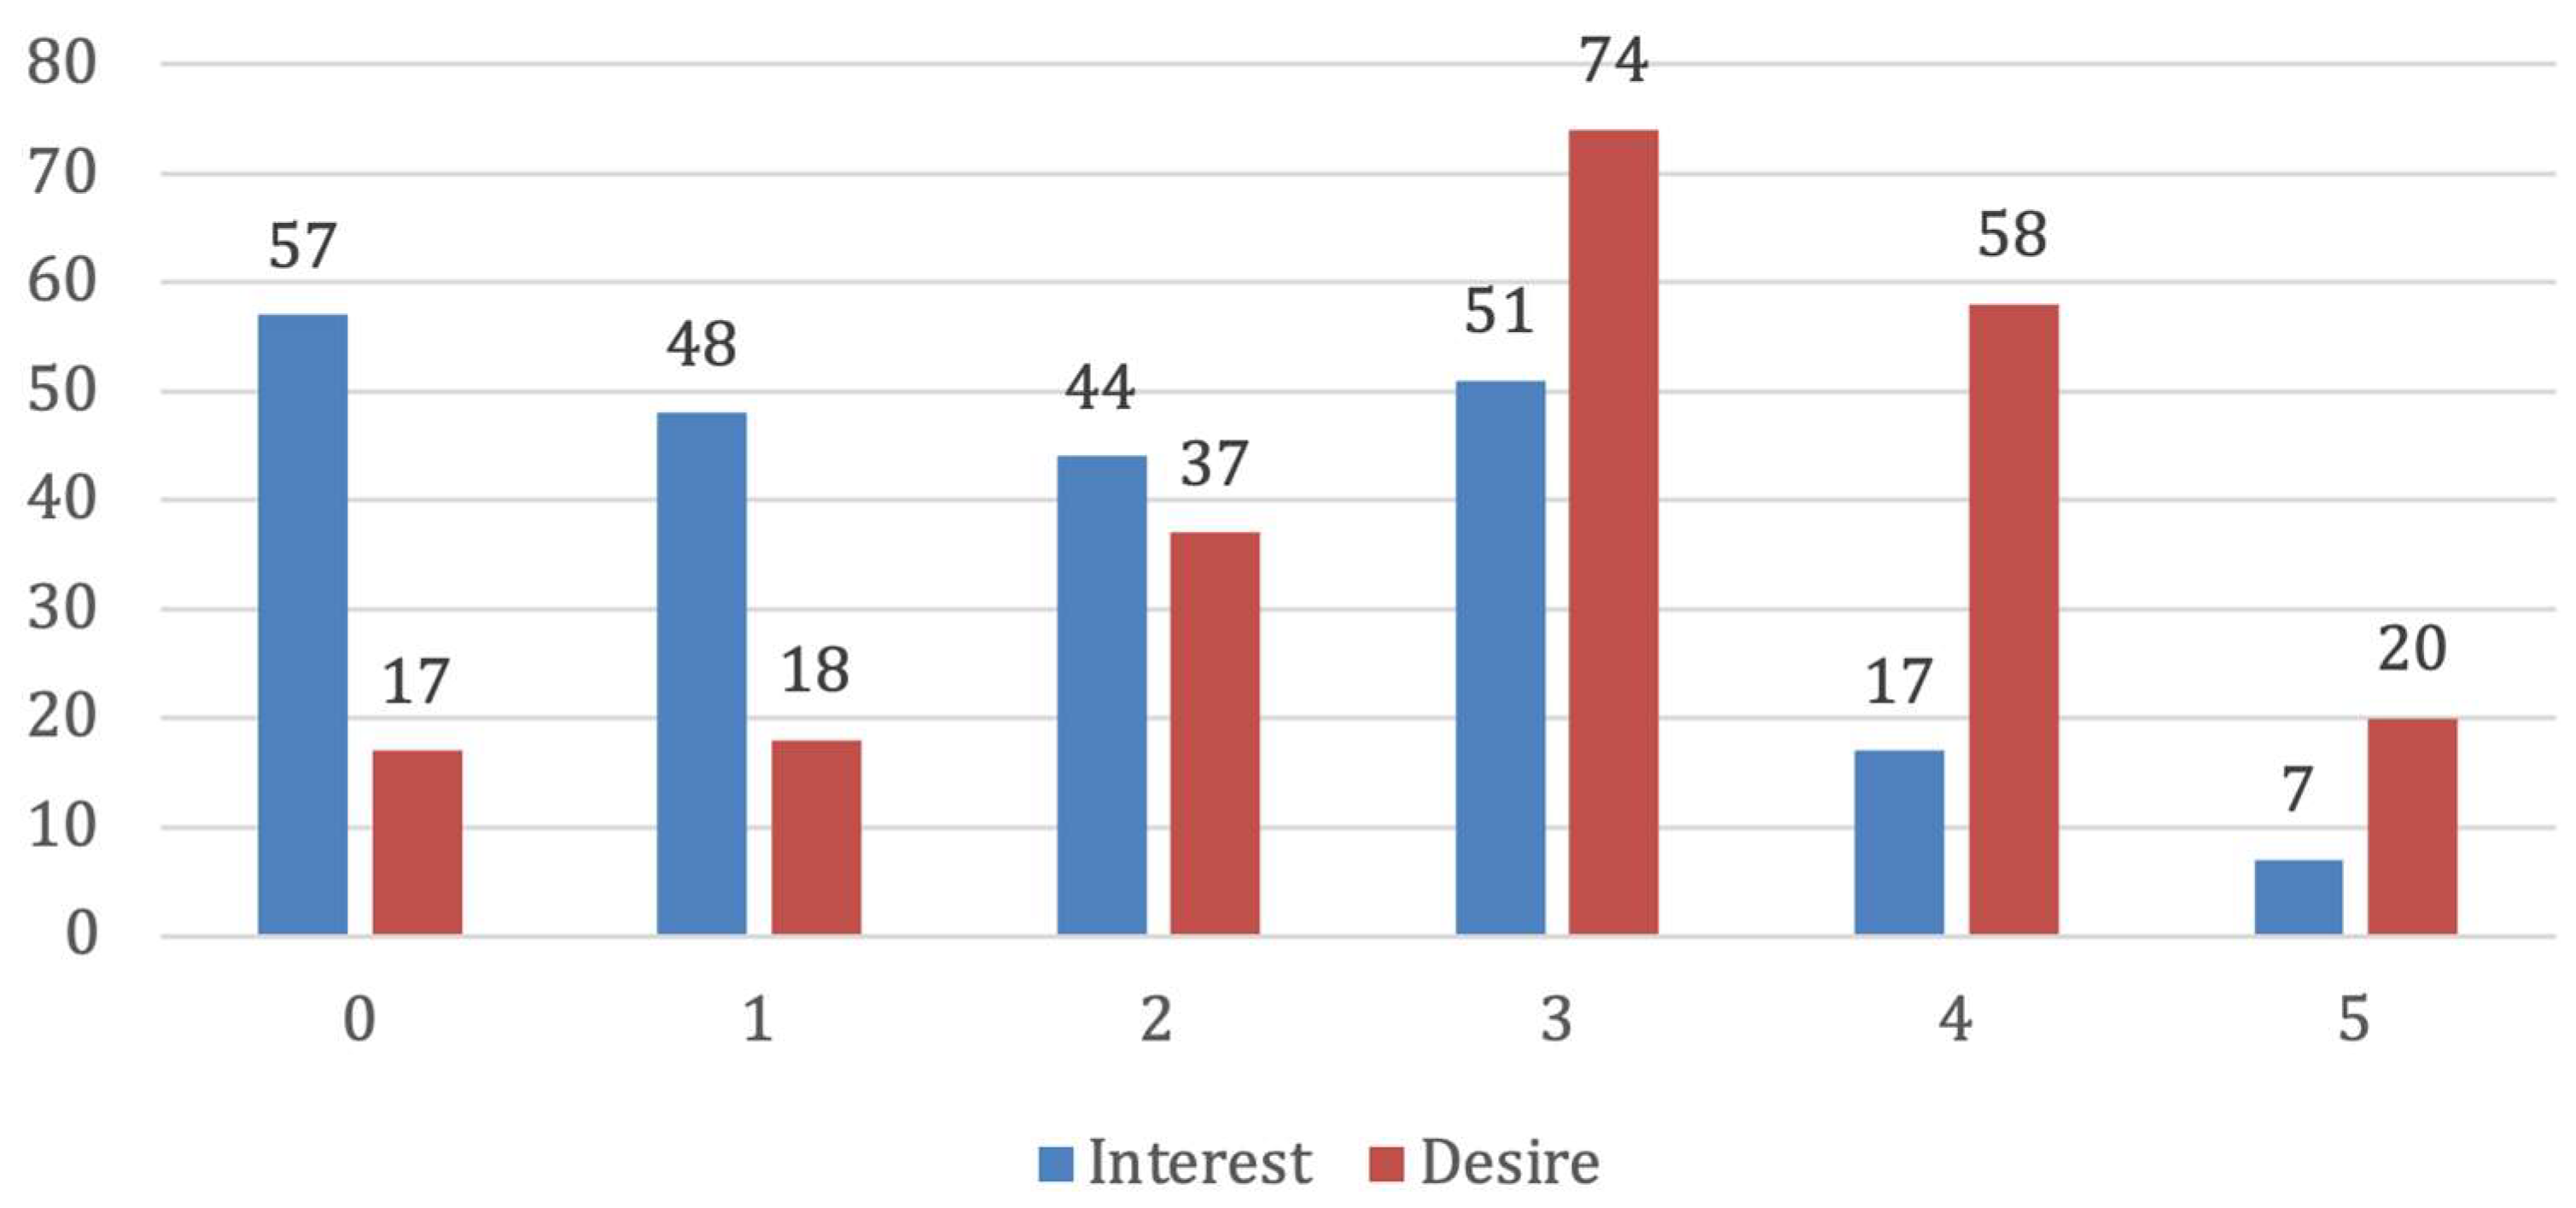
This section examined participants’ knowledge, interest, and desire related to a 1.5-degree lifestyle, as outlined in the KIDA framework. There is a clear lack of awareness among Japanese university students concerning 1.5-degree lifestyles. Nearly half of the respondents (44.6%) reported that they had never heard of the concept, while 21% were unsure. This indicates that their understanding of 1.5-degree lifestyles is either limited or unclear. Responses to the question ‘How familiar are you with the 1.5-degree lifestyles?’ also support this conclusion (Figure 1, prepared by the authors). Specifically, 55.4% of respondents chose the 0–1-degree option. Figure 2 shows that 35.8% of respondents who selected degrees 2–3 found the concept to be vague. Notably, 34.4% of the population were unaware of the 1.5-degree lifestyles concept. Additionally, only 1.3% of respondents demonstrated a high level of familiarity with 1.5-degree lifestyles, highlighting a significant knowledge gap.
Regarding the participants’ interest in 1.5-degree lifestyles, it was found that 25.4% of them lacked comprehension of the meaning and purpose of 1.5-degree lifestyles (Figure 2, prepared by the authors). Additionally, only 3.1% of them showed confidence in their understanding of this concept and selected degree 5. When the level of understanding was a high degree of 4, only one in ten individuals demonstrated this level of comprehension.
Figure 2 showed that respondents’ interest in learning more about 1.5-degree lifestyles tends to be moderate. The largest group, at 33%, chose degree 3, followed by 25.9% who chose degree 4. This is a very positive sign. Although overall interest in 1.5-degree lifestyles is not very high, the desire to learn and understand is present, which is very helpful for promoting such lifestyles.
Table 2 shows that there is a significant positive impact on “desire” from the following aspects:
Interest (β = 0.428, t = 5.990, p < 0.01); middle school education (β = 1.050, t = 2.899, p < 0.01); high school education (β = 1.014, t = 3.021, p < 0.01); and university education (β = 1.136, t = 3.341, p < 0.01). In contrast, no statistically significant effects were found for binary responses (‘Yes’: β = −0.086, p = 0.721; ‘No’: β = 0.132, p = 0.540); gender (‘female’: β = 0.076, p = 0.799; ‘male’: β = 0.334, p = 0.287); nationality (‘non-Japanese’: β = −0.332, p = 0.055); and elementary school education (β = 0.630, p = 0.087). With an R2 value of 0.278, 27.8% of the variance in “desire” is explained by the included predictors. This is considered an acceptable level of explanation in the behavioral and social sciences, where outcomes are influenced by multiple unmeasurable factors [40,41]. Despite the modest R2, the overall regression model is statistically significant (F = 8.202, p < 0.01), and several predictors—particularly “interest” and exposure to environmental education—show statistically significant effects.
Generally, interest level showed the strongest predictive power for ‘desire’. Educational experience above elementary level consistently predicted increased ‘desire’. Demographic factors (gender/nationality) did not significantly influence ‘desire’. Finally, all significant predictors demonstrated positive relationships (β > 0).
From the perspective of gender (Table 3, prepared by the authors), males showed significantly lower knowledge compared to females (χ2 = 4.32, p = 0.038) (Table 2, made by authors). Females displayed a slightly higher level of cognition, showing a slightly higher interest and a notable desire towards learning and understanding 1.5-degree lifestyles. The finding is consistent with previous research indicating that female subjects are more proactive in advancing their behavior in line with 1.5-degree lifestyles [18,42]. Non-binary individuals show no high desire (4–5) responses, and there is a lack of a large sample size for further analysis.
Regarding the perspective of whether the respondents have received environmental education, the following findings were found (Table 4, made by authors):
  • Early education (elementary/middle school) shows the highest awareness levels (40–50% ‘Yes’), and awareness declines progressively through higher education levels.
  • The non-educated group demonstrates significantly lower awareness (15%) and higher skepticism (75% ‘Not sure’).
  • The Interest distribution remains relatively stable across education levels (40–45% low; 42–46% moderate). However, non-educated group shows markedly lower interest (75% ‘0–1’; 0% ‘4–5’).
  • Desire strengthens significantly from elementary to higher education levels. Middle school through university show remarkably similar desire patterns. The non-educated group again demonstrates the weakest engagement in desire (50% ‘0–1’).

3.2. Preference for Actions to Change Lifestyle

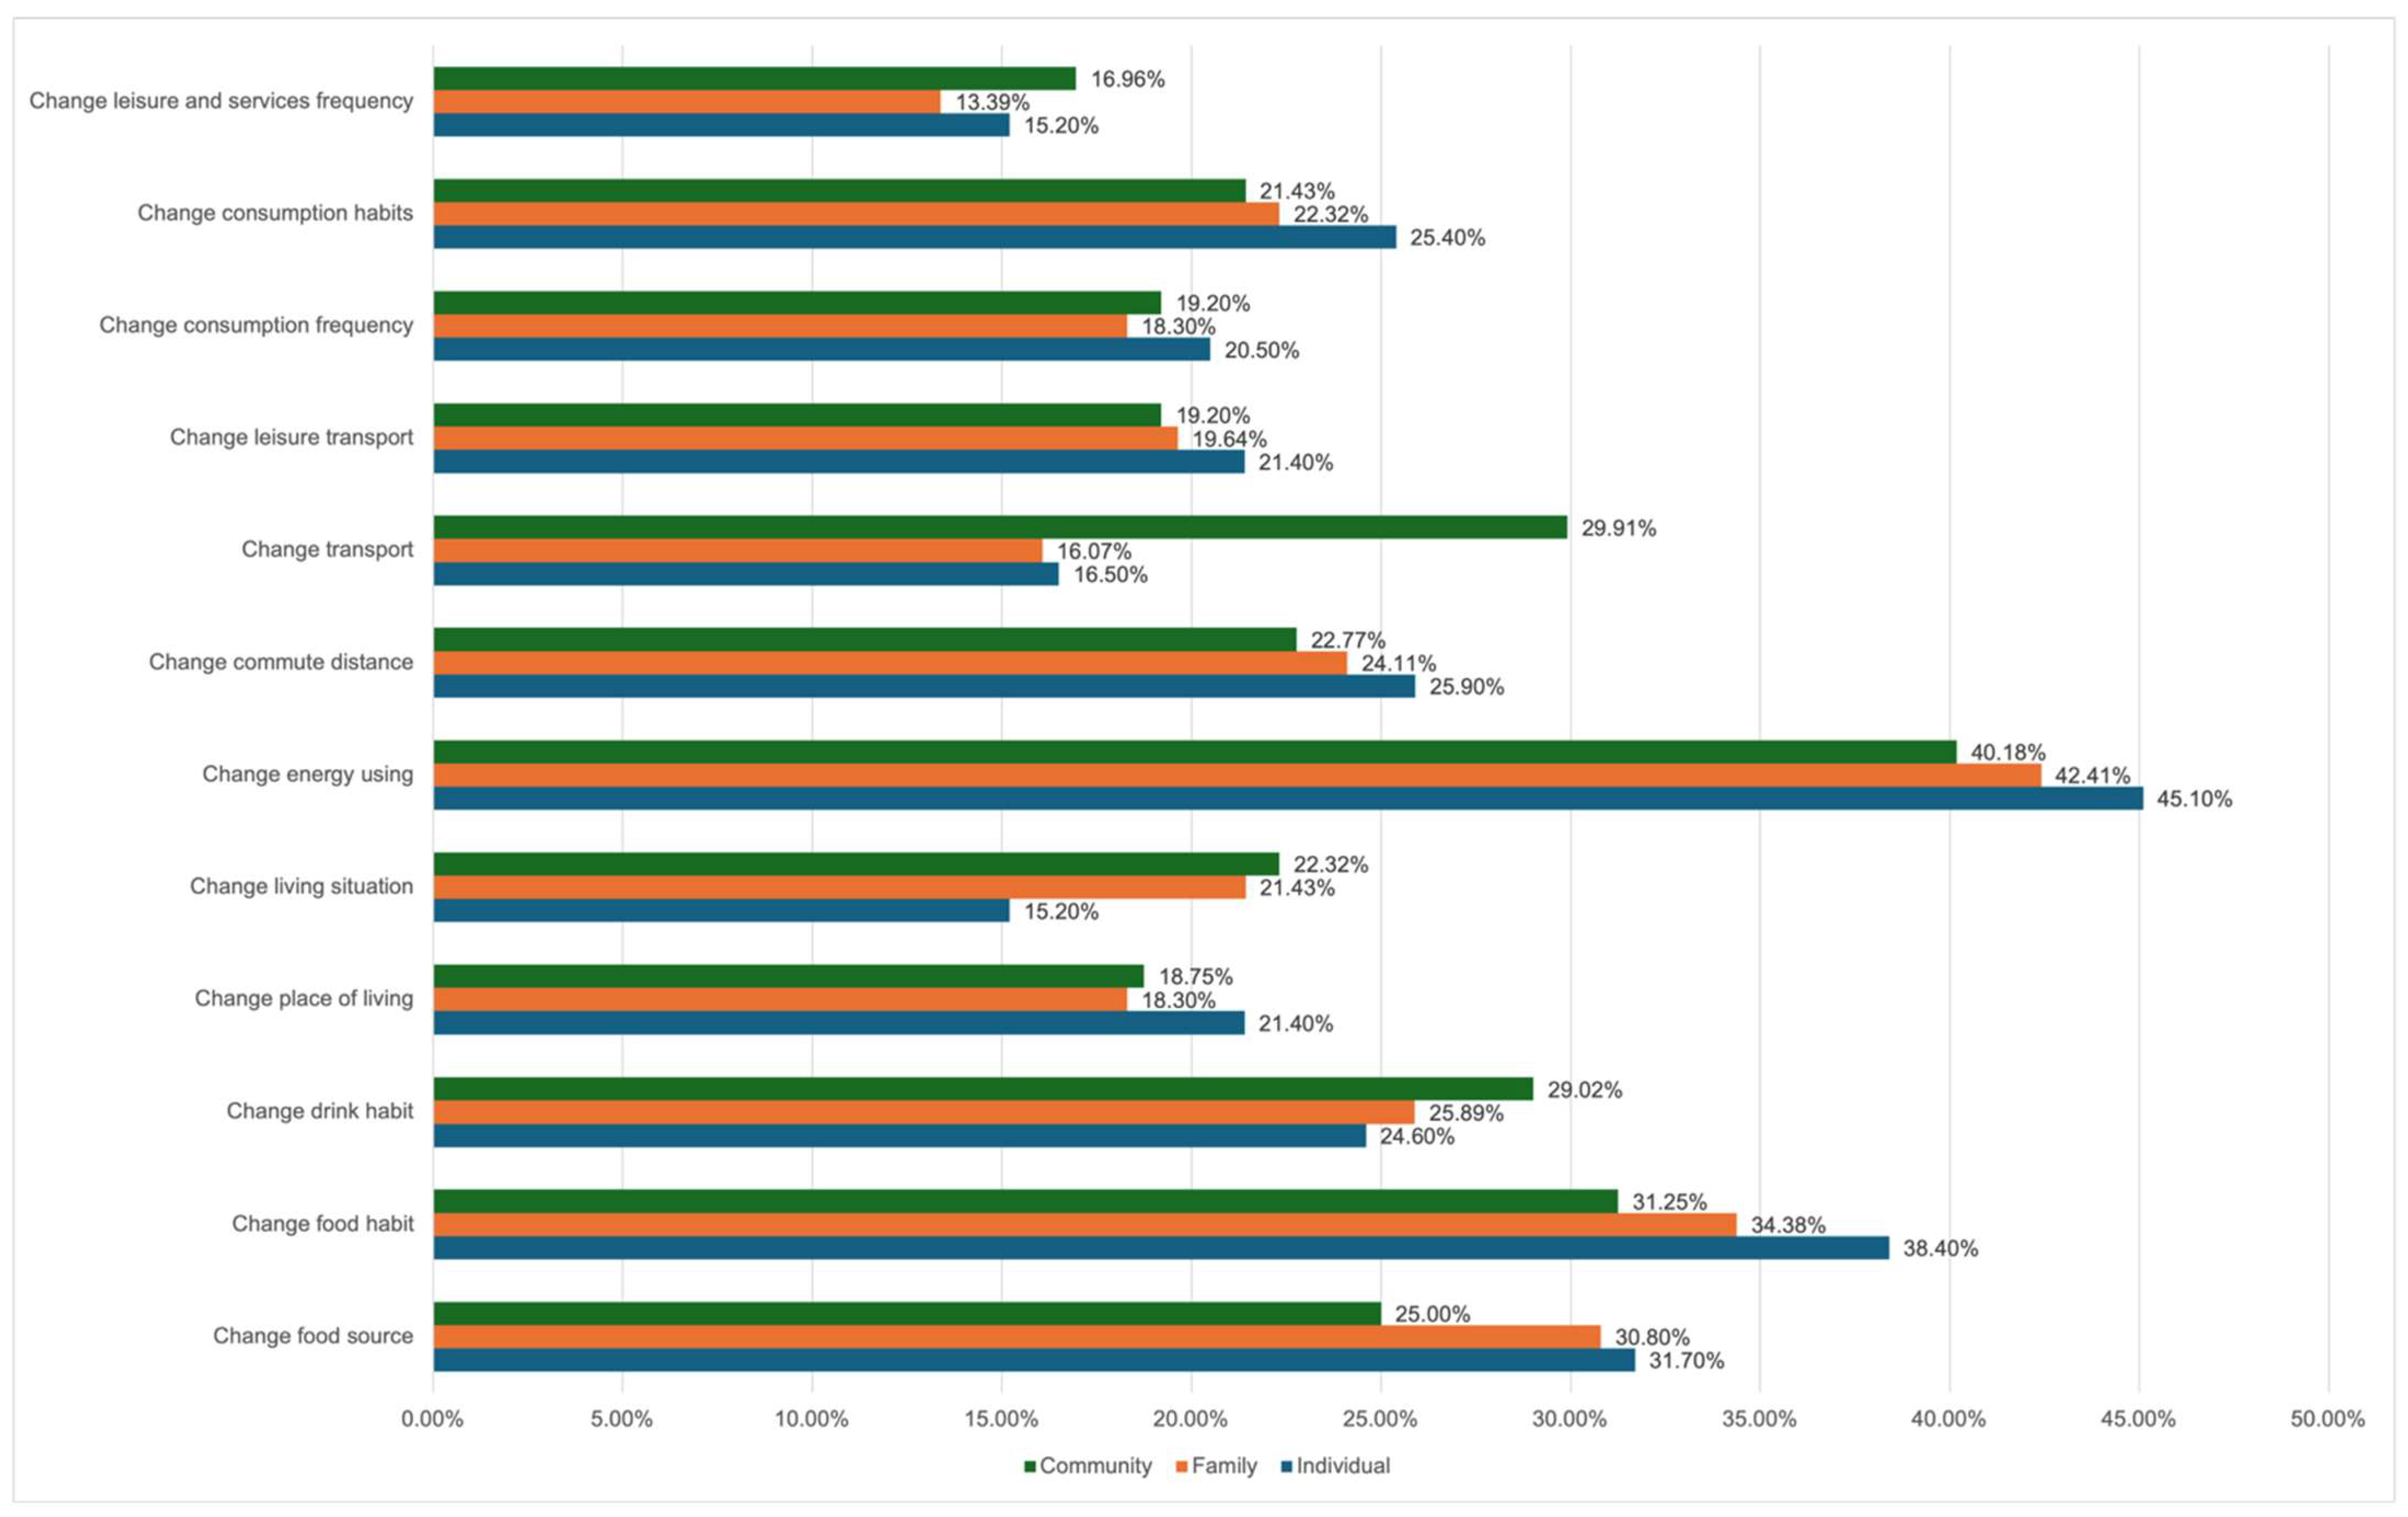
This section explores the types of lifestyle changes participants are most willing to make and identifies their preferred actions across six sectors. These actions are grouped into five categories: food, housing, mobility, consumer goods, and leisure and services. As shown in Figure 3 (created by the authors), most respondents indicated they are most likely to change their food habits, with nearly half choosing this option. Conversely, the least selected response was to alter their drinking habits. Regarding housing, there are small differences among individuals, families, and communities. Similarly, for individuals, ‘change energy use’ was the most common choice, while ‘change place of living’ was the least selected. Notably, the proportion of ‘change place of living’ among individuals is higher than among families and communities, which makes sense since individuals can change their personal addresses more frequently than families or communities. In terms of mobility, ‘change commute distance’ was the most common response for both individuals and families, while ‘change commute transport’ was most frequent among communities, reflecting the challenges of community mobility. Concerning consumer goods, individuals and families have similar preferences, but the community as a whole differs. The most likely choice for individuals and families is ‘change consumption frequency,’ whereas for communities, ‘change consumption habits’ is more common. Finally, in leisure and services, the category with the largest proportion—about 60%—is ‘change the most frequent leisure and services.’

3.2.1. Differences in Nationality and Gender Regarding Lifestyle Change Preferences

This section demonstrates how nationality and gender influence willingness to adopt sustainable lifestyle changes, highlighting notable cross-cultural and gender differences in behavioral preferences.
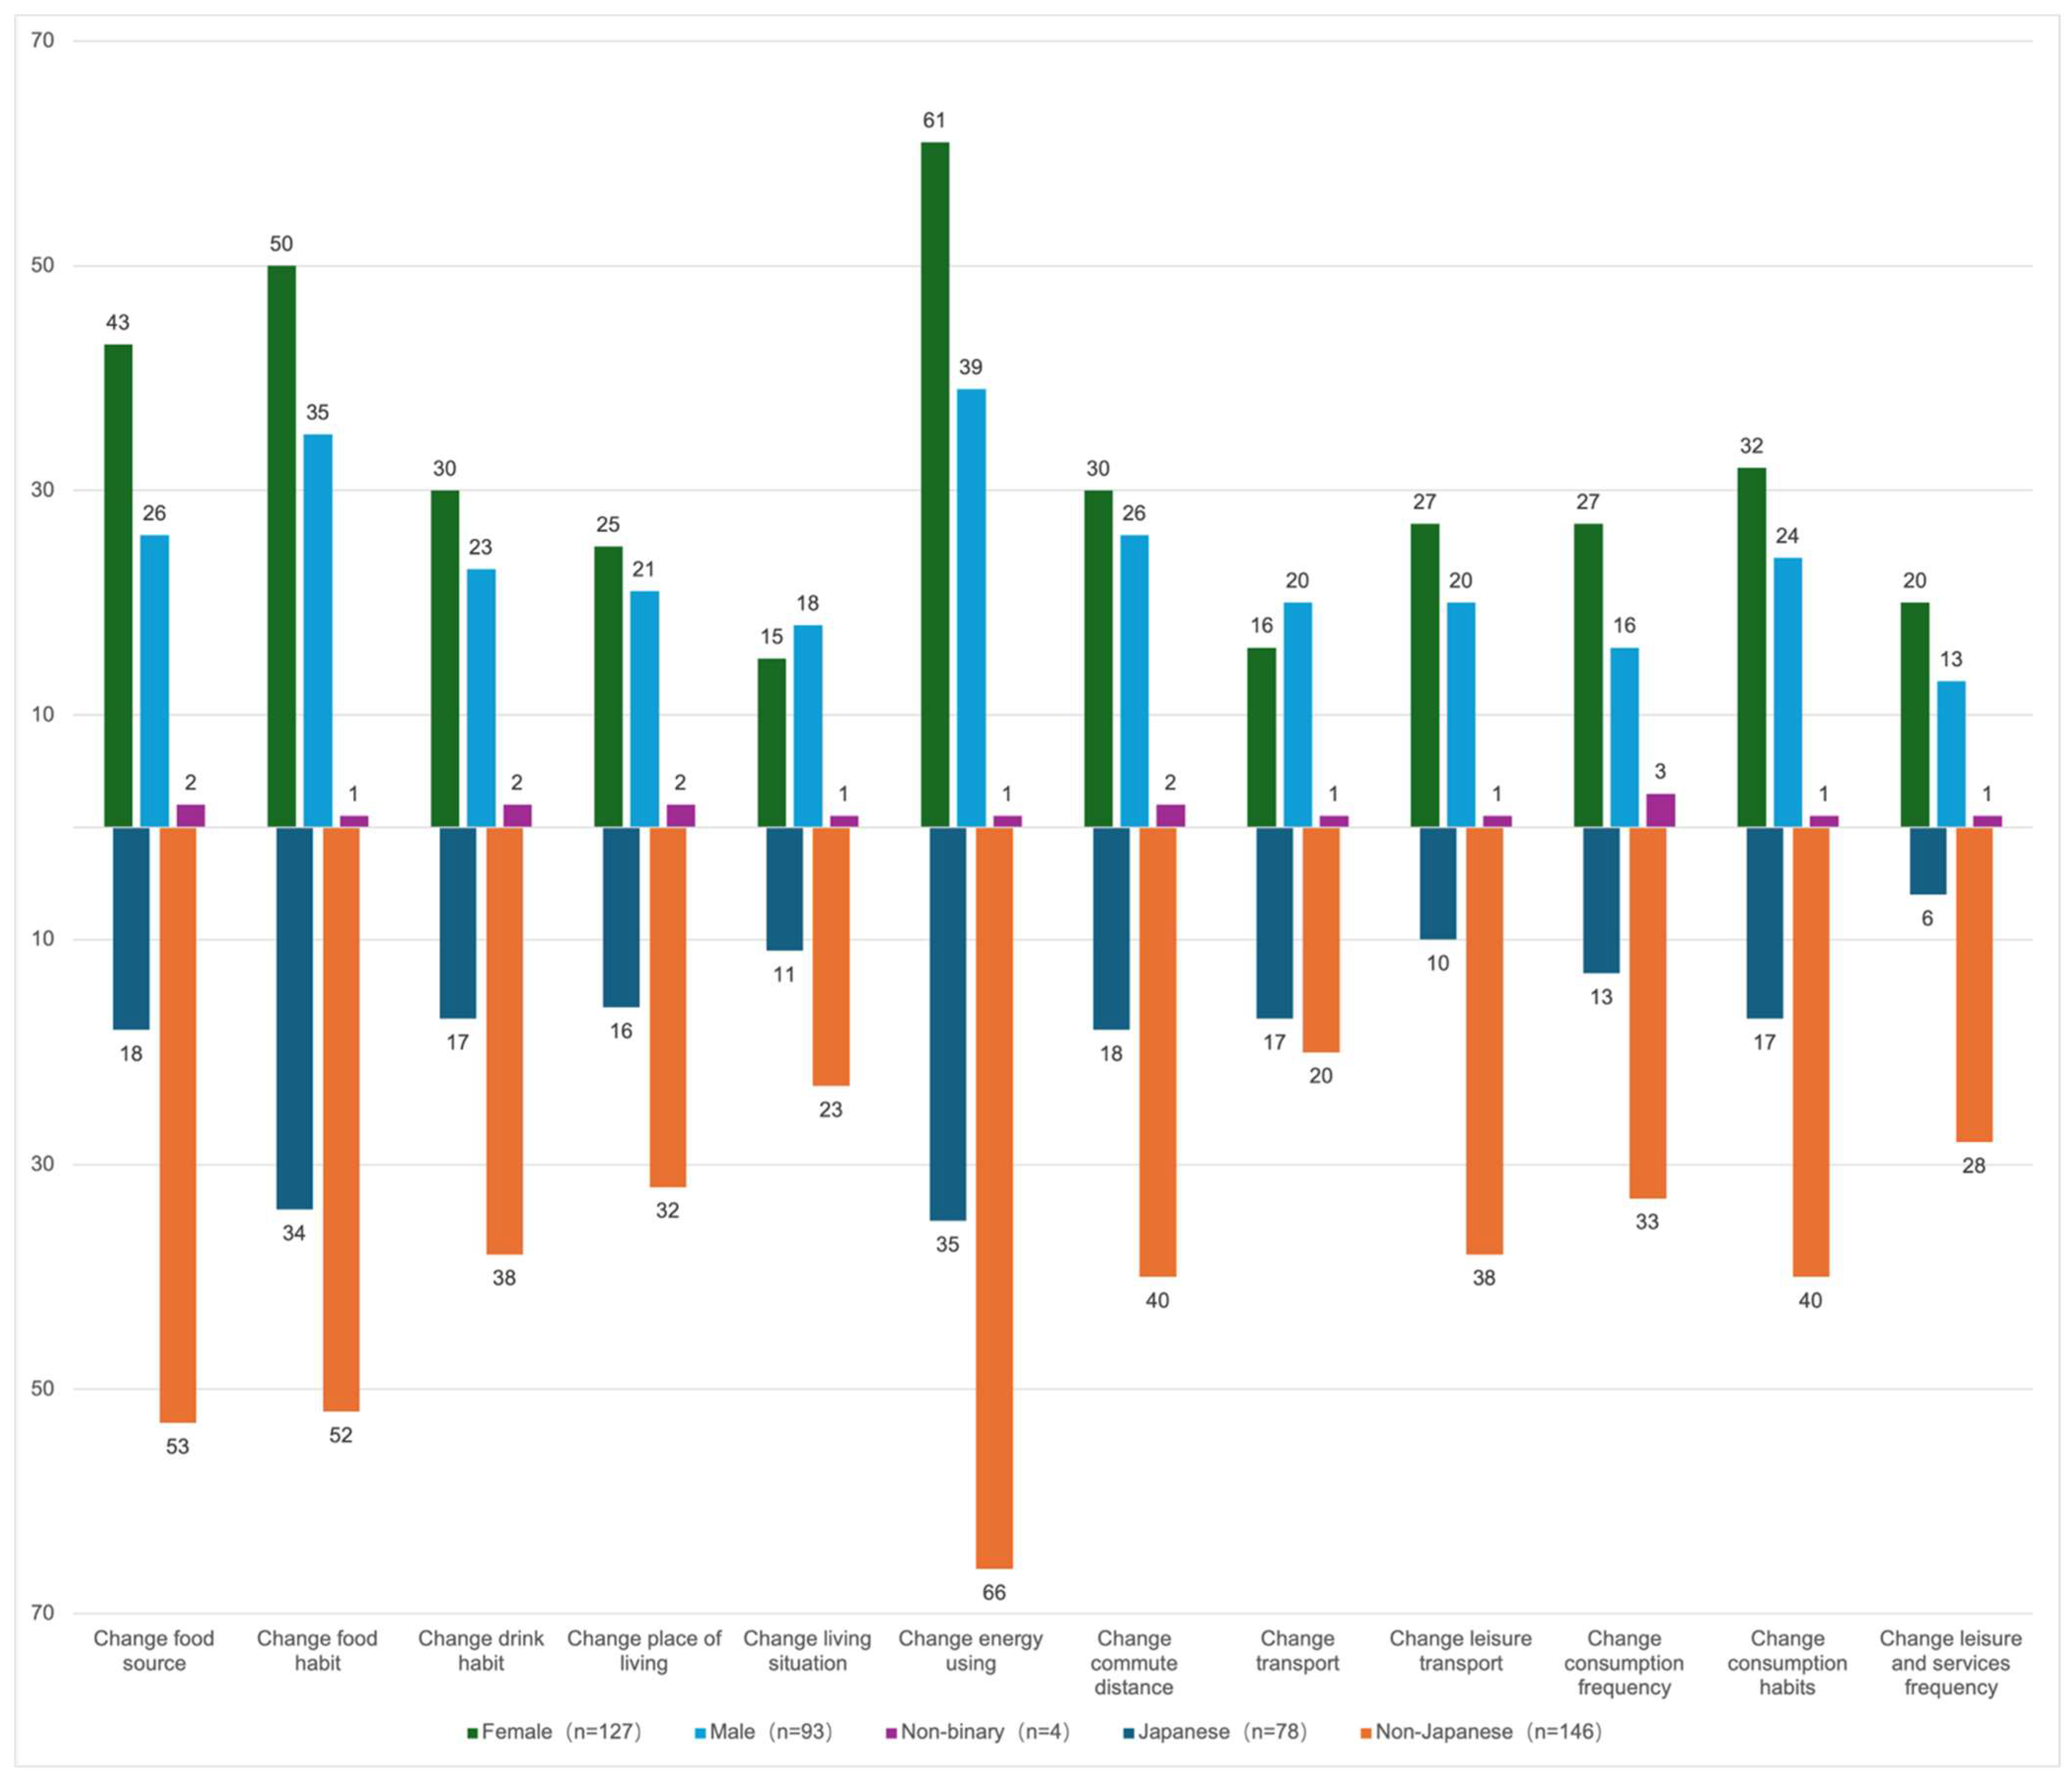
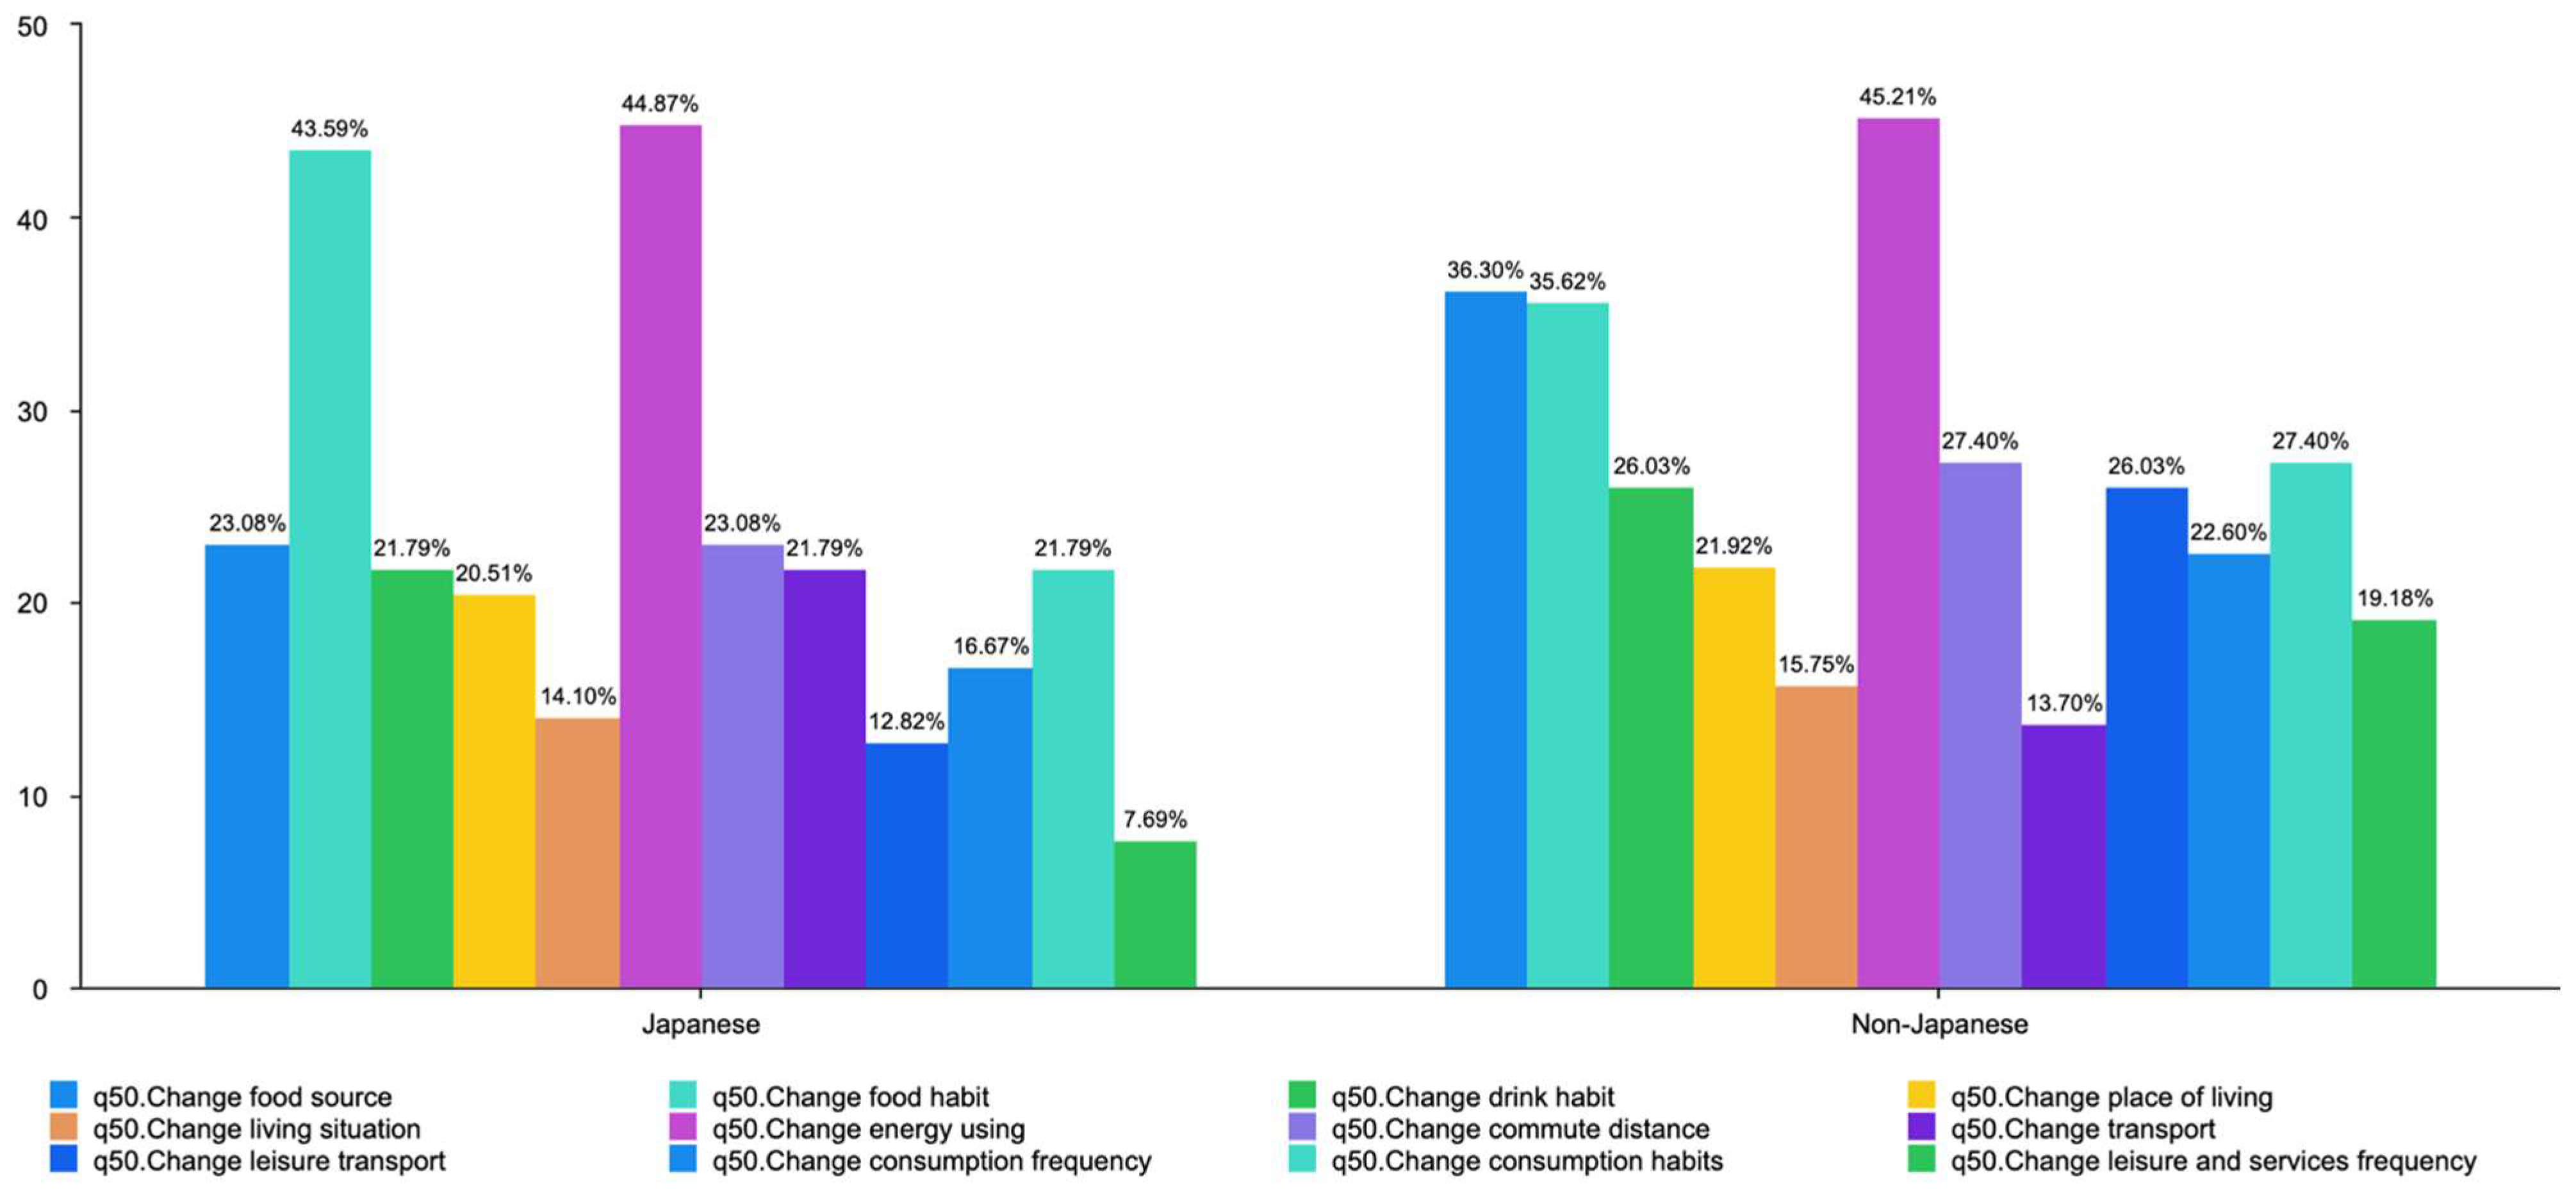
Figure 4 (created by the authors) shows significant differences in lifestyle change preferences based on nationality and gender. Among various nationalities, non-Japanese respondents exhibit higher adoption rates for several key changes: a 65% greater likelihood of ‘changing energy use’ (66 versus 35 adopters), a 53% higher preference for ‘changing eating habits’ (52 versus 34), and a greater likelihood of ‘changing leisure transport’ (38 versus 10). There are also marked gender differences, with female participants showing stronger engagement across multiple categories. Women are 56% more likely to adopt changes in energy use (61% versus 39%), 43% more likely to change their eating habits (50% versus 35%), and 69% more likely to modify consumption patterns (27% versus 16%) than men.

3.2.2. Analysis of Lifestyle Change Preferences Based on Knowledge Level and Desire

This section examines how preferences for sustainable lifestyle changes systematically vary depending on when participants acquire environmental knowledge and their personal motivation to act, revealing threshold effects in their willingness to change behavior.
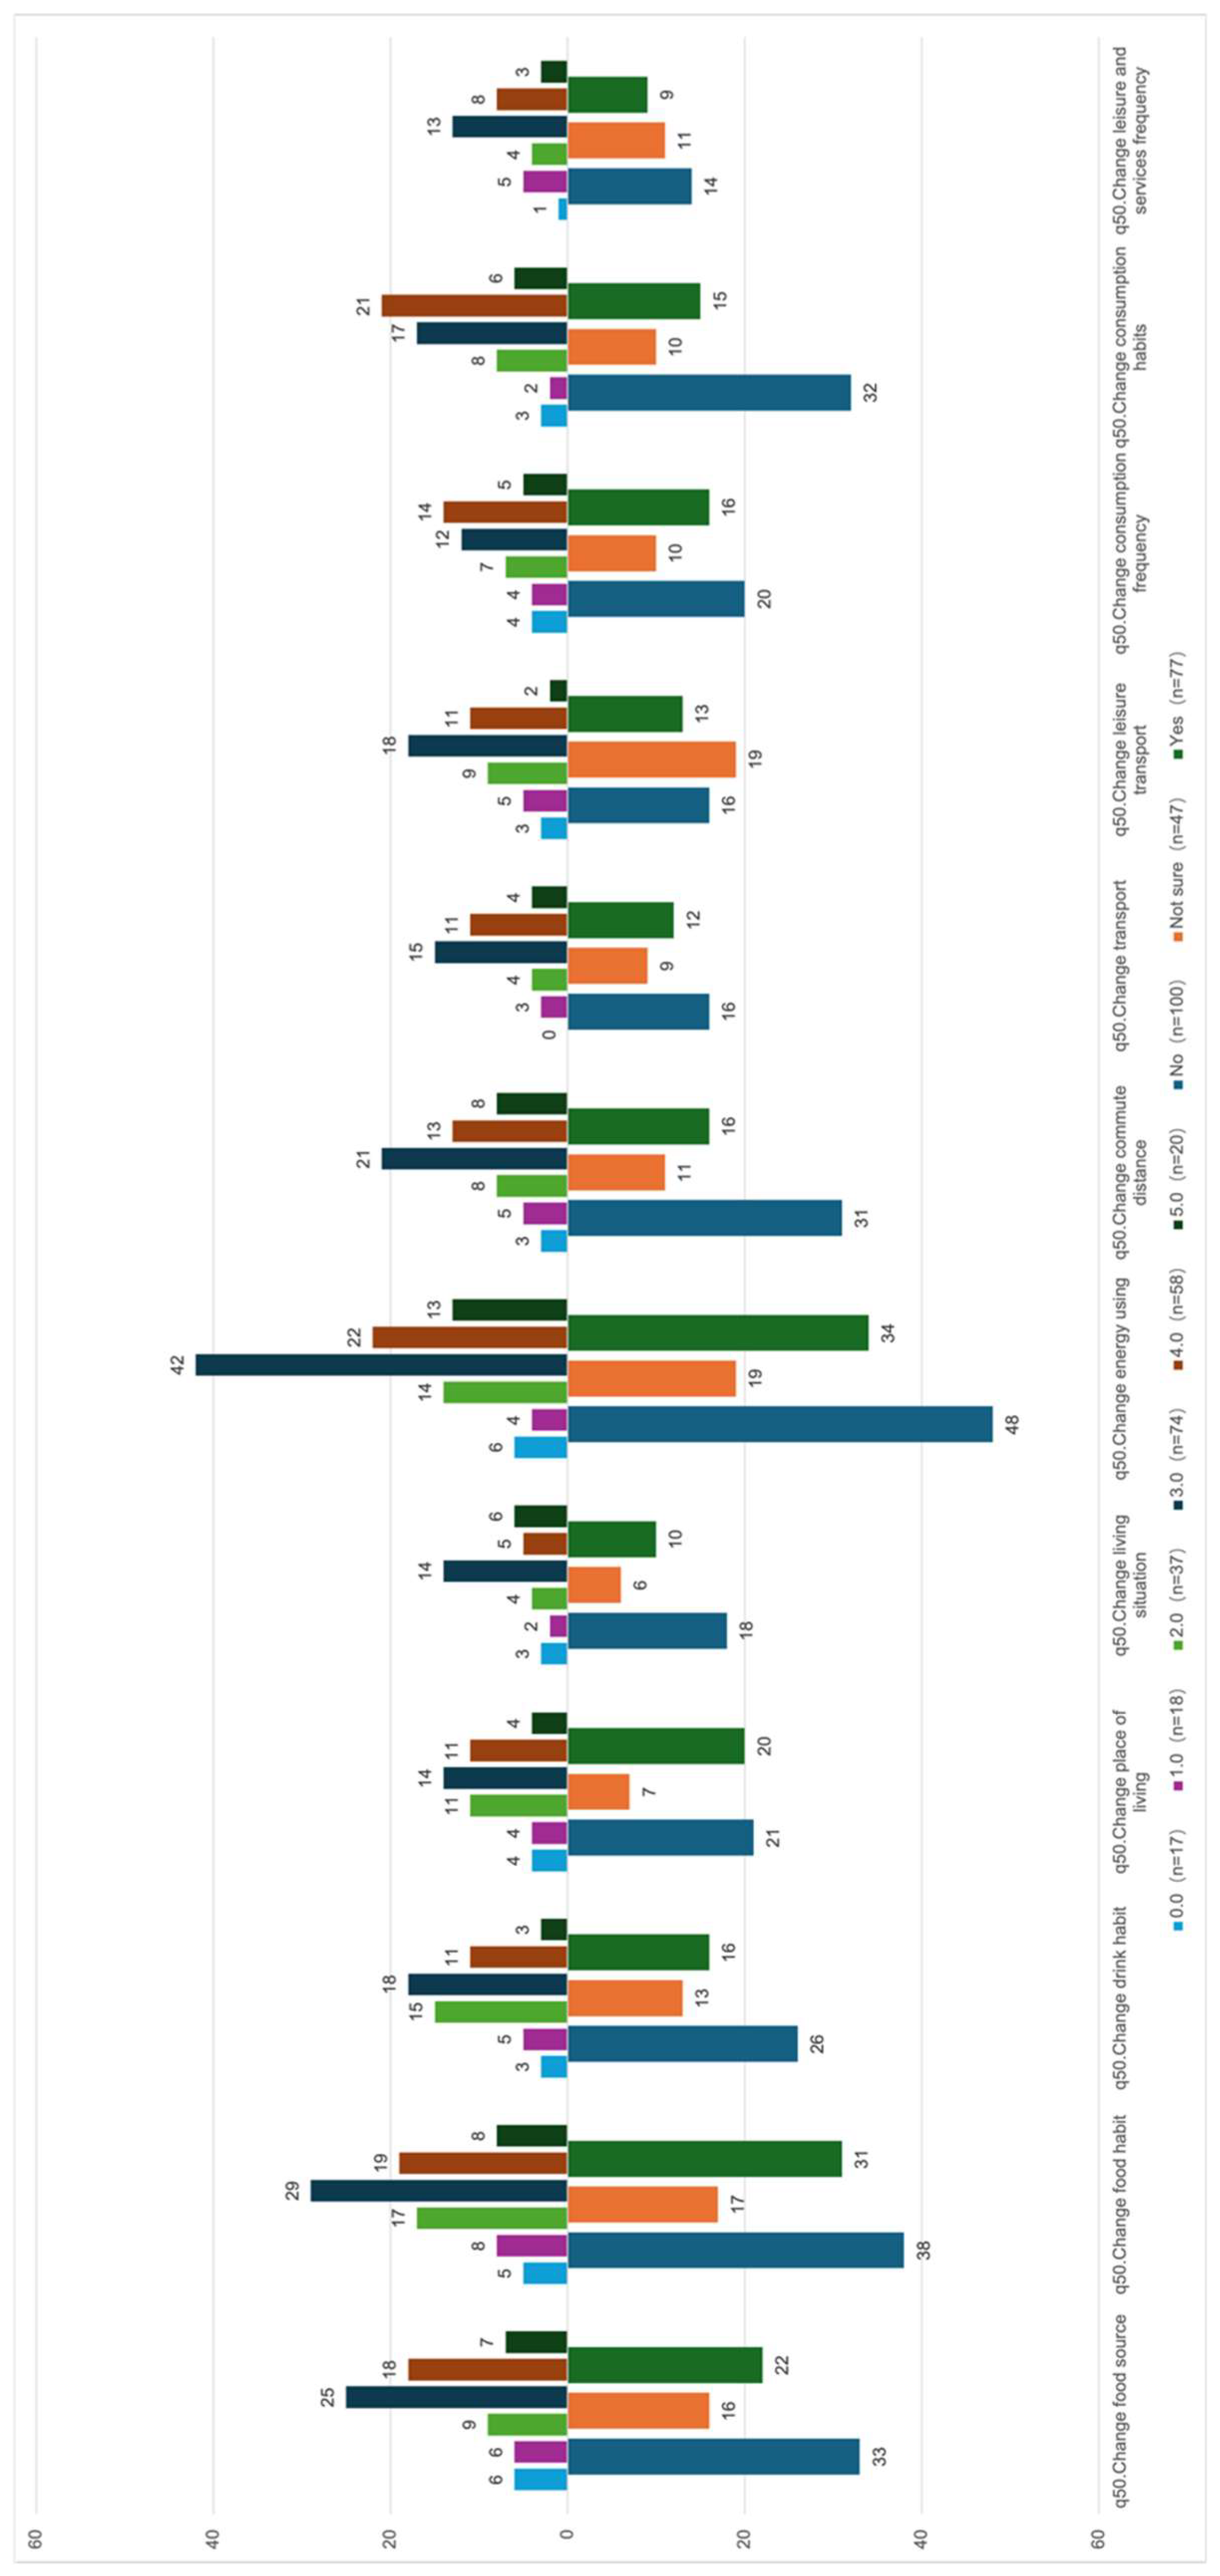
This study revealed clear patterns in preferences for lifestyle changes based on levels of awareness and interest (Figure 5, prepared by the authors). Across all awareness categories (No/Not sure/Yes), energy-related changes consistently rank as the most chosen actions (48, 19, and 34 adopters, respectively), closely followed by changes in eating habits (38, 17, and 31). Interestingly, respondents who were not aware (‘No’) were more likely to select energy and food habit changes than those who were aware (‘Yes’). The ‘Yes’ group showed slightly higher engagement in changes to their living environment (20 vs. 21) and leisure transport (13 vs. 16). Looking at the level of desire on a 0–5 scale, respondents with high interest (4–5) favored energy changes (22 at 4.0, 13 at 5.0), changes in eating habits (19, 8), and modifications in consumption patterns (21, 6). Conversely, those with low interest (0–1) showed minimal involvement in transport or housing changes. Participants with a moderate interest (2–3) mainly adopted energy (14 at 2.0, 42 at 3.0) and food habits (17 at 2.0; 29 at 3.0). Intersectional analysis indicates that unaware but highly interested individuals (‘No’ at 4–5) strongly adopt energy changes (22 at 4.0) but overlook leisure transport, while aware, moderately interested respondents (‘Yes’ at 2–3) lead in food habit adoption (29 at 3.0) but fall behind in transport adaptations.
Overall, the three actions most likely to be changed by individuals and families are the same: changing energy use, changing eating habits, and changing food sources (Figure 3, prepared by the authors). Of the three actions that are not chosen because it is easier to make changes in the community, ‘change food source’ is not in the most preferred list, but ‘change transport’ ranks third. The findings suggest a commonality in place of residence and access to infrastructure among community members.
A correlation analysis was conducted to explore the relationships between several factors and respondents’ stated preferences for action change (Table 5, prepared by the authors). The three dimensions of action change are individual, family, and community—corresponding to questions 50, 51, and 52 in the questionnaire. The matrix reports Pearson correlation coefficients between each variable and action change preferences. Significance levels are indicated by asterisks, where * represents p < 0.05 and ** represents p < 0.01.
Specifically, as shown in Figure 6 (prepared by the authors), non-Japanese groups exhibit a greater willingness to make energy- and transport-related changes; Japanese respondents are more likely to make dietary changes; and basic lifestyle changes (housing/commuting) appear to be culturally universal. Education history (“Whether Ed.”) and psychological factors (interest/desire) show no significant relationships (all p > 0.05), except for a marginal link between desire and community actions (p = 0.359).

3.3. Enablers and Barriers to Adopting a 1.5-Degree Lifestyle

Based on previous studies [4,18,19,43,44], the questionnaire identified 14 factors that may influence people’s decisions to adopt 1.5-degree lifestyles, and Table 6 (created by the authors) shows the top three options. Enhancing education and policy support can make it easier for individuals to adopt healthier lifestyles. Two economic policy-related factors, namely ‘strengthen sustainable investment’ and ‘higher tax on carbon emissions and energy use,’ also appeared on the most selected list. This suggested that people believe economic policies can help promote the adoption of 1.5-degree lifestyles.

3.3.1. Nationality and Gender Preferences for Enabling Factors

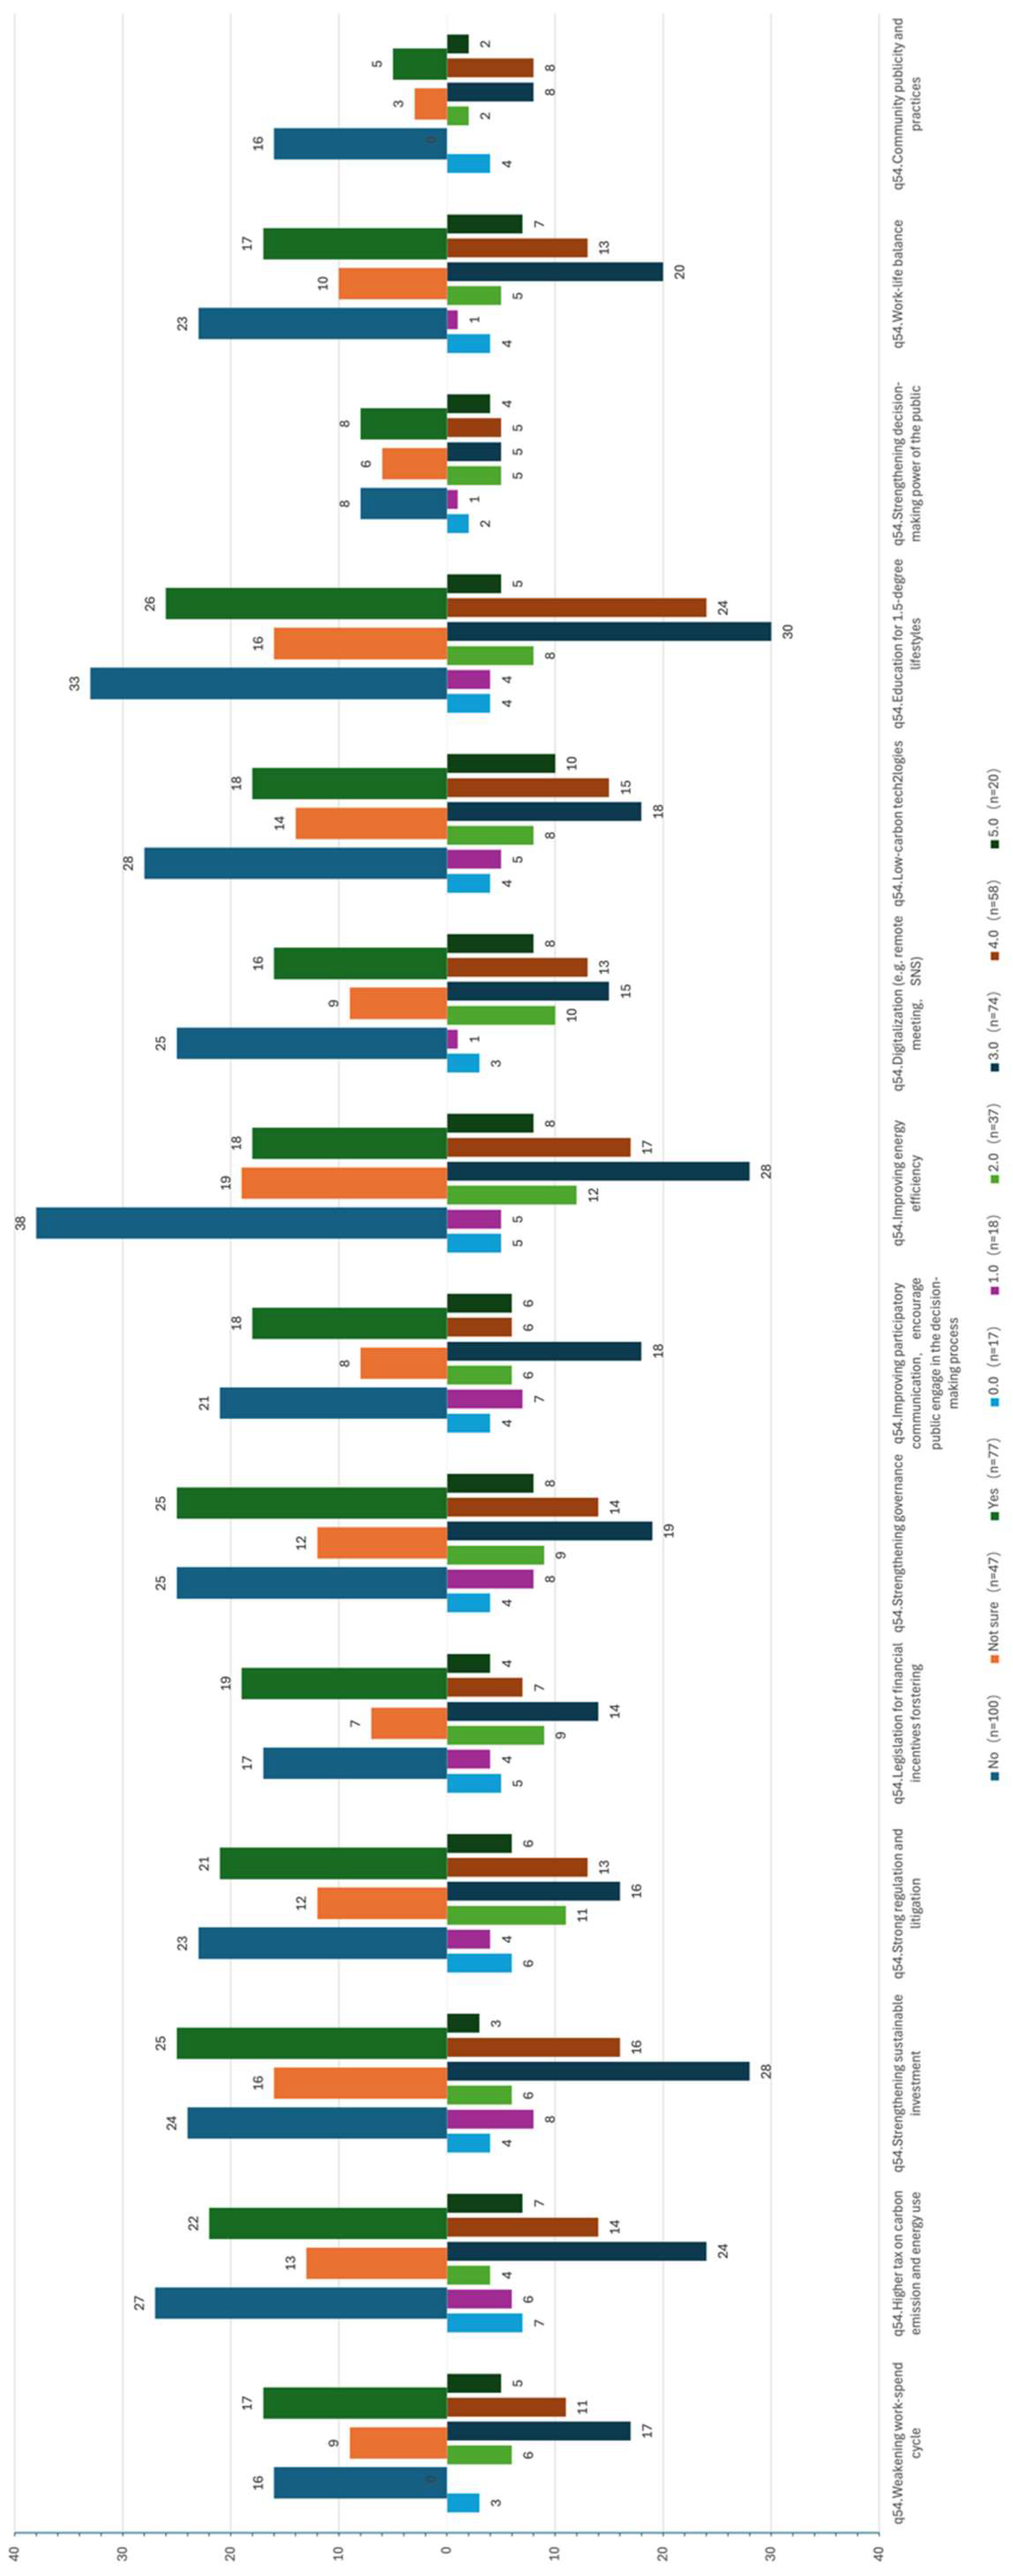
Regression analysis revealed that the education level regarding environmental issues was not correlated with the responses selected as barriers to a 1.5-degree lifestyle. The analysis of enablers for 1.5-degree lifestyles reveals distinct patterns across levels of knowledge and desire (Figure 7, created by the authors). Among respondents with limited knowledge (‘No’ group, n = 100), the most supported enabling factors were ‘Improving energy efficiency’ (38), ‘Low-carbon technologies’ (28), and ‘Higher taxes on carbon emissions and energy use’ (27). In contrast, knowledgeable respondents (‘Yes’ group, n = 77) prioritized ‘Education for 1.5-degree lifestyles’ (26), ‘Strengthening sustainable investment’ (25), and ‘Strengthening governance’ (25). When looking at the level of desire, individuals with high desire (4.0–5.0) strongly favored ‘Education for 1.5-degree lifestyles’ (29 overall), ‘Higher tax on carbon emissions and energy use’ (21), and ‘Strengthening governance’ (22). Conversely, those with lower desire levels (0.0–1.0) showed a preference for ‘Digitalization’ (4) and ‘Work–life balance’ (5). These results showed that while practical solutions like energy efficiency appeal to less knowledgeable groups, more systemic approaches are gaining traction among both knowledgeable and highly desiring individuals, with education emerging as a universally important enabler across all segments.
The intersectional analysis of knowledge (No/Not sure/Yes) and desire (0.0–5.0) revealed clear patterns in respondents’ choices for supporting a 1.5-degree lifestyle: the strongest support was for systemic enablers such as ‘Education for 1.5-degree lifestyles,’ ‘Strengthening governance,’ and ‘Higher taxes on carbon emissions and energy use.’ The results showed that respondents with high levels of knowledge and desire preferred structural changes over practical solutions, indicating a connection between awareness and willingness to act.
The analysis of individual barriers showed distinct patterns across knowledge and desire (Figure 8, prepared by the authors). Among respondents with low knowledge (‘No’ group, n = 100), ‘Work–life balance’ emerged as the most significant barrier (36), followed by ‘Improving energy efficiency’ (27) and ‘Education for 1.5-degree lifestyles’ (27). In contrast, respondents with high knowledge (‘Yes’ group, n = 77) identified ‘Higher tax on carbon emissions and energy use’ (22) and ‘Improving energy efficiency’ (21) as the main barriers, suggesting they see more challenges in policy implementation than in basic awareness.
The desire-level analysis showed that highly motivated respondents (4.0–5.0) face substantial barriers in ‘Improving energy efficiency’ (27) and ‘Work–life balance’ (22), while low-desire individuals (0.0–1.0) struggle most with ‘Education for 1.5-degree lifestyles’ (6) and ‘Work–life balance’ (11). Notably, ‘Strengthening sustainable investment’ presents relatively low barriers across all groups (maximum 17 in the ‘Yes’ group), indicating that sustainable finance is generally seen as a less significant barrier.

3.3.2. Enablers and Barriers for 1.5-Degree Lifestyles: Analysis Based on Where Participants Received Environmental Education

This section explores the perceived enablers and barriers to adopting a 1.5-degree lifestyle, highlighting differences based on where participants received their environmental education.
Figure 9 (created by the authors) clearly shows patterns in both enabling factors and perceived obstacles across different educational levels. Among respondents who received environmental education in high school (n = 73), the most common enablers for adopting a 1.5-degree lifestyle include ‘Improving energy efficiency’ (29), ‘Education for 1.5-degree lifestyles’ (28), and ‘Strengthening governance’ (21). This suggests that practical, actionable solutions, combined with basic education and policy frameworks, are essential for this group.
Conversely, individuals who received environmental education ‘at university’ (n = 64) tend to focus on systemic and participatory approaches, emphasizing ‘Strengthening sustainable investment’ (22), ‘Improving participatory communication’ (15), and ‘Digitalization’. This highlighted their emphasis on structural changes and inclusive decision-making processes.
The ‘at high school’ group reports significant challenges with ‘Work–life balance’ (24), ‘Education for 1.5-degree lifestyles’ (25), and ‘Improving energy efficiency’ (20), indicating that although they recognize the importance of these measures, implementing them remains difficult. Similarly, the ‘at university’ group finds ‘Work–life balance’ (19), ‘Improving participatory communication’ (14), and ‘Legislation for financial incentives’ (13) to be challenging, revealing tensions between policy goals and real-world application.

4. Discussion

4.1. Recognition of 1.5-Degree Lifestyle

Based on the findings, several key patterns emerge regarding how Japanese university students recognize the 1.5-degree lifestyle. First, overall awareness of the concept of ‘1.5-degree lifestyles’ was low, although there was moderate interest in learning more about it. This highlights a knowledge gap but also shows potential for educational efforts. Second, gender differences were significant. Female respondents demonstrated higher awareness and interest in the 1.5-degree lifestyle compared to males, indicating a gender gap in climate engagement that could benefit from targeted communication. Third, the impact of environmental education on awareness was clear. Respondents who received environmental education in primary or secondary school had the highest awareness, while those without exposure had the lowest. Those educated at the university level showed slightly lower awareness but a greater desire to learn, possibly due to the increased recognition of knowledge gaps that often emerge in adulthood.
These findings emphasized the importance of raising awareness about the 1.5-degree lifestyle through two main channels: education and communication. Prior research suggests that early environmental education leaves a lasting impact on environmental values and awareness [45], underscoring the importance of incorporating climate-related content into elementary and middle school curricula. Early exposure helps build foundational knowledge and fosters lasting concern for the environment. Additionally, increasing the visibility of the 1.5-degree lifestyle through mainstream promotion [19] is essential. Social media ads can effectively spread knowledge, promote activities, and attract the interest of younger audiences. Harnessing this interest to boost engagement is a practical approach. Strategies should aim to turn sustained interest into action, especially in higher education [46]. Moreover, targeted engagement efforts could be efficient [44], such as creating plans for low-interest groups to spark curiosity and translating this into a desire to practice. A male-focused approach could also help raise awareness of the 1.5-degree lifestyle among men.

4.2. Actions for Changing Lifestyle

The findings revealed that both cultural background (nationality differences) and gender significantly influence the willingness to adopt 1.5-degree lifestyle changes, with non-Japanese individuals and women generally showing greater receptivity to behavior change in most measured areas. This aligned with earlier research suggesting that women are more proactive in modifying their lifestyles to address climate-related issues [18,42]. It also concurred with previous studies, which indicate that cultural values and gender-specific experiences shape perceptions of environmental responsibility and efficacy [47]. For example, women showed a stronger correlation with changes in leisure transport, while men had a higher correlation with primary transportation methods. Additionally, while the findings suggest that awareness alone does not predict the adoption of action change preferences, the level of interest is a stronger indicator of willingness to change, particularly for actions related to energy and food. The influence of knowledge and desire appears distinct. Energy and food adjustments are most common across all awareness levels (No/Not sure/Yes). Individuals with high desire (4–5) tend to focus on energy, food, and consumption changes, whereas those with low desire (0–1) show little engagement with transportation or housing changes.
Therefore, the recommendations to promote a 1.5-degree lifestyle in action change are as follows:
  • Promote food habits and energy use as key behavioral changes based on Figure 4. For example, launch campaigns in supermarkets to encourage greener food options and collaborate with restaurants to promote low-carbon menus.
  • Use nationality and gender differences to guide targeted engagement [44]. Promote energy-efficient transportation for foreigners in Japan. Develop community-led sustainability networks for women and encourage technological sustainability for men, as they tend to show more interest in methods.
  • Address gaps in knowledge and motivation. To better encourage people with low desire or limited awareness, campaigns should emphasize personal benefits like cost savings and better health. High-desire individuals would gain from more advanced, action-focused resources to support deeper lifestyle changes.
  • Develop community-based strategies, especially for transportation and consumption habits. Improve public transit infrastructure and promote greener commuting options at schools and workplaces. Organize second-hand goods exchanges or buying markets and support sustainable brands.
  • Strengthen community and political support. Structural barriers, such as limited infrastructure, high costs of green products, and lack of incentives, should be tackled through better policy coordination and collaboration among municipalities.

4.3. Enablers and Barriers to 1.5-Degree Lifestyle Living

The findings revealed key insights about respondents’ views on enablers and barriers to adopting a 1.5-degree lifestyle. The challenge of maintaining a ‘work–life balance’ appeared as a common obstacle across all education levels, especially among respondents who received environmental education in high school. This suggested that while high school education may increase awareness of climate issues, it might not provide enough tools or support to overcome the structural challenges faced in daily life. Additionally, governance and communication barriers were more often recognized by those who completed university-level environmental education, indicating a greater awareness of systemic and institutional limitations. Participants with no exposure to environmental education perceived fewer barriers overall, possibly reflecting less engagement or awareness of sustainability challenges. These results suggest that perceptions of barriers may increase with climate literacy, particularly when not supported by solutions or resources.
These patterns indicate that challenges to ‘Work–life balance’ continue regardless of where individuals receive environmental education. Respondents who learn about the environment in high school might increase awareness of barriers but do not always provide enough solutions. Additionally, university-level education is linked to greater concern about systemic and participatory barriers. Finally, the ‘No’ group exhibits lower perceived barriers, which may suggest limited engagement with sustainability issues.
From the perspective of individuals and families, the desire to achieve work–life balance is seen as the biggest obstacle to adopting 1.5-degree lifestyles. This is because it can affect many parts of daily life. Additionally, high taxes are considered a major barrier for individuals and families, highlighting the ongoing impact of economic factors on lifestyle choices. It is important to recognize that both education and policy regulation are key factors that slow the shift to 1.5-degree lifestyles. This emphasizes the crucial role of environmental education in influencing attitudes and behaviors toward more sustainable living. Those who have received environmental education tend to show greater acceptance of 1.5-degree lifestyles and a stronger desire to adopt them, as previously discussed.
For policymakers, enablers and barriers genuinely reflect the opinions of Japanese college students about their ability to adopt 1.5-degree lifestyles more effectively. Therefore, recommendations for policymakers are especially relevant at this stage. First, incorporating environmental education into school curricula is essential and can be invaluable for promoting the necessary behavioral changes. Empirical studies suggest that environmental education enhances awareness and promotes environmentally friendly behavior [48,49].
Second, only when the government strictly enforces policies, promotes environmentally friendly initiatives, and vigorously develops green technology, a green economy, and green infrastructure can it create conditions and guarantee support for individuals to transition to a low-carbon lifestyle. Political protection is also crucial. Only by reducing the gap between wealth and poverty, increasing social welfare, and focusing on social equality can disparities in living standards be narrowed. Achieving social equality can improve the quality of life, empowering people to become more environmentally conscious and adopt low-carbon lifestyles. When governments support the implementation of environmental education, encourage families to participate in green activities, and incorporate these practices into daily life, they can boost awareness and engagement with environmental issues and actions.

5. Conclusions

This study examined Japanese university students’ perceptions, preferences for action change, and the enablers and barriers they considered related to 1.5-degree lifestyles across various indicators, leading to three key findings with important policy implications. The findings indicated a lack of awareness among Japanese university students regarding 1.5-degree lifestyles, with relatively low interest in adopting such lifestyles. However, they showed a relatively high desire to learn more about and practice 1.5-degree lifestyles. This suggests that, despite limited foundational knowledge, there is significant potential for engagement through targeted educational initiatives. The regression analysis supported this, showing that interest level (β = 0.428, p < 0.01) and environmental education—particularly at secondary and university levels—were the strongest predictors of the desire to adopt sustainable lifestyles. Females demonstrated a higher level of awareness of 1.5-degree lifestyles, along with slightly greater interest in learning about and understanding them. Women are more likely to change their lifestyles to be more environmentally friendly.
The findings revealed that both cultural background (nationality differences) and gender are significant factors influencing the propensity to adopt 1.5-degree lifestyle changes. Non-Japanese individuals and women generally showed greater receptiveness to behavioral change across the various categories measured. To promote action, strategies should focus on high-impact areas such as food and energy, with targeted approaches based on gender, education level, and nationality. Additionally, strengthening community and policy support are key strategies to encourage larger groups of people to change their lifestyles.
Importantly, this study identified three common barriers: work–life balance challenges (32.6%), economic concerns—particularly regarding carbon taxes (25.9%)—and the gap between knowledge and action. The latter barrier was especially evident among high school-educated respondents, who demonstrated awareness without practical solutions. Conversely, university-educated individuals faced systemic barriers related to governance and participation.
To address these issues, recommendations include increasing awareness and promoting action toward 1.5-degree lifestyles among youth. Early integration of environmental education at primary and middle school levels is essential. Public outreach efforts should be tailored to resonate with young people’s lifestyles, such as utilizing social media. Strong political support is necessary to help young people overcome challenges in practicing 1.5-degree lifestyles.

Limitations and Recommendations for Future Studies

A major limitation of this study is the imbalance in participants’ backgrounds, especially in terms of gender and nationality. This uneven distribution could cause sampling bias and affect how well the results represent the broader population. Future research should aim for a more balanced and diverse sample to improve validity and inclusivity. Expanding the participant pool to include a wider range of youth from different geographic and socio-economic backgrounds would also help improve the generalizability of the findings.
Although this study is based in the Japanese context, its findings are relevant to other countries facing similar challenges with high carbon emissions and youth participation in climate action. The results provide valuable insights for high-emission economies looking to understand young people’s perceptions and encourage their involvement in climate mitigation efforts. These findings can also assist in assessing and enhancing youth engagement across different cultural and policy settings.

Author Contributions

Conceptualization, R.H. and R.S.; Methodology, R.H. and R.S.; Formal analysis, R.H.; Investigation, R.H.; Writing—original draft, R.H.; Writing—review & editing, R.H. and R.S.; Supervision, R.S. All authors have read and agreed to the published version of the manuscript.

Funding

This research received no external funding.

Data Availability Statement

Dataset available on request from the authors.

Acknowledgments

A big thanks to the GRIL (Global Resilience Innovation Laboratory) members, friends, and people who helped to share the questionnaire on a wider scale for data collection. Also, I would like to express my gratitude to my lab mate, Ma Theresa Pamaong, for helping to polish the English and proofreading this manuscript.

Conflicts of Interest

The authors declare no conflicts of interest.

Appendix A. (Made by Authors)

Questionnaire: University Students’ Perception of the 1.5-degree Lifestyles in Japan
Section 1: Basic Information
  • What is your gender?
    • Female
    • Male
    • Non-binary
  • What program are you in?
    • Undergraduate
    • Master
    • Doctoral
    • Other
  • Please fill in your nationality.
    • (Open-ended response) ________________
  • Which prefecture in Japan are you from? (International students, please write down your prefecture of residence).
    • (Open-ended response) ________________
  • Have you received any environmental education in school?
    • Yes, at elementary school
    • Yes, at middle school
    • Yes, at high school
    • Yes, at university
    • No
  • Have you ever participated in any environmental-related activities? (Multiple answers are accepted.)
    • Have attended lectures
    • Participated in volunteer activities
    • Participated in environmental theme activities
    • Delivered relevant presentations in class or elsewhere
    • No, never participated in any relevant events
    • Other: ________________
  • If ‘other’ is selected in question 6, please elaborate the activity.
    • (Open-ended response) ________________
Section 2: Knowledge
(To reach the 1.5-degree goal of keeping the global warming within the limit of 1.5-degree of the Paris Agreement, the 1.5-degree lifestyles concept has been proposed. 1.5-degree lifestyles refers to reduce the carbon footprint of life through lifestyle changes in order to achieve the 1.5-degree goal.)
8.
Are you aware of the concept of the 1.5-degree lifestyles?
  • Yes
  • No
  • Not sure
9.
How familiar are you with the 1.5-degree lifestyles?
Climate 13 00171 i001
10.
Where did you first learn about the 1.5-degree lifestyles?
  • News media
  • Educational institutions
  • Social media
  • Advertisement
  • Family
  • Take part in the survey
11.
Do you usually hear about the 1.5-degree lifestyles in your life?
Climate 13 00171 i002
Section 3: Interest
12.
To what extent do you understand the meaning and purpose of the 1.5-degree lifestyles?
Climate 13 00171 i003
13.
How often do you have the opportunity to access topics and news related to the 1.5-degree lifestyles and climate change?
Climate 13 00171 i004
14.
Where do you usually read about the 1.5-degree lifestyles?
  • News media
  • Educational institutions
  • Social media
  • Advertisement
  • Family
  • Take part in the survey
Section 4: Desire
15.
To what extent do you want to learn about the 1.5-degree lifestyles?
Climate 13 00171 i005
16.
How do you feel about living in the 1.5-degree lifestyles?
Climate 13 00171 i006
17.
Can you identify some action that is consistent with a 1.5-degree lifestyle?
Climate 13 00171 i007
18.
Can you identify the government strategies for dealing with climate change or promoting the 1.5-degree lifestyles?
Climate 13 00171 i008
19.
Have you ever discussed the 1.5-degree lifestyle (related topics also count) with others?
  • Yes
  • No
  • Not sure
20.
Will you introduce 1.5-degree lifestyles to your friends, family, etc.
  • Yes
  • No
  • Maybe
Section 5: Action—Food
(This section will suggest some actions, please respond according to your astral lifestyle situation.)
21.
Source: How do you manage your daily meal?
  • At home (Self-cooked food)
  • Eat outside
  • Delivery food
22.
Food habit: What do you prefer for meals?
  • Vegetables
  • Meats
  • I am vegan.
23.
Drink habit: What do you usually have for drinks?
  • Water
  • Alcohol
  • Soft drink
24.
Based on the proposed actions in this survey, please choose the one action you (individual) would most like to make changes.
  • Change food source
  • Change food habit
  • Change drink habit
25.
Based on the proposed actions in this survey, please choose the one action your (family) would most like to make changes.
  • Change food source
  • Change food habit
  • Change drink habit
26.
Based on the proposed actions in this survey, please choose the one action your (community) would most like to make changes.
  • Change food source
  • Change food habit
  • Change drink habit
Section 5: Action—Housing
27.
Place of living: Where do you live?
  • City center
  • Suburbs
28.
Living situation: Who do you live with?
  • Live alone
  • Live with friends/partners.
  • Live with family
29.
Energy using: What energy are you consciously conserving?
  • Electricity
  • Water
  • Waste sorting
30.
Based on the proposed actions in this survey, please choose the one action you (individual) would most like to make changes.
  • Change place of living
  • Change living situation
  • Change energy using
31.
Based on the proposed actions in this survey, please choose the one action your (family) would most like to make changes.
  • Change place of living
  • Change living situation
  • Change energy using
32.
Based on the proposed actions in this survey, please choose the one action your (community) would most like to make changes.
  • Change place of living
  • Change living situation
  • Change energy using
Section 5: Action—Mobility
33.
Commute distance: How long is your commute?
  • Within 30 min
  • 30 min to 1 h
  • More than 1 h
34.
Commute transport: How do you commute to the university/work?
  • Own transport equipment
  • Public transport
  • Both
35.
Leisure transport: What kind of transport do you take for leisure?
  • Own transport equipment
  • Public transport
  • Both
36.
What is your most frequent means of transport?
  • Bicycle
  • Motorcycle
  • Car
  • Bus
  • Train
  • Walking
37.
Based on the proposed actions in this survey, please choose the one action you (individual) would most like to make changes.
  • Change commute distance
  • Change commute transport
  • Change leisure transport
38.
Based on the proposed actions in this survey, please choose the one action your (family) would most like to make changes.
  • Change commute distance
  • Change commute transport
  • Change leisure transport
39.
Based on the proposed actions in this survey, please choose the one action your (community) would most like to make changes.
  • Change commute distance
  • Change commute transport
  • Change leisure transport
Section 5: Action—Consumer Goods
40.
Consumption frequency: How long do you usually consume for daily necessities?
  • Everyday
  • Multiple time a week
  • Multiple time a month
  • Multiple time a year
41.
Consumption Habit: What do you usually consume?
  • Daily consumable
  • Non-daily consumable
  • Both
42.
Based on the proposed actions in this survey, please choose the one action you (individual) would most like to make changes.
  • Change consumption frequency
  • Change consumption habits
43.
Based on the proposed actions in this survey, please choose the one action your (family) would most like to make changes.
  • Change consumption frequency
  • Change consumption habits
44.
Based on the proposed actions in this survey, please choose the one action your (community) would most like to make changes.
  • Change consumption frequency
  • Change consumption habits
Section 5: Action—Leisure & Services
45.
Leisure Activity & Use of Services Frequency: How often do you consume for your leisure?
  • Everyday
  • Multiple time a week
  • Multiple time a month
  • Multiple time a year
46.
Most Frequent Leisure & Service: What do you usually purchase for your leisure and services?
  • Sports
  • Entertainment
  • Culture
  • Health check/medicine
  • Insurance
  • Financial items (e.g., stock, etc.)
  • Others
47.
Based on the proposed actions in this survey, please choose the one action you (individual) would most like to make changes.
  • Change leisure & services frequency
  • Change the most frequent leisure & services
48.
Based on the proposed actions in this survey, please choose the one action your (family) would most like to make changes.
  • Change leisure & services frequency
  • Change the most frequent leisure & services
49.
Based on the proposed actions in this survey, please choose the one action your (community) would most like to make changes.
  • Change leisure & services frequency
  • Change the most frequent leisure & services
50.
Based on the proposed actions in this survey, please choose the three action you (individual) would most like to make changes.
  • Change food source
  • Change food habit
  • Change drink habit
  • Change place of living
  • Change living situation
  • Change energy using
  • Change commute distance
  • Change transport
  • Change leisure transport
  • Change consumption frequency
  • Change consumption habits
  • Change leisure and services frequency
51.
Based on the proposed actions in this survey, please choose the three action your (family) would most like to make changes.
  • Change food source
  • Change food habit
  • Change drink habit
  • Change place of living
  • Change living situation
  • Change energy using
  • Change commute distance
  • Change transport
  • Change leisure transport
  • Change consumption frequency
  • Change consumption habits
  • Change leisure and services frequency
52.
Based on the proposed actions in this survey, please choose the three action your (community) would most like to make changes.
  • Change food source
  • Change food habit
  • Change drink habit
  • Change place of living
  • Change living situation
  • Change energy using
  • Change commute distance
  • Change transport
  • Change leisure transport
  • Change consumption frequency
  • Change consumption habits
  • Change leisure and services frequency
Section 6: Enablers & Barriers to 1.5-degree Lifestyles
53.
What enabling factors do you think help you the most to 1.5-degree lifestyles?
  • Economic
  • Political
  • Technological
  • Societal
54.
What are enabling factors do you think help you (individual) the most to 1.5-degree lifestyles?
  • Weakening work-spend cycle
  • Higher tax on carbon emission and energy use
  • Strengthening sustainable investment
  • Strong regulation and litigation
  • Legislation for financial incentives fostering
  • Strengthening governance
  • Improving participatory communication, encourage public engage in the decision-making process
  • Improving energy efficiency
  • Digitalization (e.g., remote meeting, SNS)
  • Low-carbon technologies
  • Education for 1.5-degree lifestyles
  • Strengthening decision-making power of the public
  • Work-life balance
  • Community publicity and practices
55.
What are enabling factors do you think help your (family) the most to 1.5-degree lifestyles?
  • Weakening work-spend cycle
  • Higher tax on carbon emission and energy use
  • Strengthening sustainable investment
  • Strong regulation and litigation
  • Legislation for financial incentives fostering
  • Strengthening governance
  • Improving participatory communication, encourage public engage in the decision-making process
  • Improving energy efficiency
  • Digitalization (e.g., remote meeting, SNS)
  • Low-carbon technologies
  • Education for 1.5-degree lifestyles
  • Strengthening decision-making power of the public
  • Work-life balance
  • Community publicity and practices
56.
What are enabling factors do you think help your (community) the most to 1.5-degree lifestyles?
  • Weakening work-spend cycle
  • Higher tax on carbon emission and energy use
  • Strengthening sustainable investment
  • Strong regulation and litigation
  • Legislation for financial incentives fostering
  • Strengthening governance
  • Improving participatory communication, encourage public engage in the decision-making process
  • Improving energy efficiency
  • Digitalization (e.g., remote meeting, SNS)
  • Low-carbon technologies
  • Education for 1.5-degree lifestyles
  • Strengthening decision-making power of the public
  • Work-life balance
  • Community publicity and practices
57.
What do you think are the biggest barriers to a 1.5-degree lifestyle?
  • Economic
  • Political
  • Technological
  • Societal
58.
What do you think are the three biggest barriers to your (individual) 1.5-degree lifestyles?
  • Weakening work-spend cycle
  • Higher tax on carbon emission and energy use
  • Strengthening sustainable investment
  • Strong regulation and litigation
  • Legislation for financial incentives fostering
  • Strengthening governance
  • Improving participatory communication, encourage public engage in the decision-making process
  • Improving energy efficiency
  • Digitalization (e.g., remote meeting, SNS)
  • Low-carbon technologies
  • Education for 1.5-degree lifestyles
  • Strengthening decision-making power of the public
  • Work-life balance
  • Community publicity and practices
59.
What do you think are the three biggest barriers to your (family’s) 1.5-degree lifestyles?
  • Weakening work-spend cycle
  • Higher tax on carbon emission and energy use
  • Strengthening sustainable investment
  • Strong regulation and litigation
  • Legislation for financial incentives fostering
  • Strengthening governance
  • Improving participatory communication, encourage public engage in the decision-making process
  • Improving energy efficiency
  • Digitalization (e.g., remote meeting, SNS)
  • Low-carbon technologies
  • Education for 1.5-degree lifestyles
  • Strengthening decision-making power of the public
  • Work-life balance
  • Community publicity and practices
60.
What do you think are the three biggest barriers to your (community’s) 1.5-degree lifestyles?
  • Weakening work-spend cycle
  • Higher tax on carbon emission and energy use
  • Strengthening sustainable investment
  • Strong regulation and litigation
  • Legislation for financial incentives fostering
  • Strengthening governance
  • Improving participatory communication, encourage public engage in the decision-making process
  • Improving energy efficiency
  • Digitalization (e.g., remote meeting, SNS)
  • Low-carbon technologies
  • Education for 1.5-degree lifestyles
  • Strengthening decision-making power of the public
  • Work-life balance
  • Community publicity and practices

References

  1. World Meteorological Organization. 2024 is on Track to be Hottest Year on Record as Warming Temporarily Hits 1.5 °C; World Meteorological Organization: Geneva, Switzerland, 2024; Available online: https://wmo.int/news/media-centre/2024-track-be-hottest-year-record-warming-temporarily-hits-15degc (accessed on 11 June 2025).
  2. Japan Meteorological Agency. The weather in the summer of 2024 (from June to August); Japan Meteorological Agency: Tokyo, Japan, 2024. Available online: https://www.data.jma.go.jp/cpd/longfcst/seasonal/202408/202408s.html (accessed on 11 June 2025).
  3. IPCC. Global Warming of 1.5 °C: An IPCC Special Report on the Impacts of Global Warming of 1.5 °C Above Pre-Industrial Levels and Related Global Greenhouse Gas Emission Pathways, in the Context of Strengthening the Global Response to the Threat of Climate Change, Sustainable Development, and Effort to Eradicate Poverty; Masson-Delmotte, V., Zhai, P., Pörtner, H.-O., Roberts, D., Skea, J., Shukla, P.R., Pirani, A., Moufouma-Okia, W., Péan, C., Pidcock, R., et al., Eds.; Cambridge University Press: Cambridge, UK; New York, NY, USA, 2018. [Google Scholar] [CrossRef]
  4. IGES. 1.5-Degree Lifestyles: Targets and Options for Reducing Lifestyle Carbon Footprints; IGES: Hayama, Japan, 2019. [Google Scholar] [CrossRef]
  5. Guan, Y.; Shan, Y.; Hang, Y.; Nie, Q.; Liu, Y.; Hubacek, K. Unlocking global carbon reduction potential by embracing low-carbon lifestyles. Nat. Commun. 2025, 16, 4599. [Google Scholar] [CrossRef] [PubMed]
  6. Wiedmann, T.; Minx, J. A Definition of ‘Carbon Footprint’. Ecol. Econ. Res. Trends 2008, 1, 1–11. Available online: https://wiki.epfl.ch/hdstudio/documents/articles/a%20definition%20of%20carbon%20footprint.pdf (accessed on 11 June 2025).
  7. HotorCool. 1.5-Degree Lifestyles: Towards A Fair Consumption Space for All; HotorCool: Berlin, Germany, 2021; Available online: https://hotorcool.org/wp-content/uploads/2021/10/Hot_or_Cool_1_5_lifestyles_FULL_REPORT_AND_ANNEX_B.pdf (accessed on 11 June 2025).
  8. O’Brien, K.; Selboe, E.; Hayward, B. Exploring youth activism on climate change: Dutiful, disruptive, and dangerous dissent. Ecol. Soc. 2018, 23, 42. [Google Scholar] [CrossRef]
  9. United Nation. Kyoto Protocol to the United Nations Framework; United Nation: New York, NY, USA, 1998. [Google Scholar]
  10. The Government of Japan. Submission of Japan’s Intended Nationally Determined Contribution (INDC); The Government of Japan: Tokyo, Japan, 2015. Available online: https://www.mofa.go.jp/files/000090898.pdf (accessed on 11 June 2025).
  11. United Nation. The Paris Agreement; United Nation: New York, NY, USA, 2015; Available online: https://unfccc.int/process-and-meetings/the-paris-agreement (accessed on 11 June 2025).
  12. Cabinet Office. Environment Innovation Strategy; Cabinet Office: Sydney, Australia, 2020. Available online: https://www8.cao.go.jp/cstp/tougosenryaku/kankyo_en.pdf (accessed on 11 June 2025).
  13. Ministry of Economy, Trade and Industry. Green Innovation Fund; Ministry of Economy, Trade and Industry: Tokyo, Japan, 2022. Available online: https://www.meti.go.jp/english/policy/energy_environment/global_warming/gifund/index.html (accessed on 11 June 2025).
  14. Ministry of Finance, Japan. Japan Climate Transition Bonds; Ministry of Finance, Japan: Tokyo, Japan, 2023. Available online: https://www.mof.go.jp/english/policy/jgbs/topics/JapanClimateTransitionBonds/index.html (accessed on 11 June 2025).
  15. Zhao, Z.; Huang, R.; Zhang, Y.; Shiga, Y.; Shaw, R. Assessing the Role of Climate Transition Bonds in Advancing Green Transformations in Japan. Climate 2024, 12, 201. [Google Scholar] [CrossRef]
  16. Ohta, H.; Barrett, B.F. Politics of climate change and energy policy in Japan: Is green transformation likely? Earth Syst. Gov. 2023, 17, 100187. [Google Scholar] [CrossRef]
  17. Nielsen, S. Initiating Transitions Towards 1.5-Degree Lifestyles: An Action Research Study on a Design Game. 2020. Available online: https://aaltodoc.aalto.fi/items/7814c696-6ab6-466e-82b3-d89876b3c8b3 (accessed on 11 June 2025).
  18. Liu, C.; Yamabe-Ledoux, A.M. Challenges in Achieving 1.5-Degree Lifestyle Mitigation Options—Insights from a Citizen-Participatory Household Experiment in Japan. Sustainability 2023, 15, 11949. [Google Scholar] [CrossRef]
  19. Vadovics, E.; Richter, J.L.; Tornow, M.; Ozcelik, N.; Coscieme, L.; Lettenmeier, M.; Scherer, L. Preferences, enablers, and barriers for 1.5° C lifestyle options: Findings from Citizen Thinking Labs in five European Union countries. Sustain. Sci. Pract. Policy 2024, 20, 2375806. [Google Scholar] [CrossRef]
  20. Watabe, A.; Yamabe-Ledoux, A.M. Low-carbon lifestyles beyond decarbonisation: Toward a more creative use of the carbon footprinting method. Sustainability 2023, 15, 4681. [Google Scholar] [CrossRef]
  21. Neumann, K.; Hirschnitz-Garbers, M. Material efficiency and global pathways towards 100% renewable energy systems–system dynamics findings on potentials and constraints. J. Sustain. Dev. Energy Water Environ. Syst. 2022, 10, 1100427. [Google Scholar] [CrossRef]
  22. Levesque, A.; Pietzcker, R.C.; Luderer, G. Halving energy demand from buildings: The impact of low consumption practices. Technol. Forecast. Soc. Change 2019, 146, 253–266. [Google Scholar] [CrossRef]
  23. Lettenmeier, M.; Wackernagel, M. Implications of the 1.5-degree target for lifestyles. Prog. Towards Resour. Revolut. 2019, 236, 43–47. [Google Scholar] [CrossRef]
  24. Matthews, H.D.; Wynes, S. Current global efforts are insufficient to limit warming to 1.5 °C. Science 2022, 376, 1404–1409. [Google Scholar] [CrossRef] [PubMed]
  25. Dean, J.G.; Stain, H.J. Mental health impact for adolescents living with prolonged drought. Aust. J. Rural. Health 2010, 18, 32–37. [Google Scholar] [CrossRef] [PubMed]
  26. Majeed, H.; Lee, J. The impact of climate change on youth depression and mental health. Lancet Planet. Health 2017, 1, e94–e95. [Google Scholar] [CrossRef]
  27. Clemens, V.; von Hirschhausen, E.; Fegert, J.M. Report of the intergovernmental panel on climate change: Implications for the mental health policy of children and adolescents in Europe—A scoping review. Eur. Child Adolesc. Psychiatry 2022, 31, 701–713. [Google Scholar] [CrossRef] [PubMed]
  28. Hickman, C.; Marks, E.; Pihkala, P.; Clayton, S.; Lewandowski, R.E.; Mayall, E.E.; Van Susteren, L. Climate anxiety in children and young people and their beliefs about government responses to climate change: A global survey. Lancet Planet. Health 2021, 5, e863–e873. [Google Scholar] [CrossRef]
  29. Thomas, I.; Martin, A.; Wicker, A.; Benoit, L. Understanding youths’ concerns about climate change: A binational qualitative study of ecological burden and resilience. Child Adolesc. Psychiatry Ment. Health 2022, 16, 110. [Google Scholar] [CrossRef]
  30. Sabherwal, A.; Ballew, M.T.; van Der Linden, S.; Gustafson, A.; Goldberg, M.H.; Maibach, E.W.; Leiserowitz, A. The Greta Thunberg Effect: Familiarity with Greta Thunberg predicts intentions to engage in climate activism in the United States. J. Appl. Soc. Psychol. 2021, 51, 321–333. [Google Scholar] [CrossRef]
  31. Schwartz, S.E.; Benoit, L.; Clayton, S.; Parnes, M.F.; Swenson, L.; Lowe, S.R. Climate change anxiety and mental health: Environmental activism as buffer. Curr. Psychol. 2023, 42, 16708–16721. [Google Scholar] [CrossRef]
  32. Costanza-Chock, S. Youth and social movements: Key lessons for allies. Berkman Cent. Res. Publ. 2012, 2013–13. [Google Scholar] [CrossRef]
  33. Azzopardi, A. Youth Activism: Social Movements in the Making or in the Taking? In Youth: Responding to Lives; Brill: Leiden, The Netherlands, 2013; pp. 45–56. [Google Scholar]
  34. Sanson, A.V.; Wachs, T.D.; Koller, S.H.; Salmela-Aro, K. Young people and climate change: The role of developmental science. In Developmental Science and Sustainable Development Goals for Children and Youth; Verma, S., Petersen, A., Eds.; Social Indicators Research Series; Springer: Cham, Switzerland, 2018; Volume 74. [Google Scholar] [CrossRef]
  35. Pereira, T.; Freire, T. Positive youth development in the context of climate change: A systematic review. Front. Psychol. 2021, 12, 786119. [Google Scholar] [CrossRef]
  36. The Nippon Foundation. Climate Change “Has an Impact on Life”—More Than Half of the Respondents Learned Through Their Studies That “It Is Not Clear” and This “Uncertainty” Decreased Among 18-Year-Olds in the Awareness Survey. The Asahi Shimbun: Tokyo, Japan; Osaka, Japan. 2025. Available online: https://www.asahi.com/sdgs/article/15833286 (accessed on 11 June 2025).
  37. Ministry of the Environment. (n.d.).; Environmental Education. Available online: https://www.env.go.jp/earth/coop/coop/document/08-ttmnce/08-ttmnce-6.pdf (accessed on 11 June 2025).
  38. Shaw, R.; Takeuchi, Y.; Shiwaku, K.; Fernandez, G.; Ru, Q.; Yang, B. 1-2-3 of Disaster Education. UNDRR. 2009. Available online: https://www.preventionweb.net/publication/1-2-3-disaster-eduction (accessed on 11 June 2025).
  39. Yildiz, A.; Shaw, R. Disaster and Climate Risk Education; Springer Nature: Singapore, 2024. [Google Scholar]
  40. Aiken, L.S. Multiple Regression: Testing and Interpreting Interactions; Sage: Thousand Oaks, CA, USA, 1991. [Google Scholar]
  41. Cohen, J. Statistical Power Analysis for the Behavioral Sciences; Routledge: Abingdon, UK, 2013. [Google Scholar]
  42. Burchell, K.; Rettie, R.; Roberts, T.C. Householder Engagement with Energy Consumption Feedback: The Role of Community Action and Communications. Energy Policy 2016, 88, 168–177. [Google Scholar] [CrossRef]
  43. IGES. IGES 1.5 °C Roadmap: An Action Plan for Japan—More Ambitious Emissions Reduction and a Prosperous, Vibrant Society; IGES: Hayama, Japan, 2023. [Google Scholar] [CrossRef]
  44. Hirth, S.; Kreinin, H.; Fuchs, D.; Blossey, N.; Mamut, P.; Philipp, J.; EU1. 5° Lifestyles Consortium. Barriers and enablers of 1.5° lifestyles: Shallow and deep structural factors shaping the potential for sustainable consumption. Front. Sustain. 2023, 4, 1014662. [Google Scholar] [CrossRef]
  45. Goodman, A.; Sianesi, B. Early education and children’s outcomes: How long do the impacts last? Fisc. Stud. 2005, 26, 513–548. [Google Scholar] [CrossRef]
  46. Robertson, D.A.; Padesky, C.J. Keeping students interested: Interest-based instruction as a tool to engage. Read. Teach. 2020, 73, 575–586. [Google Scholar] [CrossRef]
  47. Kollmuss, A.; Agyeman, J. Mind the gap: Why do people act environmentally and what are the barriers to pro-environmental behavior? Environ. Educ. Res. 2002, 8, 239–260. [Google Scholar] [CrossRef]
  48. Yang, C.; Fang, Z. The impact of education expenditure on environmental innovation. Heliyon 2024, 10, e32446. [Google Scholar] [CrossRef]
  49. Wang, S.; Mbanyele, W.; Feng, T.; Fan, S. Bridging the knowledge-action divide: Environmental awareness and low-carbon behaviors of Chinese university students. Humanit. Soc. Sci. Commun. 2025, 12, 925. [Google Scholar] [CrossRef]
Figure 1. The chart for Q9: How familiar are you with the 1.5-degree lifestyles? (knowledge).
Climate 13 00171 g001
Figure 2. The chart for Q12 (interest) and Q15 (desire).
Climate 13 00171 g002
Figure 3. Chart for preference action for all lifestyles change options.
Climate 13 00171 g003
Figure 4. Chart for preference action for all lifestyles change option (gender and nationality as variables).
Climate 13 00171 g004
Figure 5. Chart showing preference action for all lifestyles change options (knowledge and desire as variables).
Climate 13 00171 g005
Figure 6. Chart for preference action change by nationality.
Climate 13 00171 g006
Figure 7. Chart of enablers for 1.5-degree lifestyles: analysis of knowledge and desire.
Climate 13 00171 g007
Figure 8. Chart of barriers to 1.5-degree lifestyles: analysis by knowledge and desire.
Climate 13 00171 g008
Figure 9. Chart for individual enablers and barriers for 1.5-degree-lifestyles: analysis by source of environmental education.
Climate 13 00171 g009
Table 1. Analytical framework for this study (made by authors).
Analytical Framework
Literature ReviewJapan’s responses to climate change.
The potential of 1.5-degree lifestyles in Japan.
Youth perception of climate change.
Questionnaire Data
(KIDA Framework)
Key FeatureObjectsKnowledgeInterestDesireActionEnablersBarriers
Gender;
Japanese/International students;
Whether received environmental education
IndividualAre you aware of the concept of the 1.5-degree lifestyles?To what extent do you understand the meaning and purpose of the 1.5-degree lifestyles?To what extent do you want to learn about the 1.5-degree lifestyles?Food
Housing
Mobility
Consumer Goods
Leisure and Services
Economic
Political
Technological
Societal
Economic
Political
Technological
Societal
Family
Community
Correlation Analysis, Regression Analysis, and Questionnaire AnalysisPreferred List
⬇️
Reflection/RecommendationIndividualHow to raise youth awareness of 1.5-degree lifestyles?
How to effectively improve youth action change?
Family
Community
Table 2. The model of regression analysis.
Results of Regression Analysis (n = 224)
Unstandardized Coefficients Standardized Coefficients Collinearity Diagnosis
Model B Std. Error Beta t p VIF Tol.
(Constant)1.2240.592-2.18820.003--
Independent variableKnowledgeYes−0.0860.241−0.031−0.3570.7212.1760.46
No0.1320.2150.0490.6130.541.9020.526
Not sure0
Interest 0.4280.0710.4535.9901.6860.593
Control variableGenderFemale0.0760.30.030.2550.7994.0050.25
Male0.3340.3130.1241.0680.2873.9870.251
Non-binary0
NationalityNon-Japanese−0.3320.172−0.119−1.9330.0551.1150.897
Japanese0
Whether received environmental educationYes, at university1.1360.340.3863.3410.0013.930.254
Yes, at high school1.0140.3360.3573.0210.0034.1170.243
Yes, at middle school1.050.3620.2862.8990.0042.8780.347
Yes, at elementary school0.630.3660.1661.7190.0872.7360.365
No0
R20.278
F8.202
p<0.01
Dependent variable: Desire
Table 3. Gender perspective of recognition of 1.5-degree lifestyles.
GenderNumber of PeopleKnowledge (Awareness)InterestDesire
YesNoNot Sure0–12–34–50–12–34–5
Female127
(57%)
45
(35.5%)
49
(38.5%)
33
(26%)
57
(45%)
55
(43%)
15
(12%)
15
(12%)
64
(50%)
48
(38%)
Male93
(42%)
32
(34%)
48
(52%)
13
(14%)
46
(49%)
38
(41%)
0
(0%)
19
(21%)
44
(47%)
30
(32%)
Non-binary4
(1%)
0
(0%)
3
(75%)
1
(25%)
2
(50%)
2
(50%)
0
(0%)
1
(25%)
3
(75%)
0
(0%)
Table 4. Recognition of 1.5-degree lifestyles from the perspective of whether they have received environmental education.
Receive Environmental EducationNumber of PeopleKnowledge (Awareness)InterestDesire
YesNoNot Sure0–12–34–50–12–34–5
YesAt elementary school32
(14%)
16
(50%)
11
(34%)
5
(16%)
13
(41%)
15
(47%)
4
(12%)
7
(22%)
16
(50%)
9
(28%)
At middle school35
(16%)
14
(50%)
12
(24%)
9
(26%)
15
(43%)
15
(43%)
5
(14%)
4
(11%)
17
(49%)
14
(40%)
At high school73
(32%)
25
(34%)
36
(49%)
12
(17%)
33
(45%)
31
(43%)
9
(12%)
6
(8%)
38
(52%)
29
(40%)
At university64
(29%)
19
(30%)
26
(40%)
19
(30%)
29
(45%)
29
(45%)
6
(10%)
7
(11%)
33
(51.5%)
24
(37.5%)
Total204
(91%)
74
(36%)
85
(42%)
45
(22%)
90
(44.5%)
90
(44.5%)
24
(12%)
24
(12%)
104
(51%)
76
(37%)
No20
(9%)
3
(15%)
15
(75%)
2
(10%)
15
(75%)
5
(25%)
0
(0%)
10
(50%)
8
(40%)
2
(10%)
Total224
(100%)
77
(34%)
100
(45%)
47
(21%)
105
(47%)
95
(42%)
24
(11%)
34
(15%)
112
(50%)
78
(35%)
Table 5. Correlation analysis for action change preferences.
pIndividual Action Change (Q50)Family Action Change (Q51)Community Action Change (Q52)
Gender0.950.7240.677
Nationality0.2420.005 **0.095
Whether Ed.0.9160.9160.759
Interest0.9880.440.835
Desire0.9570.90.359
Table 6. Most chosen enablers and barriers to 1.5-degree lifestyles.
EnablersBarriers
Individual
  • Improving energy efficiency (33.9%)
  • Education for 1.5-degree lifestyles (33.9%)
  • Strengthen sustainable investment (28.4%)
  • Work–life balance (73, 32.6%)
  • Improving energy efficiency (61, 27.2%)
  • Higher tax on carbon emission and energy use (58, 25.9%)
Family
  • Education for 1.5-degree lifestyles (70, 31.3%)
  • Improving energy efficiency (64, 28.6%)
  • Strong regulation and litigation (59, 26.3%)
  • Work–life balance (66, 29.5%)
  • Higher tax on carbon emission and energy use (60, 26.8%)
  • Improving energy efficiency (53, 23.7%)
Community
  • Strong regulation and litigation (35.7%)
  • Higher tax on carbon emission and energy use (33.9%)
  • Improving energy efficiency (32.1%); Education for 1.5-degree lifestyles (32.1%)
  • Higher tax on carbon emission and energy use (33.9%)
  • Education for 1.5-degree lifestyles (23.2%); Strong regulation and litigation (23.2%); Strengthen sustainable investment (23.2%)
Disclaimer/Publisher’s Note: The statements, opinions and data contained in all publications are solely those of the individual author(s) and contributor(s) and not of MDPI and/or the editor(s). MDPI and/or the editor(s) disclaim responsibility for any injury to people or property resulting from any ideas, methods, instructions or products referred to in the content.