Abstract
Thunderstorms downbursts can be hazardous during aircraft landing and take-off. A warming climate increases low- to mid-level troposphere water vapor, typically transported from high sea-surface temperature regions. Consequently, the future occurrence and intensity of destructive wind gusts from wet microburst thunderstorms are expected to increase. Wet microbursts are downdrafts from heavily precipitating thunderstorms and are several kilometers in diameter, often producing near-surface extreme wind gusts. Brisbane airport recorded a wet microburst wind gust of 157 km/h in November 2016. Numerous locations in eastern Australia experience warm season (October to March) wet microbursts. Here, eight machine learning techniques comprising forward and backward linear regression, radial basis forward and backward support vector regression, polynomial-based forward and backward support vector regression, and forward and backward random forest selection were employed. They identified primary attributes for increased atmospheric instability by warm moist air influx from regions of high sea-surface temperatures. The climate drivers detected here are indicative of increased future eastern Australian warm season thunderstorm downbursts, occurring as wet microbursts. They suggest a greater frequency and intensity of impacts on aircraft safety and operations affecting major east coast airports, such as Sydney and Brisbane, and smaller aircraft at inland regional airports in southeastern Australia.
1. Introduction and Background
During the warmer months (October to March), parts of eastern Australia experience severe thunderstorms. The regions most affected are northeastern New South Wales (NSW) and southeast Queensland (QLD) (Figure 1). The major east coastal airports are Sydney and Brisbane. The regional airports referenced in this study are located within the hexagonal outline in Figure 1. In this region, thunderstorm activity is fuelled by land heating and moisture from the adjacent warm Pacific Ocean.
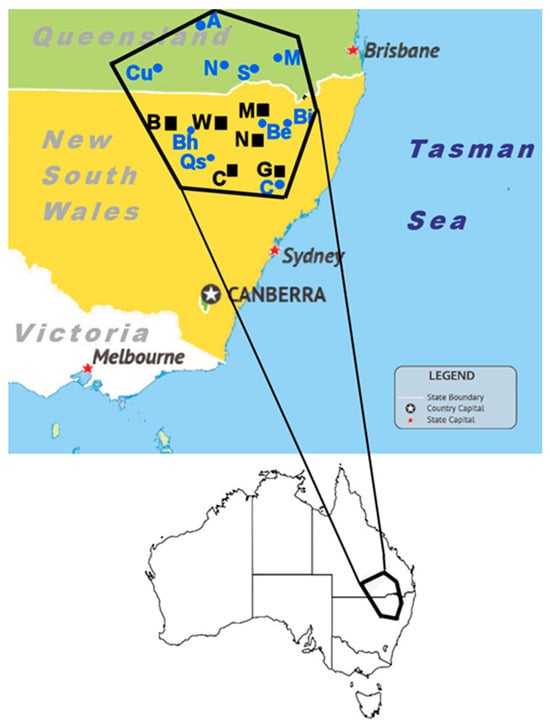
Figure 1.
Location map of northeastern NSW and southeastern QLD within southeastern Australia. The inset area containing the six airports (black font), B—Bourke, W—Walgett, C—Coonamble, M—Moree, N—Narrabri, and G—Gunnedah, is the subject of this study. From October to March, total monthly rainfall at observations (blue font), Cu—Cunnamulla, A—Augathella, N—Normandy, S—Surat, M—Miles, Bh—Brewarrina hospital, Q—Quambone station, Be—Bellata, Bi—Bingara, and C—Curlewis, are also shown.
The main danger to aircraft operations at take-off and landing are the density currents produced by thunderstorm downbursts [1]. The key research question then is to see if machine learning (ML) analysis can identify dominant attributes involving heat and moisture that would lead to an increase in strong thunderstorm downbursts. As flight numbers are rising, the danger to aircraft safety and operations can also be expected to increase [2]. A recent example shows the intense radar reflectivities indicating severe thunderstorms near Narrabri and Gunnedah, which occurred on 2 January 2025 (Figure 2—left panel). Thunderstorm warnings were issued, including for damaging wind gusts (>90 km/h) close to the town of Moree (Figure 2—right panel).
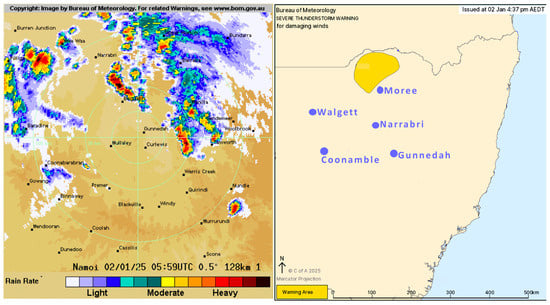
Figure 2.
Radar reflectivity echoes at 0559 UTC 2 January 2025 (available from Australian Bureau of Meteorology Radar Archives on request), indicating heavy precipitation near Narrabri—(left panel). Warning area for damaging winds from severe thunderstorms north of Moree issued at 0537 UTC (4.37 p.m.) AEDT 2 January 2025—(right panel).
Studies have shown how global warming is increasing clear air turbulence (CAT) associated with jet streams in both hemispheres [3,4,5,6]. However, little research has focused on aircraft dangers during take-off and landing. Consequently, the present study emphasizes near-surface hazards close to airports, rather than CAT, cloud turbulence [6], mountain waves [7], and jet streams.
In 2022, Australia’s airports added $105 billion to the national economy, supporting 690,000 full-time equivalent jobs [8]. Beyond flights, airports provide critical infrastructure and services supporting numerous general aviation activities. For example, they assist region-based primary industries, connect workers across the country, and support tourism. In NSW, there are 70 main regional airports. In the 30 years from 30 October 1990, and prior to the COVID-19 pandemic, Australian domestic passengers grew five-fold, from 16.8 million passengers in 1988–1989 to 61 million in 2019 [9]. Total domestic air passengers are projected to grow by 137 per cent between 2022–2023 and 2049–2050, from 66.2 billion passenger kilometers in 2022–2023 to 157.1 billion passenger kilometers in 2049–2050 [2]. However, these projections do not explicitly model the potential direct effects of future global and regional climate warming on air travel [2]. In a warming climate, severe thunderstorm environments are projected to increase in eastern Australia [10].
In brief, thunderstorm occurrence depends on three ingredients: (i) sufficient moisture availability through the low- to mid-levels of the troposphere; (ii) instability to provide buoyancy of lifted parcels of air to extend high enough into the troposphere to form cumulonimbus clouds; (iii) a lifting mechanism such as a low-level, low-pressure trough, or a cold frontal system. These ingredients will lift air parcels so they become buoyant [11]. In southeast Australia, during the warm months (October to March) when thunderstorms occur most often, thunderstorm precipitation is characterized by low-level, pre-frontal, low-pressure troughs that provide the lifting mechanism [12]. Pre-frontal, low-pressure troughs are areas of low atmospheric pressure that often precede cold fronts and are associated with wind shifts in Australia from northeast to northwest. These troughs are elongated features on weather maps, typically marked by a dashed line, and are areas where two different air masses meet. As a trough moves, generally from the west, its drier, denser air can lift moist, warmer air, leading to cloud development, generating thunderstorms along the elongated wind change.
Downbursts from thunderstorms are especially dangerous during take-off and landing at airports, particularly in the form of wet or dry microbursts (<4 km in diameter) [13,14]. Dry microbursts occur in environments exhibiting convective instability. They frequently develop within environments exhibiting a deep, dry, atmospheric boundary layer (ABL) of at least 3 km in depth [15]. Here, we focus on wet microbursts. A key contributor to wet microbursts is precipitation loading, which occurs in thunderstorms when excessive water content within the cloud creates a downward force [15]. This effect induces a downward current of air or enhances descending air within a downflow. Isolated microbursts are driven by the weight of precipitation downdrafts as well as by evaporation and melting, thereby cooling descending air, which further accelerates the downdraft. As descending, heavier, cooler air currents reach the ground, an outburst of diverging winds is created. Another mechanism contributing to surface outflow is the downward transport of strong horizontal winds in the mid-level atmosphere. As the thunderstorm downburst descends towards the surface, it generates a horizontal component of similar magnitude to the mid-level winds. Sudden, unexpected, losses in altitude by descending aircraft, from the low-level vertical wind shear created by downbursts, have resulted in numerous aircraft accidents [14].
All thunderstorms have downdrafts, with non-severe thunderstorms producing wind gusts less than 90 km/h, some of which are wet microbursts, according to the Australian Bureau of Meteorology’s wind speed threshold for severe thunderstorm warnings. The initiation and strength of wet microbursts depend on the 3-dimensional wind structure and moisture profile from which a thunderstorm forms. Wet microbursts occur in environments with sufficient available moisture in low- to mid-level atmosphere. This usually occurs in eastern Australia during the warmer months, when moisture content is readily available from the Tasman/Coral Seas adjacent to the Australian east coast. In the warm season from October to March, the six inland airports located in an area prone to convective rainfall formed from frontal troughs like the example discussed above. Hence, thunderstorms generated by pre-frontal troughs or subtropical inland low-pressure troughs in the easterlies are climatologically dominant.
The vertical wind profiles associated with wet microbursts typically show convergence of low-level northeast winds ahead of the pre-frontal trough with northwest to westerly winds after the pre-frontal trough passage. At Brisbane airport, a wet microburst with the vertical wind profile mentioned above produced a maximum recorded wind gust of 157 km/h in November 2016 [16]. The maximum recorded wind gust at Brisbane airport was 185 km/h in January 1985, during a thunderstorm with a similar wind structure. In extremely dry environments, such as in central Australia, wet microbursts are less likely to occur than in the moist, subtropical environment of southeast QLD and northeast NSW during the warm season months from October to March. The characteristics of wet microbursts were present for the squall line thunderstorms investigated in this study. They produced wet microburst gusts at the northeastern NSW airports of Bourke, Coonamble, Gunnedah, Moree, Narrabri, and Walgett (see location Figure 1).
Over the last 40 years, short bursts of heavy rainfall lasting about 10 min have increased near Sydney [17] and worldwide in general [18]. Wet microburst thunderstorms produce short-period, heavy rainfall bursts [19]. Increased atmospheric moisture due to global warming is amplified because warmer air holds more water vapor. In ML related to climate applications, attributes commonly referred to as physical processes and their interactions are represented by indices or data values of components of the climate system. In this study, using ML techniques, attributes consisting of meteorological and other climate drivers in the form of indices involving, for example, atmospheric and oceanic climate drivers, are assessed to identify increased moisture availability in the low- to mid-level troposphere. Increased heating and low-level atmospheric moisture are known to have increased in recent decades, where the six airports are located (Figure 3). Figure 3 (left panel) shows the anomalous increase in low-level moisture (relative humidity) that has occurred in recent decades. Combined with the anomalous increase in low-level heat shown by the potential temperature at 850 hPa in Figure 3 (right panel), low-level destabilization of the atmosphere is increased, which potentially leads to stronger convective and thunderstorm rainfall.
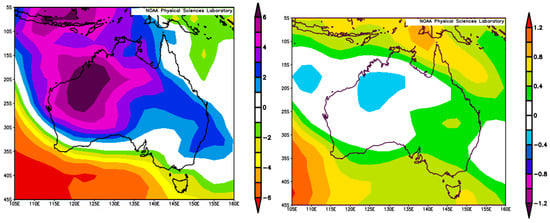
Figure 3.
(Left panel)—NCEP/NCAR reanalysis of 850 hPa relative humidity composite anomaly (%) for October to March 1992–1993 to 2017–2018 minus 1965–1966 to 1991–1992 (1991–2020 climatology). The blue shading in eastern Australia indicates an anomalous increase in relative humidity. (Right panel)—NCEP/NCAR reanalysis of 850 hPa potential temperature composite anomaly (°K) for October to March 1992–1993 to 2017–2018 minus 1965–1966 to 1991–1992. The green shading in eastern Australia indicates an anomalous increase in potential temperature.
There are numerous studies on thunderstorm downbursts and associated hazards of severe near-surface wind gusts. Some of the more recent studies have employed ML techniques, in an emerging trend [20,21,22]. However, the cited study that specifically targets airport thunderstorms does not use ML, in contrast with our study.
In the following section, machine learning (ML) techniques are described. In Section 3, the ML techniques are analyzed with reference to an example of a squall line containing downbursts, at six airports over inland southeast Australia, caused by thunderstorm precipitation from October to March when precipitation occurs predominantly from thunderstorms. Notably, increased precipitation and stronger downbursts from wet microbursts are suggested to be the result of changes in the southern hemisphere (SH) and regional atmospheric circulation.
2. Materials and Methods
Recently, various ML techniques have been applied to precipitation to determine dominant attributes related to seasonal, monthly groupings and annual periods of Australian climate extremes such as drought, heat, and extreme rainfall [23,24,25,26]. It is not usually known a priori which technique should be optimal for a given example. Here, we applied eight techniques and identified the dominant attributes from an assessment of all eight techniques.
Numerous known climate drivers were potential attributes for October–March precipitation. They include the Atlantic Multi-decadal Oscillation (AMO); the Indian Ocean Dipole (IOD); global sea-surface temperature anomalies (GlobalSSTA); global temperature anomalies (GlobalT); Niño3.4; TPI; the Southern Annular Mode (SAM); the Southern Oscillation Index (SOI); and Tasman Sea sea-surface temperature anomalies (TSSST). Climate driver time series were provided by the Earth System Research Laboratory [27], except for TSSST, which was obtained from the Australian Bureau of Meteorology [28].
Two-way interaction terms combining the above predictors (e.g., Niño3.4*SAM), were also considered as potential predictors. These two-way interaction terms are considered as possible attributes, because one attribute can reinforce or reduce the influence of another. Additional relationships between possible attributes, such as additive and quotient relationships, assessed by Richman and Leslie [29] for a single station, were not considered because some attributes in this study are known to be highly correlated with other attributes, while all ocean basins are represented. Furthermore, we restricted the combinations to those involving just two potential attributes, specifically because the number of combinations of the nine possible predictors (AMO, SOI, Niño3.4, SAM, IOD, TPI, Global temperature anomalies, and Global and Local SST anomalies) provides a large and comprehensive number (45) of possible attributes.
Because relationships between climate drivers and precipitation vary between weak and strong, linear and non-linear, and in combinations, this study developed both linear and non-linear machine learning models of October–March and annual precipitation for a range of climate drivers. From previous studies of inland areas within southeast Australia, permutation testing of precipitation and temperature have shown statistical significance before and after the mid-1990s [24,25].
To attribute the above climate drivers to the 1965 to 2018 precipitation period considered, ML was applied with an expanding window with a ten-fold cross-validation [30], where the initial training window contained 10 years of data, and the testing window was fixed to contain the following 10 years of data. This method was applied to the 45 potential attributes mentioned above. The considered models were linear regression (LR), support vector regression (SVR) [30] with both radial basis function (RBF) and polynomial (Poly) kernels [31], and random forest (RF) regression [32]. We also explored forward and backward selection in both SVR and RF [29].
By selecting the attributes using SVR and RF machine learning, involving both forward and backward selection techniques, there were a total of eight techniques applied in this study. The model performances were assessed by comparing the eight techniques and expressing the dominant climate drivers (attributes) as percentages of the number of times each model appears in more than 50% of the ten-fold cross-validation. We used several ML techniques because the optimal technique is generally not known a priori and is likely to depend on the application being considered. Including the two-way interaction combinations, there were 45 possible attributes for predicting precipitation (Table S1). Including all attributes would produce overfitting as mentioned above, leading to large errors when models are applied to a test data set in prediction mode. To select attributes that generalize well, the ten-fold cross-validation was applied as mentioned above, using both forward and backward selection of potential attributes as in Maldonado and Weber [33]. In summary, the eight ML techniques used include two linear methods and six non-linear methods. The two linear methods are forward and backward selection using linear regression. Forward selection begins with one climate driver and sequentially adds another, based on which additional climate driver achieves minimal error. The process continues until the testing error is minimized. Backward selection starts with all predictors and continues to eliminate them until the testing errors rise above those with all predictors. Detailed results from all attributes in all models, together with error statistics, are provided in Supplementary Table S1.
Strong wind gusts are well known to be difficult to forecast, with few operational methods reliably predicting thunderstorm wind speeds. The short-lived thunderstorm wind events associated with a long-lived squall line over inland eastern Australia on 13 December 2018 is presented. Conditions leading to damaging winds are analyzed by using high-resolution temporal and spatial Himawari-8 satellite images, an upper air sounding, surface observational data from six airports, Global Data Assimilation System (GDAS) meteorological data, and model output of predicted fields of meteorological variables. The meteorological analysis of the example regarding the dominant attributes revealed is discussed in the following Results and Discussion section.
Warm season (October to March), monthly precipitation data were obtained from the Australian Bureau of Meteorology’s homogeneous climate record through its climate change site network [34]. There are ten precipitation stations with complete records comprising Augathella, Cunnamulla, Normandy, Miles, Surat, Bellata, Bingara, Curlewis, Brewarrina hospital, and Quambone (Figure 1). These stations are representative of the six airports. In the few cases where several single monthly values were missing, averages of monthly values from either side were used. There was no need to use smoothing or anomaly standardization because station precipitation totals were used. Precipitation data were summed up to obtain a proxy for total precipitation across the area during October to March in the period 1965–2018. This period allows an equal split (1965–1991 and 1992–2018) centered on the early 1990s, after which climate change impacts have accelerated, e.g., [18].
The meteorological case study describes how important heat and moisture are to the development of thunderstorm downbursts, which can potentially affect multiple airports when present in squall lines that move through eastern Australia during the warm season. ML approaches can determine how dominant or otherwise heat and moisture are by identifying the related attributes of potential climate drivers.
3. Results and Discussion
3.1. Meteorological Features of Case Study
Frequently, in southeastern Australia during the warm season, thunderstorms produce downbursts threatening major and regional airports. Here, a case study shows strong surface wind gusts produced by downbursts at six airports.
3.1.1. Synoptic Overview of Squall Line Progression and Thunderstorm Downdrafts Encountered at Six Airports
At 0000 UTC (2100 AEDT) on 13 December 2018, low pressure was centered over southeast Australia. A cold front extended from the low center to the northwest and a pre-frontal trough, ahead of the cold front and parallel to it, extended further northwest to central Australia (Figure 4-left panel). A squall line with embedded thunderstorms linked to the pre-frontal trough in Figure 3 advanced eastwards during the period 1200 UTC (1200 AEDT) to 1800 UTC (0500 AEDT).
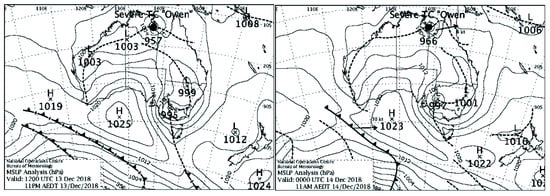
Figure 4.
Australian region SLP analysis at 1200 UTC (2200 AEDT) on 13 December 2018 (left panel), and 0000 UTC (1000 AEDT) on 14 December 2018 (right panel).
The Himawari-8 satellite image (Figure 5), displays the six stations (within the open green circles) close to where the maximum gusts occurred. From the GPATs covering the previous 10 min, a squall line propagated from the west to the east in a cloud band, as represented by the pre-frontal trough shown in Figure 4. The time when the maximum gusts were observed were consistent with the time when the GPATS were detected.
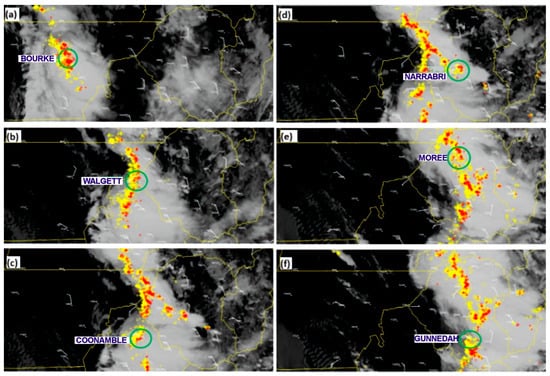
Figure 5.
Himawari-8 satellite images indicating the squall line when near each of the six airports located within the green circles.
The thunderstorm-associated wind gusts exceeding 41 knots (76 km/h) were expected at more than 20 stations, which met the criterion for issuing airport warnings of expected gales.
3.1.2. Airport Wind Observations
In Figure 6a,b, after 0000UTC, maximum gusts increased to 58 knots (107 km/h) and 57 knots (105 km/h) at Coonamble and Narrabri airports. Station level pressure (QNH) was increasing significantly (approximately 3 hPa) and temperatures dropped at both airports (by over 10 °C). As the low-pressure trough approached Coonamble and Narrabri airports, the QNH should have decreased according to the synoptic analysis in Figure 4. However, due to the thunderstorm squall line, as well as the smaller scale downdrafts, density currents reached the ground and spread horizontally, inducing short-lived gusts. Similar mechanisms occurred at the four other airports of Bourke, Walgett, Moree, and Gunnedah prior to the low-pressure trough shown in the two panels of Figure 3.
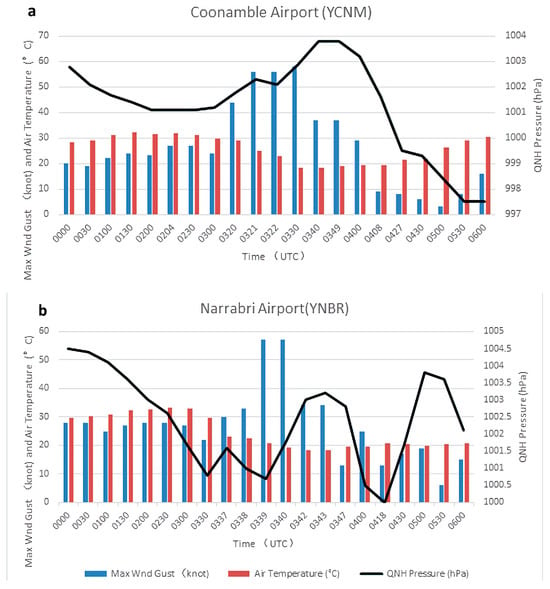
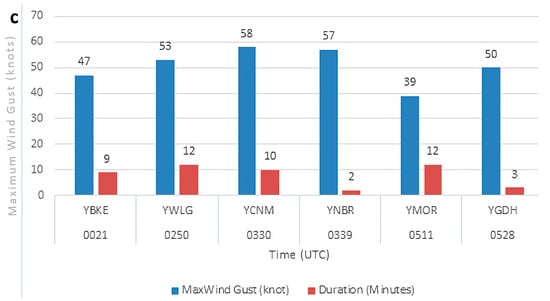
Figure 6.
Time series of observations for two extreme airport maximum wind gusts at (a) Coonamble Airport from 0000UTC to 0600UTC on 13 December 2018, and at (b) Narrabri Airport. Time (UTC) on the horizontal axis, wind gust and temperature on the vertical axis (left), and QNH on the vertical axis (right). Maximum wind gusts (blue histograms), air temperatures (red histograms), and station level pressure (QNH) (black lines). (c) Time and duration of maximum wind gusts at the six airports.
3.1.3. Radiosonde Data
The time of the wind and temperature profile sounding was 0531 UTC (Figure 7), close to the time of the maximum gust, indicating that the potential for a strong downdraft that did occur at Moree airport. A notable deep, dry, adiabatic layer exists below the cloud base (“inverted V” trace) at approximately 780 hPa to the surface. It is a typical thermodynamic feature of storms producing damaging wind gusts. Another feature was a dry slot in the middle level above the lifting condensation level (LCL) between 750 hPa and 620 hPa. Dryness is a key measure for predicting downdraft potential [35,36]. The precipitable water content is 46.1 mm and the base height of the thunderstorms is about 2 km (Lifting condensation level, Plcl = 785 hPa).
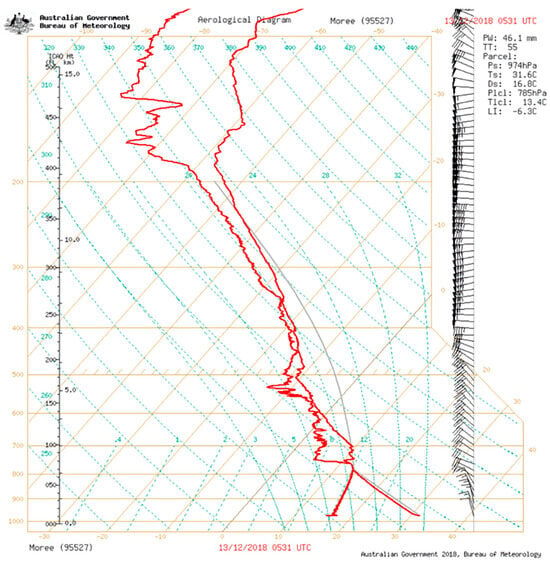
Figure 7.
Radiosonde profile at 0531 UTC on 13 December 2018 at Moree Airport.
The left light-brown vertical axis is pressure (hPa), while the left black vertical axis is height above the sea-surface level in hundreds of feet. Hence, 500 is 5000 ft (about 1600 m) above sea level; the right black vertical axis is height above the sea level in km. Along the right vertical axis are wind profiler observations. The red solid line is the temperature profile (°C), with the dew point profile (°C) to the left.
3.2. Machine Learning Attribution
Dominant Climate Drivers for the Area Representative of the Six Airports
Key drivers of the October–March warm season precipitation were found to be SOI, DMI*SAM, SAM, GlobalT*GlobalSSTA, and SOI*TPI (Table 1). These five attributes appeared in the highest percentage of the cross-validation folds across the eight ML training methods (Table S1). DMI and TPI relate to Indian Ocean SSTs and Pacific Ocean SSTs, respectively, whereas SOI is the atmospheric component of ENSO for the Pacific Ocean basin, and SAM is a measure of the latitudinal displacement of the southern hemisphere mid-latitude zonal winds. Notably, the combination of GlobalT and GlobalSST anomalies as a dominant climate driver is consistent with increasing atmospheric water vapor availability over the region being provided by increasing global ocean temperatures. Additionally, Table 1 reveals that drivers containing SOI and SAM (both in positive phases) raise the likelihood of increased precipitation in eastern Australia, including locations near the six airports. The five dominant annual attributes in Table 1 are closely related to the dominant attributes for October to March, indicating that the warm season is the dominant period of the year for precipitation.

Table 1.
The five most dominant climate drivers (attributes) for annual and the October to March precipitations representing the area of the six airports. The attributes appear in at least 50% of the folds of the ten-fold cross-validation across the eight training methods and are considered the most likely attributes of precipitation.
Table S1 shows the mean percentage and standard error of folds for the October to March precipitation for each of the eight ML techniques and each attribute. The deviations for the five dominant attributes are mostly in the low twenties. For these five dominant attributes, both linear forward and backward selection perform the worst in terms of appearing in the percentage of folds, while radial-based SVR with forward selection, polynomial-based SVR with backward selection, and RF backward selection appear in 80% or more of the folds. Therefore, these three ML techniques rank equally as the best in appearing in above 80% of the folds for the five dominant climate drivers.
3.3. Atmospheric Circulation Changes Related to Dominant Climate Drivers
Over the last forty years, several authors documented a poleward shift in the mid-latitude westerly jet of the southern hemisphere during the last decades of the twentieth century, mainly during the warm season, e.g., [37]. Related to climate drivers, the most striking example is the increasing positive trend in the SAM index with a poleward shift in SH mid-latitude zonal winds (e.g., [25]—Figure 5). This shift produced anomalously high pressures over Antarctica and negative pressure anomalies in the 40–50° S latitude belt, reaching 30° S just east of southeast Australia, implying a negative SAM. In contrast, negative pressure anomalies over Antarctica connected to an anomalous vortex over the southeast Pacific Ocean, where high latitudes are encircled by positive anomalies in the mid-latitudes. Hence, for October to March 1966 to 1992, negative SAM was replaced by the dominance of positive SAM from 1993 to 2018 [25].
4. Conclusions
Eastern Australia thunderstorm activity is fueled by a combination of land heating and moisture influx from the adjacent warm Pacific Ocean off the east coast and from around the sea to the north of the Australian continent during the austral warm season from October to March. The major aircraft hazards are density currents generated from downbursts by the thunderstorms. The downbursts are particularly dangerous for aircraft during taking off and landing. Since the number of flights is increasing, the threat to aircraft safety and operations is also increasing.
A case study is presented of a squall line in January 2018 that produced numerous downbursts with associated damaging surface wind gusts at six airports over inland eastern Australia. Using eight ML regression methods, applied to 1965–2018 observational precipitation data, the five major October to March precipitation attributes were identified. These were the SOI, DMI*SAM, GlobalT*GlobalSSTA, and SOI*TPI. The atmospheric SOI influence arises when onshore winds dominate during La Nina episodes, while DMI*SAM implies anomalously warm east Indian Ocean SSTs off northwest Australia and combines upper tropospheric level moisture directed over southeast Australia, with onshore low-level moisture directed from the southwest Pacific Ocean when the SAM is positive. SAM was shown to be anomalously positive from the early to mid-1990s.
Notably, for the October to March period, the selected attributes are related to GlobalT and GlobalSSTA, highlighting the profound influence that GW now has on precipitation in the area containing the six airports. Lastly, the SAM also plays a role by modulating the influence of DMI.
For annual precipitation, the five major attributes identified by the ML methods were GlobalSSTA*TSSST, AMO*SAM, AMO*Niño3.4, TPI, and D MI*Niño3.4. The selected annual attributes are related to GW, GlobalT, GlobalSSTA, and TSSST, again highlighting the strong influence that GW now has on precipitation in the area containing the six airports. For October to March over the 27-year period from 1966 to 1992, a negative SAM was replaced by the dominance of a positive SAM for the following 27-year period from 1993 to 2018 [34]. This abrupt SAM transition underlines the importance of changes in the large-scale SH atmospheric circulation that now provides an increased moisture flux over the eastern and northern parts of the Australian continent.
With the aim of developing improved sub-seasonal and seasonal hazardous weather outlooks, a promising next step likely will be combining high-resolution climate model projections with machine leaning models. This hybrid approach is expected to be necessary, as traditional machine learning approaches, using training and test data sets, can rapidly lose predictive skill if there is a high level of non-stationarity in the training (observational) data sets, especially if it continues into the test data sets.
In terms of the challenges in extrapolating findings under future climate change scenarios, an important limitation of the expanding window approach used in this study concerns the non-stationarity of the precipitation data and the need for a moving window approach, which can possibly deal with non-stationary time series data better. However, in other similar studies by the authors, only very minor differences were found between results from the expanding and moving window methods.
We acknowledge the limitations of ML models, which is why our approach uses a range of ML techniques. Potential biases in precipitation data would likely be minimal because Australian Bureau of Meteorology data, which are the precipitation data that were used, are highly quality controlled.
Supplementary Materials
The following supporting information can be downloaded at: https://www.mdpi.com/article/10.3390/cli13060127/s1. Table S1: The five major precipitation attributes identified (highlighted in yellow), for the October to March time period.
Author Contributions
Conceptualization, L.L., S.W. and M.S.; methodology, L.L.; software, L.L.; validation, L.L., M.S. and S.W.; formal analysis, M.S. and L.L.; investigation, M.S., L.L. and S.W.; resources, L.L.; data curation, S.W. and M.S.; writing—original draft preparation, M.S. and L.L.; writing—review and editing, M.S. and L.L.; visualization, S.W. and M.S.; supervision, L.L.; project administration, L.L. All authors have read and agreed to the published version of the manuscript.
Funding
This research received no external funding.
Data Availability Statement
All data used or generated are available via the publicly available web links listed in the references. The precipitation data are available on request through https://bom.gov.au/climate/data.
Acknowledgments
M.S. and L.L. the support of the School of Mathematical and Physical Sciences, University of Technology Sydney, for encouraging this work.
Conflicts of Interest
The authors declare no conflicts of interest.
References
- What Weather Is Hazardous to Flying? The Weather Guys. Available online: https://wxguys.ssec.wisc.edu/2019/03/25/hazardous-flying-weather/ (accessed on 31 May 2025).
- Australian Government. 2024. Australian Aviation Forecasts—2024 to 2050 (Summary). Available online: https://www.bitre.gov.au/sites/default/files/documents/bitre-rr157-summary.pdf (accessed on 17 February 2025).
- Prosser, M.C.; Williams, P.D.; Marlton, G.J.; Harrison, R.G. Evidence for large increases in clear-air turbulence over the past four decades. Geophys. Res. Lett. 2023, 50, e2023GL103814. [Google Scholar] [CrossRef]
- Williams, P.; Joshi, M. Intensification of winter transatlantic aviation turbulence in response to climate change. Nat. Clim. Chang. 2013, 3, 644–648. [Google Scholar] [CrossRef]
- Williams, P.D. Increased light, moderate, and severe clear-air turbulence in response to climate change. Adv. Atmos. Sci. 2017, 34, 576–586. [Google Scholar] [CrossRef]
- Storer, L.N.; Williams, P.D.; Joshi, M.M. Global Response of Clear-Air Turbulence to Climate Change. Geophys. Res. Lett. 2017, 44, 9976–9984. [Google Scholar] [CrossRef]
- Cotton, W.; Anthes, R. International geophysics series. In Storm and Cloud Dynamics; Academic Press: Cambridge, MA, USA, 1989; Volume 44, ISBN 978-0-12-192530-7. [Google Scholar]
- Reynolds, J. The Hidden Dangers of Mountain Wave Turbulence. NOAA’s National Weather Service. Available online: https://www.weather.gov/media/publications/front/11nov-front.pdf (accessed on 19 April 2025).
- Deloitte. 2023. Taking Flight: The Economic and Social Contribution to Australia’s Airports. Australian Airports Association. Available online: https://airports.asn.au/wp-content/uploads/2023/11/Deloitte-Taking-flight_The-economic-and-social-importance-of-Australias-Airports.pdf (accessed on 17 February 2025).
- Allen, J.T.; Allen, E.R. A review of severe thunderstorms in Australia. Atmos. Res. 2016, 178–179, 347–366. [Google Scholar] [CrossRef]
- Doswell, C.A., III. The Operational Meteorology of Convective Weather. Volume I. Operational Mesoanalysis; NOAA Technical Memorandum NWS NSSFC; National Severe Storms Forecast Center: Kansas City, MI, USA, 1982; Volume 5. Available online: https://repository.library.noaa.gov/view/noaa/7049 (accessed on 17 April 2025).
- Speer, M.S.; Geerts, B. A synoptic—Mesoalpha-scale climatology of flash-floods in the Sydney metropolitan area. Aust. Meteorol. Mag. 1994, 43, 87–103. [Google Scholar]
- Fujita, T.T. The Downburst: Microburst and Macroburst: Report of Projects NIMROD and JAWS; University of Chicago: Chicago, IL, USA, 1985; p. 122. [Google Scholar]
- Wakimoto, R.M. Forecasting Dry Microburst Activity over the High Plains. Mon. Wea. Rev. 1985, 113, 1131–1143. [Google Scholar] [CrossRef]
- Doswell, C.A., III. The Operational Meteorology of Convective Weather. Volume II. Storm Scale Analysis; NOAA Technical Memorandum ERL ESG; Environmental Research Laboratories, Environmental Sciences Group: Boulder, CO, USA, 1985; Volume 15. Available online: https://repository.library.noaa.gov/view/noaa/11215 (accessed on 17 April 2025).
- Soderholm, J.S.; Turner, K.I.; Brook, J.P.; Wedd, T.; Callaghan, J. High-impact thunderstorms of the Brisbane metropolitan area. J. South. Hemisph. Earth Syst. Sci. 2020, 69, 239–251. [Google Scholar] [CrossRef]
- Ayat, H.; Evans, J.P.; Sherwood, S.C.; Soderholm, J. Intensification of subhourly heavy rainfall. Science 2022, 378, 6620. [Google Scholar] [CrossRef]
- IPCC. Climate Change 2021: The Physical Science Basis. Contribution of Working Group I to the Sixth Assessment Report of the Intergovernmental Panel on Climate Change; Masson-Delmotte, V., Zhai, P., Pirani, A., Connors, S.L., Péan, C., Chen, Y., Goldfarb, L., Gomis, M.I., Matthews, J.B.R., Berger, S., et al., Eds.; Cambridge University Press: Cambridge, UK; Mining, Inference, and Prediction, Springer Science & Business Media: New York, NY, USA, 2021; ISBN 978-0-387-84858-7. Available online: https://www.ipcc.ch/report/ar6/wg1/downloads/report/IPCC_AR6_WGI_SPM_final.pdf (accessed on 17 February 2025).
- NSSL. 2025. NOAA National Severe Storms Laboratory. Severe Weather 101—Damaging Winds. Available online: https://www.nssl.noaa.gov/education/svrwx101/wind/types/ (accessed on 17 February 2025).
- Hadavi, M.; Romanic, D. Machine Learning Investigation of Downburst-Prone Environments in Canada. J. Appl. Meteor. Climatol. 2024, 63, 677–697. [Google Scholar] [CrossRef]
- Bruno, L.; Medina, L.D.; Carey, C.G.; Amiot, R.M.; Mecikalski, W.P.; McNamara, T.M.; Blakeslee, R.J. A Random Forest Method to Forecast Downbursts Based on Dual-Polarization Radar Signatures. Remote Sens. 2019, 11, 826. [Google Scholar] [CrossRef]
- Chan, P.-W.; Cheung, P.; Chan, Y.-W. Observation of Downburst Associated with Intense Thunderstorms Encountered by an Aircraft at Hong Kong International Airport. Appl. Sci. 2025, 15, 2223. [Google Scholar] [CrossRef]
- Hartigan, J.; MacNamara, S.; Leslie, L.M.; Speer, M. Attribution and Prediction of Precipitation and Temperature Trends within the Sydney Catchment Using Machine Learning. Climate 2020, 8, 120. [Google Scholar] [CrossRef]
- Speer, M.; Hartigan, J.; Leslie, L. Machine Learning Assessment of the Impact of Global Warming on the Climate Drivers of Water Supply to Australia’s Northern Murray-Darling Basin. Water 2022, 14, 3073. [Google Scholar] [CrossRef]
- Speer, M.; Hartigan, J.; Leslie, L.M. Machine Learning Identification of Attributes and Predictors for a Flash Drought in Eastern Australia. Climate 2024, 12, 49. [Google Scholar] [CrossRef]
- Speer, M.; Hartigan, J.; Leslie, L. The Machine Learning Attribution of Quasi-Decadal Precipitation and Temperature Extremes in Southeastern Australia during the 1971–2022 Period. Climate 2024, 12, 75. [Google Scholar] [CrossRef]
- NOAA PSL. 2025. NOAA Physical Timeseries. Climate Timeseries. Available online: https://psl.noaa.gov/gcos_wgsp/Timeseries/ (accessed on 17 February 2025).
- Climate Change 2025a. Australian Climate Change Monitoring and Projections. Tasman Sea Sea-Surface Temperature Time Series. Available online: http://www.bom.gov.au/climate/change/?ref=ftr#tabs=Monitoring-and-projections (accessed on 17 February 2025).
- Richman, M.B.; Leslie, L.M. Machine Learning for Attribution of Heat and Drought in Southwestern Australia. Procedia Comput. Sci. 2020, 168, 3–10. [Google Scholar] [CrossRef]
- Vapnik, V. The Nature of Statistical Learning Theory; Springer: New York, NY, USA, 1995; ISBN 978-1-4757-3264-1. [Google Scholar]
- Hastie, T.; Tibshirani, R.; Friedman, J. The Elements of Statistical Learning: Data Mining, Inference, and Prediction; Springer Science & Business Media: New York, NY, USA, 2009; ISBN 978-0-387-84858-7. [Google Scholar]
- Breiman, L. Random Forests. Mach. Learn. 2001, 45, 5–32. [Google Scholar] [CrossRef]
- Maldonado, S.; Weber, R. A wrapper method for feature selection using Support Vector Machines. Inf. Sci. 2009, 179, 2208–2217. [Google Scholar] [CrossRef]
- Climate Change. 2025. Australian Climate Change Datasets. Available online: http://www.bom.gov.au/climate/change/?ref=ftr#tabs=Datasets (accessed on 17 February 2025).
- Grundstein, A.; Shepherd, M.; Miller, P.; Sarnat, S.E. The Role of Mesoscale-Convective Processes in Explaining the 21 November 2016 Epidemic Thunderstorm Asthma Event in Melbourne, Australia. J. Appl. Meteor. Climatol. 2017, 56, 1337–1343. [Google Scholar] [CrossRef]
- Pryor, K.L. Progress and Developments of Downburst Prediction Applications of GOES. Wea. Forecast. 2015, 30, 1182–1200. [Google Scholar] [CrossRef]
- Solman, S.A.; Orlanski, I. Poleward Shift and Change of Frontal Activity in the Southern Hemisphere over the Last 40 Years. J. Atmos. Sci. 2014, 71, 539–552. [Google Scholar] [CrossRef]
Disclaimer/Publisher’s Note: The statements, opinions and data contained in all publications are solely those of the individual author(s) and contributor(s) and not of MDPI and/or the editor(s). MDPI and/or the editor(s) disclaim responsibility for any injury to people or property resulting from any ideas, methods, instructions or products referred to in the content. |
© 2025 by the authors. Licensee MDPI, Basel, Switzerland. This article is an open access article distributed under the terms and conditions of the Creative Commons Attribution (CC BY) license (https://creativecommons.org/licenses/by/4.0/).