Article

Multiscale Modeling Framework for Urban Climate Heat Resilience—A Case Study of the City of Split

Faculty of Civil Engineering, Architecture and Geodesy, University of Split, Matice Hrvatske 15, 21000 Split, Croatia
*
Author to whom correspondence should be addressed.
Climate 2025, 13(4), 79; https://doi.org/10.3390/cli13040079
Submission received: 23 January 2025 / Revised: 1 April 2025 / Accepted: 8 April 2025 / Published: 14 April 2025

Abstract

:
This study presents a comprehensive framework for evaluating urban heat resilience, incorporating urban climatology models, their characteristics, and simulation programs. Utilizing the local climate zone (LCZ) classification method, this research explores how urban geomorphology influences the thermal characteristics of the area. This study integrates spatial data at different “levels of detail” (LOD), from the meso- to building scales, emphasizing the significance of detailed LOD 3 models acquired through 3D laser scanning. The results demonstrate the ability of these models to identify urban heat islands (UHIs) and to simulate urban planning scenarios, such as increasing green spaces and optimizing building density, to mitigate the UHI effect. The ST3D 3D model of the city of Split, represented using an LOD 2 object model, is utilized for meso- and local-scale analyses, while LOD 3 models derived from laser scanning provided in-depth insights at the building scale. The case studies included the Faculty of Civil Engineering, Architecture, and Geodesy building on the University of Split campus and the old town hall in the densely built city center. This framework highlights the advantages of integrating GIS and BIM technology with urban climate analyses, offering tools for data-driven decision-making and fostering sustainable, climate-resilient urban planning.

1. Introduction

Half of the global population lives in urban areas, but this number is expected to dramatically increase [1]. Increasing urbanization causes climate or temperature balance changes in urban areas, which we call the urban heat island (UHI) effect. The urban climate refers to the specific atmospheric conditions and temperature patterns in urban areas, characterized by this urban heat island effect [2,3]. Urban areas are especially vulnerable because the local climate is influenced by climate variability and change but is also substantially affected by urbanization and related changes in land cover.
Urban climate change refers to changes in the physical environment of urban areas caused by urbanization and the anthropogenic environmental impact (changes in the natural physical characteristics of the space: biophysical environments, ecosystems, biodiversity, and natural resource changes), or the human impact on the environment. These changes lead to increased temperatures and atmospheric pollutants in urban areas, sea-level rises in coastal areas, diminished groundwater reserves, and urban flooding events.
Urban climate resilience refers to the ability of an urban system or parts of that system to absorb, adapt, and recover from the various stresses most often caused by hydrometeorological disaster events, strengthened by climate changes. The largest major cities have an elaborate program for urban climate resilience.
The greatest threat in the urban environment is the fight against more frequent heat waves, affecting the quality, economy, and sociology of city life. Urban heat resilience mainly coincides with monitoring and reducing UHIs. The components of urban heat resilience include heat contributors to climate change, heat impacts on the environment, infrastructure economy, and social life, and heat resilience strategies include heat mitigation and management [4,5].
UHIs form due to differences between cities and natural landscapes in terms of structure, materials, and geometry. Key factors include the following [6]:
  • Urban surfaces absorb more heat than natural ones and release this heat slowly, causing higher day and night temperatures.
  • Building materials with high heat capacities (asphalt and concrete) store and release solar heat, elevating nighttime temperatures.
  • The urban geometry (high buildings) traps heat, reduces wind flow, and creates “urban canyons” that block cooling and prevent pollution dissipation.
  • Anthropogenic heat from human activities (cars and air conditioning) generates waste heat that elevates local temperatures.
  • The urban greenhouse effect causes pollutants and water vapor to trap heat in cities.
  • The lower evapotranspiration in cities due to impervious surfaces reduces natural cooling through evaporation.
Different types of UHIs exist depending on the level at which they occur [7]: the surface level is ordinarily measured using satellites, while the air level is measured above the average roof height.
Urban areas have been fighting climate change for the last two decades and producing models from macro-, micro-, and building-scale climatology studies to reduce and mitigate the UHI effect. The most important factors in surface energy balance studies with thermal environment simulation are surface air, soil temperature, and the building’s height [8]. Studies are usually engaged in increasing the following:
  • Air flows—allowing for better ventilation through the streets and buildings;
  • Green and blue spaces—increasing vegetative and reducing impermeable cover;
  • The albedo effect—using lighter color materials that reflect solar radiation;
  • Decreasing energy consumption—helping to mitigate urban heat gains by using effective solar shading to reduce the need for artificial cooling.
Urban heat fluxes provide a framework for detecting and monitoring anthropogenic heat emissions. The urban energy budget (UEB) parameters quantify anthropogenic heat fluxes from vehicular emissions, building space heating and cooling, industrial processes, and human metabolic heat release. UEB studies are concerned with finding an energetic component or urban surface energy balance [9,10]: net all-wave radiation flux (Q*), the turbulent sensible heat flux (QH), latent heat flux (QE), and storage heat flux (ΔQS) are all included in the traditional surface energy balance, while anthropogenic heat flux (QF), advective heat flux (ΔQA = Qin − Qout), and S represent all other sources and sinks that can be controlled [11,12], as shown in Figure 1. Intensive industrial and commercial activity results in an anthropogenic heat flux, which varies in time and space as a significant component of the energy balance [13,14].
Various macro- and micro-urban climatology models have emerged in recent decades, addressing climatology and the UHI effect. The most widely used and user-friendly meso- and microclimate models are UrbClim [15], the ADMS Temperature and Humidity model, the advanced SkyHelios model, RayMan, ANSYS FLUENT, City FFD, ENVI-met, openFoam, Solene, SOLWEIG, TownScope, and UMEP [16,17]. Varying in complexity, these models are extensively utilized within the scientific community to simulate air temperature, radiation, and thermal comfort in urban areas [16,17].
ENVI-met V5.6 [18] is a high-resolution 3D modeling piece of software for simulating microclimatic processes and interactions between buildings, surfaces, plants, and the air. It integrates fluid dynamics, thermodynamics, and plant physiology to support urban planning, green infrastructure, and climate strategies. Unlike most models, it provides a holistic view of environmental interactions. ENVI-met is widely used in microclimate studies.
Urban Multi-Scale Environmental Predictor (UMEP) [19] is a Quantum GIS (QGIS)-based climate tool used to integrate models with urban climate analyses. It simulates heat and cold waves and monitors thermal comfort, energy use, and climate mitigation, using atmospheric, meteorological, and surface data from multiple sources. UMEP has a processing plugin architecture for outdoor thermal comfort (mean radiant temperature—SOLWEIG), urban energy balance (spatial variations in anthropogenic heat—LQF), anthropogenic heat (QF), urban energy and water balance (SUEWS), solar radiation (solar irradiance on building roofs and walls—solar energy on building envelopes (SEBE)), daily shadow patterns, urban heat islands (urban weather generator (UWG)), and urban wind fields (URock—semi-empirical model to estimate 3D wind fields).
ENVI-met and UMEP can be integrated with CAD/GIS software such as QGIS 3.40.4 ‘Bratislava’ to simulate, compare, and visualize climate indicators. They offer multi-level user support for seamless planning and design integration [20]. These models are the most commonly used in microclimate studies, with their main differences being that UMEP is free to use and ENVI-met is paid for.
Table 1 shows the basic characteristics of the most commonly used software for urban meso- and micro-climatology models (ENVI-met, Fluent, and UMEP) and plugin software that can be used independently or as plugins with other software (SOLENE for Fluent and SOLWEIG, Surface Urban Energy and Water Balance Scheme (SUEWS), World Urban Database and Access Portal Tools (WUDAPT), and Urban Water Generator (UWG) as UMAP plugins).
Most urban climate heat resilience studies deal with larger areas. However, recently, a need to display more detailed urban energy balances for smaller areas has arisen. The main goal of this study is to suggest a basis upon which to study urban energy balance, and for that purpose, two micro- and two building-scale models are proposed and presented in the city of Split. These models can answer scientific questions regarding climate thermal comfort and energy balance modeling and simulations.

2. Materials and Methods

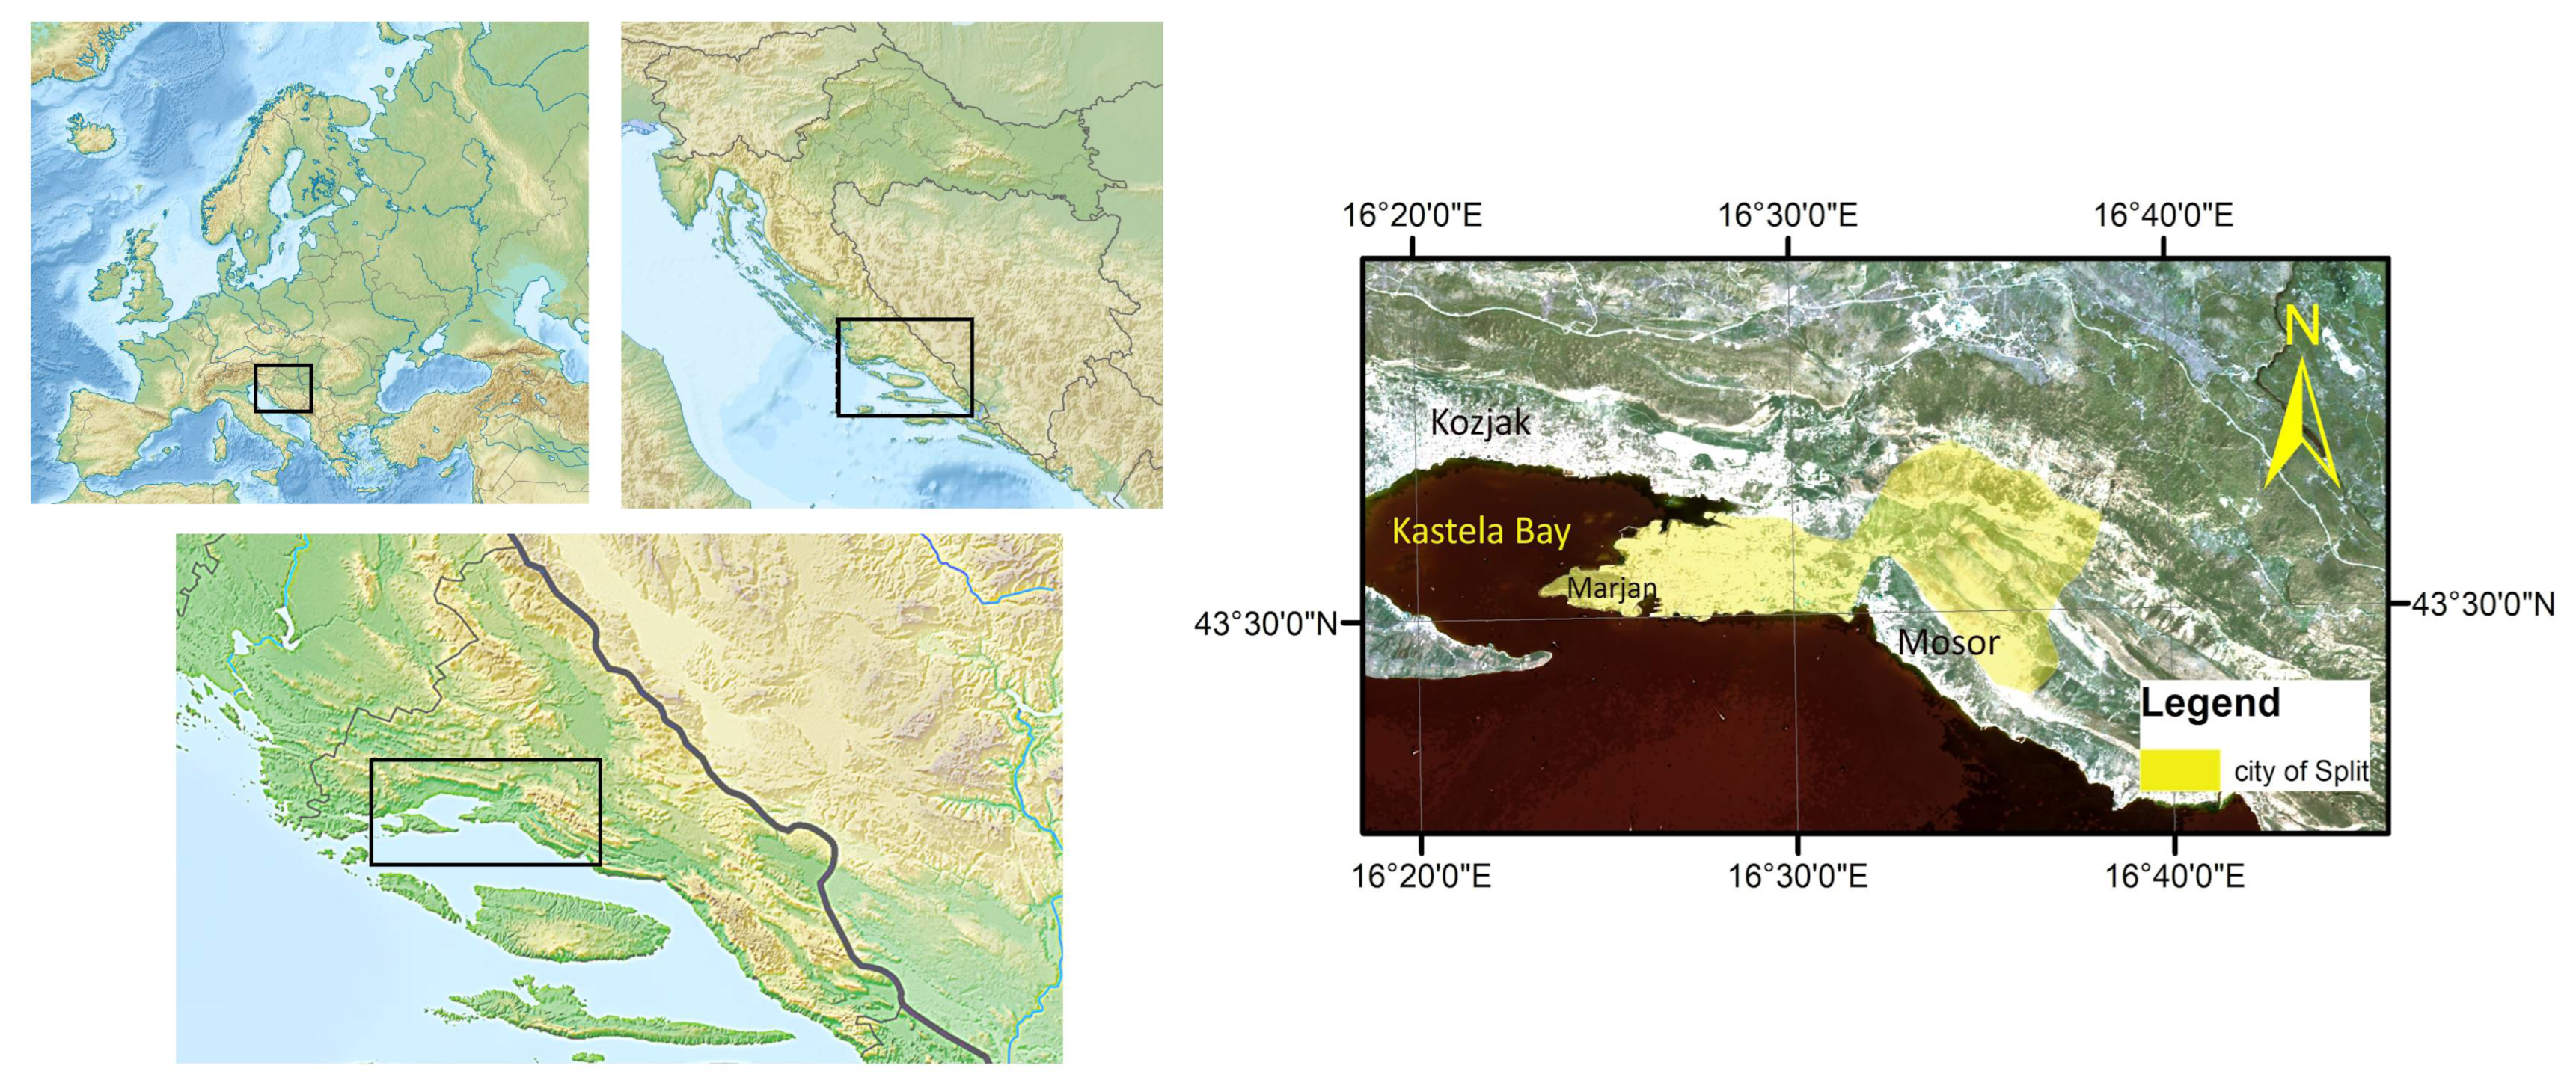
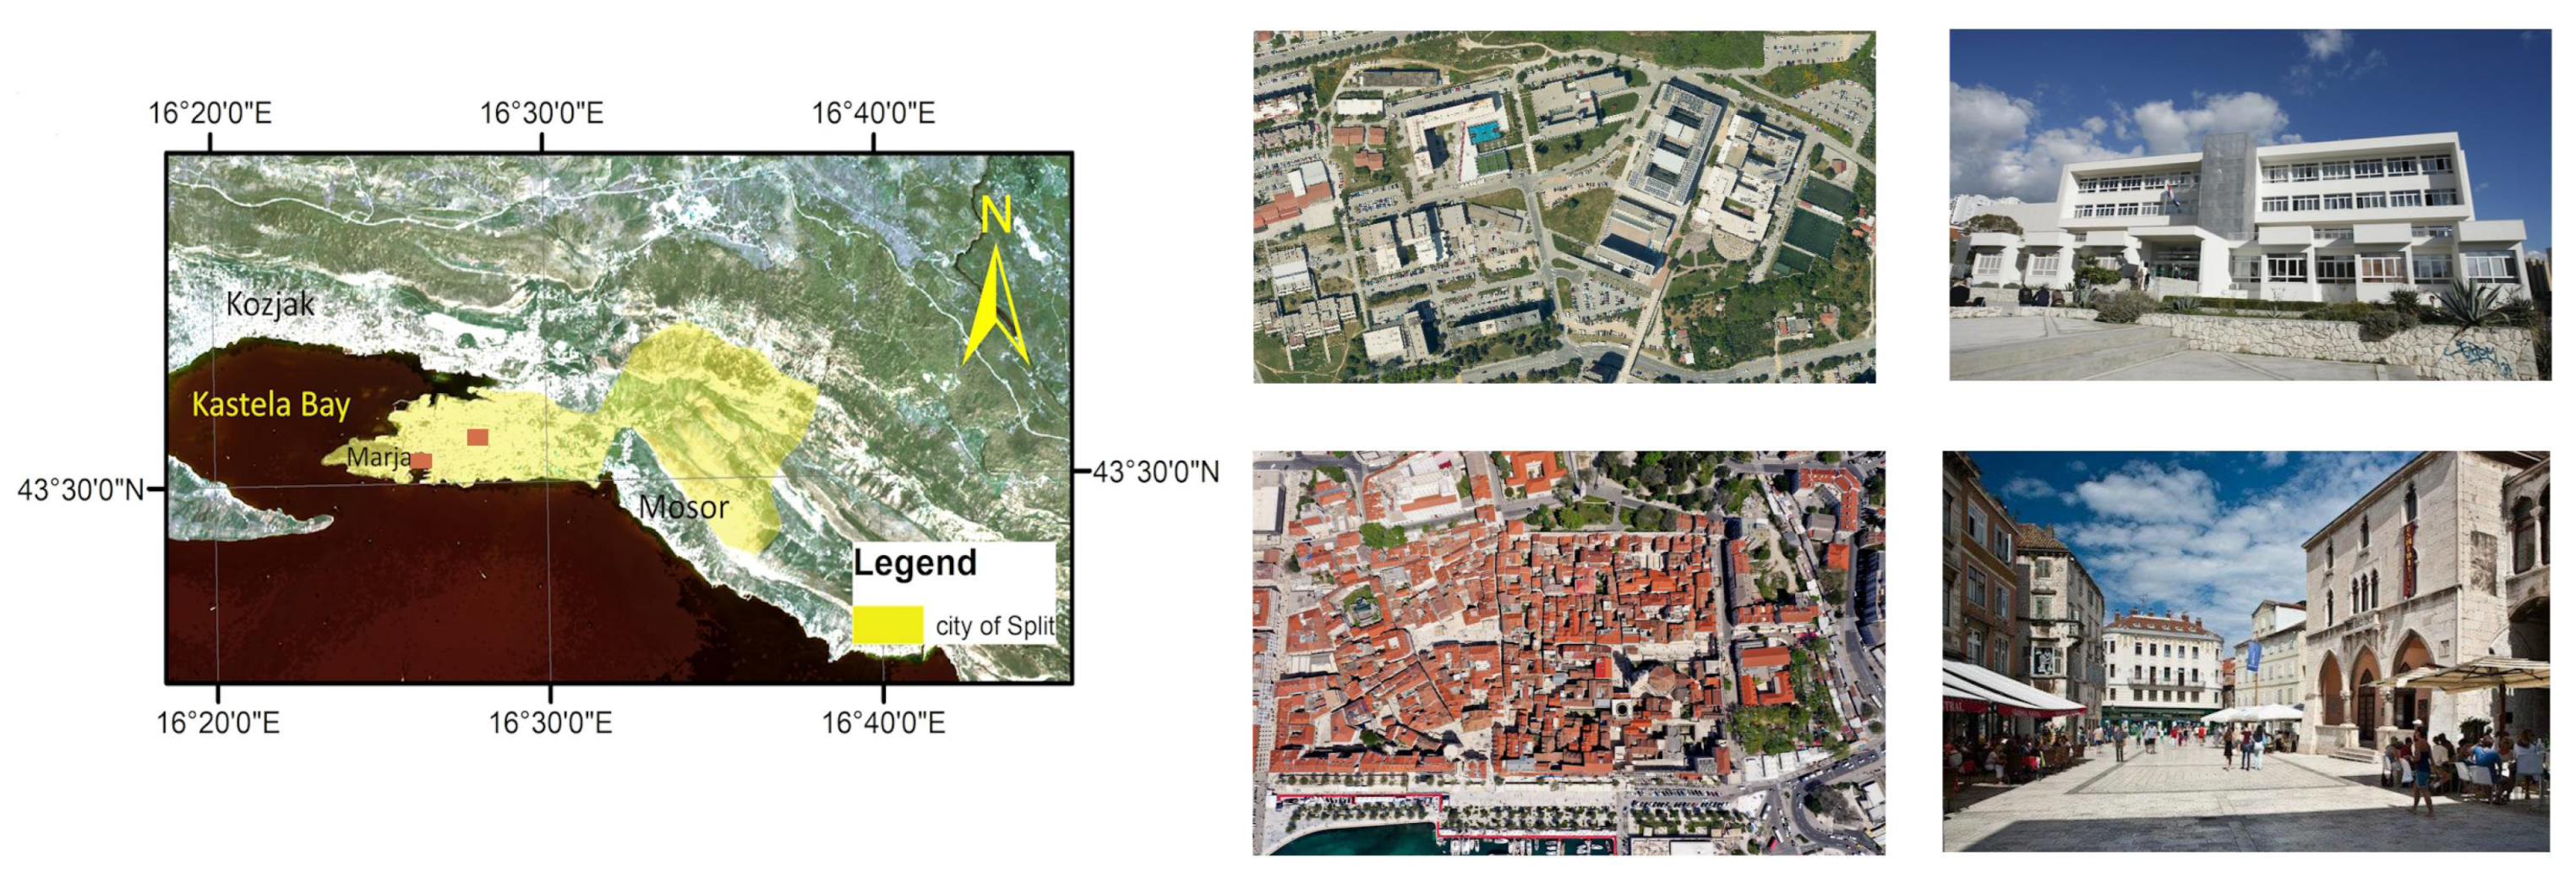
2.1. Study Area—City of Split (Old City Center and Campus Area)

The second largest Croatian city, Split, is the economic, administrative, and transport center of the coastal part of Croatia. Split is a tourist hub in the eastern part of the Adriatic Sea, with 1 million visitors per year. The Split urban city area shown in Figure 2 (yellow area; right) occupies approximately 22 km2, while the suburban area occupies 80 km2.
Split is located on a peninsula bordered on the east and south by the Kaštela Bay and Marjan Hill (178 m). To the north, the Kozjak (779 m) and Mosor (1339 m) mountain ridges represent natural barriers, shielding the city from the bora (a strong northeast wind) and separating it from the hinterland (Figure 2).
The Split urban city area is approximately 22 km2 in size, and its suburban communities occupy four times that surface area, at 80 km2.
The last two population censuses in Split revealed a decline in the city’s population, with a decrease of approximately 5% in the penultimate census and a more pronounced decline of about 10% in the most recent census. In contrast, the Split agglomeration has experienced a steady, modest population increase. According to the 2021 census, Split recorded a population of 160,577, comprising 59,947 households and 77,309 apartment units. These data indicate the presence of at least 17,362 vacant housing units, accounting for nearly one-quarter of the total units [29]. Many of these units are utilized as tourist accommodation and are occupied seasonally, while approximately 10% remain entirely unused. The city’s geographical constraints and limited space for urban expansion present significant challenges. Approximately 700 new residential units are constructed annually, affecting green space reduction and contributing to the formation of an urban heat island (UHI) zone.
The population density of Split stands at 2244 people/km2, rising to 7499 people/km2 in the city center [30]. Economically, Split has grown by approximately 6% in recent years, making it one of the fastest-growing economies in Croatia, particularly in the tourism sector. In recent years, the number of tourist visits has doubled compared with the population. This rapid economic growth has also contributed to changes in the urban area’s climate.

2.1.1. The Climate in the City of Split

Split is classified as having a Mediterranean climate (Csa) according to the Köppen climate classification. This climate is defined by warm, moderately dry summers, with average air temperatures ranging from 21.5 °C to 25.9 °C, and mild, wet winters, with average air temperatures between 7.9 °C and 10.7 °C. The mean annual air temperature is 16.3 °C, and the city receives an average annual precipitation of over 780 mm. The coldest month is January, with an average temperature of 7.9 °C, while the warmest month is July, with an average temperature of 25.9 °C. July is also the driest month, receiving approximately 26 mm of precipitation. Conversely, November is the wettest month, with nearly 113 mm of rainfall distributed over 12 rainy days (Figure 3).
Figure 3 presents data collected at the meteorological station located on Marjan Hill in Split, positioned at latitude 43.50° N, longitude 16.42° E, and an elevation of 122 m. The dataset includes measurements of air and sea temperatures, precipitation, average wind speed, average sunlight hours, day length, frost days, and relative humidity. The lowest recorded temperature at this station was −9 °C, measured on 23 January 1963, while the highest temperature of 38.6 °C was recorded on 5 July 1950. On average, the station records precipitation on 122 days annually [31].
Split receives more than 2600 sunshine hours annually. July is the hottest month, with an average high temperature of around 30 °C. The dominant winds in the winter are the bora and sirocco, blowing with a frequency of 35 to 55% per year [20], while maestral is the dominant wind in the summer period. The Adriatic Sea is a natural water reservoir, with a sea temperature ranging from 10 to 26 °C, and is also the most important climate regulator in the wider area [32].

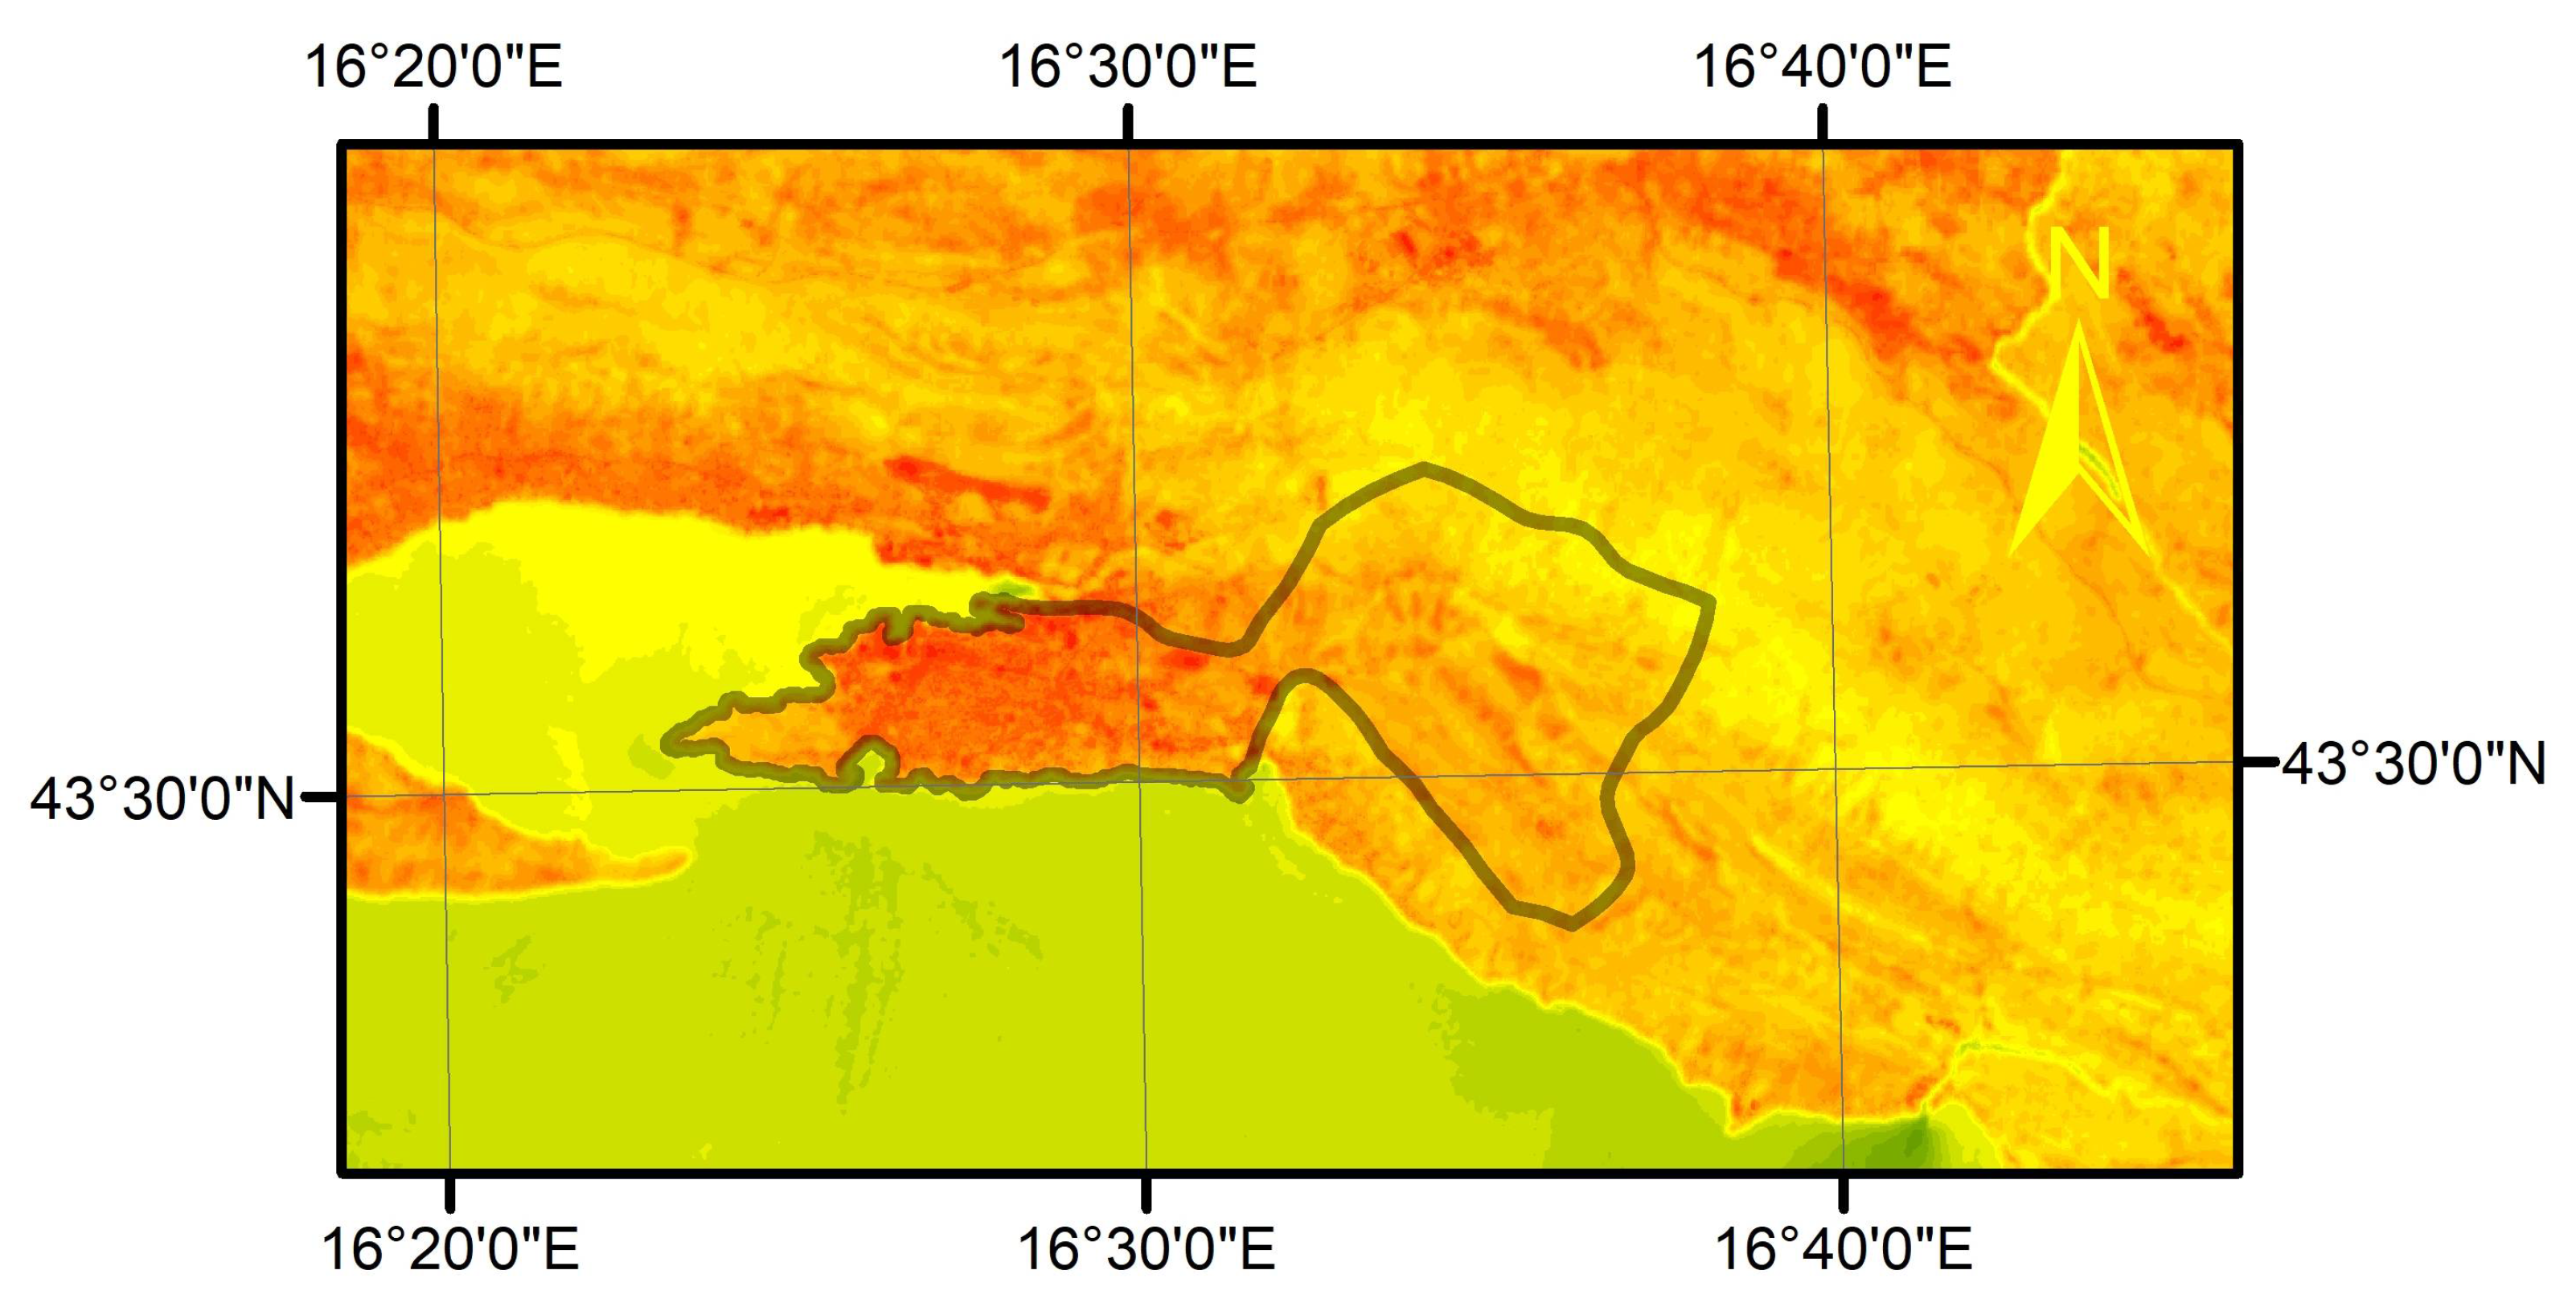
2.1.2. The Land Surface Temperature of the City of Split and Its Urban Heat Island Effect

The land surface temperature (LST) map shows warmer areas or UHI areas in the northern part of the Split peninsula, where the industrial zone and shipyards are located (Figure 4). Slightly warmer areas are situated in the densely populated city center, where the buildings are not very high but are quite dense and the streets are narrow. Equally, the coastal zone, especially in the south of the city peninsula, is somewhat colder than other areas due to the natural cooling created by the difference in temperature between the land and the water. The area within the university campus does not have tall buildings, and the buildings are not densely distributed [29,33]. This area also has abundant greenery, so heat islands are not created.
This study took two areas as examples: the old city center and the university campus area. The old city center is an example of a zone that is a potential source of high summer temperatures due to the dense construction and lack of air circulation, and the university campus has moderate-height buildings at optimal distances and plenty of green areas that do not allow for the formation of UHIs.

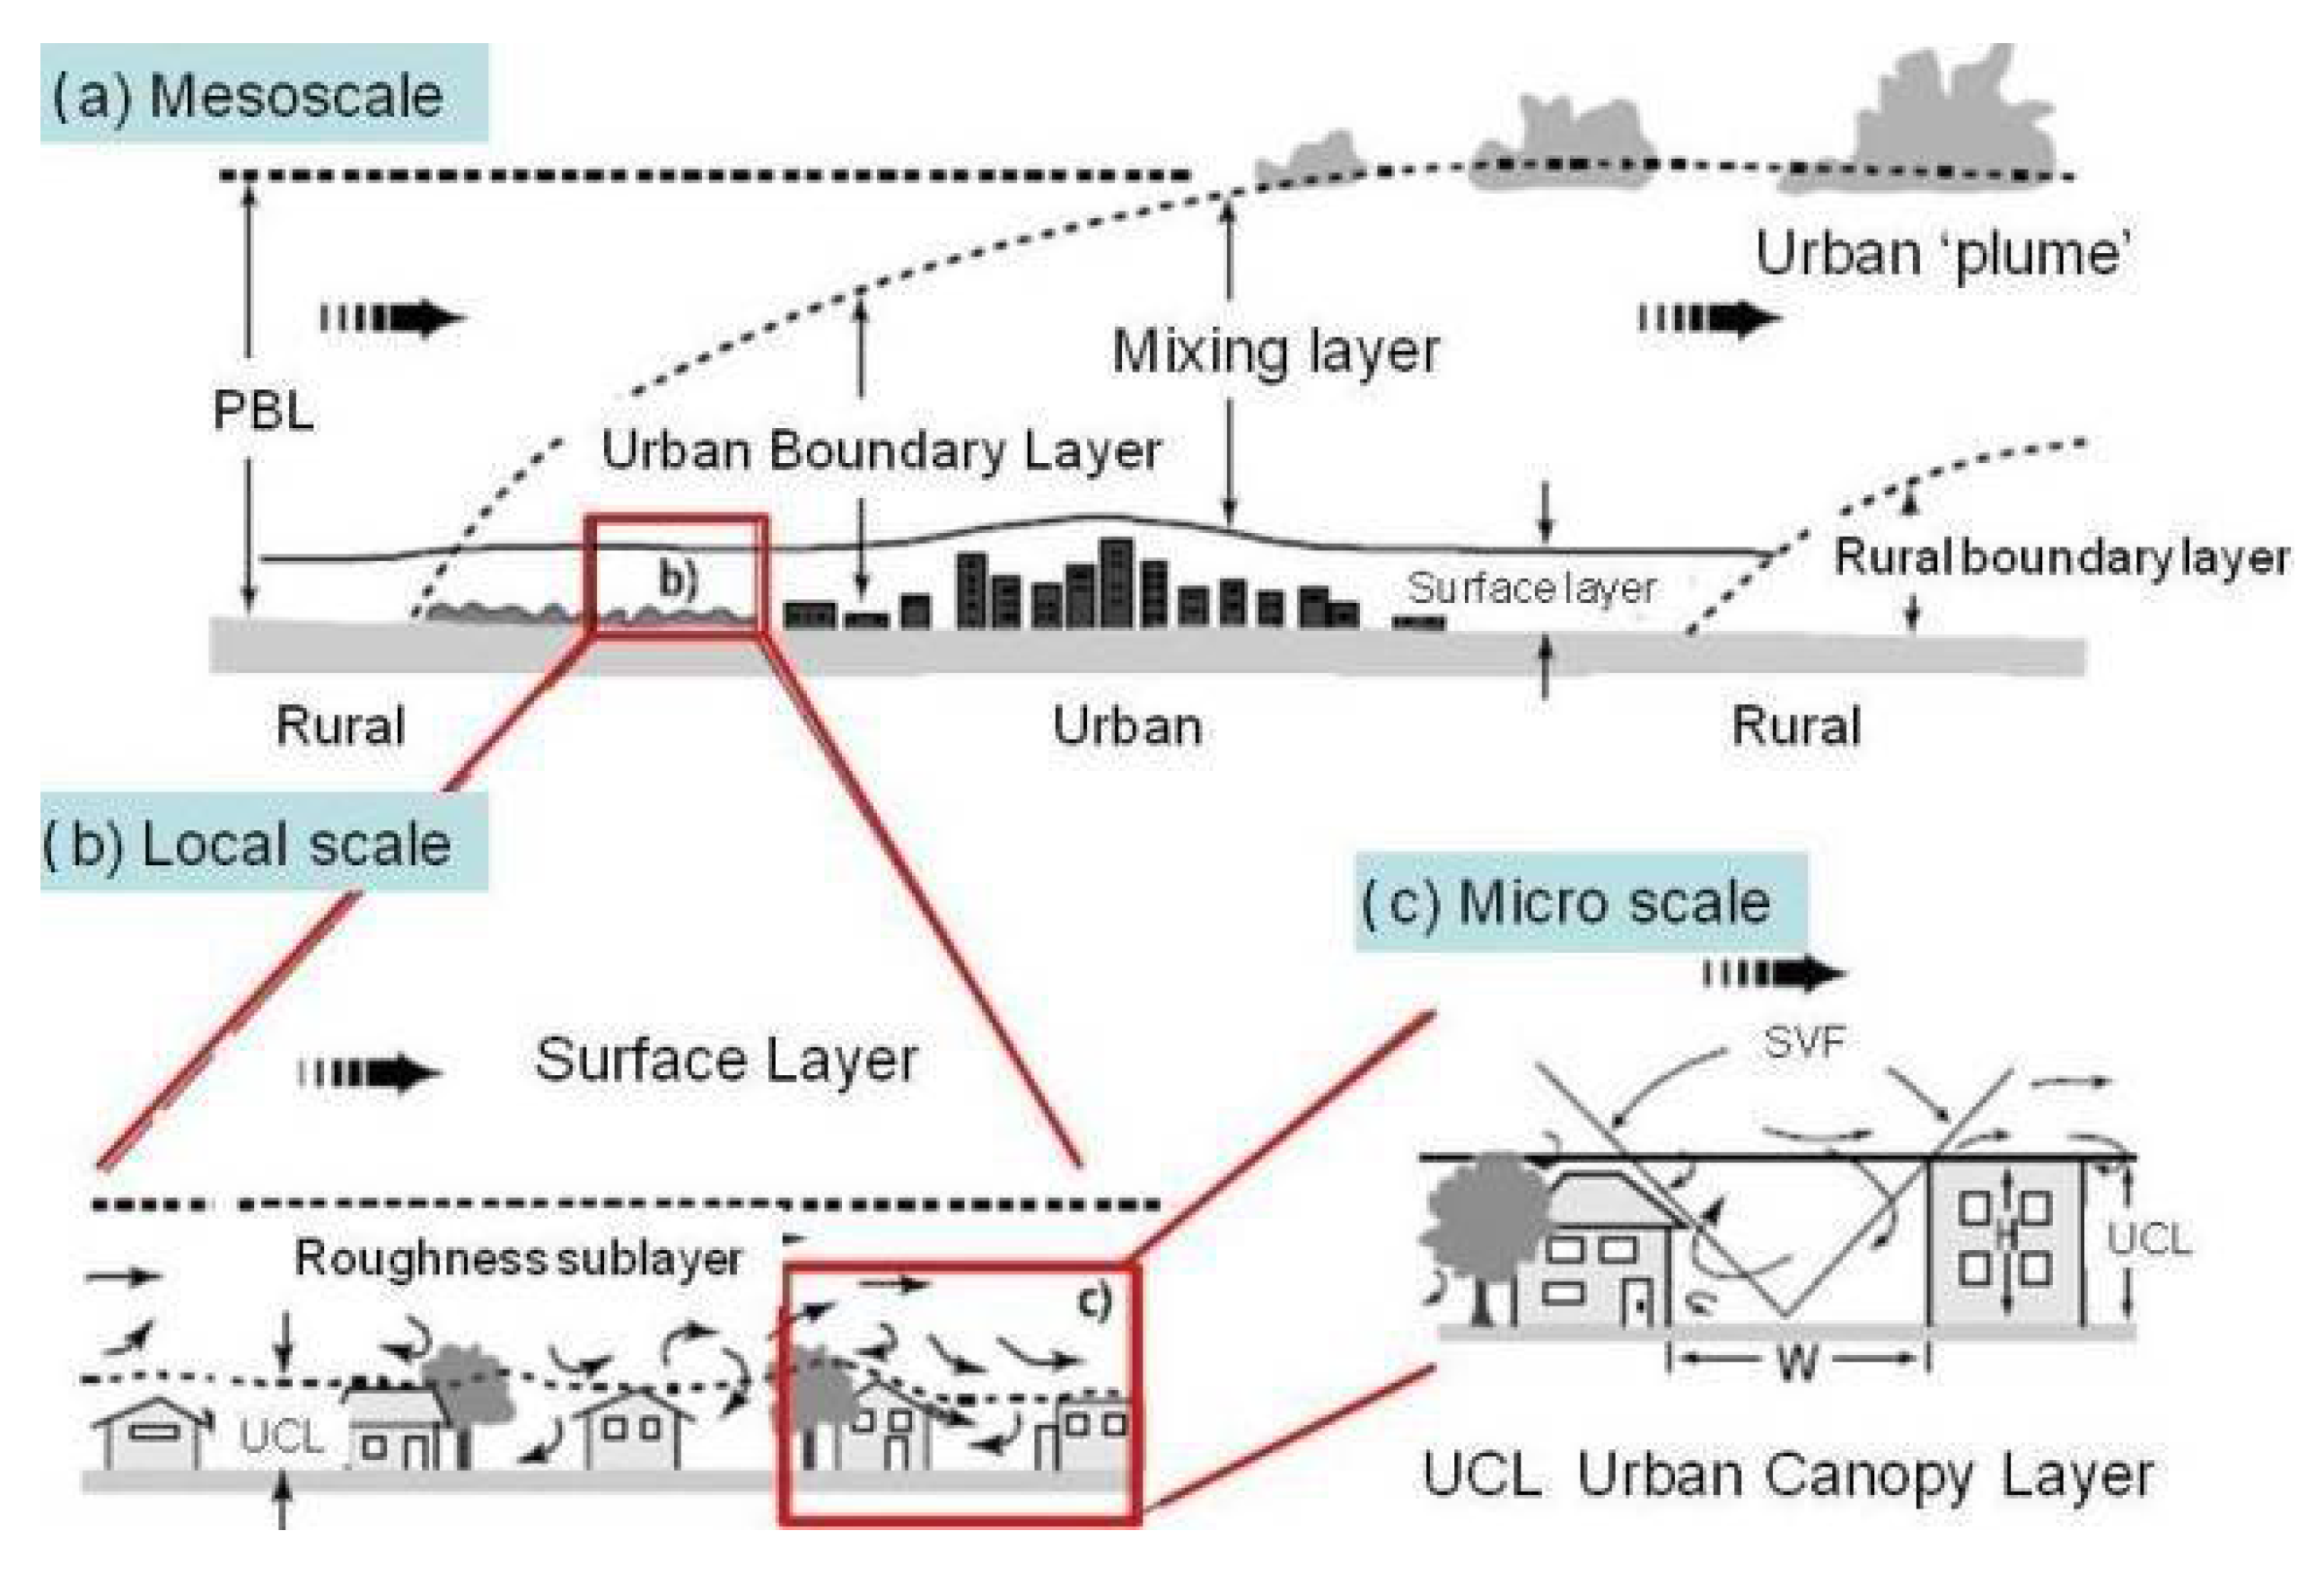
2.2. Multiscale Urban Climate Classification Model

Climate resilience includes climate, urban energy, and water budget management on the global, meso- (regional; >100 km), local (city; 10–100 km), micro- (neighborhood; 1–10 km), and building (parcel 10–100 m) scales (Table 2). GIS or building information modeling (BIM) and GIS integration mostly obtain spatial models as a framework [34]. The larger scales, such as the microscale and especially the building scale, demand the highest levels of detail for modeling (Figure 5) and require detailed and exact 3D spatial data models. Today, spatial data for building-scale models or thermal building resilience models are mainly collected via terrestrial laser scanning (TLS) and BIM, as these techniques can achieve the highest levels of detail (LODs).
According to the WUADAPT classification of urban climate scales, the urban microclimate is a climatic indicator that can provide details about a city within an area that spans 1 km horizontally and 120 m vertically [9,34] (Figure 5).
Most authors have tried to solve UHIs at the regional meso-, local, and microscales. Frequent heat wave episodes during the summer impose a need for modeling at the micro- or neighborhood scale and even at the building scale (Figure 6), and thus the need for more detailed spatial data arises.
In urban climatology, the Ventilation Corridor Planning (VCP) model contains two scales: the urban boundary layer (UBL) at the mesoscale and the urban canopy layer (UCL) at the local scale [35] (Figure 6). The UBL spans from a city’s rooftops to the middle of cumulus clouds [36], and it is ideal for evaluating urban wind environments, ventilation potential, and heat island intensity, aiding in defining urban wind corridors. Below the UBL, the UCL extends to average roof height, where wind channels form along streets. Techniques such as computational fluid dynamics (CFD) simulation assess the differences in wind flow within the UCL [36], particularly between current and planned VCPs. Factors such as building height, density, shape, street orientation, greenery, and spatial layout influence these analyses [37].
Figure 6. Hierarchical diagrams of the different scales of urban climatology [37].
Climate 13 00079 g006
Planning and design practices operate within a multi-layered hierarchical governance system, ranging from the global to the parcel scales, involving various factors such as governments, land developers, planners, and citizens. The complexity of planning systems complicates the pursuit of unified climate policies across urban areas. At each scale, different policies and decisions impact urban environments (Figure 5 and Figure 6; Table 2):
  • Global/Earth scale: United Nations Framework Convention on Climate Change (UNFCCC) climate-related actions, such as limiting greenhouse gas emissions;
  • Meso/regional scales: policies that enforce air quality standards;
  • Local/city scale: policies about extreme events such as heat waves and floods;
  • Micro/neighborhood scale: decisions about green spaces that affect the local climate;
  • Parcel/building scale: microscale climate management through landscaping and building insulation.
Table 2. Urban form scales based on surface characteristics, modified according to [35,36].
ScaleUrban FormHorizontal LengthVertical Extent *
Parcel/buildingBuildings10–100 mUCL
Micro/neighborhoodBlock, street, canyon1–10 kmUCL
Local/cityUrban area10–100 kmRSL, ISL
Meso/regionalRegion (urban and surroundings)>100 kmUBL, PBL
* UCL, urban canopy layer; RSL, roughness sublayer; ISL, inertial sublayer; UBL, urban boundary layer; PBL, planetary boundary layer.
Urbanization can drastically change spatial forms, causing LOD problems in urban climate environments. Heat islands have raised city temperatures, and air pollution near buildings remains a major concern. Scientists have studied the impacts of urban blocks on temperature, pollution, and ventilation. Urban climate heat resilience studies highlighted the need for a new reference dataset at the micro- and building or parcel scales [2,38]. UHI elimination models require integrating detailed spatial and meteorological data, including wind and lower atmospheric microcirculation. Micro-level spatial data require high completeness, as found in building information models or digital representations of buildings and infrastructure.
The correctness and completeness of the specific building element data in a building information model are measured based on the level of detail or development (LOD 0, 1, 2, and 3; Figure 7). The concept of LOD in OGS CityGML 2.0 specifications as defined in multiscale 3D city models indicates the amount of detail in the building’s geometry [39].
UHI elimination is achieved by planning green roads and roofs or by planning water surfaces, thus affecting the microclimate (especially the elimination of urban canyons and urban floods and the modeling of natural ventilation) and improving the quality of a living space [40].

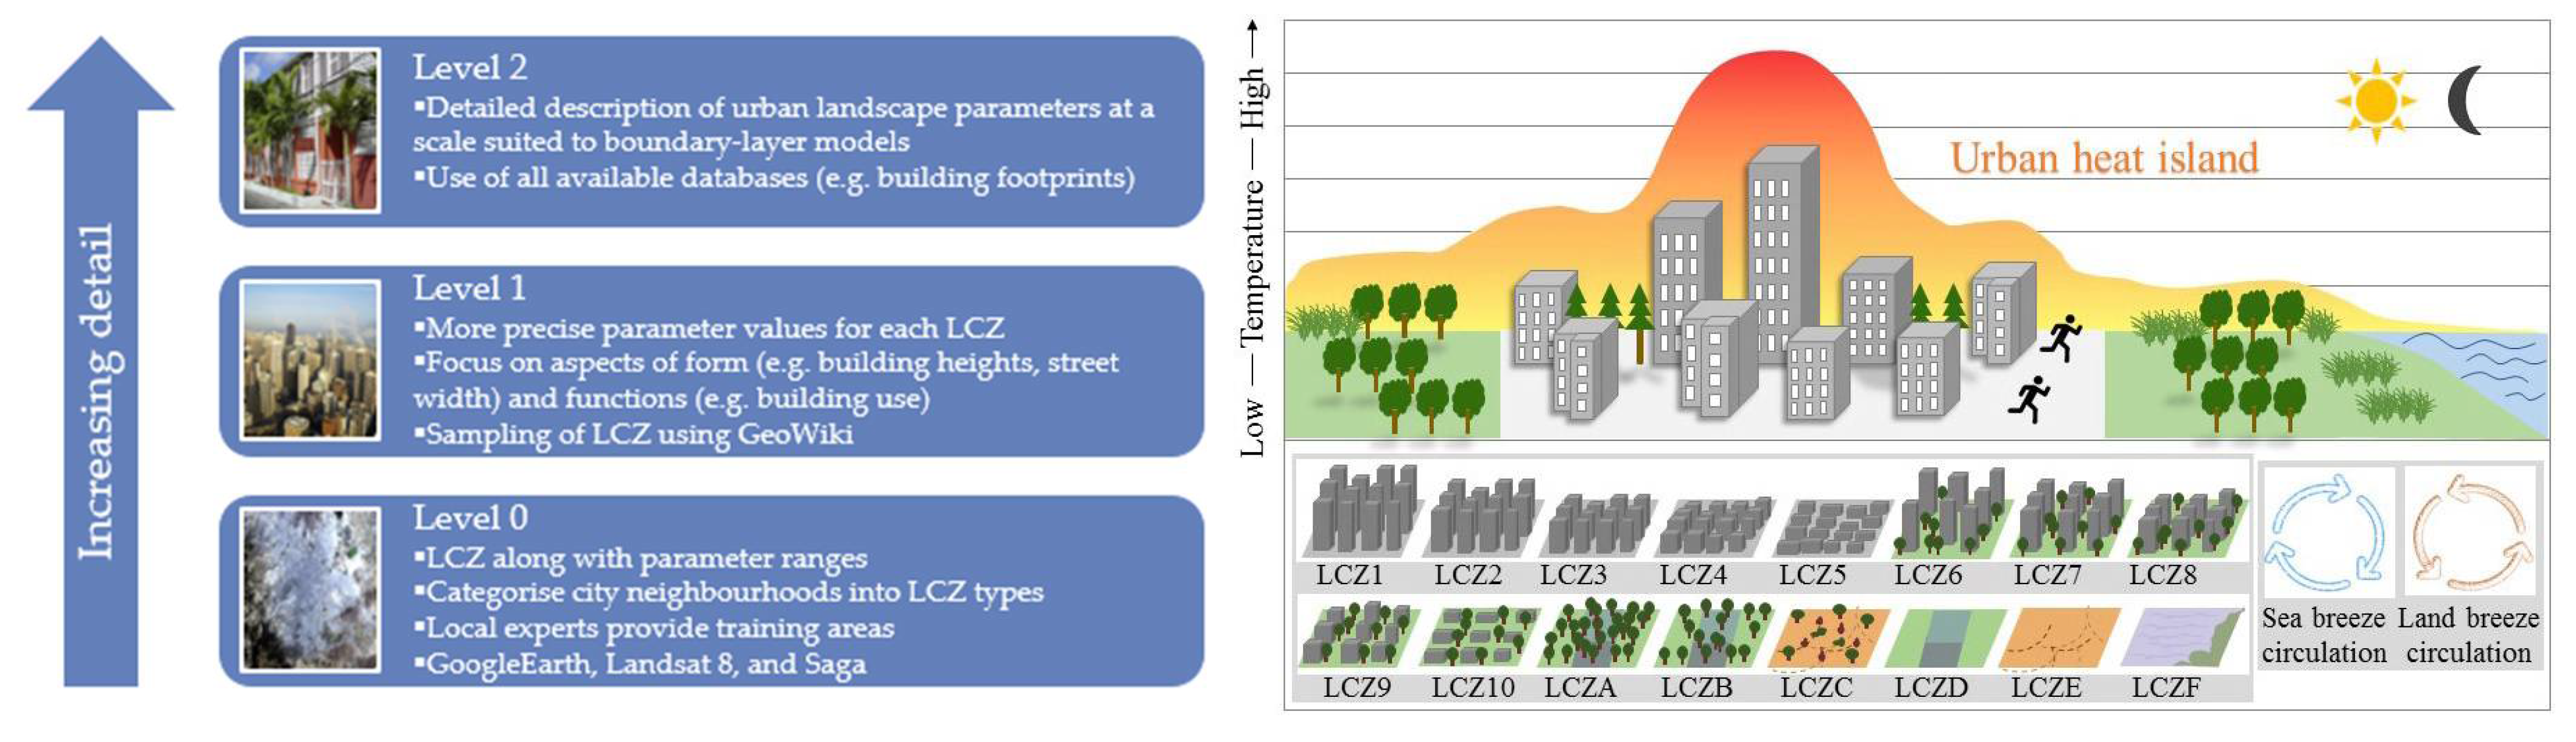
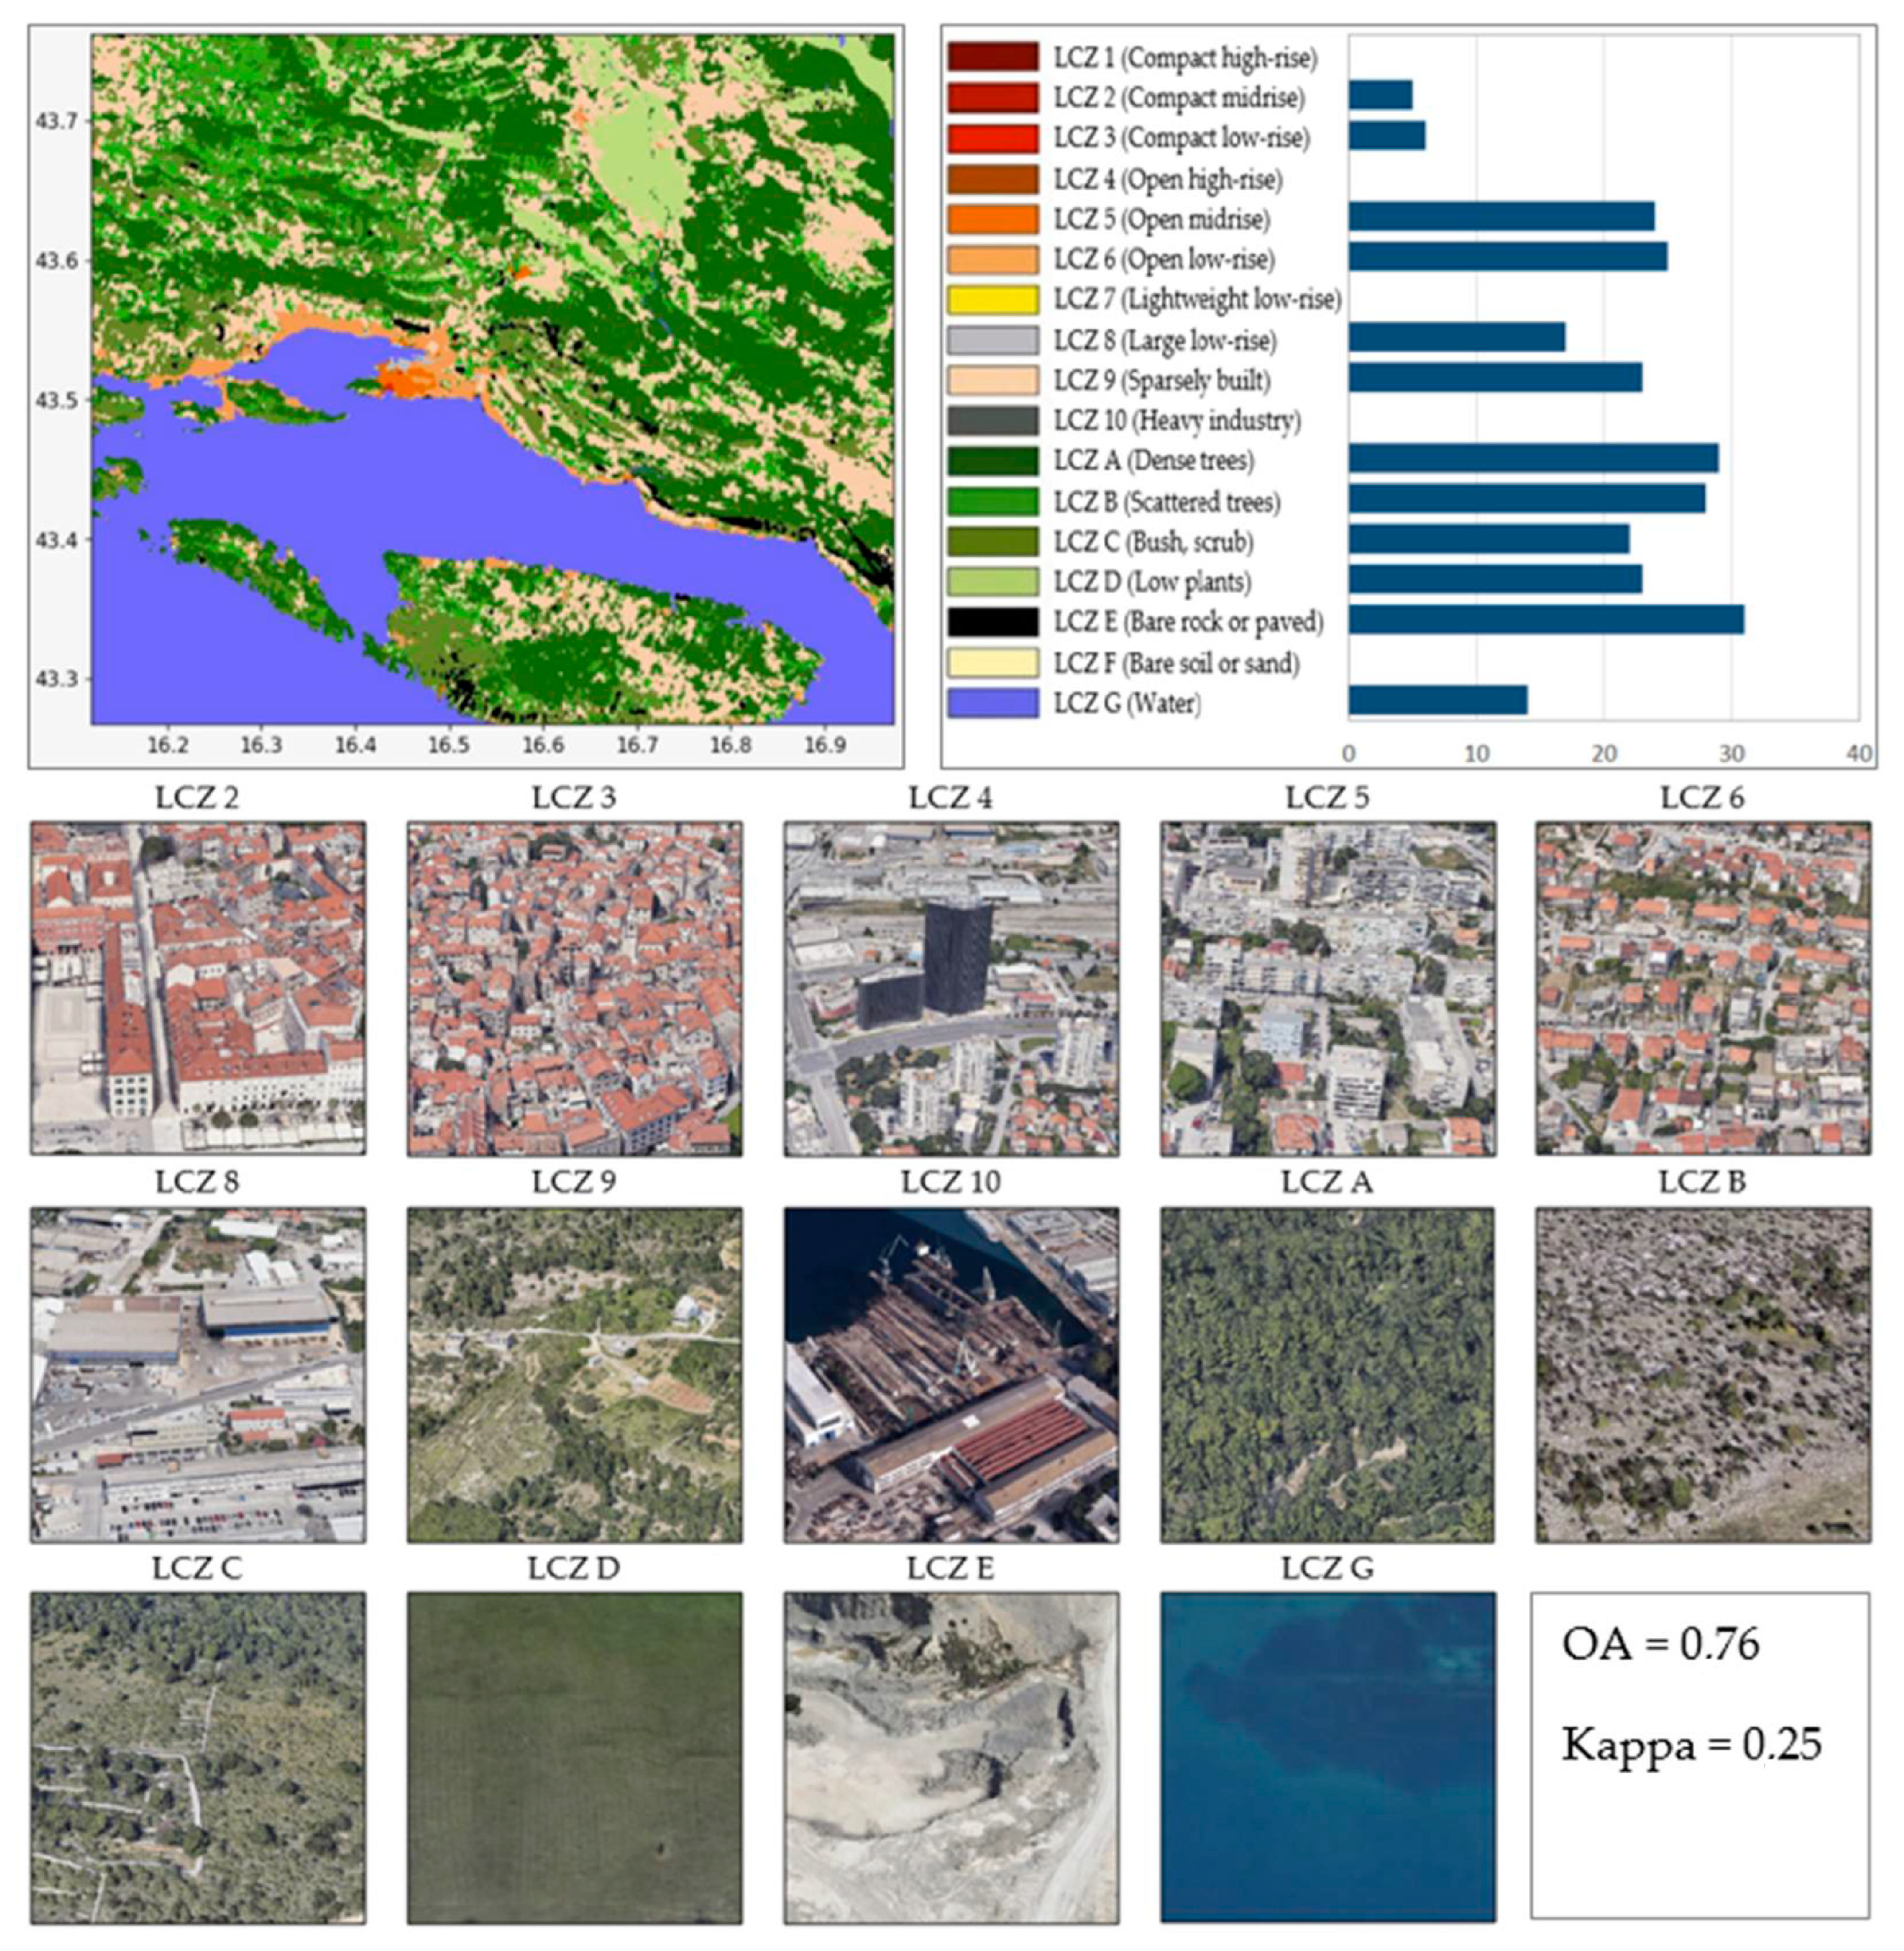
Local Climate Zone (LCZ) Classification Method

The concept of a local climate zone (LCZ) or urban climate zone classification method was proposed in 2009 by Oke and Stewart [37,41] (Figure 8) to represent the influence of urban geomorphology on the thermal properties of an area. It outlines local climate zones and how urban construction variations affect land surface temperature (LST) [42]. The method is widely used in urban thermal studies [43,44] and categorizes surface types based on 10 influencing parameters, such as building density, reflectivity, sky view, and roughness.
The Surface Urban Energy and Water Balance Scheme (SUEWS) [45] is part of the UMEP model that simulates spatial (and temporal) variations in energy exchanges using the LCZ classification method derived within the World Urban Database and Access Portal Tools (WUDAPT) project [46]. This classification method identifies seven types of natural cover—ranging from dense forest, sparse forest, bushes, and low vegetation to bare rocky and earthy soil and water (types A to G)—as well as ten types of built-up land, categorized as densely built high-, medium-, and low-rise buildings; medium densely built high-, medium-, and low-rise buildings with moderate greenery; densely and sparsely built low-rise buildings; extremely sparse construction; and industrial areas (types 1 to 10; Figure 8, right). The boundaries of local climate zones (LCZs) are often delineated using satellite or aerial imagery. The LCZ Generator, developed within the WUDAPT project [27], facilitates the creation of LCZ maps.
Figure 8. Three levels of the local climate zoning (LCZ) classification method [41,46].
Climate 13 00079 g008
In developing countries, LCZ Level 0 is mostly applied when data availability and government policies are limited, whereas developed countries typically utilize more detailed models, such as LCZ Level 1 (detailed) and LCZ Level 2 (very detailed) [47,48]. SAGA GIS [49] uses selected training areas to classify pixels automatically through a random forest classification algorithm [50].

2.3. BIM and GIS Integration as a Spatial Basis for Climate Modeling at the Building Level

The integration of BIM and GIS technology requires considering both the architecture and environment [51]. GIS provides macro-level environmental views, while BIM details buildings at the micro-level, together enhancing AEC practices [52,53]. BIM–GIS integration enhances project analysis and decision-making, aiding microclimate studies and UHI mitigation through precise micro-location modeling, such as ventilation corridors [54,55]. Optimizing BIM, CAD, and GIS data flow is therefore crucial for thermal assessments, urban data management, and construction monitoring.

3. Results

We conducted this study on two illustrative examples or study areas at the local (city of Split), micro- (University of Split campus area and city of Split old city center), and building (Faculty of Civil Engineering, Architecture, and Geodesy, University of Split, and the old town hall in the Split National Square) scales (Figure 9).

3.1. City of Split Urban Climate Modeling at the Local Scale

In this study, the LCZ of the wider area of the city of Split was classified using Google Earth [56], resulting in the generation of vector *.kml classification data (Figure 10). The LCZ model for the wider Split area, estimated following the methodology described in [45], is presented in Figure 8.
In Figure 11, the map in the upper left corner depicts the classification of the city of Split based on its local climate zones. Each zone represents different types of land cover and built-up areas. This map was created using the WUDAPT LCZ Generator [27]. The accompanying graph illustrates the distribution of individual local climate zones within the city. Below the map are thumbnails showcasing examples of different LCZs within the city of Split. Additionally, the Kappa coefficient was calculated.
The Kappa coefficient is a statistic used to measure the reliability of agreement between raters for categorical items [57]. To calculate the Kappa coefficient, we used the following formula [58]:
K a p p a = O A O A u 1 O A u
where O A is the observed agreement ( O A = 0.76 ) and O A u is the expected level of agreement based on chance ( O A u = 0.68 ).
The Kappa coefficient is 0.25, indicating a fair level of agreement beyond chance.

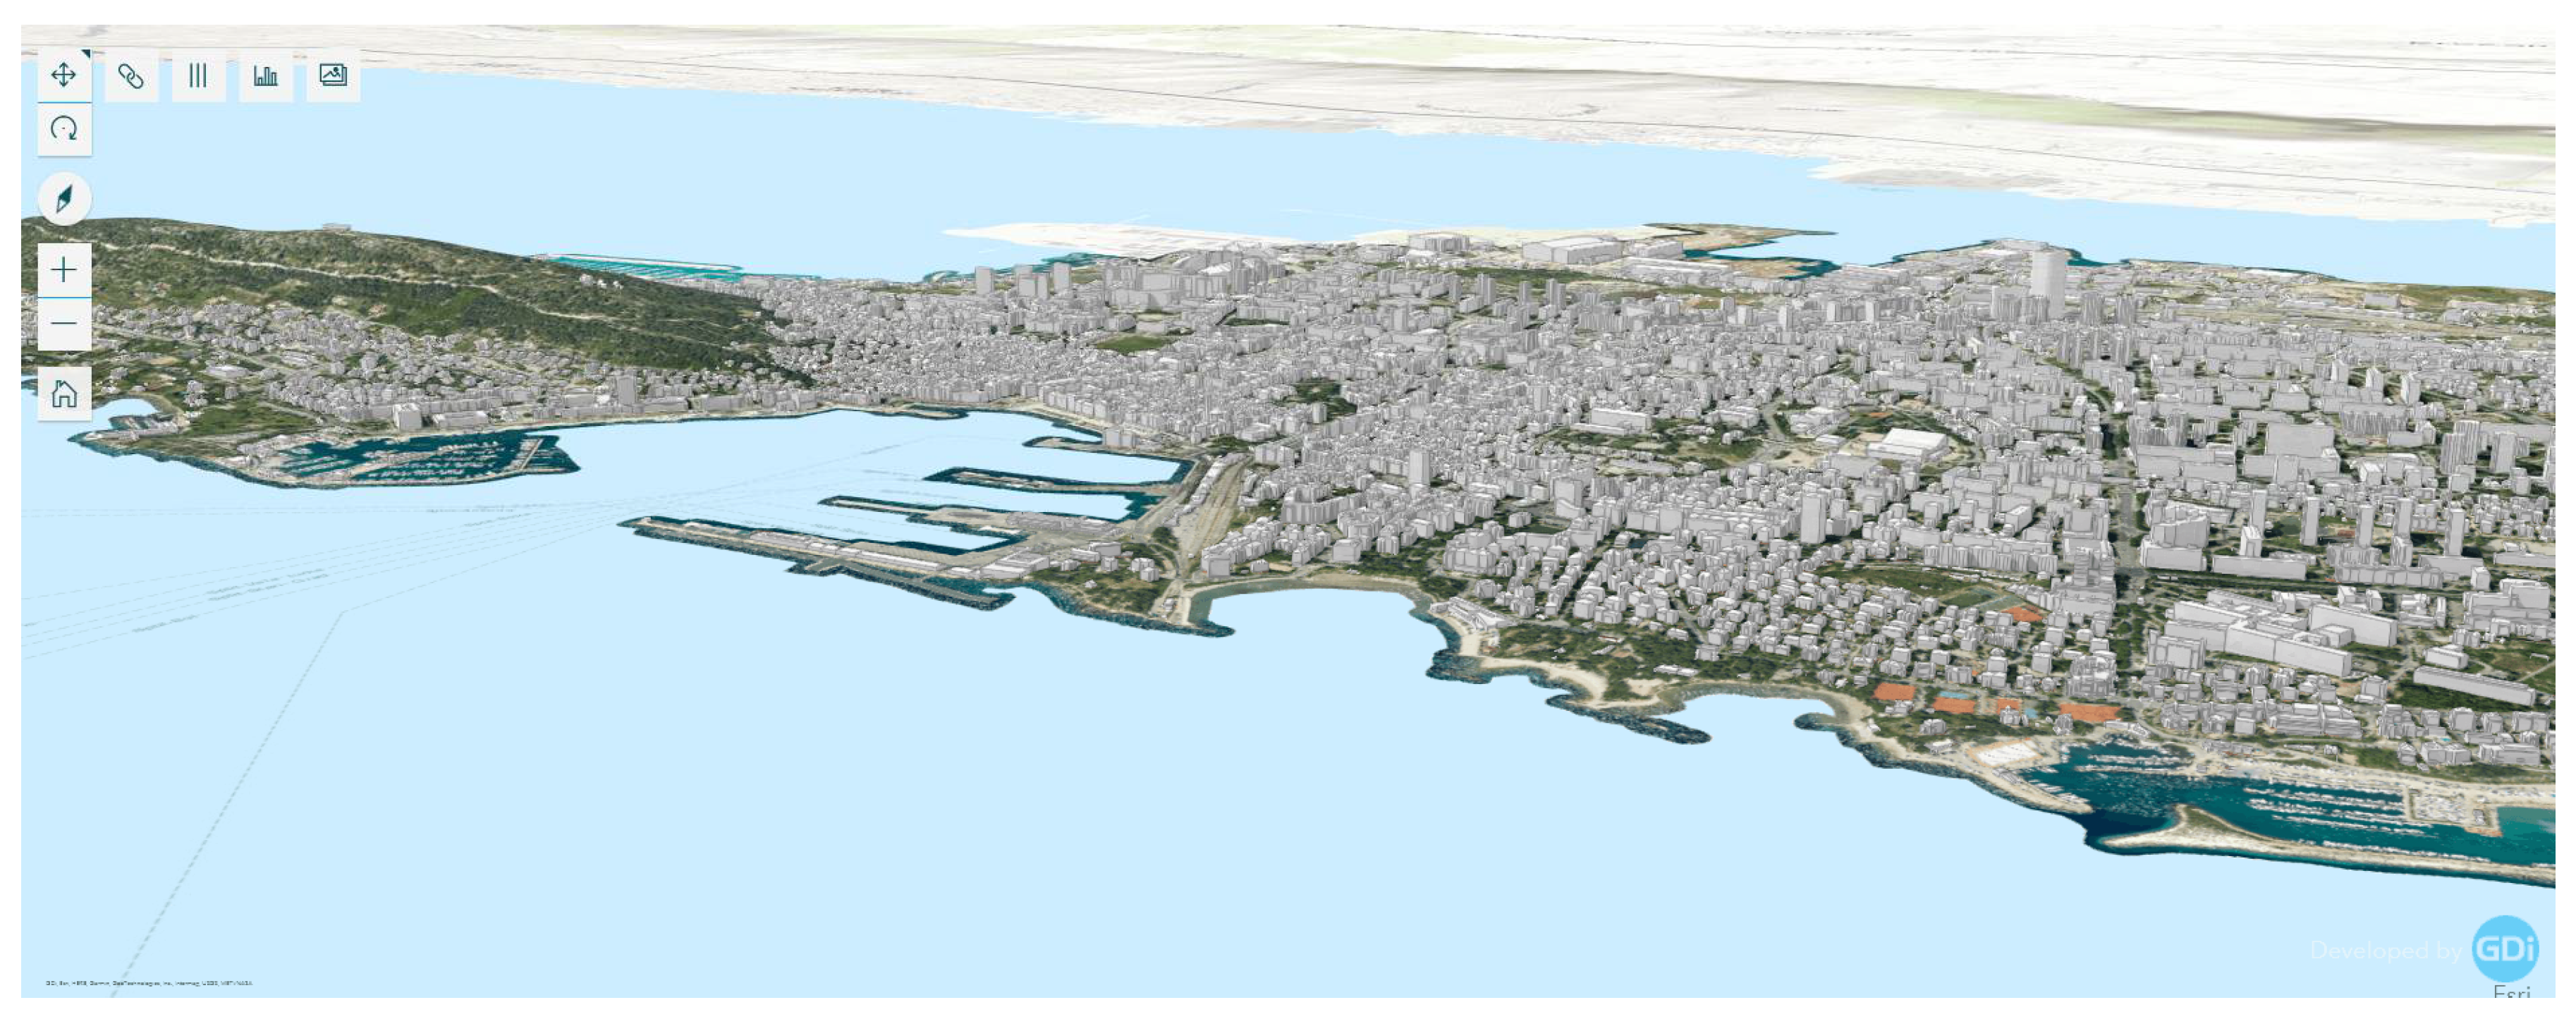
3.2. City of Split Urban Climate Modeling at the Microscale

LOD 2 is suitable for urban climate microscale modeling, while for smaller scales, i.e., at the building scale, we use the LOD 3 model. Most metropolitan areas prepare 3D LOD 2 models to obtain modeling data for optimizing city planning and management applications [59].
The city of Split, likewise, in cooperation with the company GDi d.o.o., developed the GIS Portal of the City of Split, a public internet geoinformation portal. The GIS model consists of spatial planning documentation data, cadastral parcels, green cadaster, building codes, communal infrastructure and installations, and an overview of public buildings and real estate. This model allows for various spatial data [60] that can be utilized for microclimate studies to be downloaded and connects them to local climate zones. One of the layers on this portal is the ST3D 3D model of the city of Split with LOD 2 object presentation. By integrating these data with local climate zone classifications and using microclimate modeling tools, researchers can produce detailed maps, simulate scenarios, and monitor environmental conditions to improve urban planning and climate resilience at the local or city scale [15,38,61,62,63,64].
Figure 12, Figure 13 and Figure 14 present a 3D LOD 2 object view from the GIS Portal of the City of Split. Part of the 3D GIS model from the Grad Split Hub is shown in Figure 12.
Figure 13 provides a more detailed 3D LOD 2 view of the University of Split campus area, which is not densely built and has a large percentage of greenery. In contrast, Figure 14 displays a part of the old city center more closely, which is very densely built and has almost no greenery. All data can be easily downloaded and used for free as a useful tool for strategic planning, decision-making, and spatial improvements to cities. The data will also be updated once a year, which makes them more easily manipulatable.

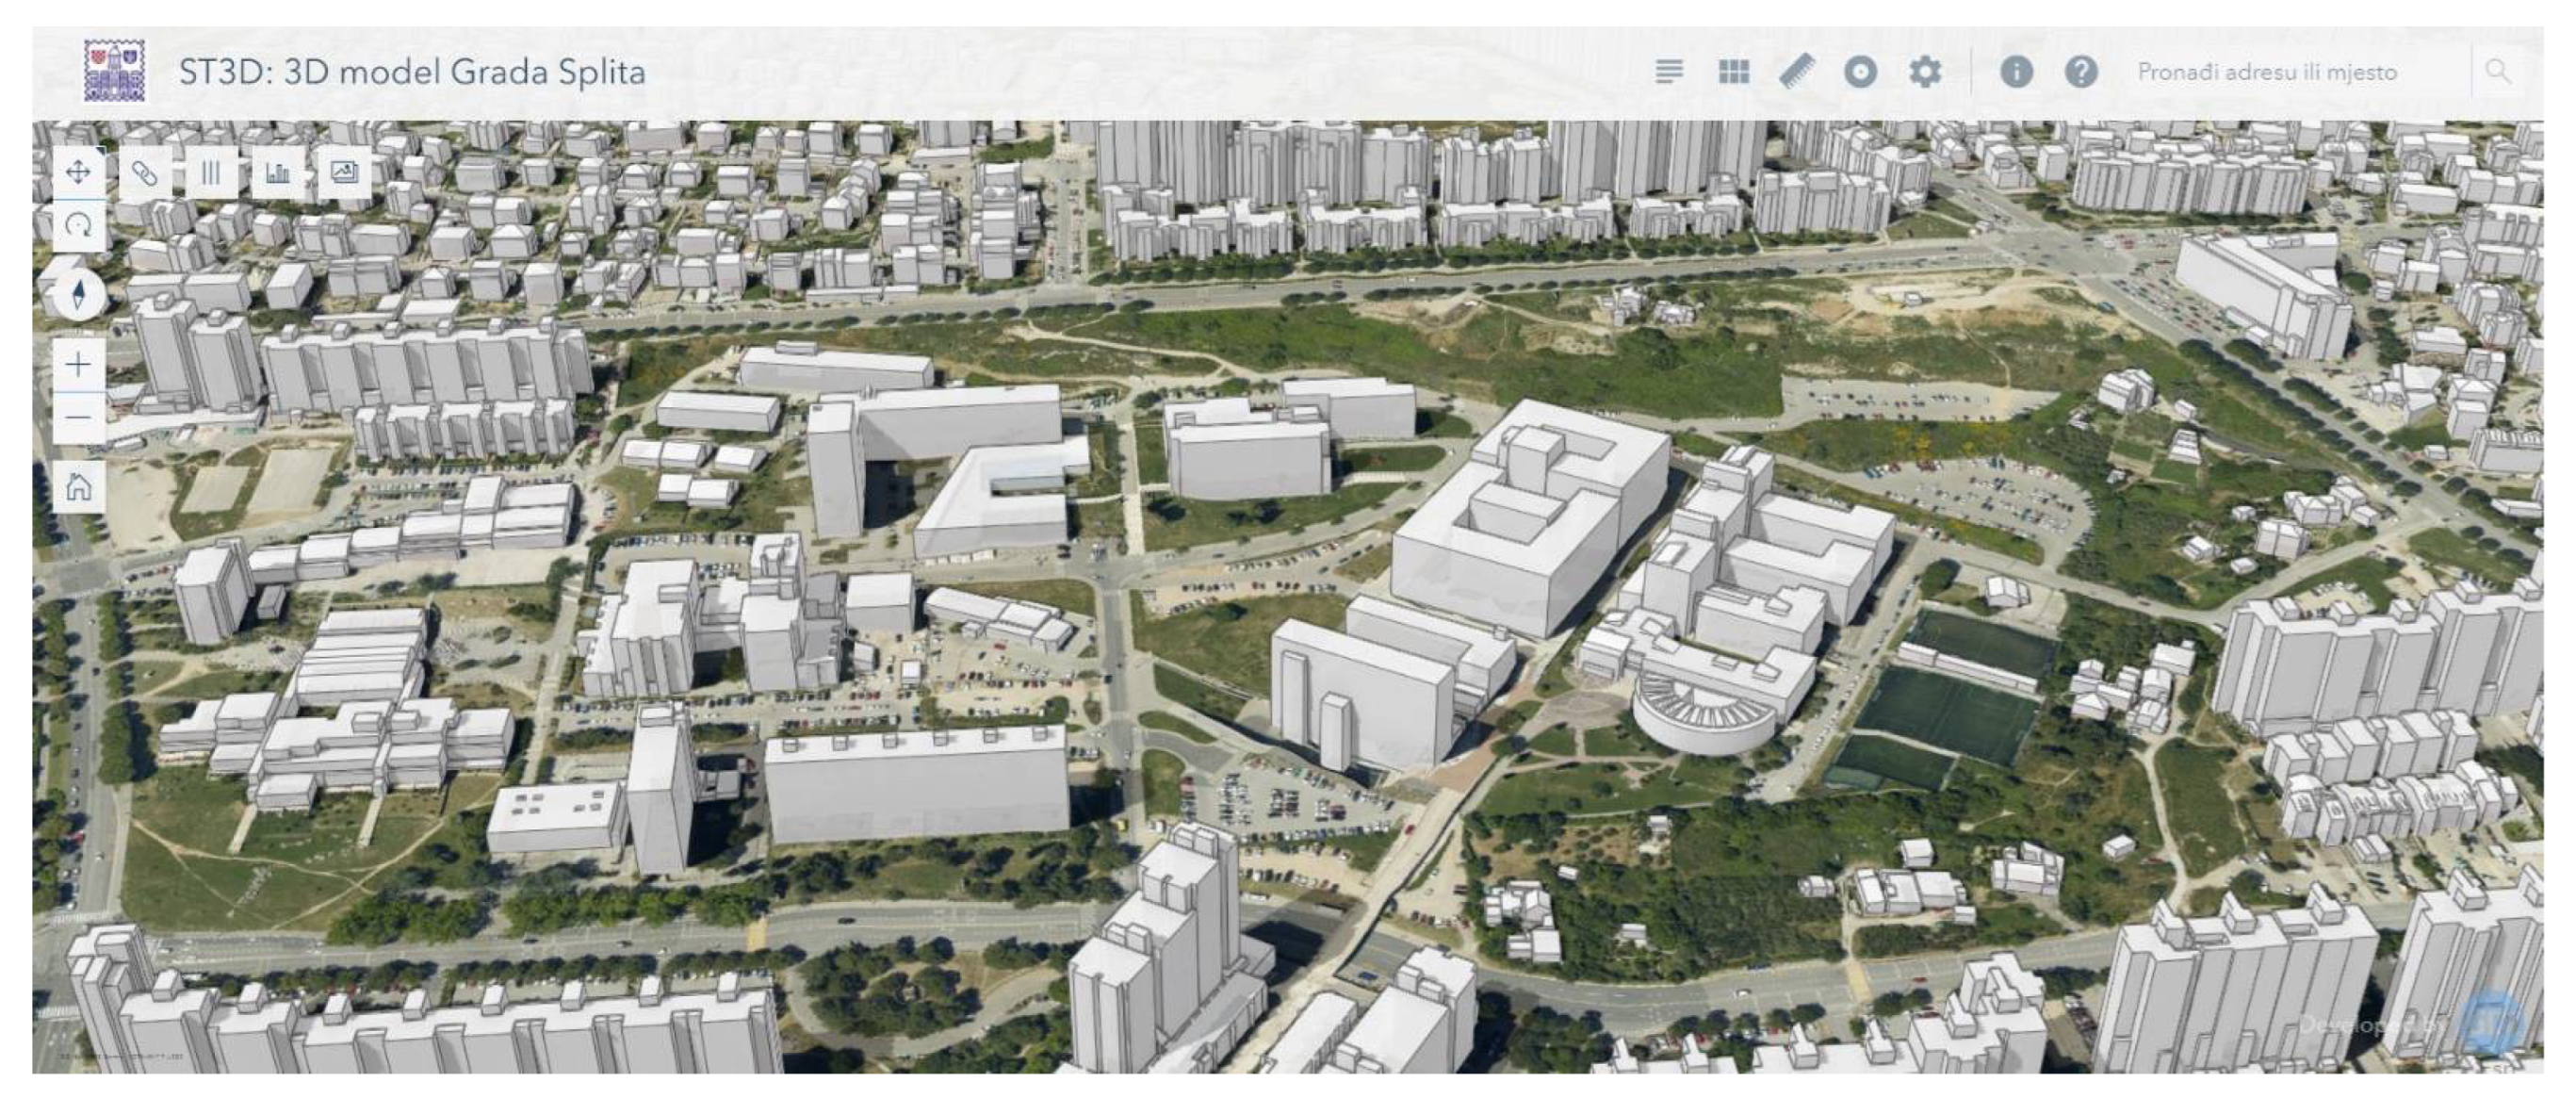
3.3. City of Split Urban Climate Modeling at the Parcel or Building Scale

This spatial representation is suitable for microclimate studies. However, if we model space for building-scale climate studies, this level of detail is insufficient. Such modeling requires at least LOD 3, which can be obtained through TLS.
A terrestrial or topographic LiDAR system emits laser pulses and measures the distance to the target, thereby capturing the XYZ coordinates of numerous points on land [65]. The number of points measurable within a given period is significantly higher than that of total stations: a modern TLS device can measure between 104 and 106 points per second with an accuracy of 10−1–100 cm. Due to the large volume of data in a TLS point cloud, bespoke software packages are generally required for data management and analysis. A point cloud can be converted into a grid Digital Elevation Model (DEM) to facilitate topographic mapping and spatial analyses [66].
As a test case, the Faculty of Civil Engineering, Architecture, and Geodesy building was scanned using a TLS Trimble TX8 (Figure 15 and Figure 16). The entire building was scanned from 10 scanning stations within a few hours. Postprocessing and data georeferencing were performed using the Trimble Business Center (TBC). The result of this processing was a point cloud of the building with sub-centimeter point spacing, consisting of over 500 million points. The resulting point cloud then served as a base for creating the LOD 3 models.
TLS provides an efficient way to acquire extensive geometric data about a building. Based on the author’s experience with TLS, the main drawbacks are the high data processing costs and the complex process of creating a building information model from a point cloud. The phrase “Scan to BIM” has recently gained popularity in the surveying industry and the scientific community. Recent studies have recognized the necessity of creating a building information model from point cloud process automation [67,68,69,70,71,72,73,74,75,76,77,78]. In the future, creating building information and LOD 3 models is expected to be just a “few clicks away” from a point cloud. The quick and easy creation of models will facilitate the further use of building-scale climate studies in urban areas.
Other building model types, such as the Building Energy Model (BEM), a large-scale multipurpose model frequently used for energy efficiency research and analysis, are also created based on point clouds from terrestrial laser scans.
Figure 17 presents a detailed LiDAR scan that can be utilized to create a digital twin (virtual representation of a real-world object). This digital twin serves as a framework for more detailed urban heat resilience studies at the building-scale level. Following scientific achievements on this topic, this topic is considered well covered theoretically and methodologically, but empirically and practically insufficient regarding scientific studies and knowledge gaps at the microclimate level. Therefore, the use of LiDAR scan data is proposed for the simulation of very detailed microclimate models and the calculation of urban energy budget parameters at the building level for this type of built-up facility using various urban climatology models described in the Introduction, the basic characteristics of which are listed in Table 1.
The company Vektra d.o.o. from Varaždin Croatia, with geodesy and geoinformatics as its core business, 3D laser-scanned the cultural heritage of Split’s old city center and made a laser scan image of the old town hall in the Split National Square (Figure 18).

4. Discussion

This study provides a comprehensive analysis of urban heat resilience in Split, focusing on the significant impact of urbanization on local climate conditions. Urbanization, marked by a decrease in vegetation and an increase in dense, tall buildings, has significantly changed the thermal landscape of the city of Split. This transformation has resulted in higher ambient temperatures, especially in densely built-up areas and in the coastal area where the flow of cool sea air—maestral—has been blocked, which may contribute to the formation of the UHI effect.
The use of advanced modeling tools such as ENVI-met and UMEP has provided valuable insights into microclimatic processes and the impact of urban design on thermal comfort. The LCZ concept was used to classify urban areas based on their thermal properties. This classification is essential for identifying hotspots within the city and developing targeted mitigation strategies. The findings indicate that areas with high building density and low vegetation cover experience the most significant effects of UHIs. Conversely, zones with plenty of green spaces and water bodies tend to have cooler temperatures, highlighting the cooling benefits provided by natural elements.
The integration of GIS and BIM technologies has significantly enhanced the simulation of various urban planning scenarios. These tools allow for the creation of detailed 3D models at different levels of detail (LOD 2 and 3). LOD 2 models provide a city-wide perspective, capturing the overall urban morphology and its effects on the local climate. In contrast, LOD 3 models, derived from advanced laser scanning techniques, offer a more detailed view, focusing on individual buildings and their immediate surroundings. This dual-scale approach facilitates a comprehensive analysis of urban heat resilience, from the macro to micro levels. These simulations demonstrate the potential impact of various interventions, such as increasing green space, integrating water features, and regulating building density and height. The findings highlight the need for a balanced urban design that harmonizes built and natural environments to mitigate the UHI effect.
This case study of Split’s old city center and the University of Split campus illustrates the contrasting impacts of urban density and green space on local microclimates. The densely built old city center, with its narrow streets and lack of vegetation, experiences higher temperatures and reduced air circulation, making it more susceptible to heat stress. In contrast, the university campus, with its moderate building heights and more greenery, shows better thermal efficiency and resilience to heat waves.
Additionally, this study emphasizes the importance of the continuous monitoring and updating of spatial data. Urban environments are dynamic, with constant changes in land use, building configurations, and vegetation cover. Real-time data integration and predictive modeling can enhance the ability to respond proactively to these changes, ensuring that urban planning remains adaptable and resilient to evolving climate conditions.
Similar results were reached by Liu et al. (2020) in their study focusing on the effects of UHIs across various climatic zones in China [34], as well as by Shi et al. (2015), who investigated the spatial distribution of urban microclimates in the densely populated subtropical urban area of Hong Kong [36]. Both studies utilized the LCZ classification method to analyze spatial variations in the UHI effect. However, while these studies covered broader regional climate conditions, our research emphasizes microscale analyses. All studies highlight that compact urban areas significantly alter climatic conditions and underscore the importance of reducing building density and increasing urban vegetation to mitigate UHI effects. Similarly, the authors of [62] employed the ENVI-met model to simulate microclimatic processes and to assess the impacts of various interventions in the city of Annaba. Although the climatic conditions in Annaba are drier and urban development is more intense compared with those in Split, their findings also emphasize the crucial role of green spaces in reducing the UHI effect.
The advantages of the methods used include a high level of detail and accuracy in LCZ classification and 3D modeling. However, the disadvantages are the high costs of data processing and the complexity of creating building information models from point clouds. Future research should focus on automating this process to reduce costs and increase efficiency.
A proposal for urban planners and decision-makers in the spatial planning of Split, as well as other coastal cities, is to prioritize the inclusion of water features and green spaces while minimizing the development of dense and tall buildings, particularly in the context of addressing challenges posed by climate change.

5. Conclusions

This study provides a comprehensive framework for assessing the urban heat resilience of the city of Split using LCZ classification and multiscale urban climate modeling. The key findings highlight the significance of detailed spatial data and advanced climate simulation tools in identifying and mitigating the UHI effect.
The results of this study emphasize the importance of integrating green and blue infrastructure in urban planning. Increasing the quantity and quality of green spaces and water bodies can provide natural cooling effects and improve air quality. Strategic zoning regulations are needed to limit the density and height of buildings, especially in coastal areas, to prevent the obstruction of sea breezes that are essential for natural cooling.
This research aligns with the Sustainable Development Goals, specifically Goal 11 (Sustainable Cities and Communities) and Goal 13 (Climate Action). The findings highlight how urbanization affects local climates and underscore the importance of creating sustainable and resilient urban environments that are better adapted to climate change.
Leveraging GIS and BIM technologies for detailed analyses and informed decision-making in urban planning is crucial. These tools can simulate various scenarios and predict the outcomes of different interventions, aiding in developing effective climate resilience strategies. The continuous monitoring and updating of spatial data are essential to adapt to evolving climate conditions and urban dynamics.
By adopting these strategies, Split can mitigate UHIs’ adverse effects, enhance its resident’s quality of life, and build a more resilient urban environment. Future research should focus on the long-term impacts of these interventions and explore innovative solutions for sustainable urban development. Collaborations with stakeholders, including local communities, policymakers, and urban planners, are crucial to creating climate-resilient cities.

Author Contributions

Conceptualization, T.D.L.; methodology, T.D.L.; software, T.D.L., S.B. and J.P.; validation, T.D.L., S.B., J.P. and M.B.; formal analysis, T.D.L., S.B. and J.P.; investigation, T.D.L., S.B. and J.P.; resources, T.D.L., S.B. and J.P.; data curation, T.D.L., S.B. and J.P.; writing—original draft preparation, T.D.L., S.B. and J.P.; writing—review and editing, T.D.L., S.B., J.P. and M.B.; visualization, T.D.L., S.B. and J.P.; supervision, T.D.L., S.B., J.P. and M.B.; project administration, T.D.L., S.B., J.P. and M.B.; funding acquisition, T.D.L., S.B., J.P. and M.B. All authors have read and agreed to the published version of the manuscript.

Funding

This research received no external funding.

Data Availability Statement

Data available on request due to restrictions, e.g., privacy or ethics. The data presented in this study are available on request from the corresponding author. The data are not publicly available due to further research to be published.

Acknowledgments

This research was supported through project KK.01.1.1.02.0027, co-financed by the Croatian Government and the European Union through the European Regional Development Fund Competitiveness and Cohesion Operational Programme.

Conflicts of Interest

The authors declare no conflicts of interest.

References

  1. UN. Revision of World Urbanization Prospects. 2018. Available online: https://population.un.org/wup/assets/WUP2018-Report.pdf (accessed on 30 November 2024).
  2. Stewart, I.D.; Oke, T.R. Local climate zones for urban temperature studies. Bull. Am. Meteorol. Soc. 2012, 93, 1879–1900. [Google Scholar] [CrossRef]
  3. Oke, T.R. Boundary Layer Climates, 2nd ed.; Routledge: Methuen, MA, USA, 1987. [Google Scholar]
  4. Keith, L.; Meerow, S.; Hondula, D.M.; Turner, K.V.; Arnott, J.C. Deploy Heat Officers, Policies and Metrics. Nature 2021, 598, 29–31. [Google Scholar] [CrossRef] [PubMed]
  5. Keith, L.; Meerow, S. PAS Report 600: Planning for Urban Heat Resilience; American Planning Association: Chicago, IL, USA, 2022; p. 101. [Google Scholar]
  6. Voogt, J.A.; Oke, T.R. Thermal remote sensing of urban climates. Remote Sens. Environ. 2003, 86, 370–384. [Google Scholar] [CrossRef]
  7. Oke, T.R. Initial Guidance to Obtain Representative Meteorological Observations at Urban Sites. In World Meteorological Organization, Instruments and Observing Methods, IOM Report No. 81, WMO/TD-No. 1250; WMO: Geneva, Switzerland, 2006. [Google Scholar]
  8. Schlünzen, K.H.; Grimmond, S.; Baklanov, A. Guidance on Measuring, Modelling, and Monitoring the Canopy Layer Urban Heat Island (CL-UHI) (WMO-No. 1292); WMO: Geneva, Switzerland, 2023; Available online: https://www.preventionweb.net/publication/guidance-measuring-modelling-and-monitoring-canopy-layer-urban-heat-island-cl-uhi (accessed on 30 November 2024).
  9. Oke, T.R. The urban energy balance. Prog. Phys. Geogr. 1988, 12, 471–508. [Google Scholar] [CrossRef]
  10. Grimmond, C.S.B.; Blackett, M.; Best, M.; Barlow, J.; Baik, J.; Belcher, S.; Bohnenstengel, S.; Calmet, I.; Chen, F.; Dandou, A.; et al. The international urban energy balance models comparison project: First results from phase 1. J. Appl. Meteorol. Climatol. 2010, 49, 1268–1292. [Google Scholar] [CrossRef]
  11. Offerle, B.; Grimmond, C.S.B.; Fortuniak, K. Heat storage and anthropogenic heat flux in relation to the energy balance of a central European city centre. Int. J. Climatol. A J. R. Meteorol. Soc. 2005, 25, 1405–1419. [Google Scholar] [CrossRef]
  12. Masson, V. Urban surface modeling and the meso-scale impact of cities. Theor. Appl. Climatol. 2006, 84, 35–45. [Google Scholar] [CrossRef]
  13. Oke, T.R. Boundary Layer Climates; Routledge: London, UK, 1987; p. 464. [Google Scholar]
  14. Hrisko, J.; Ramamurthy, P.; Melecio-Vázquez, D.; Gonzalez, J.E. Spatiotemporal Variability of Heat Storage in Major U.S. Cities—A Satellite-Based Analysis. Remote Sens. 2021, 13, 59. [Google Scholar] [CrossRef]
  15. Lobaccaro, G.; De Ridder, K.; Acero, J.A.; Hooyberghs, H.; Lauwaet, D.; Maiheu, B.; Sharma, R.; Govehovitch, B. Applications of Models and Tools for Mesoscale and Microscale Thermal Analysis in Mid-Latitude Climate Regions—A Review. Sustainability 2021, 13, 12385. [Google Scholar] [CrossRef]
  16. Sezer, N.; Yoonus, H.; Zhan, D.; Wang, L.; Galal Hassan, I.; Azizur Rahman, M. Urban microclimate and building energy models: A review of the latest progress in coupling strategies. Renew. Sustain. Energy Rev. 2023, 184, 113577. [Google Scholar] [CrossRef]
  17. Jänicke, B.; Milošević, D.; Manavvi, S. Review of User-Friendly Models to Improve the Urban Micro-Climate. Atmosphere 2021, 12, 1291. [Google Scholar] [CrossRef]
  18. Vurro, G.; Carlucci, S. Contrasting the features and functionalities of urban microclimate simulation tools. Energy Build. 2024, 311, 114042. [Google Scholar] [CrossRef]
  19. Kubilay, A.; Allegrini, J.; Strebel, D.; Zhao, Y.; Derome, D.; Carmeliet, J. Advancement in Urban Climate Modelling at Local Scale: Urban Heat Island Mitigation and Building Cooling Demand. Atmosphere 2020, 11, 1313. [Google Scholar] [CrossRef]
  20. Back, Y.; Marcus Bach, P.; Jasper-Tönnies, A.; Rauch, W.; Kleidorfer, M. A rapid fine-scale approach to modeling urban bioclimatic conditions. Sci. Total Environ. 2021, 756, 143732. [Google Scholar] [CrossRef] [PubMed]
  21. ENVI-Met High-Resolution 3D Modeling for Climate Adaption. Available online: https://envi-met.com/ (accessed on 30 November 2024).
  22. Ansys Fluent | Fluid Simulation Software. Available online: https://www.ansys.com/products/fluids/ansys-fluent (accessed on 30 November 2024).
  23. Cerma—Université Laval. Available online: https://cerma.ulaval.ca/en (accessed on 30 November 2024).
  24. The Urban Multi-scale Environmental Predictor (UMEP). Available online: https://umep-docs.readthedocs.io/en/latest/ (accessed on 30 November 2024).
  25. The Solar LongWave Environmental Irradiance Geometry model (SOLWEIG). Available online: https://www.gu.se/en/earth-sciences/software-download (accessed on 30 November 2024).
  26. SUEWS: Surface Urban Energy and Water Balance Scheme. Available online: https://suews.readthedocs.io/en/latest/ (accessed on 30 November 2024).
  27. World Urban Database and Access Portal Tools. Available online: https://www.wudapt.org/ (accessed on 30 November 2024).
  28. Urban Weather Generator 4.1—Urban Heat Island Effect Modeling Software. Available online: https://urbanmicroclimate.scripts.mit.edu/uwg.php (accessed on 30 November 2024).
  29. Duplančić Leder, T.; Leder, N.; Leder, K. Local Climate Zoning Interaction on Land Surface Temperature Determination—City of Split Case Study. ISPRS Ann. Photogramm. Remote Sens. Spat. Inf. Sci. 2024, X-4/W4-2024, 43–48. [Google Scholar] [CrossRef]
  30. State Bureau of Statistics. Census of Population, Households and Apartments in 2011; State Bureau of Statistics. Available online: https://www.dzs.hr/ (accessed on 30 November 2024).
  31. Državni hidrometeorološki Zavod. Klima—Ocjena Mjeseca, Sezone, Godine. Available online: https://meteo.hr/klima.php? section=klima_pracenje%20&param=ocjena (accessed on 30 November 2024).
  32. Croatian Meteorological and Hydrological Service (CMHS), 2017: Split Marjan Climate Normals (PDF). Available online: https://meteo.hr/index_en.php (accessed on 30 November 2024).
  33. Duplančić Leder, T.; Leder, N.; Hećimović, Ž. Split Metropolitan area surface temperature assessment with remote sensing method. Građevinar 2016, 68, 895–905. [Google Scholar] [CrossRef]
  34. Liu, Y.; Li, Q.; Yang, L.; Mu, K.; Zhang, M.; Liu, J. Urban heat island effects of various urban morphologies under regional climate conditions. Sci. Total Environ. 2020, 743, 140589. [Google Scholar] [CrossRef]
  35. Rosenzweig, C.; Solecki, W.D.; Romero-Lankao, P.; Mehrotra, S.; Dhakal, S.; Ali Ibrahim, S. Climate Change and Cities: Second Assessment Report of the Urban Climate Change Research Network; Cambridge University Press: Cambridge, UK, 2018. [Google Scholar]
  36. Shi, Y.; Ren, C.; Zheng, Y.; Ng, E. Mapping the urban microclimatic spatial distribution in a sub-tropical high-density urban environment. Archit. Sci. Rev. 2015, 59, 370–384. [Google Scholar] [CrossRef]
  37. Stewart, I.D.; Oke, T. A new classification system for urban climate sites. Bull. Am. Meteorol. Soc. 2009, 90, 922. [Google Scholar]
  38. Bherwani, H.; Singh, A.; Kumar, R. Assessment methods of urban microclimate and its parameters: A critical review to take the research from lab to land. Urban Clim. 2020, 34, 100690. [Google Scholar] [CrossRef]
  39. Roupioz, L.; Briottet, X.; Adeline, K.; Al Bitar, A.; Barbon-Dubosc, D.; Barda-Chatain, R.; Barillot, P.; Bridier, S.; Carroll, E.; Cassante, C.; et al. Multi-source datasets acquired over Toulouse (France) in 2021 for urban microclimate studies during the CAMCATT/AI4GEO field campaign. Data Brief 2023, 48, 109109. [Google Scholar] [CrossRef]
  40. Biljecki, F.; Stoter, J.; Ledoux, H.; Zlatanova, S.; Çöltekin, A. Applications of 3D City Models: State of the Art Review. ISPRS Int. J. Geo-Inf. 2015, 4, 2842–2889. [Google Scholar] [CrossRef]
  41. Oke, T.R.; Mills, G.; Christen, A.; Voogt, J.A. Urban Climates; Cambridge University Press: Cambridge, UK, 2017. [Google Scholar]
  42. Yang, L.; Yang, C.; Zhou, W.; Chen, X.; Wang, C.; Liu, L. Mapping the Spatial and Seasonal Details of Heat Health Risks in Different Local Climate Zones: A Case Study of Shanghai, China. Remote Sens. 2024, 16, 3513. [Google Scholar] [CrossRef]
  43. Quan, S.J.; Bansal, P. A systematic review of GIS-based local climate zone mapping studies. Build. Environ. 2021, 196, 107791. [Google Scholar] [CrossRef]
  44. Demuzere, M.; Kittner, J.; Bechtel, B. LCZ Generator: A Web Application to Create Local Climate Zone Maps. Front. Environ. Sci. 2021, 9, 637455. [Google Scholar] [CrossRef]
  45. Demuzere, M.; Kittner, J.; Martilli, A.; Mills, G.; Moede, C.; Stewart, I.D.; van Vliet, J.; Bechtel, B. A global map of local climate zones to support earth system modelling and urban-scale environmental science. Earth Syst. Sci. Data 2022, 14, 3835–3873. [Google Scholar] [CrossRef]
  46. Huang, F.; Jiang, S.; Zhan, W.; Bechtel, B.; Liu, Z.; Demuzere, M.; Huang, Y.; Xu, Y.; Ma, L.; Xia, W.; et al. Mapping local climate zones for cities: A large review. Remote Sens. Environ. 2023, 292, 113573. [Google Scholar] [CrossRef]
  47. Dong, P.; Jiang, S.; Zhan, W.; Wang, C.; Miao, S.; Du, H.; Li, J.; Wang, S.; Jiang, L. Diurnally continuous dynamics of surface urban heat island intensities of local climate zones with spatiotemporally enhanced satellite-derived land surface temperatures. Build. Environ. 2022, 218, 109105. [Google Scholar] [CrossRef]
  48. Han, J.; Mo, N.; Cai, J.; Ouyang, L.; Liu, Z. Advancing the local climate zones framework: A critical review of methodological progress, persisting challenges, and future research prospects. Humanit. Soc. Sci. Commun. 2024, 11, 538. [Google Scholar] [CrossRef]
  49. Zhou, L.; Ma, L.; Johnson, B.A.; Yan, Z.; Li, F.; Li, M. Patch-Based Local Climate Zones Mapping and Population Distribution Pattern in Provincial Capital Cities of China. ISPRS Int. J. Geo-Inf. 2022, 11, 420. [Google Scholar] [CrossRef]
  50. Lam, C.K.C.; Shooshtarian, S.; Kenawy, I. Assessment of urban physical features on summer thermal perceptions using the local climate zone classification. Build. Environ. 2023, 236, 110265. [Google Scholar] [CrossRef]
  51. Song, Y.; Wang, X.; Tan, Y.; Wu, P.; Sutrisna, M.; Cheng, J.C.P.; Hampson, K. Trends and Opportunities of BIM-GIS Integration in the Architecture, Engineering and Construction Industry: A Review from a Spatio-Temporal Statistical Perspective. ISPRS Int. J. Geo-Inf. 2017, 6, 397. [Google Scholar] [CrossRef]
  52. Volk, R.; Stengel, J.; Schultmann, F. Building Information Modeling (BIM) for Existing Buildings—Literature Review and Future Needs. Autom. Constr. 2014, 38, 109–127. [Google Scholar] [CrossRef]
  53. Wang, H.; Pan, Y.; Luo, X. Integration of BIM and GIS in Sustainable Built Environment: A Review and Bibliometric Analysis. Autom. Constr. 2019, 103, 41–52. [Google Scholar] [CrossRef]
  54. Xu, Z.; Qi, M.; Wu, Y.; Hao, X.; Yang, Y. City Information Modeling: State of the Art. Appl. Sci. 2021, 11, 9333. [Google Scholar] [CrossRef]
  55. Lippold, A. GIS & BIM: The Benefits of Integration. ArcGIS Blog 2022. Available online: https://www.esri.com/arcgis-blog/products/arcgis-pro/aec/gis-bim-the-benefits-of-integration/ (accessed on 30 November 2024).
  56. Google Earth. Available online: https://earth.google.com/web (accessed on 30 November 2024).
  57. Cohen, A.C. Estimating the Parameter in a Conditional Poisson Distribution. Biometrics 1960, 16, 203–211. [Google Scholar] [CrossRef]
  58. Cohen, J. A Coefficient of Agreement for Nominal Scales. Educ. Psychol. Meas. 1960, 20, 37–46. [Google Scholar] [CrossRef]
  59. The Table of Level of Development by TU Delft. Available online: https://3dbuildings.medium.com/how-building-data-works-level-of-detail-e9bad0b61baa (accessed on 30 November 2024).
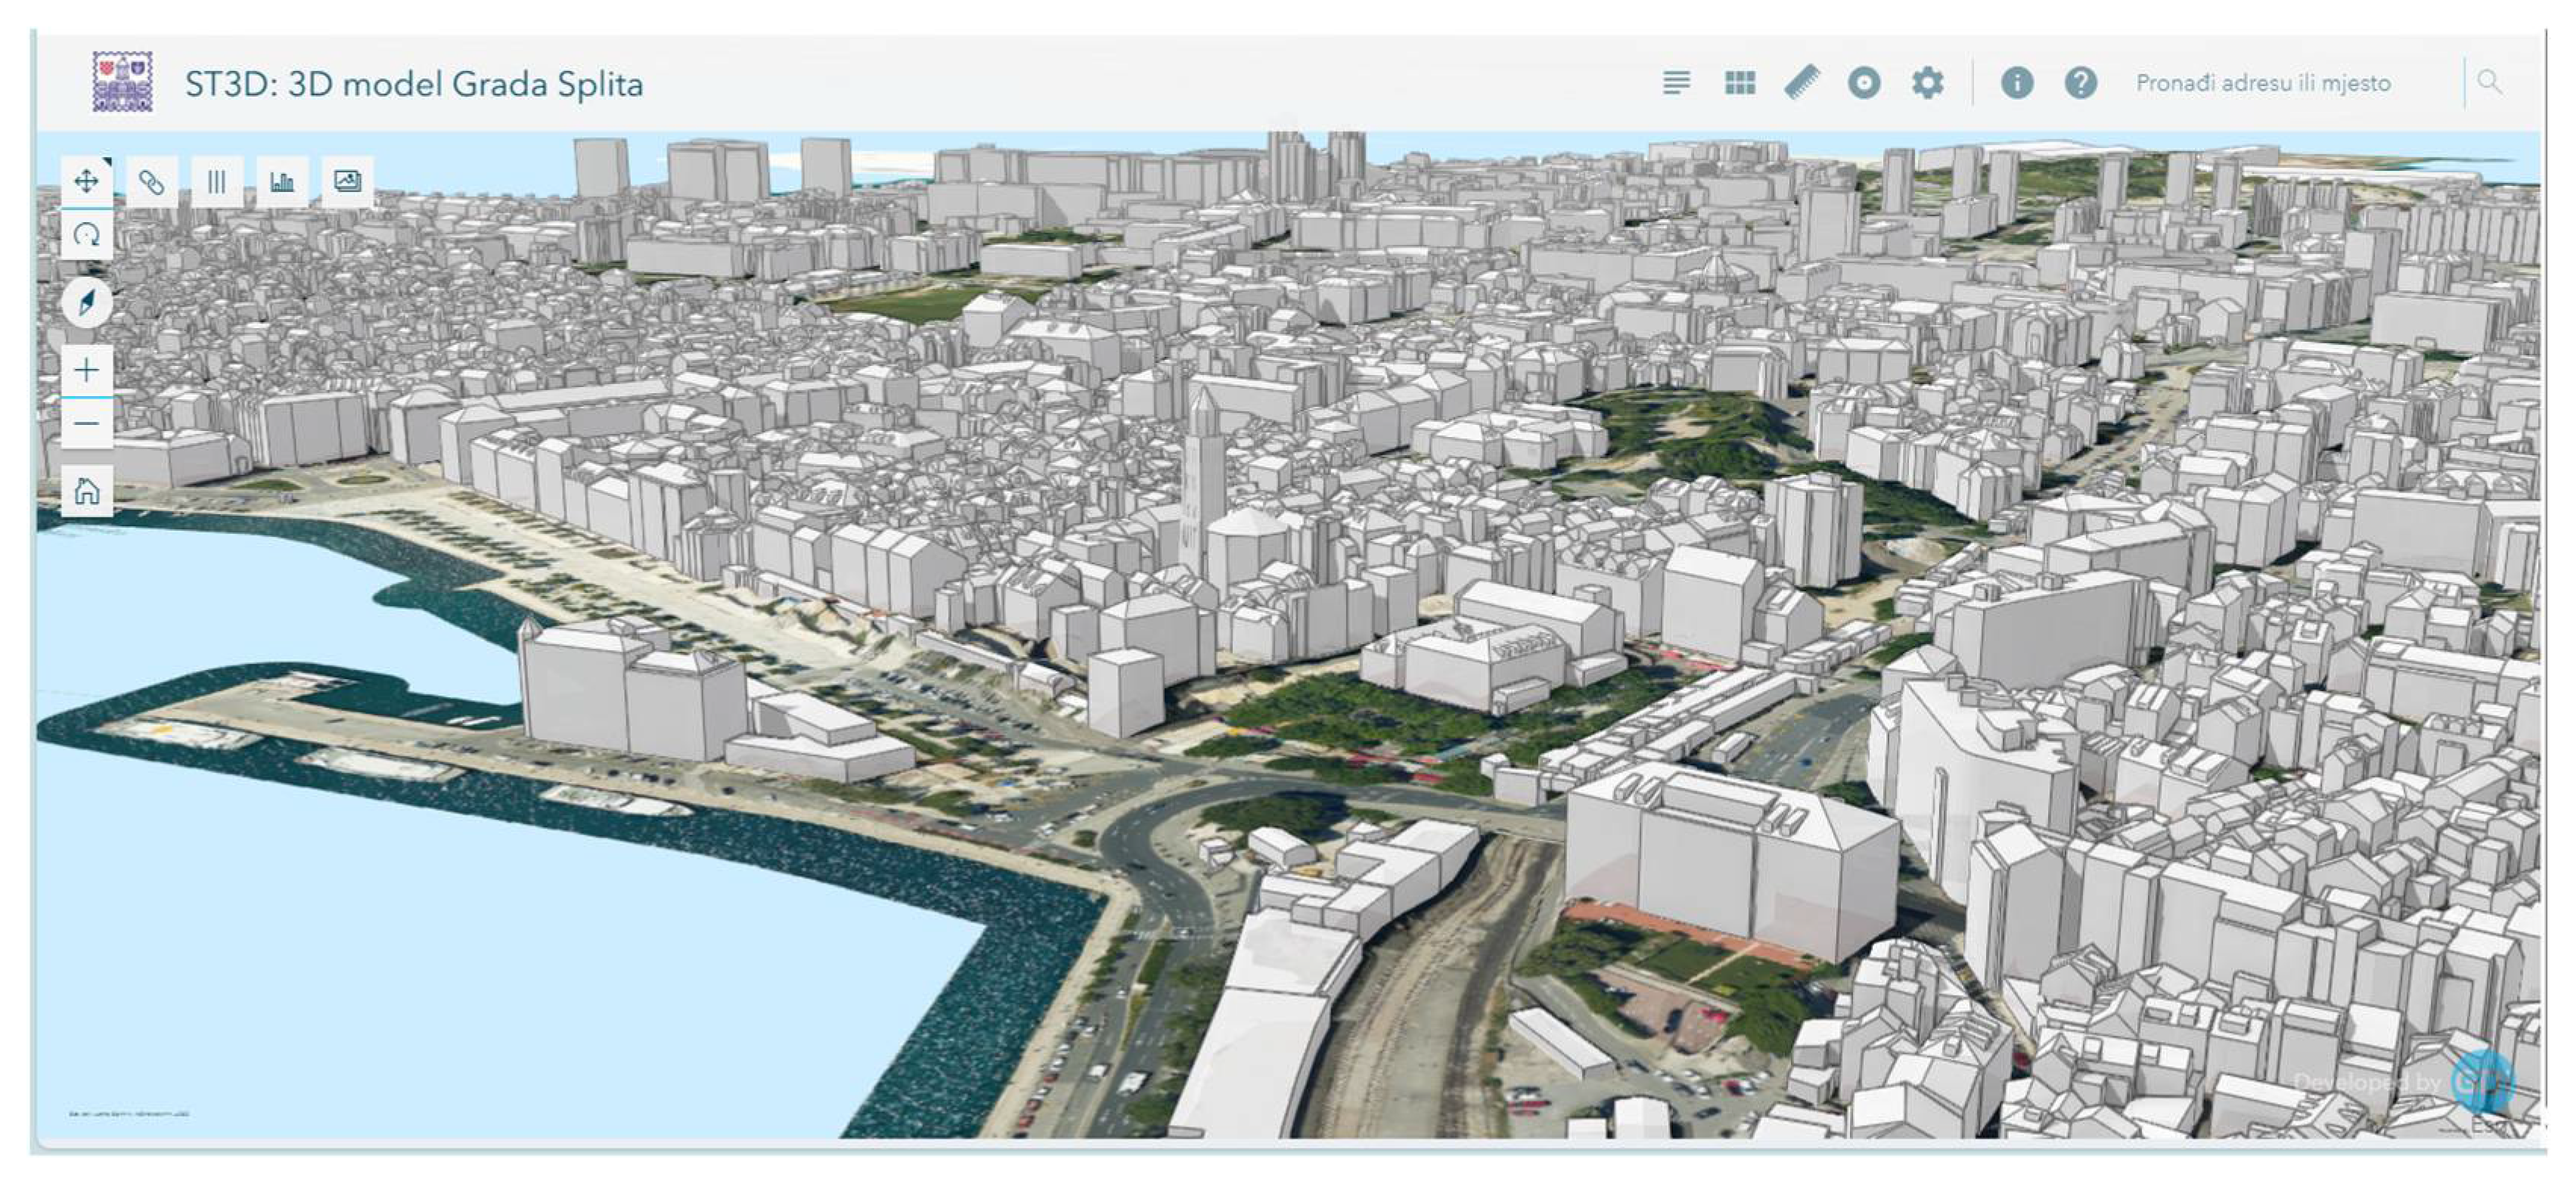
  60. Grad Split Hub GIS Portal Grada Splita. Available online: https://split-gisportal.gdi.net/portal/apps/sites/#/grad-split-hub-1-1/ (accessed on 30 November 2024).
  61. Sayad, B.; Helmi, M.R.; Osra, O.A.; Abed, A.M.; Alhubashi, H.H. Microscale Investigation of Urban Heat Island (UHI) in Annaba City: Unveiling Factors and Mitigation Strategies. Sustainability 2024, 16, 747. [Google Scholar] [CrossRef]
  62. Marcel, C.; Villot, J. Urban Heat Island index based on a simplified micro scale model. Urban Clim. 2021, 39, 100922. [Google Scholar] [CrossRef]
  63. Hu, Y.; Dai, Z.; Guldmann, J.-M. Modeling the impact of 2D/3D urban indicators on the urban heat island over different seasons: A boosted regression tree approach. J. Environ. Manag. 2020, 266, 110424. [Google Scholar] [CrossRef]
  64. Masson, V.; Lemonsu, A.; Hidalgo, J.; Voogt, J. Urban Climates and Climate Change. Annu. Rev. Environ. Resour. 2020, 45, 411–444. [Google Scholar] [CrossRef]
  65. Genderen, J.L. Van Airborne and terrestrial laser scanning. Int. J. Digit. Earth 2011, 4, 183–184. [Google Scholar] [CrossRef]
  66. Oguchi, T.; Yuichi, S.H.; Wasklewicz, T. Chapter Seven—Data Sources. In Developments in Earth Surface; Smith, M.J., Paron, P., Griffiths, J.S., Eds.; Elsevier: Amsterdam, The Netherlands, 2011; Volume 15, pp. 189–224. [Google Scholar] [CrossRef]
  67. Wong, N.H.; He, Y.; Nguyen, N.S.; Raghavan, S.V.; Martin, M.; Hii, D.J.C.; Yu, Z.; Deng, J. An integrated multiscale urban microclimate model for the urban thermal environment. Urban Clim. 2021, 35, 100730. [Google Scholar] [CrossRef]
  68. Lim, T.K.; Ignatius, M.; Miguel, M.; Wong, N.H.; Juang, H.-M.H. Multi-scale urban system modeling for sustainable planning and design. Energy Build. 2017, 157, 78–91. [Google Scholar] [CrossRef]
  69. Huang, J.; Jones, P.; Zhang, A.; Peng, R.; Li, X.; Chan, P. Urban Building Energy and Climate (UrBEC) Simulation: Example Application and Field Evaluation in Sai Ying Pun, Hong Kong. Energy Build. 2019, 207, 109580. [Google Scholar] [CrossRef]
  70. Hertwig, D.; Grimmond, S.; Hendry, M.A.; Saunders, B.; Wang, Z.; Jeoffrion, M.; Vidale, P.L.; McGuire, P.C.; Bohnenstengel, S.I.; Ward, H.C.; et al. Urban signals in high-resolution weather and climate simulations: Role of urban land-surface characterization. Theor. Appl. Climatol. 2020, 142, 701–728. [Google Scholar] [CrossRef]
  71. Abreu, N.; Pinto, A.; Matos, A.; Pires, M. Procedural Point Cloud Modelling in Scan-to-BIM and Scan-vs-BIM Applications: A Review. ISPRS Int. J. Geo-Inf. 2023, 12, 260. [Google Scholar] [CrossRef]
  72. Kostrikov, S.; Pudlo, R.; Bubnov, D.; Vasiliev, V. ELiT, Multifunctional Web-Software for Feature Extraction from 3D LiDAR Point Clouds. ISPRS Int. J. Geo-Inf. 2020, 9, 650. [Google Scholar] [CrossRef]
  73. Rossknecht, M.; Airaksinen, E. Concept and Evaluation of Heating Demand Prediction Based on 3D City Models and the CityGML Energy ADE—Case Study Helsinki. ISPRS Int. J. Geo-Inf. 2020, 9, 602. [Google Scholar] [CrossRef]
  74. Agugiaro, G.; González, F.G.G.; Cavallo, R. The City of Tomorrow from… the Data of Today. ISPRS Int. J. Geo-Inf. 2020, 9, 554. [Google Scholar] [CrossRef]
  75. Zhan, D.; Sezer, N.; Hou, D.; Wang, L.; Hassan, I.G. Integrating Urban Heat Island Impact into Building Energy Assessment in a Hot-Arid City. Buildings 2023, 13, 1818. [Google Scholar] [CrossRef]
  76. Mohammadiziazi, R.; Copeland, S.; Bilec, M.M. Urban building energy model: Database development, validation, and application for commercial building stock. Energy Build. 2021, 248, 111175. [Google Scholar] [CrossRef]
  77. Brackney, L.; Parker, A.; Macumber, D.; Benne, K. Introduction to Building Energy Modeling. In Building Energy Modeling with OpenStudio; Springer: Cham, Switzerland, 2018. [Google Scholar] [CrossRef]
  78. Uciechowska-Grakowicz, A.; Herrera-Granados, O.; Biernat, S.; Bac-Bronowicz, J. Usage of Airborne LiDAR Data and High-Resolution Remote Sensing Images in Implementing the Smart City Concept. Remote Sens. 2023, 15, 5776. [Google Scholar] [CrossRef]
  79. Vectra 3D Scanning and Modeling, Cultural Heritage, Laser Scanning Image of the Old Town Hall on the Split National Square. Available online: https://vektra.net/en/project/split-stara-gradska-vijecnica/ (accessed on 30 November 2024).
Figure 1. Urban surface energy balance fluxes [10].
Climate 13 00079 g001
Figure 2. Split city area.
Climate 13 00079 g002
Figure 3. Climate data from Marjan Hill, Split (1971–2000, extremes 1948–2019) [31].
Climate 13 00079 g003
Figure 4. LST of the Split city area.
Climate 13 00079 g004
Figure 5. Multiscale urban climate classification model for the city of Split’s climate resilience with an urban energy and water budget model.
Climate 13 00079 g005
Figure 7. Table of level of development by TU Delft according to [38].
Climate 13 00079 g007
Figure 9. Two illustrative examples of local, micro, and building scale.
Climate 13 00079 g009
Figure 10. Examples of LCZ areas of the city of Split.
Climate 13 00079 g010
Figure 11. Local climate zone areas of the city of Split.
Climate 13 00079 g011
Figure 12. ST3D 3D city of Split LOD2 object model presentation.
Climate 13 00079 g012
Figure 13. ST3D 3D city of Split LOD2 object model presentation—the University of Split campus area.
Climate 13 00079 g013
Figure 14. ST3D 3D city of Split LOD2 object model presentation—old city center.
Climate 13 00079 g014
Figure 15. Laser scanning image of buildings in the western part of the University of Split campus, including a student dormitory and the Faculty of Civil Engineering, Architecture, and Geodesy building.
Climate 13 00079 g015
Figure 16. Laser scanning image of the eastern facade of the Faculty of Civil Engineering, Architecture, and Geodesy building.
Climate 13 00079 g016
Figure 17. Details of the laser scanning image of the eastern facade of the Faculty of Civil Engineering, Architecture, and Geodesy building.
Climate 13 00079 g017
Figure 18. Laser scanning image of the old town hall in the Split National Square [79].
Climate 13 00079 g018
Table 1. Basic characteristics of software for urban climatology models (according to [16,17]).
SoftwareDeveloperYearPluginPay/FreeLinkageReference
ENVI-metENVI-met GmbH (M. Bruse)1993 PayCAD/GIS[21]
FluentANSYS2006 PayCAD[22]
CERMA Laboratory1990SOLENE Microclimate CAD[23]
UMEPFredrik Lindberg2015 FreeGIS[24]
The Göteborg - Urban Climate Group (J.D. Deepak)2010SOLWEIG modelFreeGIS[25]
L. Järvi et al.2011SUEWSFreeGIS[26]
J.K.S. Ching2013WUDAPTFreeGIS[27]
Massachusetts Institute of
Technology
2012UWGFreeGIS[28]
Disclaimer/Publisher’s Note: The statements, opinions and data contained in all publications are solely those of the individual author(s) and contributor(s) and not of MDPI and/or the editor(s). MDPI and/or the editor(s) disclaim responsibility for any injury to people or property resulting from any ideas, methods, instructions or products referred to in the content.

