Abstract
In this study, a prediction model was developed that considers the rainfall characteristics and damage characteristics of heavy rainfall disasters in Korea using machine learning models. Considering the damage characteristics of heavy rainfall disasters that occurred from 1999 to 2019 in 228 administrative districts in Korea, four types of total rainfall and five types of damage costs were selected to predict the total damage cost. The machine learning models selected for this study were Random Forest, K-Nearest Neighbors, Decision Tree, and eXtreme Gradient Boosting, and their accuracy was evaluated using , EVS, and MAPE. The training period spanned from 1999 to 2015, while the evaluation period extended from 2016 to 2019. The Random Forest model emerged as the most effective model for predicting the total damage costs associated with heavy rainfall disasters, exhibiting an accuracy of 0.95 for , 0.95 for EVS, and 0.05 for MAPE. It was observed that when the total damage costs are minimal, all models demonstrate high prediction capability. However, as the damage costs escalate, the prediction power experiences a decline due to the presence of errors. The machine learning prediction model for heavy rainfall disasters developed in this study has the potential to contribute to national efforts aimed at preventing and preparing for heavy rainfall disasters.
1. Introduction
The Intergovernmental Panel on Climate Change (IPCC) was established in the late 1980s. Currently, the world is experiencing an era of climate change and climate crisis [1]. In recent years, the occurrence of disasters has increased with the advent of the climate crisis, especially heavy precipitation disasters, which have had a significant impact on human lives and property damage in many countries [2,3]. Artificial intelligence is being used to predict and mitigate the increasing number of disasters.
Machine learning (ML) models have been applied to various data classification and prediction tasks, demonstrating remarkable accuracy and performance in disaster-related areas [4,5,6]. The incorporation of big data, image analysis, and time series rainfall has been shown to improve the prediction performance of natural disasters through the use of ML models [7,8,9]. In the past, a single model was analyzed; however, recent research has focused on selecting the optimal model by combining models with different characteristics to improve prediction performance.
Machine learning models have been used to develop efficient prediction models by learning various processes [10]. Machine learning models such as Random Forest (RF), Boosting, and Support Vector Machine (SVM) have been used to develop optimization models for various natural disasters such as forest fires, droughts, heavy rains, and typhoons [8,11,12,13,14,15]. The prediction of heavy rainfall disasters using machine learning models has been studied in terms of rainfall, hazard level, and inundation area. The use of rainfall as a predictor of flood damage magnitude has been a subject of study using SVM and RF models [16,17,18]. The performance of various machine learning algorithms, including eXtreme Gradient Boosting (XGBoost), Decision Tree (DT), and K-Nearest Neighbors (KNNs), has been evaluated in predicting the occurrence of heavy rainfall and subsequent damage [19,20,21].
XGBoost has been the focus of numerous studies, where its superior performance has been evaluated by applying various ML models to predict the damage caused by heavy rainfall disasters. These models were trained on meteorological data, including rainfall, and XGBoost emerged as the most accurate predictor [8]. Some studies have linked rainfall data and river hydrology data to predict heavy rainfall disasters on agricultural land [22]. However, there is a lack of research exploring the relationship between temporal changes in rainfall intensity and the amount of damage caused during the damage period of heavy rainfall disasters.
In the context of heavy rainfall disaster risk analysis, ML models have been used to assess flood risk using data such as rainfall, satellite imagery, and damage records [23,24,25,26]. In some studies, RF, SVM, and Artificial Neural Network (ANN) models were used to predict flood risk assessment in China. RF was found to have superior predictive capabilities for China’s regional characteristics; however, it also exhibited some overfitting of outliers [27,28,29]. The risk analysis of heavy rainfall disasters is based on the present and does not consider the impact of data on the magnitude, rainfall characteristics, and damage costs of past disasters.
To predict inundation damage in heavy rainfall disasters, ML models were used to recognize and classify images to assess the likelihood of damage. As a learning factor, the relationship between rainfall and inundation depth was learned to predict economic losses due to increased rainfall [30,31,32,33]. In Indonesia, SVM and KNN were used to learn rainfall, river discharge, and water level data from flood disasters to predict a 6-day heavy rainfall disaster [34,35,36]. In some studies, Latin Hypercube Sampling (LHS) and Probabilistic Neural Network (PNN) were applied to predict the extent of flood damage on a grid [37]. The problem of overfitting, due to large amounts of data or outlier data, has been a recurring theme in studies using various ML models for predicting heavy rainfall disasters [38,39,40,41,42,43].
The objective is to build a database of damage data on heavy rainfall disasters by administrative districts officially provided by the Republic of Korea and to develop an optimal evaluation method for damage prediction. About 90 types of damage data on heavy rainfall disasters are presented, but not all damage factors can explain the characteristics of heavy rainfall damage. Independent and dependent variables for damage prediction are selected through data preprocessing. In addition, rainfall characteristics are applied to rainfall that causes heavy rainfall disasters, considering regional characteristics and the damage period.
The present study aims to evaluate the effectiveness of various ML models by considering the damage characteristics of heavy rainfall disasters, the rainfall characteristics that precipitate such disasters, and the selection of ML models. For this purpose, a comprehensive data set was carefully curated, which includes five categories of structures: residential buildings, agricultural land, vessels, public facilities, and private facilities. These structures were selected based on their occurrence in 228 administrative districts and counties in Korea during the period from 1999 to 2019. The rainfall characteristics included in the data set included the maximum daily, second daily, and third daily rainfall amounts, as well as the total rainfall accumulated during the specific period when a heavy rainfall disaster occurred.
In this study, RF, KNN, DT, and XGBoost were selected from various models used in previous studies. The selection of the models was based on computational speed and data processing efficiency, interpretability of disasters, and ease of practical application. Models such as ANN, SVM, etc., that require complex parameter adjustment when processing large amounts of data, slow analysis time, and high computational effort were excluded. The objective of this study is to analyze and evaluate the most suitable ML model for predicting the damage scale and costs associated with heavy rainfall disasters.
2. Materials and Methods
2.1. Random Forest
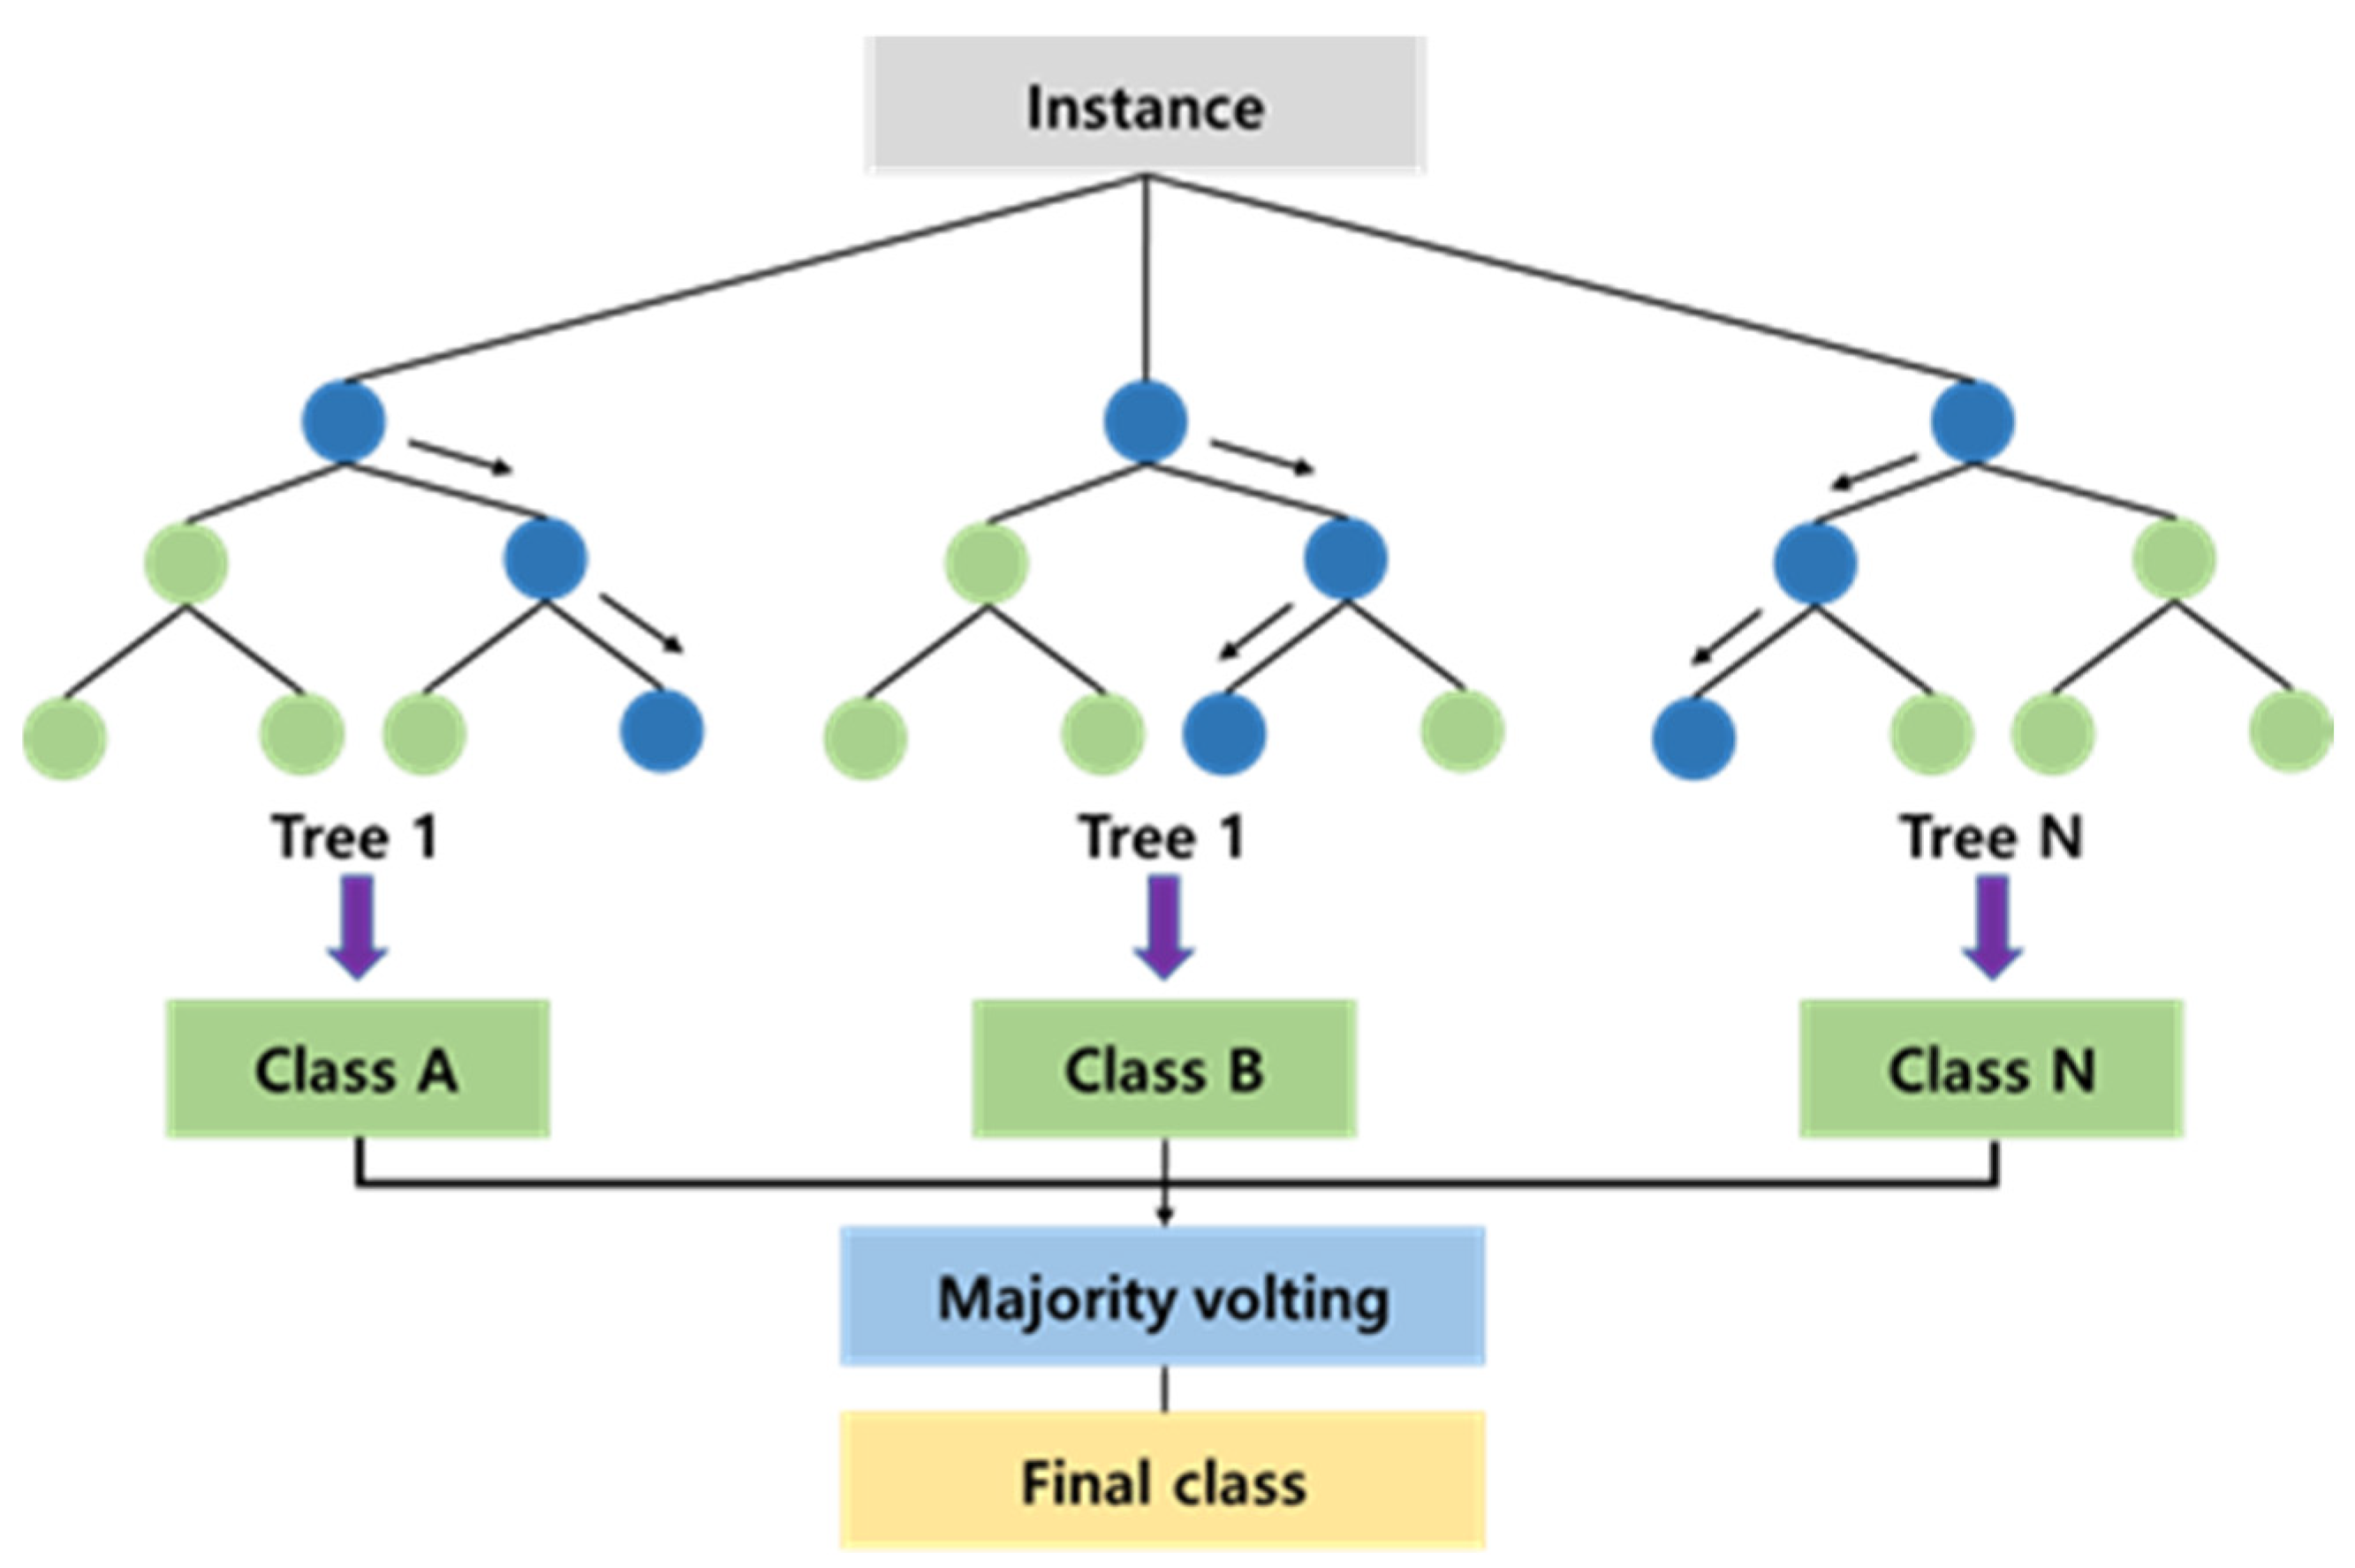
Random Forests (RF) are a prominent algorithm in the field of machine learning techniques, operating as an ensemble learning method used for tasks such as classification and regression [44]. The Random Forest method involves the selection of features and their subsequent assignment to the nodes of a tree, with the goal of identifying impurities at each branch. This model generates multiple branches from a branched tree and compares them to identify the optimal classification and prediction (Figure 1). It employs a random selection of features from a random sample of data, as well as a random selection of the sample’s features. The algorithm’s batch-bagging of multiple classifiers can lead to random variations in results and challenges in generalization [45,46]. To address these challenges, techniques such as bagging or random node optimization can be used to improve model performance and predict outcomes with greater accuracy [44,47].
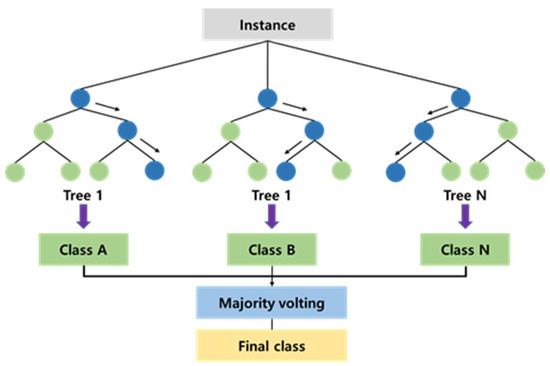
Figure 1.
Random Forest structure.
2.2. K-Nearest Neighbors
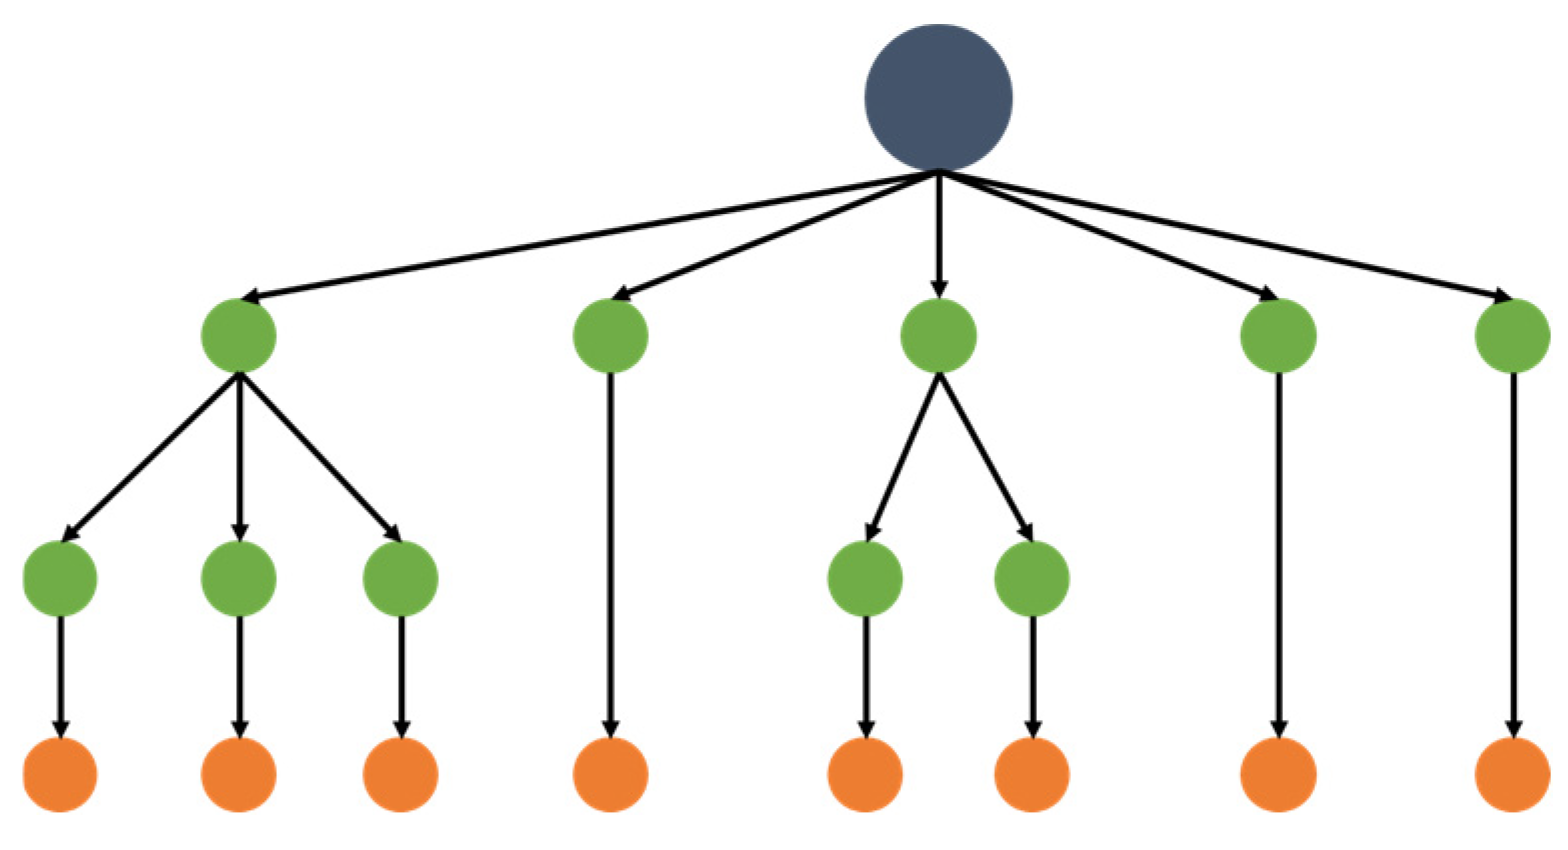
K-Nearest Neighbors (KNNs) is a supervised learning classification model that has found wide application in data mining and machine learning for classification and regression [48,49]. When new data are input, the KNN uses a process of referring to the K nearest data attributes to classify it into the class that has the highest frequency (Figure 2) [50]. The calculation of the distance is facilitated by two primary methods: the Euclidean distance method and the Manhattan distance method. Identifying an optimal K value, which corresponds to the classification of the most similar K data points, is a critical step in this process [51,52]. A smaller K value results in data that more closely reflects the characteristics of the data, potentially leading to overfitting. Conversely, a larger K value reduces the effect of random error, leading to accurate classification results, but may result in unclear data boundaries [53,54,55].
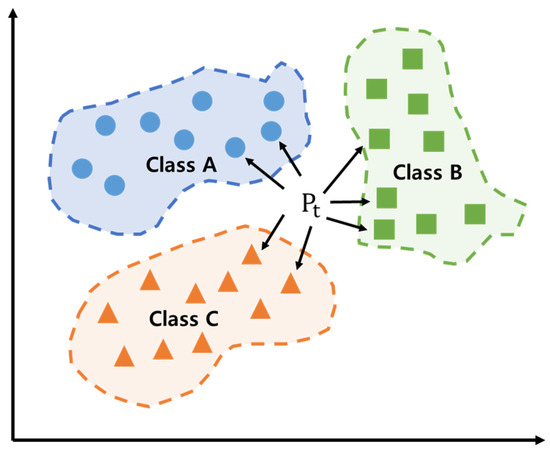
Figure 2.
K-Nearest Neighbors structure.
2.3. Decision Tree
Decision Tree (DT) is a supervised learning classification model that analyzes data and combines patterns between data into predictable rules. It is capable of both classification and regression (Figure 3). The DT method involves dividing data into categories and continuous numbers based on classification rules, thereby facilitating prediction [56,57,58]. The DT algorithms include a number of approaches, including CHAID, CART, ID3, C4.5, and C5.0. ID3, C4.5, and C5.0 are used in data mining, while CHAID and CART are used in statistical analysis [57,58,59]. DT’s ability to encompass the analysis process of judgmental analysis, regression analysis, and neural networks stems from the fact that the analysis results of the data are expressed through a Decision Tree. However, it is important to note that DT has limitations, including the difficulty of separating data vertically and horizontally and considering different variables simultaneously [60].

Figure 3.
Decision Tree structure.
2.4. eXtreme Gradient Boosting
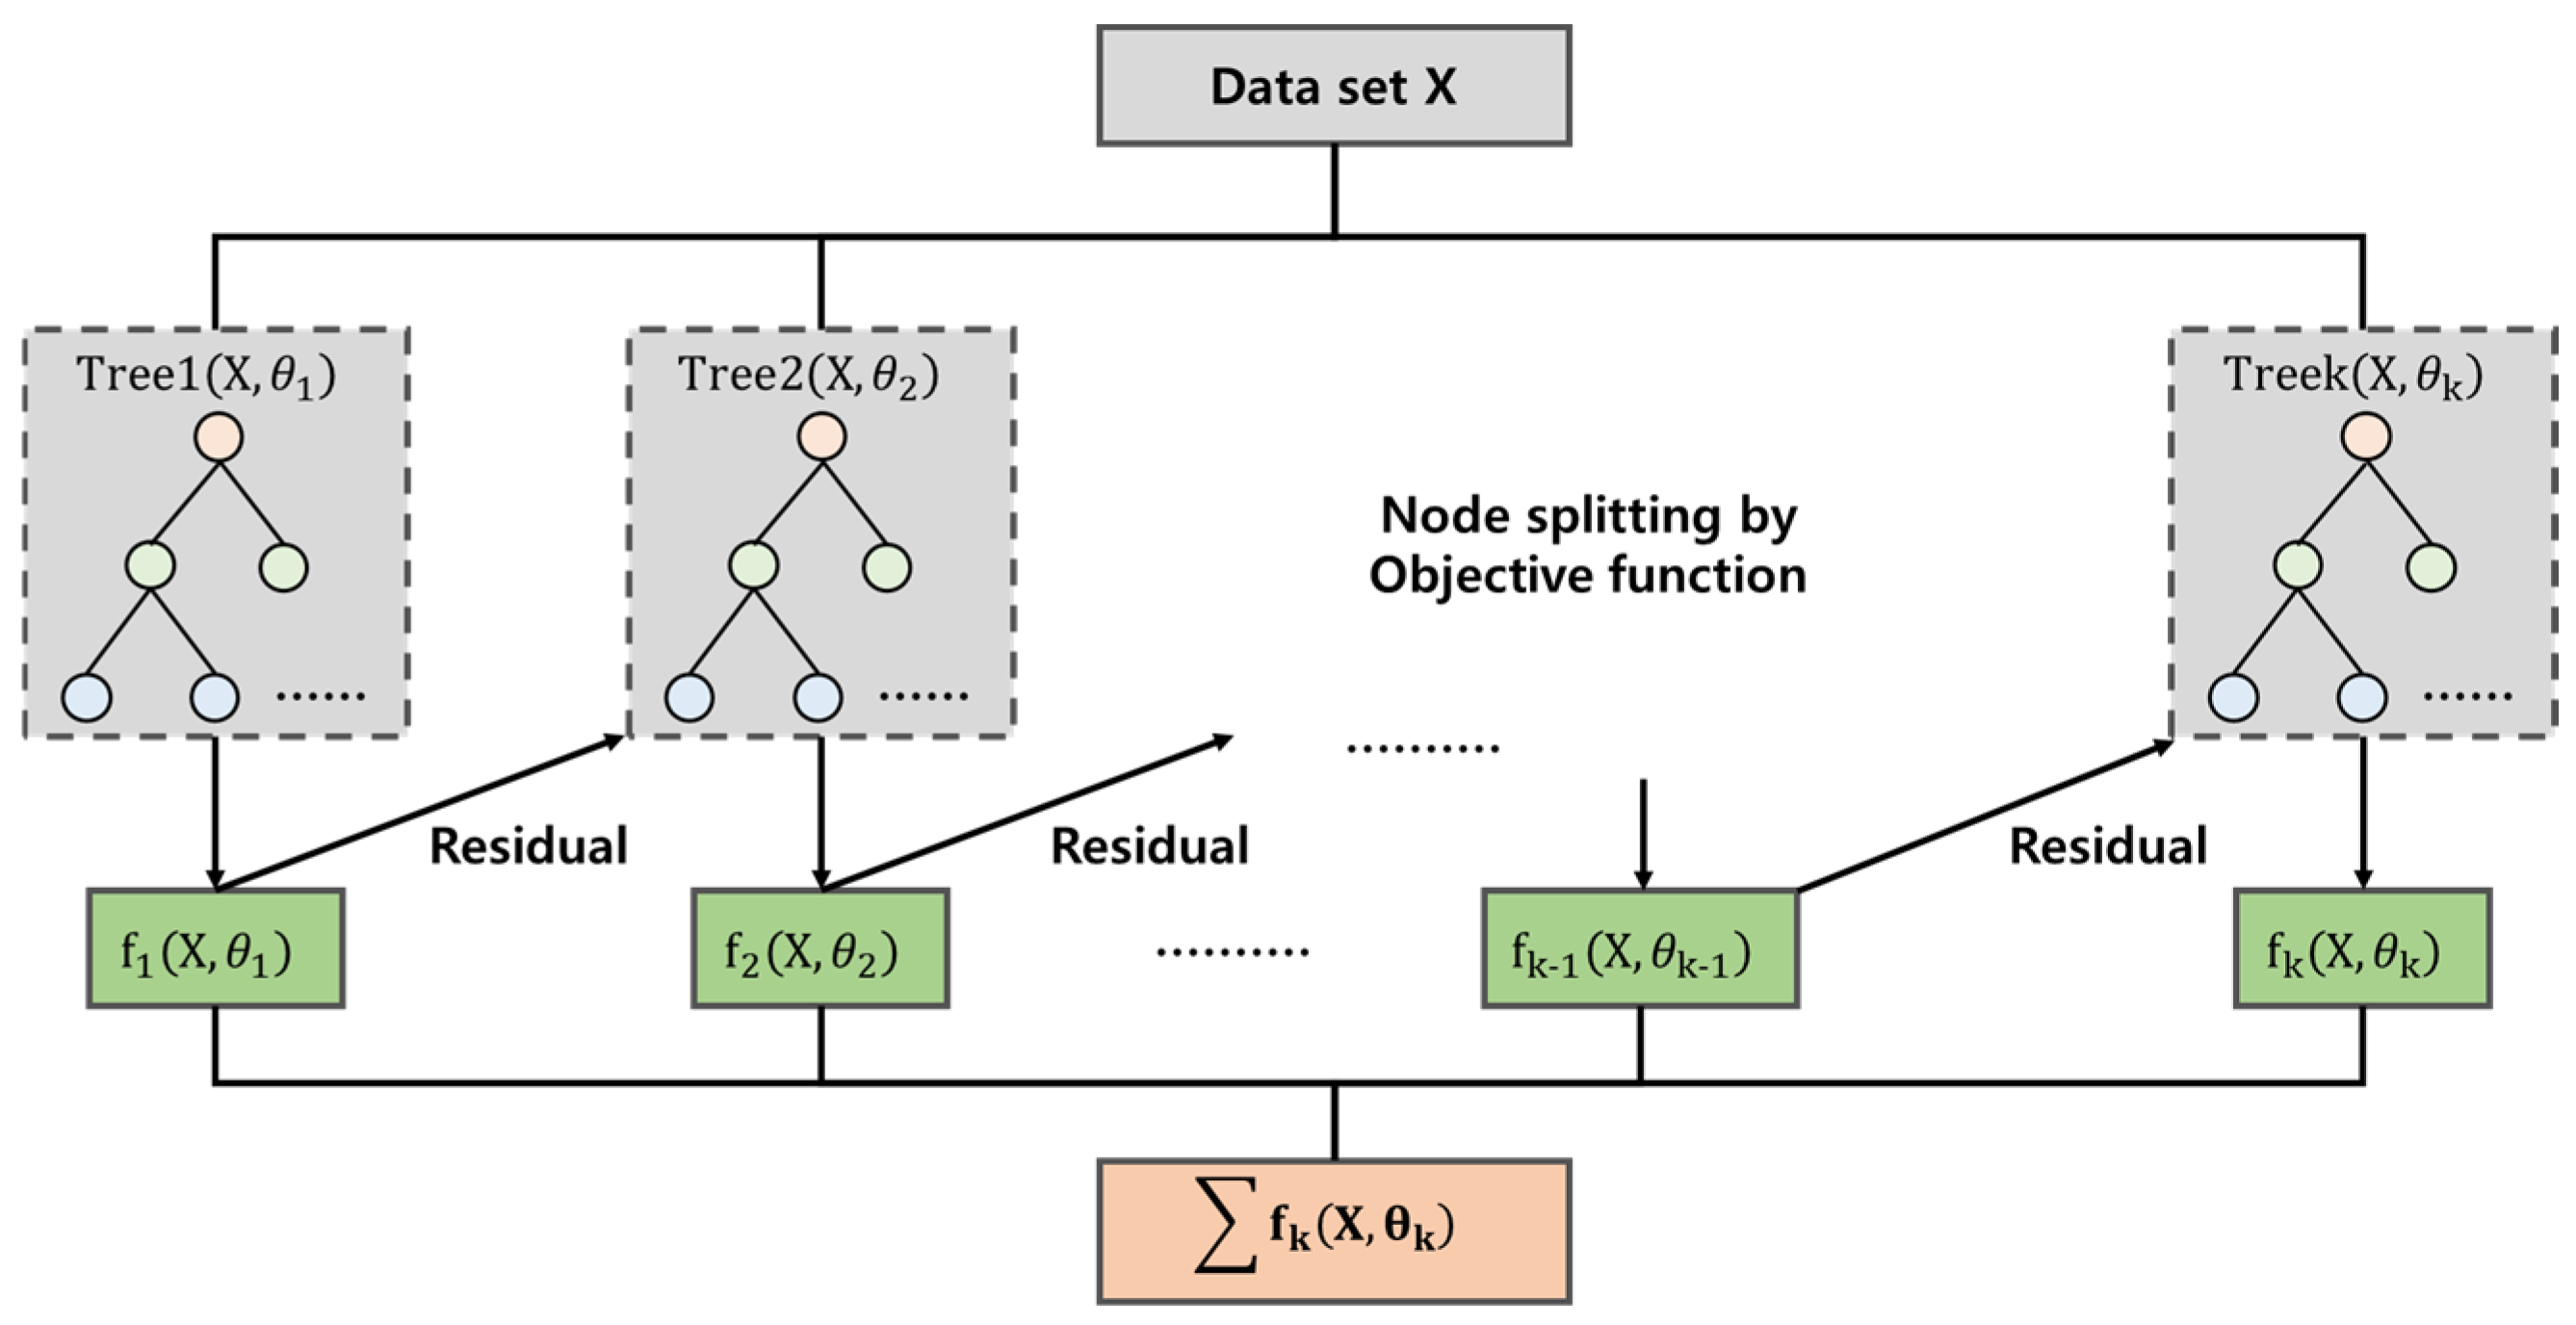
eXtreme Gradient Boosting (XGBoost) is a complementary algorithm to Gradient Tree Boosting, a supervised learning model that uses gradient descent (Figure 4). XGBoost is a super supervised learning algorithm that sequentially backpropagates a new model that is augmented using the residuals of the gradient [60,61]. XGBoost incorporates additional techniques to prevent overfitting of the actual and predicted values. The parameters used include nrounds, which specifies the number of boosting iterations; lambda and alpha, which specify the penalty rates; and eta, which specifies the learning rate. A notable strength of XGBoost is its ability to handle overfitting scenarios where there is a high probability of overtraining while maintaining low model accuracy. This is especially advantageous when dealing with limited data sets. However, XGBoost’s effectiveness is most pronounced in scenarios where a substantial amount of data is available, resulting in highly accurate predictions.
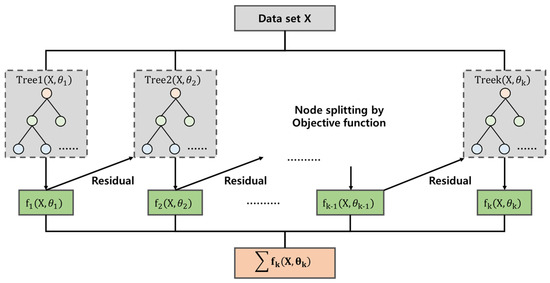
Figure 4.
eXtreme Gradient Boosting structure.
2.5. Predictive Power Evaluation Techniques
In this study, we examined various machine learning techniques to assess the precision of both observed and predicted values. Among the predictive power evaluation techniques, we implemented the Coefficient of Determination (), the Explained Variance Score (EVS), and the Mean Absolute Percentage Error (MAPE) to evaluate the performance of regression models. estimates a measure of the shared variability between the observed and predicted values by measuring the association and directionality of the linear relationship between the actual and predicted values. EVS calculates the ratio of the variance to the difference between the actual and predicted values. The closer the is to +1 and the EVS is to 1, the higher the perfect correlation between the two variables (see Equations (1) and (2)). MAPE measures the percentage of absolute error. The predictive power of MAPE is measured by the values close to zero, indicating that the predicted value is similar to the actual value and equal to Equation (3).
where is the i-th true value, is the i-th predicted value, is the average of the true values, is the average of the predicted values, and n is the number of samples.
3. Heavy Rainfall Disaster Status
3.1. Characteristics of Heavy Rainfall Events
The National Disaster Management System (NDMS) is responsible for the collection and dissemination of data on the damage caused by natural disasters in Korea on an annual basis. The data on damages from natural disasters are published in PDF and Excel files two to three years after the year of the damage. The data must be built according to the needs of researchers unless they are provided in real time through an open API. Currently, official data on damages from natural disasters have been provided since 1999. The data on natural disaster damage are categorized into the following 90 damage categories or damage costs: human casualties, buildings, ships, agricultural land, public facilities, and private facilities.
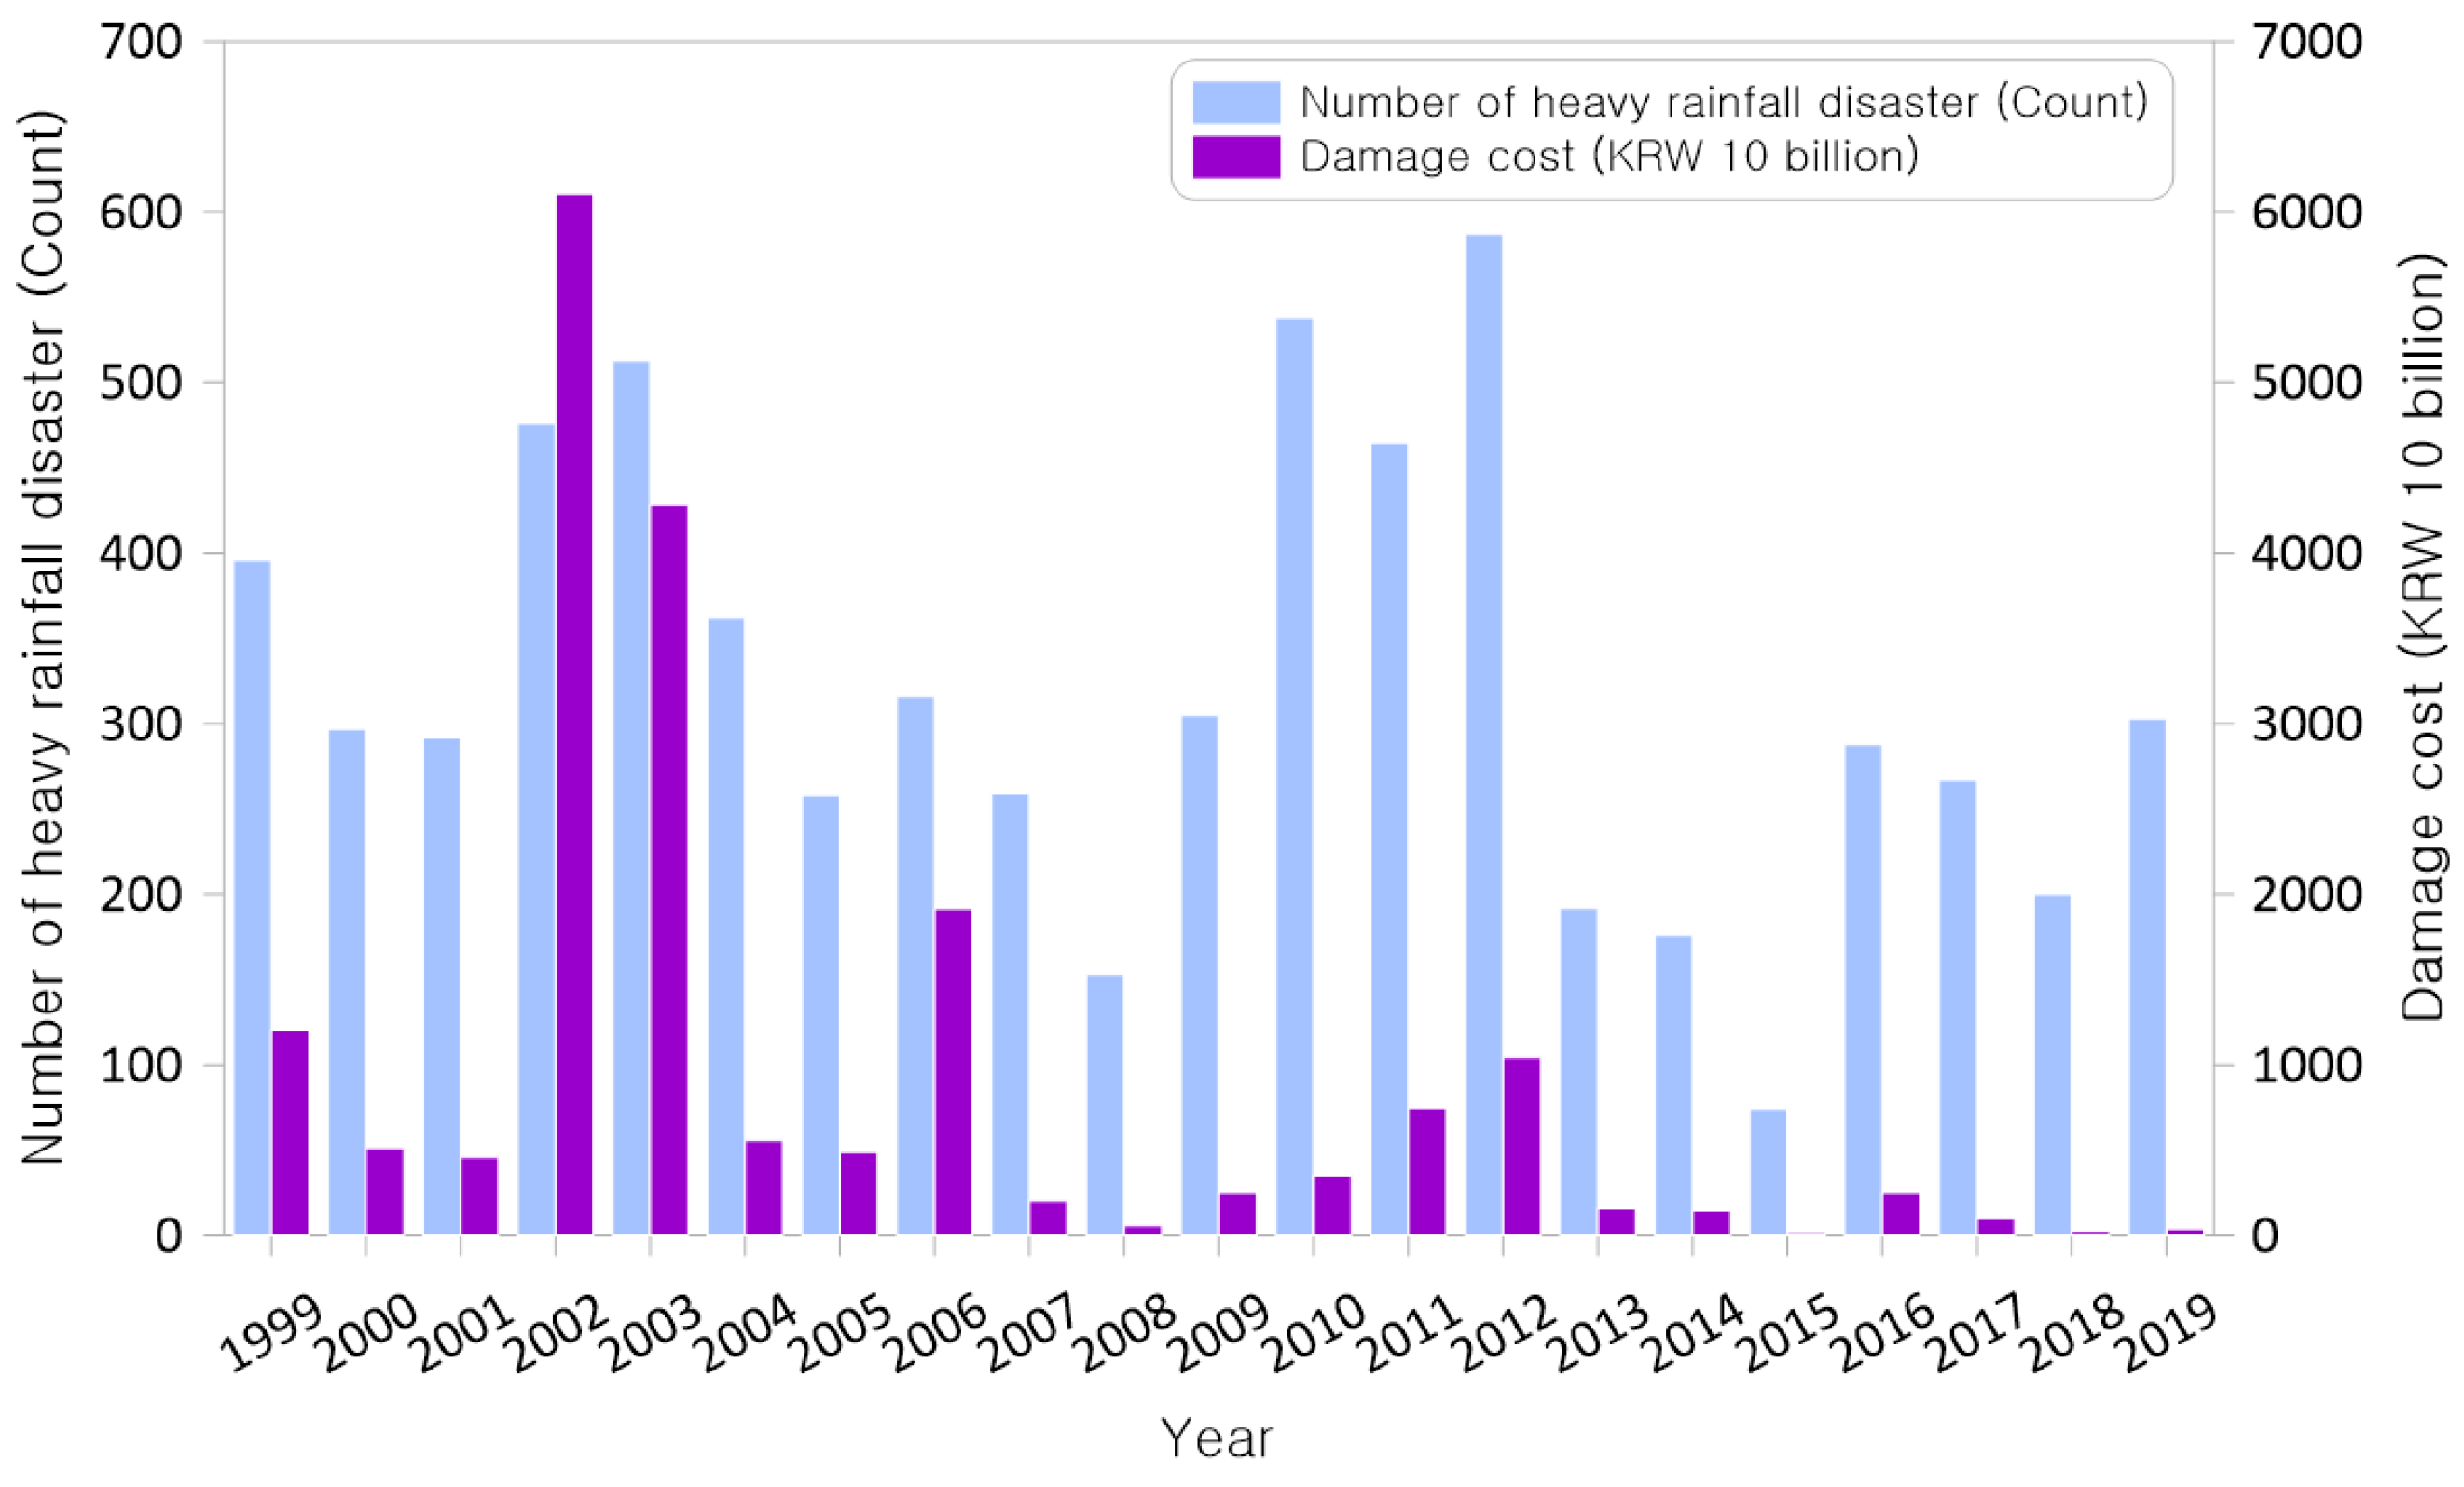
In this study, heavy rainfall and typhoons were selected as heavy rainfall disasters among natural disasters that occurred from 1999 to 2019. Data on the damage status by administrative district for all heavy rainfall disasters that occurred over the past 20 years were collected. The damage data of heavy rainfall disasters are used as the basis for the learning and evaluation sections as data on the characteristics of damage for machine learning analysis. It was found that heavy rainfall disasters accounted for approximately 87% of the total damage costs and 75% of the total affected areas over the 20-year period (Table 1). The number of heavy rainfall disasters by year and the amount of damage is shown in Figure 5.

Table 1.
Natural and heavy rainfall disasters in South Korea (1999–2019).
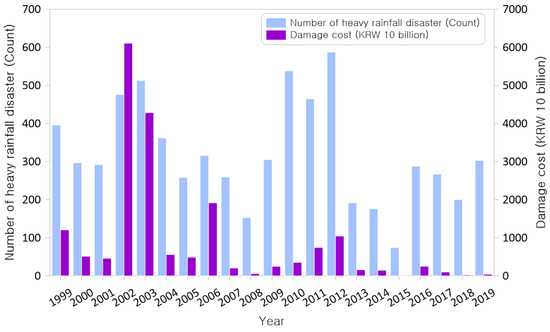
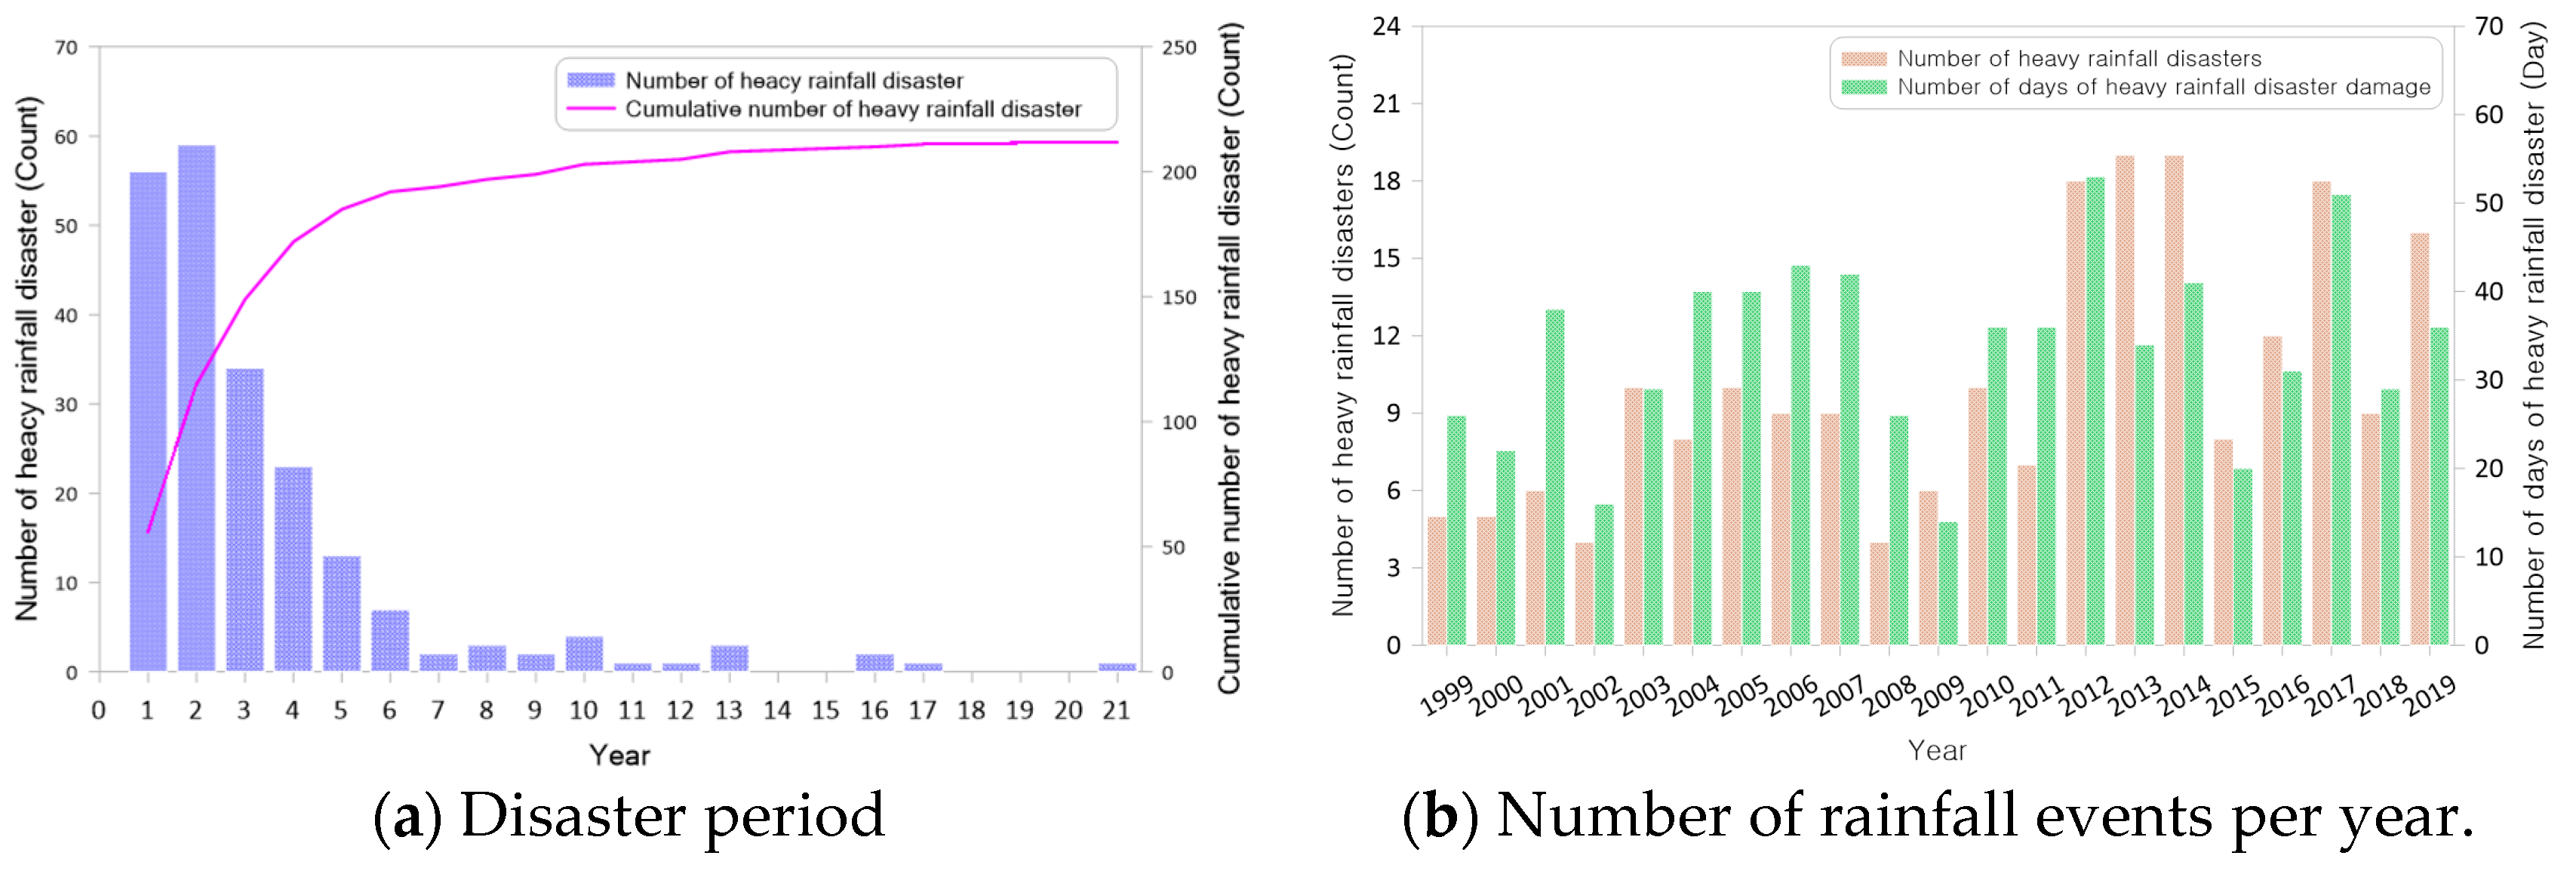
Figure 5.
Number of times and costs of damage from heavy rainfall disasters (1999–2019).
A total of 212 heavy rainfall disasters have occurred in South Korea, affecting 6902 administrative districts. These disasters have resulted in damages amounting to KRW 19,093 billion. The 228 administrative districts and counties in Korea experienced between one and 75 heavy rainfall disasters, with an average of 32. A comprehensive analysis was conducted to assess the primary damages inflicted by these disasters, encompassing the extent of damage to buildings, vessels, agricultural land, public facilities, and private facilities.
The financial repercussions of these heavy rainfall disasters in urban and rural areas exhibited a range from a minimum of KRW 40,312 million to a maximum of KRW 806,435 million, with an average of KRW 45,398 million and a standard deviation of KRW 92,019 million. The analysis encompassed a comprehensive range of damage inflicted by these disasters, from the most significant damage to public facilities to the least substantial damage to vessels. The analysis revealed that the majority of the total damage was concentrated in public facilities, private facilities, and agricultural land. The extent of damage incurred due to heavy rainfall disasters is delineated in Table 2, categorized according to the designated damage status.
Table 2.
Characteristics of damage costs by type of heavy rainfall disaster (1999–2019).
3.2. Rainfall Characteristics of Heavy Rainfall Events
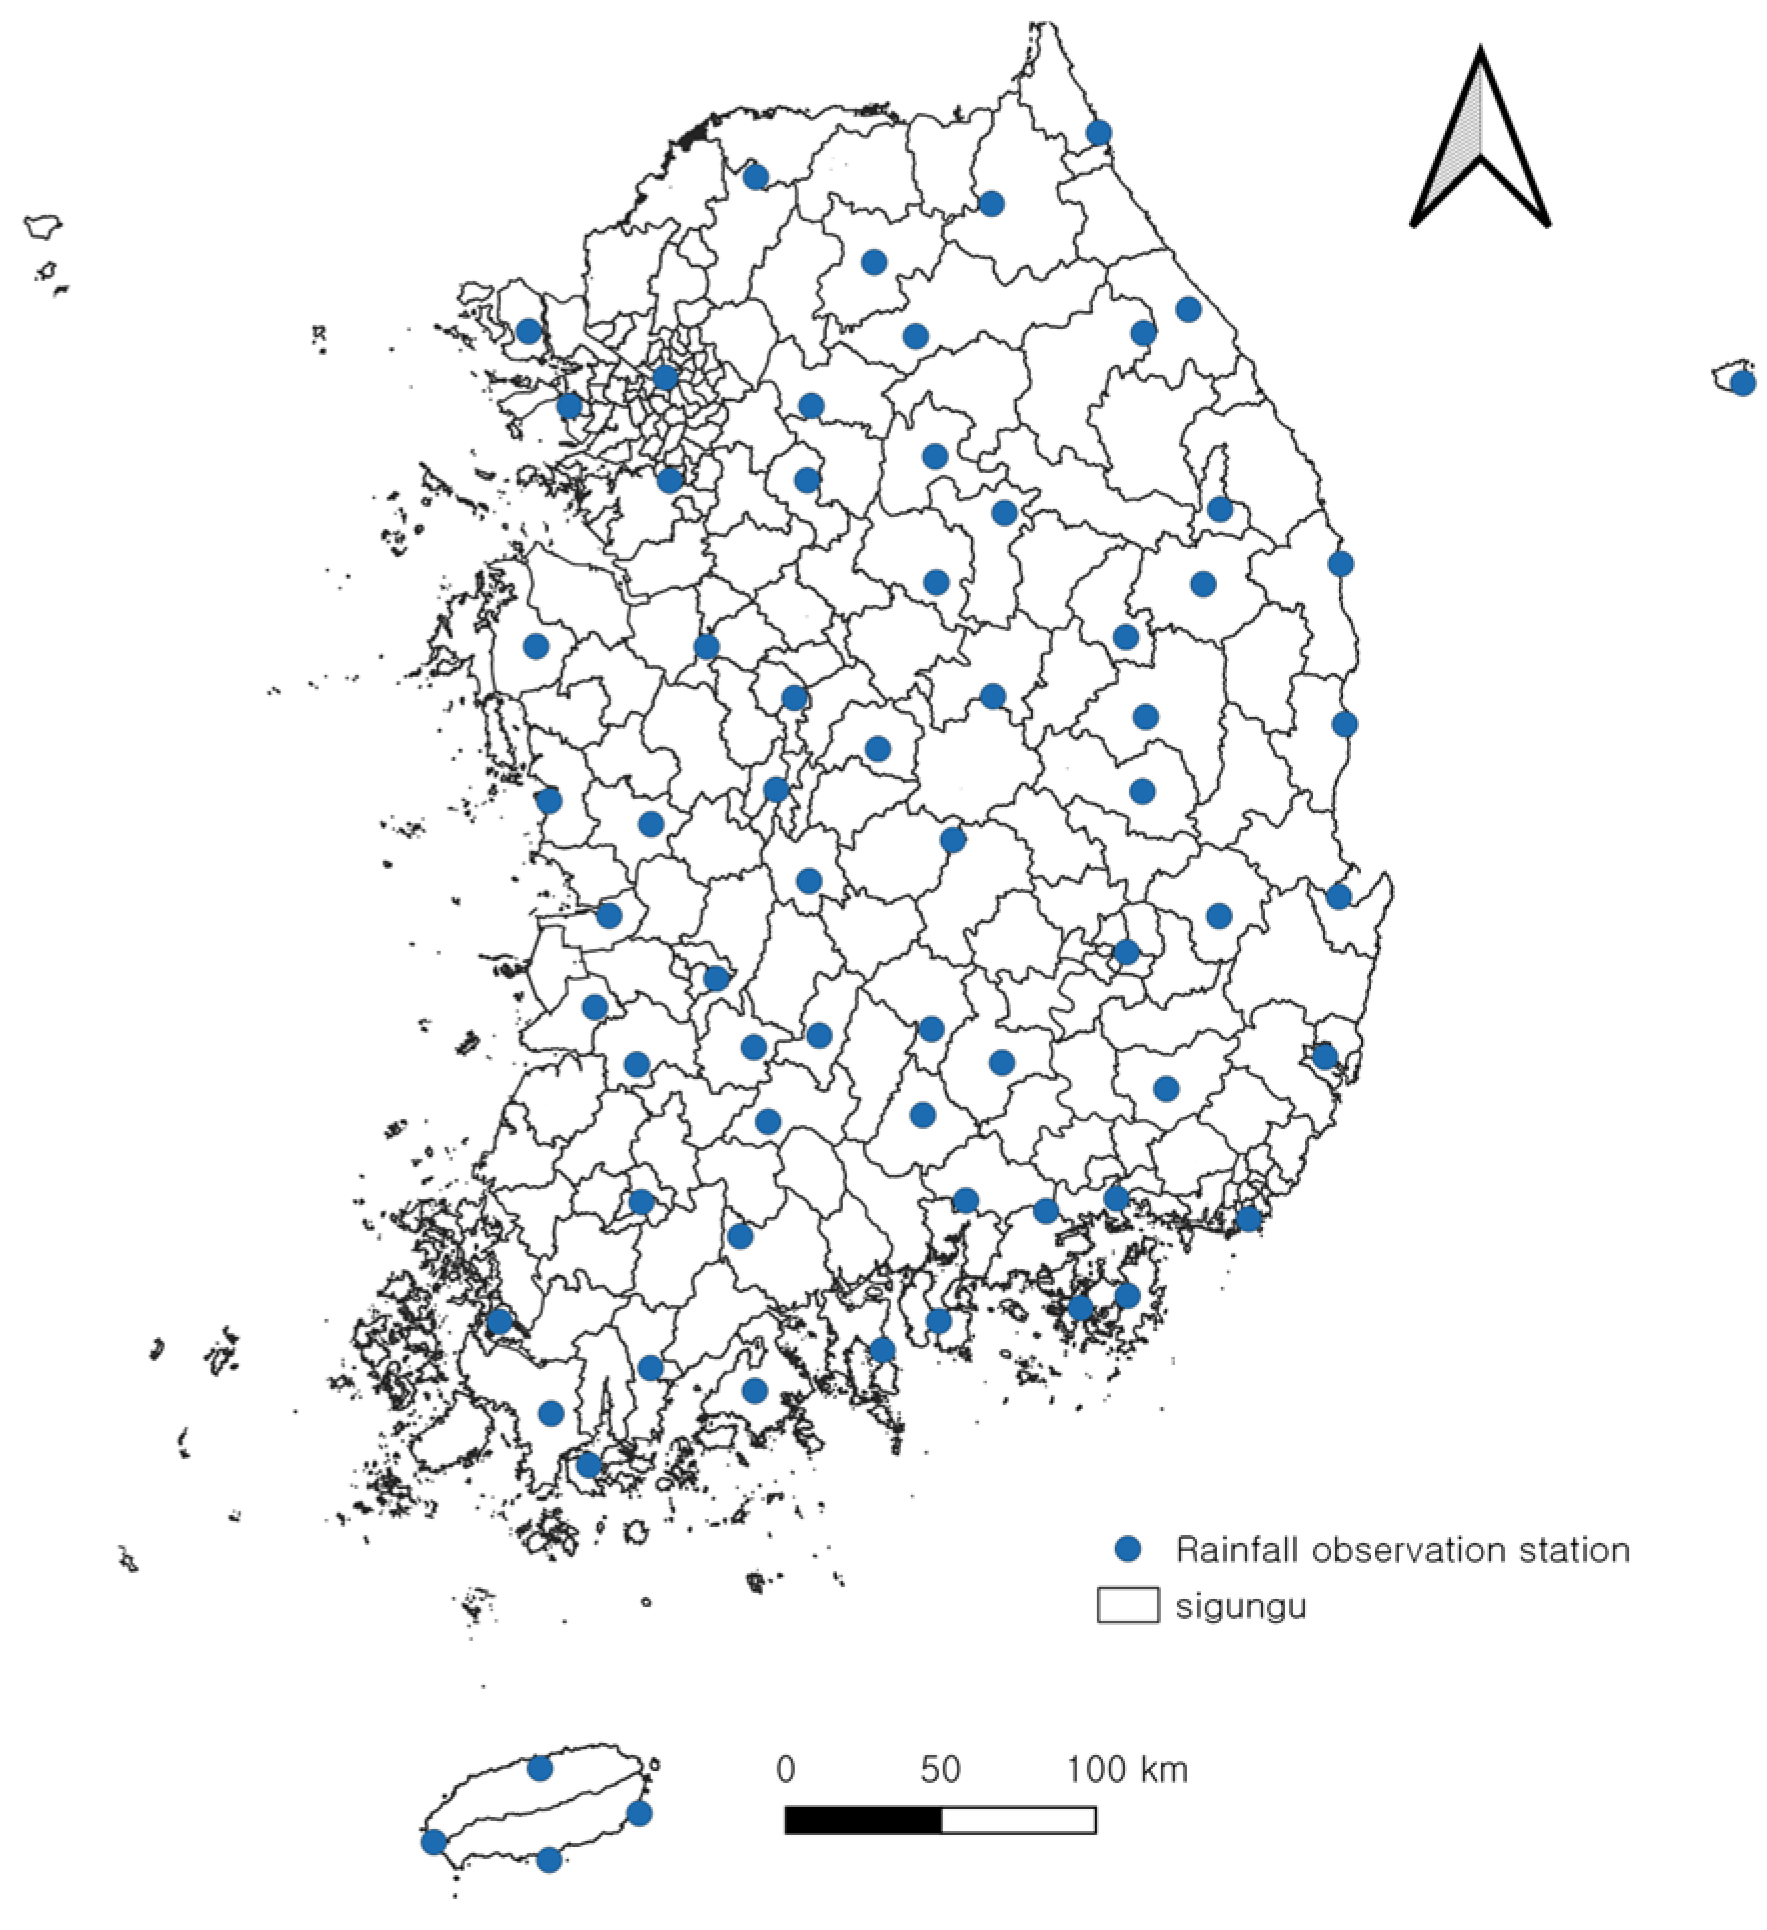
In the context of heavy rainfall disasters, the quantity of precipitation is a pivotal factor in the assessment of damage magnitude. The duration and intensity of rainfall can be categorized based on the magnitude of the damage incurred. The data concerning heavy rainfall disasters reveal the scale and extent of damage by type; therefore, it is imperative to correlate the characteristics of rainfall during the disaster period. The management and operation of Korea’s meteorological data are overseen by the Korea Meteorological Administration (KMA). A network of 68 rainfall observation stations, each with a minimum of 30 years of data, has been established (Figure 6).
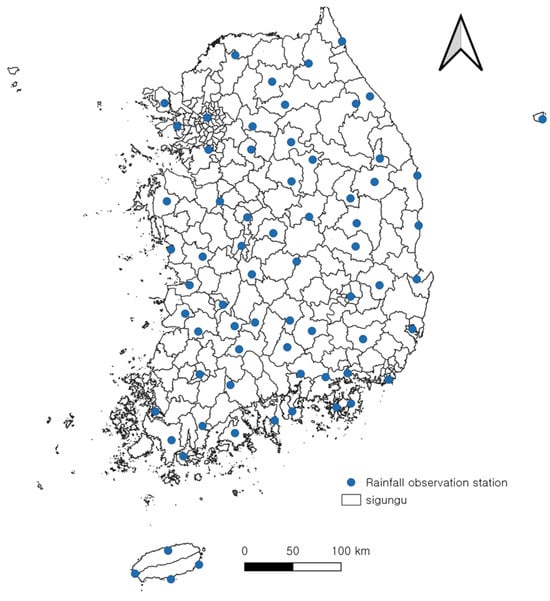
Figure 6.
Status of rainfall stations in South Korea.
A total of 212 heavy rainfall disasters occurred from 1999 to 2019. Rainfall events were analyzed for the disaster period. South Korea has four seasons: spring, summer, fall, and winter. The majority of the heavy rainfall disasters occur in July, August, September, and October, and the climatic characteristics are the same. Rainfall analysis for heavy rainfall disasters applied regional rainfall scenarios for 228 administrative districts. The rainfall characteristics of each administrative district were analyzed using the Thiessen polygon method based on the probability rainfall calculation standard.
The duration of these disasters ranged from one to 21 days, with 70% of the disaster periods occurring within three days. The total number of rainfall days for these events amounted to 703 days, while the average annual disaster period was 33 days. The rainfall characteristics of the heavy rainfall disasters analyzed in this study were divided into rainfall events according to the disaster period, and the rainfall characteristics by disaster period and year are shown in Figure 7.
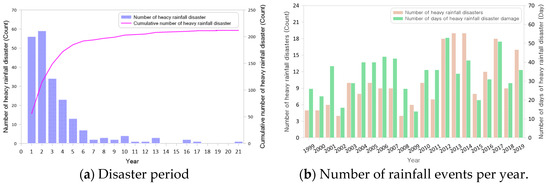
Figure 7.
Duration of heavy rainfall disasters and number of rainfall events (1999–2019).
From 1999 to 2019, the majority of precipitation-related severe weather events in the city and county transpired when the 3-day maximum rainfall equaled the total annual precipitation. The duration of these disasters ranged from one to 21 days; however, the majority of the substantial damage was observed to occur within the first three days of the rainfall events. The total rainfall varied from a minimum of 220 mm to a maximum of 832 mm, with an average of 454 mm and a standard deviation of 122 mm, as analyzed. The ensuing analysis focuses on the relationship between the 1-day maximum rainfall and the 3-day maximum rainfall, as illustrated in Table 3.
Table 3.
Regional rainfall characteristics of heavy rainfall disaster (1999 to 2019).
In this study, the rainfall characteristics of heavy rainfall disasters were applied to the period of occurrence to consider the rainfall characteristics on the day when the damage actually occurred. The duration of a heavy rainfall disaster varies from one to 21 days, but the amount of rainfall that actually causes damage will be proportional to the total rainfall. Therefore, in this study, the period of heavy rainfall disaster was set to the interval that accounts for about 70% of the total rainfall. The rainfall characteristics of each region in terms of heavy rainfall disasters were selected as total rainfall, 1-day maximum rainfall, 2-day maximum rainfall, and 3-day maximum rainfall.
4. Results
4.1. Analysis of Machine Waring Models for Heavy Rainfall Enents
In this study, the predictive capabilities of various machine learning models, namely RF, KNN, DT, and XGBoost, are evaluated for their ability to predict heavy rainfall disasters that occurred from 1999 to 2019. The objective is to select the most effective model. The classification in machine learning is predicated on the prediction of the dependent variable by considering the association between independent variables. In this study, we utilize rainfall data and damage cost data from heavy rainfall disasters to select the most effective classification model for identifying the extent of damage caused by rainfall.
The damage data of heavy rainfall disasters that occurred from 1999 to 2019 is composed of about 90 types of damage characteristics, including public facilities and private facilities. The damage characteristics of heavy rainfall disasters used in this study are data that show the damage scale that occurred in each administrative district. Preprocessing was analyzed by damage type, which can distinguish the damage characteristics of heavy rainfall disasters from data with various damage characteristics. Since each damage characteristic does not cause damage in all heavy rainfall disasters, unnecessary damage characteristics were excluded in the data preprocessing stage. Therefore, the damage costs of buildings, ships, agricultural land, public facilities, and private facilities were selected for each sector in heavy rainfall disasters.
The training period for the evaluation of the predictive power of heavy rainfall disasters is from 1999 to 2015, and 158 rainfall events and 5698 municipalities were selected. The evaluation period encompasses the years from 2016 to 2019, during which 54 rainfall events and 1204 municipalities were selected. In South Korea, heavy rainfall disasters occur once every 10 years with large-scale damage and once every five years with medium-scale damage. The largest damage costs occurred in 2002 and 2004, followed by 2016. In addition, extreme droughts occurred in 1994, 2008, and 2018. This study classified the learning and evaluation periods in consideration of the variability of these disasters. Four machine learning models were utilized to assess the predictive capability, with total damage serving as the dependent variables, four categories of rainfall as independent variables, and five types of damage as independent variables (Table 4).
Table 4.
Evaluation criteria for heavy rainfall disaster prediction models.
The relationship between rainfall events and damage costs by disaster period of heavy rainfall disaster is deviated by various local characteristics, such as budget and urban development of the city and county, causing data imbalance. Even with the same rainfall, the characteristics of damage costs differ by region due to differences in terrain characteristics, mitigation facilities, and response personnel. Furthermore, the disproportionate impact of the disaster relative to other disasters may have led to the high damage costs.The data imbalance can be addressed to enhance predictive performance. To this end, this study employed the Synthetic Minority Over-sampling Technique (SMOTE) during the training period to compensate for the imbalance in the data used for analysis. In this study, the Synthetic Minority Over-sampling Technique (SMOTE) was employed to address the imbalance in the data utilized for analysis.
The SMOTE method is one of the methodologies developed to address data imbalance. The SMOTE method is an over sampling technique that involves the selection of a sample from a category with a limited number of data points and the addition of new samples by assigning random values to the existing data points within that category, thereby creating a new sample [60,61]. The conceptual diagram illustrating the SMOTE method is presented in Figure 8.

Figure 8.
SMOTE structure.
Four machine learning models and nine independent variables were selected and analyzed to predict the total amount of damage caused by a heavy rainfall disaster. Hyperparameter tuning was applied to prevent overfitting and optimize performance in model analysis for predicting damage from heavy rainfall disasters. GridSearchCV was applied to find the optimal combination method, which requires a lot of computation, by exploring all combinations during hyperparameter tuning.
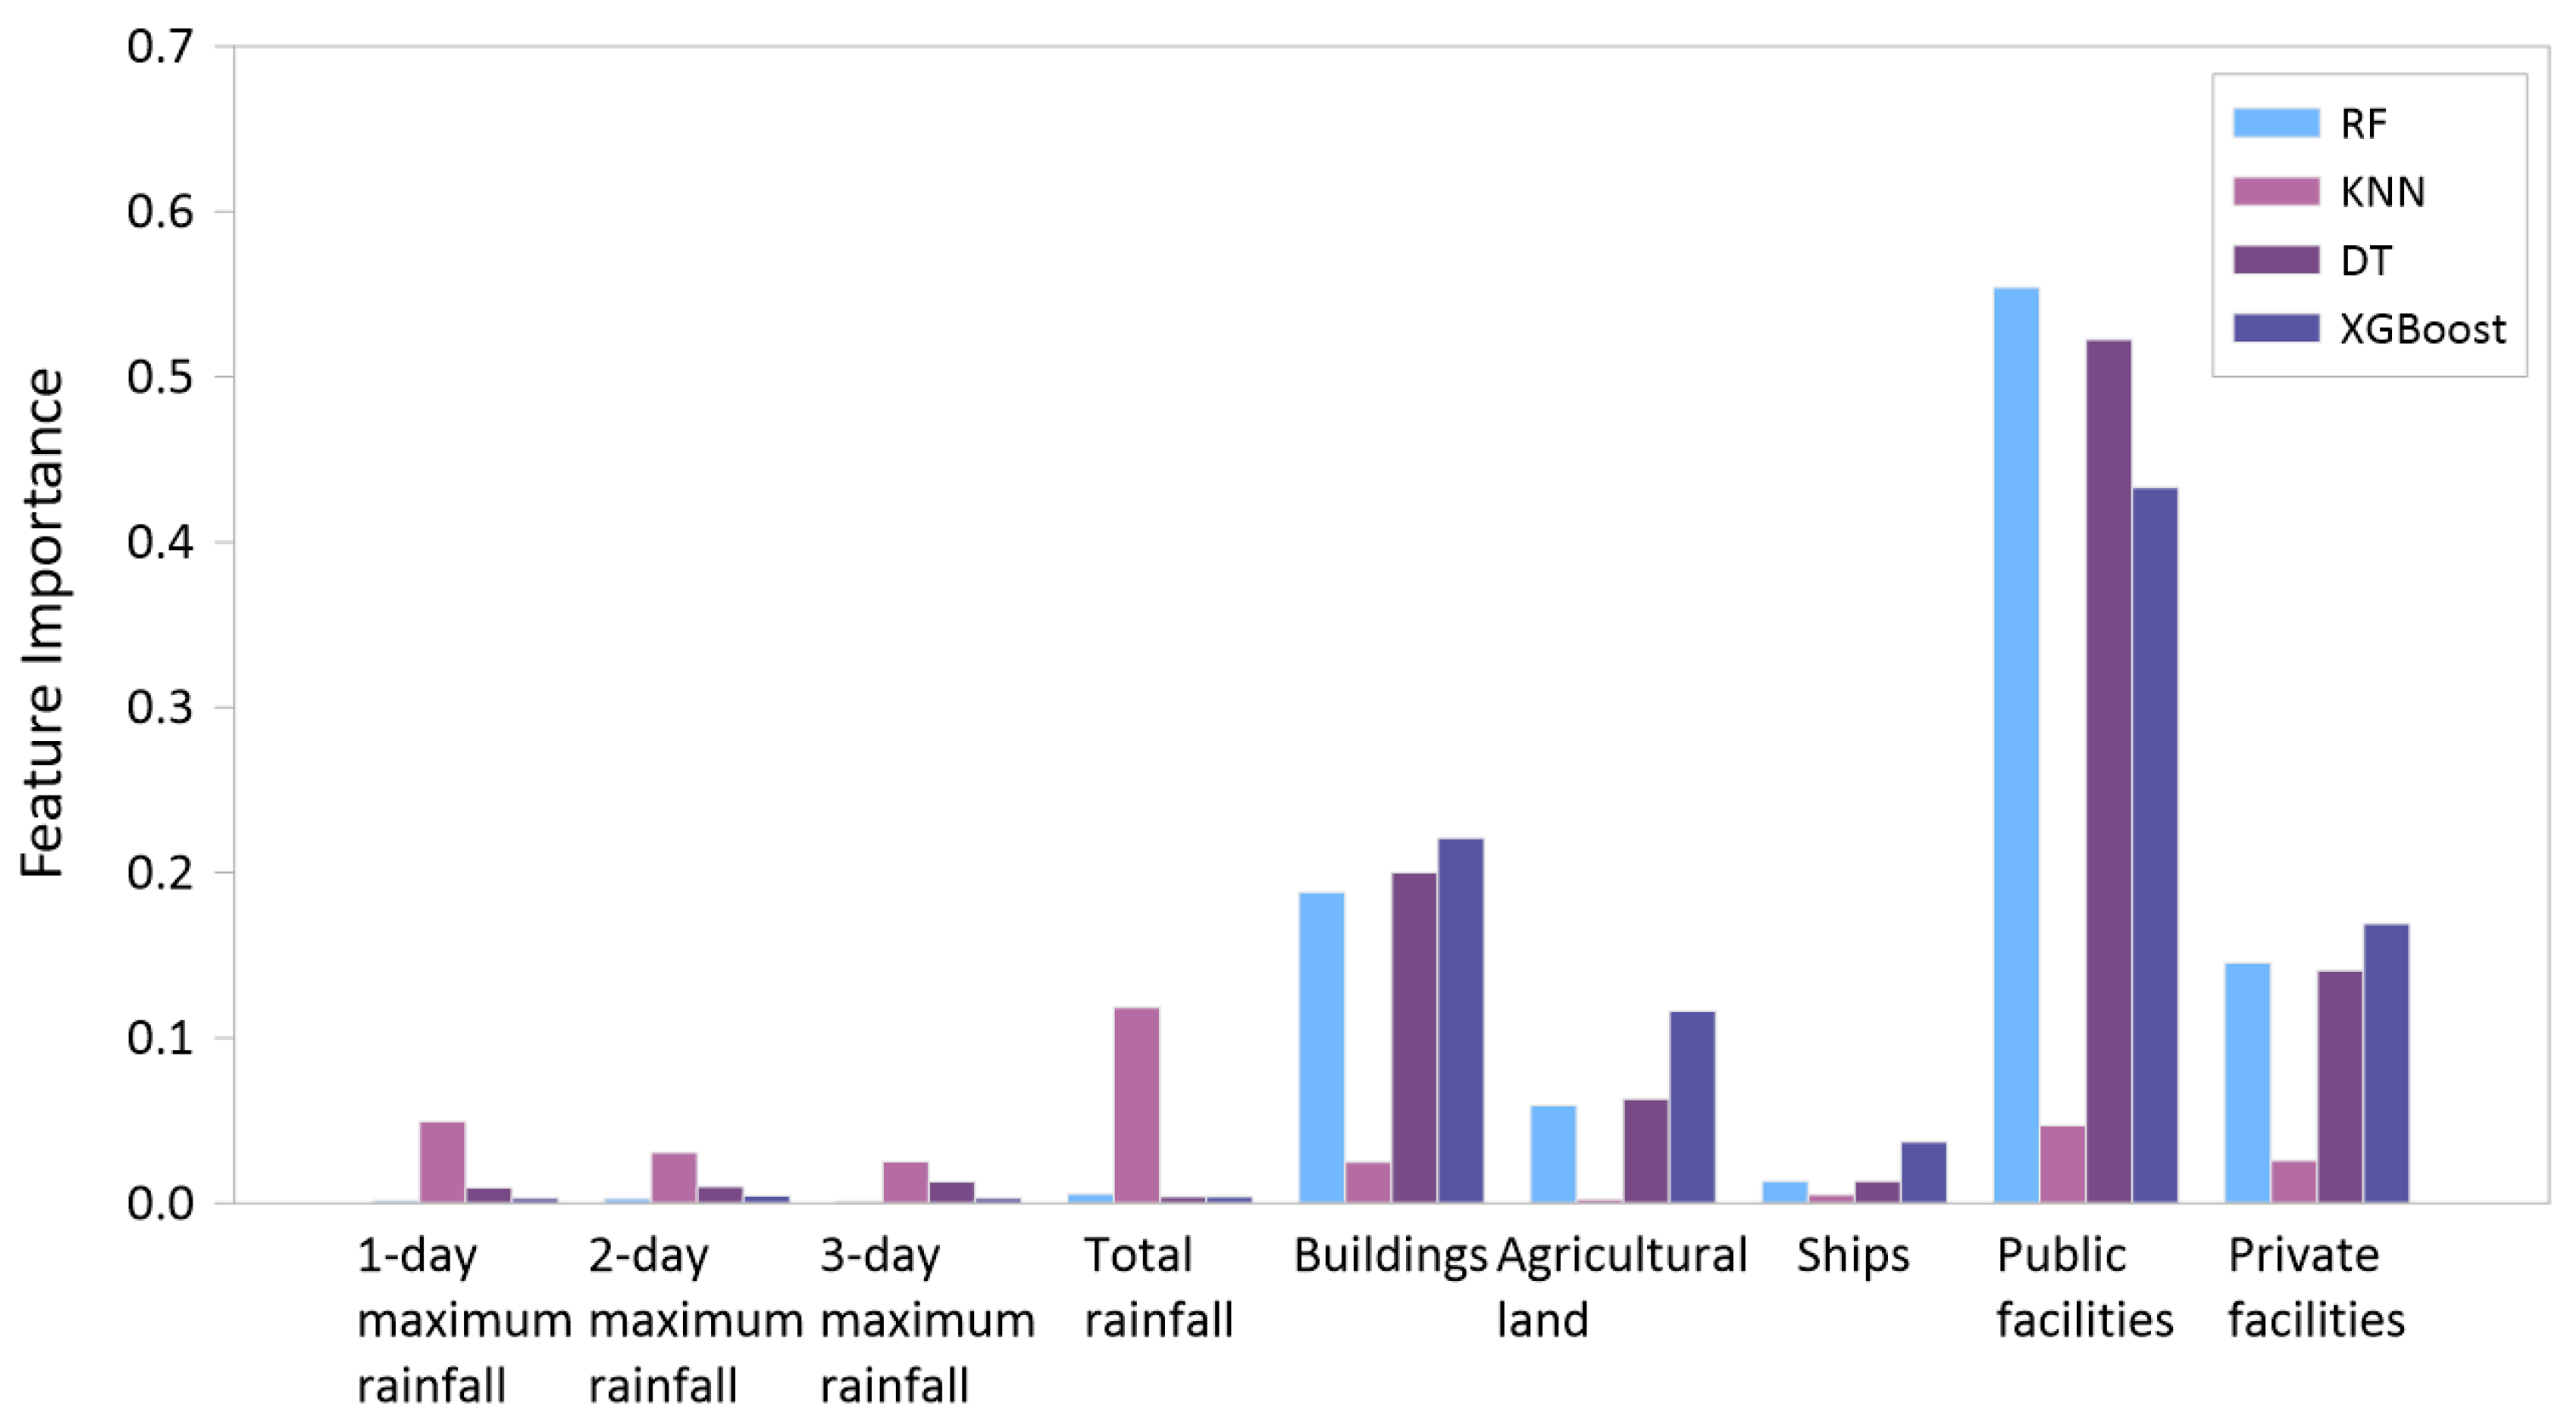
The variable importance analysis was conducted to ascertain the relative significance of the nine independent variables in predicting and classifying the total damage costs. The ensuing discourse expounds on the significance of each variable in predicting and classifying the total damage costs associated with the aforementioned heavy rainfall disaster. The feature importance of the model and independent variables is illustrated in Figure 9.
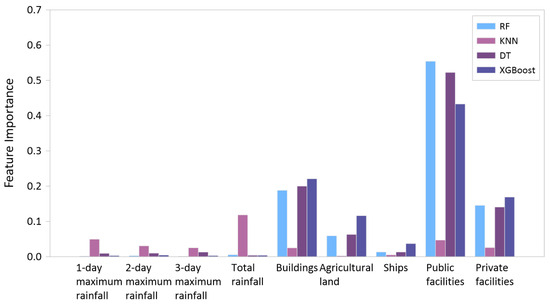
Figure 9.
Assessing feature importance for heavy rainfall events.
The feature importance of the heavy rainfall disaster exhibited varied outcomes contingent on the machine learning model employed. In the rainfall category, the KNN model analyzed the feature importance below 0.1. In contrast, RF, DT, and XGBoost exhibited relatively high variable importance in cases involving the analysis of non-rainfall variables (Table 5). The feature importance was analyzed in the order of public facilities, private facilities, buildings, and agricultural land, which are highly related to the total damage costs.
Table 5.
Feature importance of the heavy rainfall disaster in machine learning models for independent variables.
4.2. Accurancy Evaluation of Heavy Rainfall Events
In this study, the accuracy of prediction and classification of total damage costs considering the rainfall event for heavy rainfall disaster was evaluated. To this end, we implemented a variety of machine learning models, including RF, KNN, DT, and XGBoost. To evaluate the linear relationship between the actual and predicted values, it selected the evaluation indicators for the regression model for , EVS and MAPE.
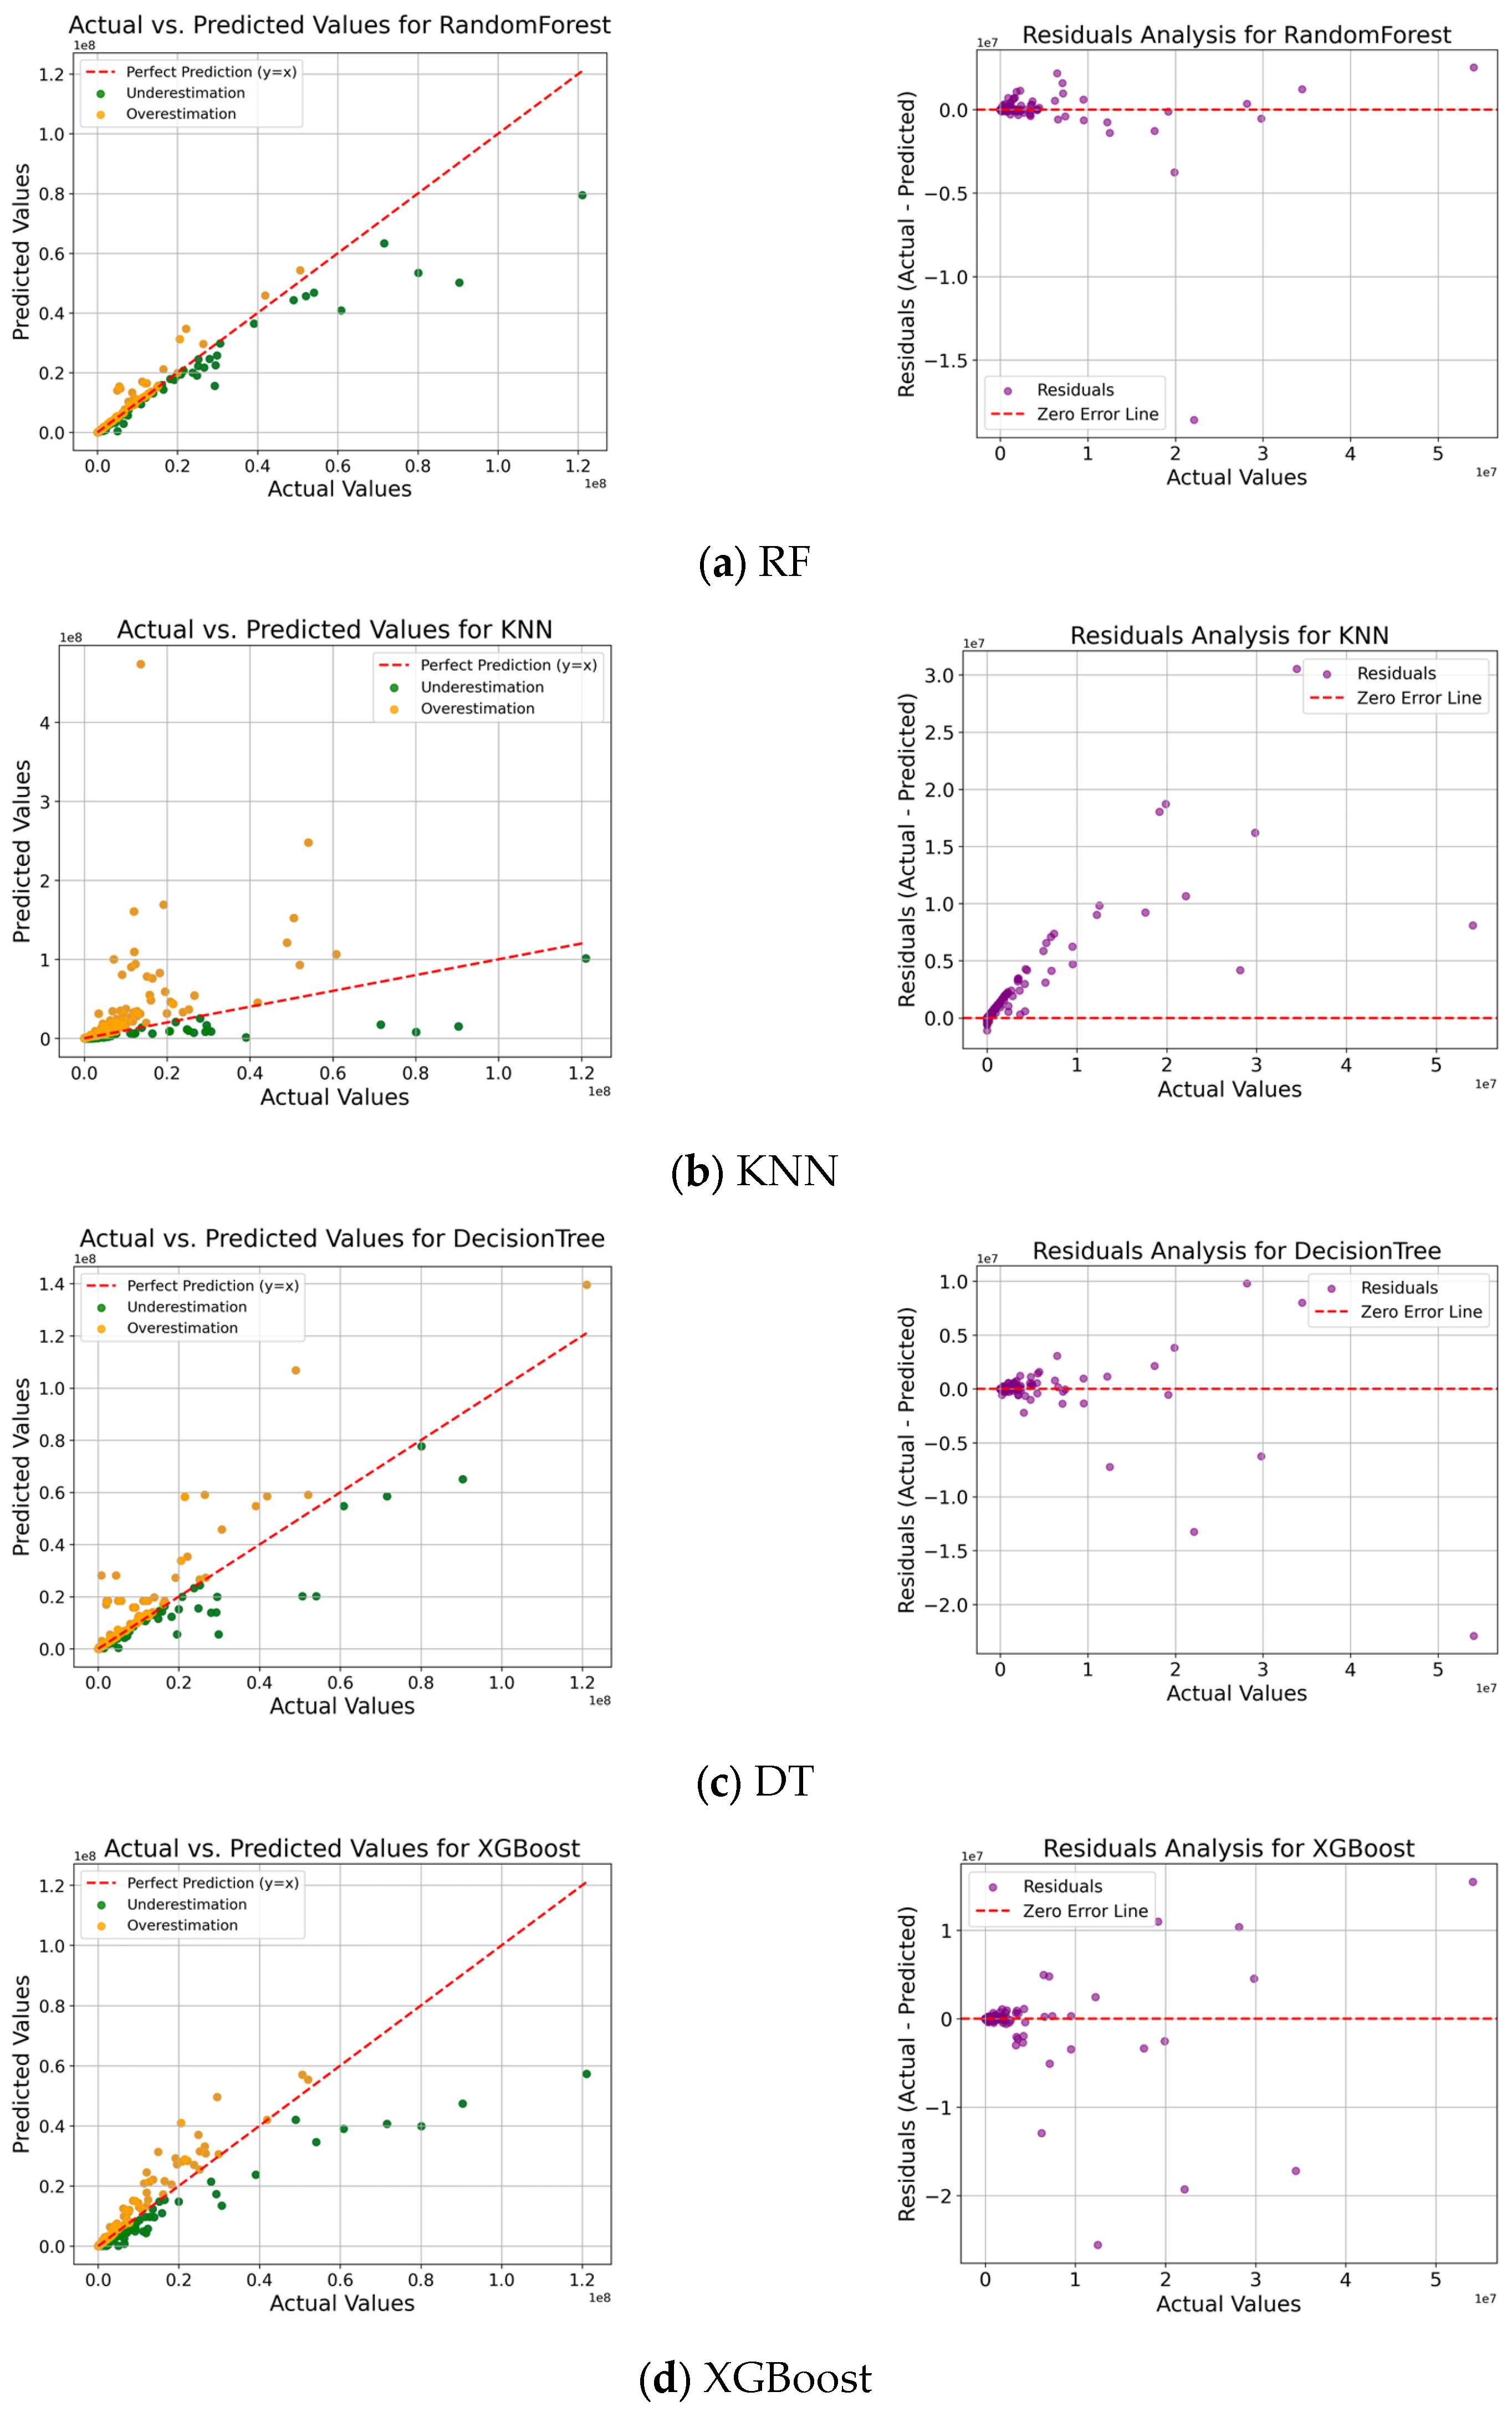
The analysis results of the ML models are presented using a scatter plot and residual analysis plot as shown in Figure 10. In the scatter plot, green is used to represent an underestimated value and orange is used to represent an overestimated value based on the red dotted line. In the scatter plot, RF showed the best predictive performance, and KNN and DT were analyzed for their problems of rapidly deteriorating predictive power when the damage scale is large. XGBoost showed relatively good performance, but it tended to underestimate when the damage scale was large.
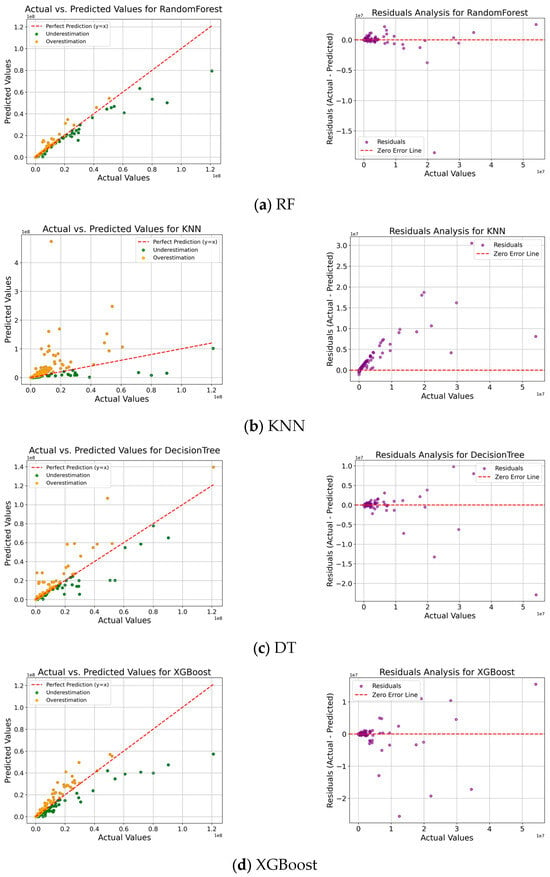
Figure 10.
Analyzing actual and predicted values of total damages for a heavy rainfall event.
The residual analysis graph shows purple as the residual value based on the red dotted line. The residual analysis graph showed that RF had the lowest prediction error and the residuals were evenly distributed, indicating high reliability. On the other hand, the KNN and DT were analyzed to have low prediction stability, with errors increasing rapidly as the damage scale increased. The XGBoost model performed well overall, but consistently showed a pattern of underestimation when the damage scale was large.
The accuracy evaluation of the actual and predicted values for the total damage costs of the heavy rainfall disaster is available at , and the EVS is to 1.0. It can be concluded that the closer the MAPE is to 0.0, the more accurate the model is. The accuracy evaluation results of the model for heavy rainfall disaster are shown in Table 6.
Table 6.
Results of evaluating the accuracy of heavy rainfall events for machine learning models.
ANOVA (Analysis of Variance) was used to evaluate whether the performance differences of in ML models were statistically significant. ANOVA is a method to test whether the performance of a model is statistically significant, and was evaluated for , EVS, and MAPE, and the results are shown in Table 7. The performance index of the analysis result evaluation method of ANOVA was p-value < 0.05, indicating that the performance difference between ML models was statistically significant. In particular, the p-value of EVS was 3.08 × 10⁻⁹ and MAPE was 7.14 × 10⁻⁹, indicating that the prediction error was significant.
Table 7.
Performance evaluation results for machine learning models using ANOVA.
In this study, the accuracy of the rainfall event and the total damage cost of the heavy rainfall disaster were analyzed using , EVS, and MAPE, and the model performance was analyzed using ANOVA. RF showed the highest weighted analysis results in ML models. Since the damage characteristics of heavy rainfall disasters are non-linear, the RF model based on the tree is the most effective for learning. In the case of KNNs, the model is based on distance, so performance deteriorates in data with non-linearity. RF was evaluated to have better generalization performance than DT and more stable performance than XGBoost by combining multiple decision trees. Therefore, RF is considered to be the most reasonable model for predicting damage by evaluating the importance of the characteristics of damage from heavy rainfall disasters.
5. Discussion
ML models for classification and prediction of heavy rainfall disasters have been applied in various fields. Recently, many studies have been conducted to select the optimal model by comparing several ML models [8,9,10,11,12,13,14,15,16,17,18]. In this study, we analyzed the RF, KNNs, DT, and XGBoost of ML models for predicting the damage cost of heavy rainfall disasters, and their accuracy was evaluated by , EVS, and MAPE.
The most accurate model for predicting the damage amount for the heavy rainfall disaster was RF with R2 of 0.95, EVS of 0.95, and MAPE of 0.05. Evaluations of predictive models linking damage levels to heavy rainfall events have shown an accuracy of about 96% for Canada, 100% for Indonesia, and 70% to 98% for China [15,33,34,35]. Evaluation of prediction models that link meteorological data to heavy rainfall disasters showed an accuracy of 95.8% in Korea, 83.48% in China, and 85% in China when considering networks [8,29,37]. Considering the accuracy of this study and the accuracy of previous studies, it is judged that useful results have been obtained.
In previous studies, RF and AdaBoost showed the highest accuracy in predictions using DT, Bagging, AdaBoost, and RF models [7,15]. In studies using rainfall, river discharge, and water level data, SVM showed the best performance [34,35,36]. In addition, a study using XGBoost reported a higher prediction accuracy than RF [8]. In a study that linked rainfall data with economic losses, the RF model showed the best performance and was evaluated as having high potential for use in predicting economic damage [33]. In a risk assessment of rainfall disasters considering typhoons, the RF model was analyzed as the model with the highest topographic accuracy [29].
In this study, the XGBoost model also showed relatively high performance, but it was found that it tended to underestimate when the damage scale was large, which can be interpreted as a problem that occurs when the normalization technique of XGBoost is adjusted to prevent overestimation of extreme damage data. On the other hand, the RF model had the highest prediction accuracy, and it was found to be a suitable model for predicting the damage caused by rainfall disasters because it had a balanced number of underestimations and overestimations.
The results of this study can be used not only for predicting the damage from rainfall disasters, but also for disaster response and policy-making, and can contribute to the establishment of an efficient disaster prevention and response system by predicting the damage scale in advance. In particular, the predictive model can be used to shift policies to a method of allocating budgets in advance before damage occurs, and to expand disaster prevention infrastructure and improve early response systems in regions where damage is expected.
6. Conclusions
In this study, a prediction model was developed to estimate the total damage cost of heavy rainfall disasters that occurred in Korea from 1999 to 2019. The ML models are RF, KNN, DT, and XGBoost, and the accuracy of the predicted value and the actual value are , EVS, and MAPE, which evaluate the performance of the regression model. Four rainfall characteristics of the disaster period and five damage costs were selected as independent variables for predicting heavy rainfall disasters.
The analysis showed that the RF model had the highest prediction accuracy with R2 = 0.95, EVS = 0.95, and MAPE = 0.05, and it was found that it maintained stable prediction performance even when the damage scale was large. The XGBoost model also showed relatively high performance, but it was found that it tended to underestimate as the damage scale increased, and the KNN and DT models had relatively low prediction accuracy.
The feature importance for ML models was analyzed using KNN for rainfall characteristics and RF, DT, and XGBoost for damage costs. For buildings, agricultural land, ships, and private facilities, feature importance was analyzed in the order of XGBoost, DT, and RF. However, for public facilities, the order of importance was RF, DT, and XGBoost.
An evaluation was conducted to determine the most accurate model for predicting the total damage cost of heavy rainfall disasters. The models evaluated were RF, DT, XGBoost, and KNN. The evaluation results showed that most of the models had high accuracy for small damage costs. However, RF had relatively high predictive power for large damage costs. Therefore, RF was determined to be the best model for predicting the total damage cost for heavy rainfall disasters.
The results of this study are similar to the accuracy of heavy rainfall disaster damage prediction reported in previous studies (96% in Canada, 100% in Indonesia, 70–98% in China, and 95.8% in Korea), suggesting that the ML-based prediction model developed in this study can be effectively used to predict heavy rainfall disaster damage.
The results of this study provide a method for estimating the damage amount for a limited type of disaster, namely heavy rainfall and typhoon, based on the regional characteristics of Korea. The results of the study are expected to be used as basic data for national budgeting, disaster mitigation, and disaster prevention for heavy rainfall disaster damage. In future research, it is expected that high-precision research results will be presented if the damage scale of heavy rainfall disasters and the impact of rainfall intensity on the temporal rainfall are analyzed.
Author Contributions
Conceptualization, Y.S. and S.Y.K.; methodology, Y.S.; software, S.Y.K.; validation, Y.S., Y.H.S. and M.P.; formal analysis, M.P.; investigation, Y.S.; resources, Y.H.S.; data curation, Y.S.; writing—original draft preparation, Y.S. and S.Y.K.; writing—review and editing, Y.S. and S.Y.K.; visualization, Y.H.S.; supervision, M.P.; project administration, M.P.; funding acquisition, Y.S. All authors have read and agreed to the published version of the manuscript.
Funding
This research received no external funding. And The APC was funded by [Climate].
Data Availability Statement
This data are analyzed based on a book report and have not been published on the site.
Acknowledgments
This paper was supported by Konkuk University in 2024.
Conflicts of Interest
The authors declare no conflicts of interest.
References
- Agrawala, S. Context and Early Origins of the Intergovernmental Panel on Climate Change. Clim. Change 1998, 39, 605–620. [Google Scholar] [CrossRef]
- Zhang, W.; Villarini, G.; Vecchi, G.A.; Smith, J.A. Urbanization exacerbated the rainfall and flooding caused by hurricane Harvey in Houston. Nature 2018, 563, 384–388. [Google Scholar] [CrossRef] [PubMed]
- Zeleňáková, M.; Fijko, R.; Labant, S.; Weiss, E.; Markovič, G.; Weiss, R. Flood risk modelling of the Slatvinec stream in Kružlov village, Slovakia. J. Clean. Prod. 2019, 212, 109–118. [Google Scholar] [CrossRef]
- Aziz, K.; Rahman, A.; Fang, G.; Shrestha, S. Application of artificial neural networks in regional flood frequency analysis: A case study for Australia. Stoch. Environ. Res. Risk Assess. 2014, 28, 541–554. [Google Scholar] [CrossRef]
- Mekanik, F.; Imteaz, M.A.; Gato-Trinidad, S.; Elmahdi, A. Multiple regression and Artificial Neural Network for long-term rainfall forecasting using large scale climate modes. J. Hydrol. 2013, 503, 11–21. [Google Scholar] [CrossRef]
- Xu, Z.X.; Li, J.Y. Short-term inflow forecasting using an artificial neural network model. Hydrol. Process. 2002, 16, 2423–2439. [Google Scholar] [CrossRef]
- Choi, C.; Park, K.; Park, H.; Lee, M.; Kim, J.; Kim, H.S. Development of Heavy Rain Damage Prediction Function for Public Facility Using Machine Learning. J. Korean Soc. Hazard Mitig. 2017, 17, 443–450. [Google Scholar] [CrossRef]
- Choi, C.; Kim, J.; Kim, J.; Kim, D.; Bae, Y.; Kim, H.S. Development of Heavy Rain Damage Prediction Model Using Machine Learning Based on Big Data. Adv. Meteorol. 2018, 2018, 5024930. [Google Scholar] [CrossRef]
- Wang, W.; Li, J.; Qu, X.; Han, Z.; Liu, P. Prediction on landslide displacement using a new combination model: A case study of Qinglong landslide in China. Nat. Hazards 2019, 96, 1121–1139. [Google Scholar] [CrossRef]
- Zanchetta, A.D.L.; Coulibaly, P. Recent Advances in Real-Time Pluvial Flash Flood Forecasting. Water 2020, 12, 570. [Google Scholar] [CrossRef]
- Rodrigues, M.; de la Riva, J. An insight into machine-learning algorithms to model human-caused wildfire occurrence. Environ. Model. Softw. 2014, 57, 192–201. [Google Scholar] [CrossRef]
- Srivastava, S. On Foveation of Deep Neural Networks. Master’s Thesis, Massachusetts Institute of Technology, Cambridge, MA, USA, 2019. [Google Scholar]
- Jaafari, A.; Zenner, E.K.; Panahi, M.; Shahabi, H. Hybrid artificial intelligence models based on a neuro-fuzzy system and metaheuristic optimization algorithms for spatial prediction of wildfire probability. Agric. For. Meteorol. 2019, 266–267, 198–207. [Google Scholar] [CrossRef]
- Mann, M.L.; Warner, J.M.; Malik, A.S. Predicting high-magnitude, low-frequency crop losses using machine learning: An application to cereal crops in Ethiopia. Clim. Change 2019, 154, 211–227. [Google Scholar] [CrossRef]
- Haggag, M.; Siam, A.S.; El-Dakhakhni, W.; Coulibaly, P.; Hassini, E. A deep learning model for predicting climate-induced disasters. Nat. Hazards 2021, 107, 1009–1034. [Google Scholar] [CrossRef]
- Cholissodin, I.; Sutrisno, S. Prediction of Rainfall using Simplified Deep Learning based Extreme Learning Machines. J. Inf. Technol. Comput. Sci. 2018, 3, 120–131. [Google Scholar] [CrossRef]
- Tien Bui, D.; Hoang, N.-D.; Martínez-Álvarez, F.; Ngo, P.-T.T.; Hoa, P.V.; Pham, T.D.; Samui, P.; Costache, R. A novel deep learning neural network approach for predicting flash flood susceptibility: A case study at a high frequency tropical storm area. Sci. Total Environ. 2020, 701, 134413. [Google Scholar] [CrossRef] [PubMed]
- Ganguly, K.K.; Nahar, N.; Hossain, B.M.M. A machine learning-based prediction and analysis of flood affected households: A case study of floods in Bangladesh. Int. J. Disaster Risk Reduct. 2019, 34, 283–294. [Google Scholar] [CrossRef]
- Appiah-Badu, N.K.A.; Missah, Y.M.; Amekudzi, L.K.; Ussiph, N.; Frimpong, T.; Ahene, E. Rainfall Prediction Using Machine Learning Algorithms for the Various Ecological Zones of Ghana. IEEE Access 2022, 10, 5069–5082. [Google Scholar] [CrossRef]
- Mohd, R.; Ahmed Butt, M.; Baba, M.Z. Comparative Study of Rainfall Prediction Modeling Techniques (A Case Study on Srinagar, J&K, India). Asian J. Comput. Sci. Technol. 2018, 7, 13–19. [Google Scholar] [CrossRef]
- Balram, G.; Poornachandrarao, N.; Ganesh, D.; Nagesh, B.; Basi, R.A.; Kumar, M.S. Application of Machine Learning Techniques for Heavy Rainfall Prediction using Satellite Data. In Proceedings of the 2024 5th International Conference on Smart Electronics and Communication (ICOSEC), Trichy, India, 18–20 September 2024; pp. 1081–1087. [Google Scholar]
- Yuan, X.; Zhang, X.-C.; Wang, X.-G.; Zhang, Y. Flood disaster monitoring based on Sentinel-1 data: A case study of Sihu Basin and Huaibei Plain, China. Water Sci. Eng. 2021, 14, 87–96. [Google Scholar] [CrossRef]
- Jongman, B.; Wagemaker, J.; Romero, B.R.; De Perez, E.C. Early Flood Detection for Rapid Humanitarian Response: Harnessing Near Real-Time Satellite and Twitter Signals. ISPRS Int. J. Geo-Inf. 2015, 4, 2246–2266. [Google Scholar] [CrossRef]
- Feng, Y.; Sester, M. Extraction of Pluvial Flood Relevant Volunteered Geographic Information (VGI) by Deep Learning from User Generated Texts and Photos. ISPRS Int. J. Geo-Inf. 2018, 7, 39. [Google Scholar] [CrossRef]
- Picon, A.; Alvarez-Gila, A.; Irusta, U.; Echazarra, J. Why deep learning performs better than classical machine learning. Dyna Ing. Ind. 2020, 95, 119–122. [Google Scholar]
- Bai, H.; Yu, H.; Yu, G.; Huang, X. A novel emergency situation awareness machine learning approach to assess flood disaster risk based on Chinese Weibo. Neural Comput. Appl. 2022, 34, 8431–8446. [Google Scholar] [CrossRef]
- Lai, C.; Chen, X.; Zhao, S.; Wang, Z.; Wu, X. A flood risk assessment model based on random forest and its application. J. Hydraul. Eng. 2015, 46, 58–66. [Google Scholar]
- Feng, Q.; Liu, J.; Gong, J. Urban Flood Mapping Based on Unmanned Aerial Vehicle Remote Sensing and Random Forest Classifier—A Case of Yuyao, China. Water 2015, 7, 1437. [Google Scholar] [CrossRef]
- Liu, Y.; Lu, X.; Yao, Y.; Wang, N.; Guo, Y.; Ji, C.; Xu, J. Mapping the risk zoning of storm flood disaster based on heterogeneous data and a machine learning algorithm in Xinjiang, China. J. Flood Risk Manag. 2021, 14, e12671. [Google Scholar] [CrossRef]
- Liu, H.; Hao, Y.; Zhang, W.; Zhang, H.; Gao, F.; Tong, J. Online urban-waterlogging monitoring based on a recurrent neural network for classification of microblogging text. Nat. Hazards Earth Syst. Sci. 2021, 21, 1179–1194. [Google Scholar] [CrossRef]
- Avand, M.; Moradi, H.; Lasboyee, M.R. Using machine learning models, remote sensing, and GIS to investigate the effects of changing climates and land uses on flood probability. J. Hydrol. 2021, 595, 125663. [Google Scholar] [CrossRef]
- Wu, Z.; Shen, Y.; Wang, H.; Wu, M. Urban flood disaster risk evaluation based on ontology and Bayesian Network. J. Hydrol. 2020, 583, 124596. [Google Scholar] [CrossRef]
- Jiang, Z.; Yang, S.; Liu, Z.; Xu, Y.; Xiong, Y.; Qi, S.; Pang, Q.; Xu, J.; Liu, F.; Xu, T. Coupling machine learning and weather forecast to predict farmland flood disaster: A case study in Yangtze River basin. Environ. Model. Softw. 2022, 155, 105436. [Google Scholar] [CrossRef]
- Fitriyaningsih, I.; Basani, Y. Prediksi Kejadian Banjir dengan Ensemble Machine Learning Menggunakan BP-NN dan SVM. J. Teknol. Dan Sist. Komput. 2019, 7, 93–97. [Google Scholar] [CrossRef]
- Wahyono, I.D.; Asfani, K.; Aripriharta; Fadlika, I.; Jong, G.J. New Method of Artificial Intelligence for Disaster Information Floods use Distributed Wireless Sensors. In Proceedings of the 2019 International Seminar on Application for Technology of Information and Communication (iSemantic), Semarang, Indonesia, 21–22 September 2019; pp. 1–5. [Google Scholar]
- Riza, H.; Santoso, E.W.; Tejakusuma, I.G.; Prawiradisastra, F. Advancing Flood Disaster Mitigation in Indonesia Using Machine Learning Methods. In Proceedings of the 2020 International Conference on ICT for Smart Society (ICISS), Bandung, Indonesia, 19–20 November 2020; pp. 1–4. [Google Scholar]
- Keum, H.J.; Han, K.Y.; Kim, H.I. Real-Time Flood Disaster Prediction System by Applying Machine Learning Technique. KSCE J. Civ. Eng. 2020, 24, 2835–2848. [Google Scholar] [CrossRef]
- Zhu, H.; Leandro, J.; Lin, Q. Optimization of Artificial Neural Network (ANN) for Maximum Flood Inundation Forecasts. Water 2021, 13, 2252. [Google Scholar] [CrossRef]
- Tehrany, M.S.; Pradhan, B.; Mansor, S.; Ahmad, N. Flood susceptibility assessment using GIS-based support vector machine model with different kernel types. Catena 2015, 125, 91–101. [Google Scholar] [CrossRef]
- Wang, Z.; Lai, C.; Chen, X.; Yang, B.; Zhao, S.; Bai, X. Flood hazard risk assessment model based on random forest. J. Hydrol. 2015, 527, 1130–1141. [Google Scholar] [CrossRef]
- Al-Juaidi, A.E.M.; Nassar, A.M.; Al-Juaidi, O.E.M. Evaluation of flood susceptibility mapping using logistic regression and GIS conditioning factors. Arab. J. Geosci. 2018, 11, 765. [Google Scholar] [CrossRef]
- Ma, M.; Zhao, G.; He, B.; Li, Q.; Dong, H.; Wang, S.; Wang, Z. XGBoost-based method for flash flood risk assessment. J. Hydrol. 2021, 598, 126382. [Google Scholar] [CrossRef]
- Ying, X. An Overview of Overfitting and its Solutions. J. Phys. Conf. Ser. 2019, 1168, 022022. [Google Scholar] [CrossRef]
- Breiman, L. Random Forests. Mach. Learn. 2001, 45, 5–32. [Google Scholar] [CrossRef]
- Liaw, A.; Wiener, M. Classification and regression by randomForest. R News 2002, 2, 18–22. [Google Scholar]
- Amit, Y.; Geman, D. Shape Quantization and Recognition with Randomized Trees. Neural Comput. 1997, 9, 1545–1588. [Google Scholar] [CrossRef]
- Tin Kam, H. The random subspace method for constructing decision forests. IEEE Trans. Pattern Anal. Mach. Intell. 1998, 20, 832–844. [Google Scholar] [CrossRef]
- Liu, S.; Zhang, Z. A multi-stage prediction KNN algorithm based on center vector. Comput. Eng. Sci. 2017, 39, 1758–1764. [Google Scholar]
- Zhang, S.; Li, X.; Zong, M.; Zhu, X.; Cheng, D. Learning k for kNN Classification. ACM Trans. Intell. Syst. Technol. 2017, 8, 43. [Google Scholar] [CrossRef]
- Cover, T.; Hart, P. Nearest neighbor pattern classification. IEEE Trans. Inf. Theory 1967, 13, 21–27. [Google Scholar] [CrossRef]
- Harrington, P. Machine Learning in Action; Manning Publications: Shelter Island, NY, USA, 2012. [Google Scholar]
- Gu, W.; Foster, K.; Shang, J.; Wei, L. A game-predicting expert system using big data and machine learning. Expert Syst. Appl. 2019, 130, 293–305. [Google Scholar] [CrossRef]
- Imandoust, S.B.; Bolandraftar, M. Application of k-nearest neighbor (knn) approach for predicting economic events: Theoretical background. Int. J. Eng. Res. Appl. 2013, 3, 605–610. [Google Scholar]
- Alonso, R.P.; Babac, M.B. Machine learning approach to predicting a basketball game outcome. Int. J. Data Sci. 2022, 7, 60–77. [Google Scholar] [CrossRef]
- Horvat, T.; Havaš, L.; Srpak, D. The Impact of Selecting a Validation Method in Machine Learning on Predicting Basketball Game Outcomes. Symmetry 2020, 12, 431. [Google Scholar] [CrossRef]
- Quinlan, J.R. Simplifying decision trees. Int. J. Man-Mach. Stud. 1987, 27, 221–234. [Google Scholar] [CrossRef]
- Breiman, L.; Friedman, J.; Olshen, R.; Stone, C. Classification and Regression Trees; CRC Press: Boca Raton, FL, USA, 1984. [Google Scholar]
- Kass, G.V. An Exploratory Technique for Investigating Large Quantities of Categorical Data. J. R. Stat. Soc. Ser. C (Appl. Stat.) 1980, 29, 119–127. [Google Scholar] [CrossRef]
- Quinlan, J.R. Induction of decision trees. Mach. Learn. 1986, 1, 81–106. [Google Scholar] [CrossRef]
- Chawla, N.V.; Bowyer, K.W.; Hall, L.O.; Kegelmeyer, W.P. SMOTE: Synthetic minority over-sampling technique. J. Artif. Intell. Res. 2002, 16, 321–357. [Google Scholar]
- Han, H.; Wang, W.-Y.; Mao, B.-H. Borderline-SMOTE: A New Over-Sampling Method in Imbalanced Data Sets Learning. In Proceedings of the Advances in Intelligent Computing, Hefei, China, 23–26 August 2005; Springer: Berlin/Heidelberg, Germany, 2005; pp. 878–887. [Google Scholar]


Disclaimer/Publisher’s Note: The statements, opinions and data contained in all publications are solely those of the individual author(s) and contributor(s) and not of MDPI and/or the editor(s). MDPI and/or the editor(s) disclaim responsibility for any injury to people or property resulting from any ideas, methods, instructions or products referred to in the content. |
© 2025 by the authors. Licensee MDPI, Basel, Switzerland. This article is an open access article distributed under the terms and conditions of the Creative Commons Attribution (CC BY) license (https://creativecommons.org/licenses/by/4.0/).