Article

The Costs of Overcoming Social and Institutional Barriers to Implementing Co-Benefit Solutions in Thailand’s Transport and Residential Energy Sectors: Methods and Applications

1
The Institute for Global Environmental Strategies, Hayama 240-0115, Japan
2
National Institute Environmental Studies, Tsukuba 305-8506, Japan
3
Faculty of Public Health, Thammasat University, Pathumthani 12120, Thailand
4
Bansomdejchaopraya Rajabhat University, Bangkok 10600, Thailand
5
Pollution Control Department, Bangkok 10400, Thailand
6
Mizuho Research and Technologies, Tokyo 101-8443, Japan
7
Mitsubishi UFJ Research and Consulting, Tokyo 105-8501, Japan
8
World Bank, Washington, DC 20433, USA
*
Author to whom correspondence should be addressed.
Climate 2025, 13(3), 64; https://doi.org/10.3390/cli13030064
Submission received: 4 February 2025 / Revised: 11 March 2025 / Accepted: 14 March 2025 / Published: 20 March 2025
(This article belongs to the Section Policy, Governance, and Social Equity)

Abstract

:
Interest in co-benefits—the multiple benefits from mitigating climate change while addressing other sustainability challenges—has grown as policymakers seek to lower the costs of decarbonization. Much of this interest stems from data-driven models that quantify how much improved air quality, better health, and other co-benefits can offset those costs. However, co-benefits research often features transport, residential energy, and other solutions that face greater social and institutional barriers than economic barriers to achieving estimated gains. Few studies have assessed the costs of overcoming these barriers. The main objective of this study was to develop and apply methods for estimating these costs. Toward that end, this study developed a mixed method approach that used original survey and budgetary data to estimate the costs of clearing social and institutional barriers to implementing transport and residential energy solutions in Thailand. The results revealed that the costs of overcoming key social and institutional barriers were approximately USD 170–270 million per year from 2022 to 2032 for the transport sector in Thailand. The costs of overcoming social and institutional barriers for residential energy solutions are approximately USD 0.07–0.1 million per year over a comparable period. The results suggested that the costs of overcoming barriers were likely lower than the benefits for all solutions and greater for transportation (driven by the implementation of inspection and maintenance programs) than residential energy in Thailand. More generally, the results underlined a need for greater integration between work on co-benefits and transaction costs to assist policymakers in understanding how much investing in institutional capacity building, coordination, awareness raising, and other enabling reforms can help align a healthier climate with other development priorities.

1. Introduction

Although some countries have made progress mitigating climate change, cost concerns continue to slow net zero transitions. These concerns tend to be greatest in developing countries since investing in climate action is often perceived as diverting resources from other near-term development priorities. Yet, even as these concerns persist, researchers have demonstrated that investing in climate change does not always take resources away from other development needs.
In fact, a significant body of work has shown that co-benefits—all the benefits from mitigating climate change while addressing other sustainability challenges—can be good for the climate and development. By delivering on multiple objectives, co-benefits can offset mitigation costs and lower economic barriers to moving down sustainable net zero pathways [1,2,3,4]. The potential for co-benefits to offset these costs tends to be greatest for transport, residential energy (cookstoves), and other development-oriented solutions that improve air quality and health while addressing climate change in developing countries. Yet, these solutions also often face greater social and institutional barriers than economic barriers to delivering on their full potential.
While a significant body of research on co-benefits has used data-driven modeling to estimate co-benefits, few studies have examined the costs of overcoming social and institutional barriers to realizing estimated gains [5,6,7]. The main objective of this study was to fill this knowledge gap by developing and applying methods for estimating the costs of overcoming institutional and social barriers to implementing transport and residential energy (cookstove) solutions in Thailand. The underlying premise was that using those methods could shed light on the resources that governments should spend for effective implementation of solutions that not only had significant benefits but faced sizable barriers to achieving them. Methodologically, the study showed that these costs could be estimated by using a four-step mixed-method approach that drew on data from government budgets and consulting experts on budgets increases needed to effectively implement transport and residential energy solutions.
By applying the above methods, the study showed that the costs of overcoming social and institutional barriers were approximately USD 170–270 million per year from 2022 to 2032 for the transport sector in Thailand. The costs for residential energy (cookstoves) were approximately USD 0.7–1 million per year over a comparable period. The results suggested that the costs of overcoming key barriers were likely smaller than the benefits for all solutions and transportation (driven by the implementation of inspection and maintenance programs) greater than residential energy in Thailand. More generally, the results imply incorporating government spending estimates on capacity building, institutional coordination, and awareness raising in integrated assessment models can help motivate discussions over enabling reforms that deliver co-benefits. Further research on user-centered methods for estimating implementation costs can enrich work on the design of enabling reforms and address limitations in the present study.

2. Literature Review

2.1. Co-Benefits

The starting point for this study was long-running work on co-benefits [8]. The earliest studies on co-benefits focused on estimating the air quality and health benefits of hypothetical carbon prices in developed countries [9,10]. The decade that followed would see similar but higher estimates of co-benefits, motivating work on this same theme in developing countries [11,12]. Recent years have seen a proliferation of this research as illustrated by the nearly 700 references to co-benefits in the Third Working Group of the Intergovernmental Panel on Climate Change (IPCC) Sixth Assessment Report [13].
The growing interest in co-benefits is also evident in studies estimating the savings from co-benefits from transport, energy, buildings, and other sectors with close links to sustainable development and livelihoods in contexts ranging from Europe to Asia [14,15,16,17,18,19,20,21,22,23,24]. For example, a recent study on the transport sector in Henan Province, China, found that an ambitious green transport scenario could reduce fine particulate (PM2.5) and CO2 emissions by approximately 40% and 66%, respectively, between 2020 and 2035 relative to a business-as-usual (BAU) baseline [25]. Research at the national level in China’s transport sector has similarly found that interventions focused on improving vehicle technologies would deliver nearly twice the level of air quality co-benefits as those focused on shifting to public transport or avoiding motorized transport [26].
Importantly, this work did not simply look more closely at interventions in key sectors but offered assessments of different benefits in applied contexts. For example, studies have looked at the potential benefits of nationally determined contributions (NDCs) [27]. Another promising application that has helped inform policy involved estimating the benefits of mitigating short-lived climate pollutants (SLCPs) such as black carbon in countries ranging from Cambodia to Pakistan to Bangladesh [28]. This kind of work has also featured in studies on SLCP solutions in key regions and subregions [29,30,31].
But while there has been a notable increase in efforts to feature co-benefits in assessments and applied policy-relevant contexts, much of even this research does not systematically assess the feasibility of implementing solutions it recommends. The inattention to these implementation prospects is important because many of the challenges to making good on the potential benefits of solutions depend on overcoming barriers. Greater efforts to analyze these barriers would fill an important gap in co-benefits research.

2.2. Feasibility and Implementation Barriers

A theme that is gaining attention in climate policy research can help fill the above gap with a more robust analysis of implementation challenges: feasibility [32,33,34]. For this study, feasibility will refer to whether a policy is practical and achievable given available financial resources and technologies, as well as social and institutional constraints. Like studies on co-benefits, work on feasibility traces back decades [35,36]. In recent years, this line of research has experienced a renaissance due, in part, to a growing focus on barriers to technology development and commercialization [37]. For instance, studies have noted that barriers to technology transfer depend on specific sectoral circumstances, manifest themselves differently in countries at different levels of development, and range from inadequate human capacity to institutional and structural constraints [37]. In more recent years, the IPCC 1.5 °C Special Report has placed a greater emphasis on multiple dimensions of feasibility [38]. The IPCC Sixth Assessment Report also pointed to the critical role of feasibility and barriers in achieving ambitious climate goals [13].
Importantly, some of this recent work on barriers has begun to look more carefully at social and institutional feasibility. For instance, recent work has underlined that long-term mitigation scenarios in integrated assessment models (IAMs) may prove difficult to implement because institutional constraints are critical but often overlooked barriers in modeling studies [39]. Researching a similar theme, Nielsen et al. distinguished between technical feasibility, initiative feasibility, and behavioral plasticity and emphasized the need integration between modeling and behavioral sciences to assessing hidden barriers to mitigation potential [40]. Yet an additional study employed expert reviews of the relevant literature to evaluate different dimensions of feasibility for a range of mitigation options [41]. Others have taken these ideas a step further, using indices such as the World Bank governance indicators to assess how institutional feasibility affects modeling scenarios [42]. At the same time, the study stopped short of converting data on barriers into how they affect mitigation for key sectoral interventions in different countries. Filling this gap requires understanding what costs are typically factored into these IAM scenarios.

2.3. Costs and IAMs

Some IAMs include costs to shed light on the likelihood of a solution’s adoption and implementation. Most notably, a subset of technology-oriented bottom-up IAMs incorporates important kinds of costs. For example, the AIM/Enduse model, a technology-oriented bottom-up partial equilibrium model that is part of the Asia Pacific Integrated Models (AIM), uses recursive dynamic optimization to minimize total system costs. More concretely, the model deploys the following data to estimate the costs of implementing different interventions: (1) initial costs (i.e., investment or capital costs), (2) operating costs of technologies, (3) energy and resource costs, and (4) taxes and subsidies [43]. In a similar fashion, another technology-oriented bottom-up type model, the Greenhouse Gas and Air Pollution Interactions and Synergies (GAINS), calculates annual costs per unit of activity level by combining three types of costs: (1) investment costs (initial costs), (2) operating costs, and (3) variable operating costs (referring to the actual operation of the installed technology including labor and increased or decreased energy demands) [44,45].
By gathering data for the above costs, the models help decision-makers in at least two ways. First, they compare the impacts of technologies or other interventions and allocate public and private expenditures based on those comparisons; the models presume agents with decision-making power (such as policymakers, enterprises, and other stakeholders) will choose options with greater cost-effectiveness [43]. Second, the models can help policymakers design interventions that can lower the costs of expensive technologies with significant mitigation potential. This can be done by adding a set of “push” countermeasures in the models like subsidies or carbon taxes that adjust the comparative costs of technologies.
Some IAMs therefore demonstrate the costs to overcome barriers needed to boost the “economic” feasibility of adopting interventions. This entails including data on the costs of technologies and their operation and maintenance. However, IAMs offer fewer insights into the costs that governments need to bear to implement interventions. Most notably, IAMs do not include the finance governments need to invest in strengthening their own implementation capacities or raise awareness of users. The resources invested in this institutional strengthening and awareness raising fall under the category of “transaction costs”. These costs are heretofore missing in IAMs; insight from work on transaction costs can help fill this gap in understanding.

2.4. Transaction Costs

Work on transaction costs or the costs associated with implementing and enforcing a policy can help address the limited attention to how much governments should spend to achieve co-benefits. High-profile studies on these costs includes Coase’s seminal research [46] and North’s [47] similarly pioneering work. North’s groundbreaking studies, for instance, focused on issues such as the costs arising from the measurement, monitoring, and enforcement of property rights. In the years following that foundational work, some have noted that the two main types of transaction costs are those associated with market organization and participation, as well as policy implementation [48]. Yet a related line of research would then offer a typology consisting of three categories of transaction costs that can enable comparisons across contexts: (1) information, (2) collective decision-making, and (3) collective operating costs (collective costs are the costs of multiple actors as opposed to a single actor involved in implementing a policy) [49]. Using such a typology is helpful because as some have argued, analyzing transaction costs can improve policy design and implementation [50].
A complementary body of work estimates these costs to improve policy design and implementation for key solutions. For example, early work from McCann and Easter [51] showed that transaction costs in the agriculture sector accounted for 38% of the total cost of U.S. agricultural technical assistance programs. In a slightly different context, work on a Minnesota water trading projects (U.S.) drew upon interviews to find transaction costs accounted for 35% of total program costs [52]. In yet another relevant study, researchers also worked with interviews to determine that the public management costs of agri-environmental schemes across Europe decreased from 102% of payments to landowners in the beginning (1992/93) to 18% (1998/99) over time [53].
Studies on transaction costs have continued to generate interest with some work noting the need for studies related to new sustainability issues, as well as applications in the sharing economy [54,55]. Others have pointed to possible uses of emerging information communication technologies to help facilitate multi-stakeholder cooperation and thereby lower transaction costs [56]. These studies are useful because they underline that it is possible to not only calculate the costs of government programs but also consider how different sets of enablers could help lower these costs. The next section reflects on how to calculate the size of those barriers and costs to overcome them for a key set of co-benefit solutions.

3. Case Selection and Methods

3.1. The Cases of Transport and Residential Energy in Thailand

The methods used herein focused on solutions in the residential energy and transport sectors in Thailand: (1) replacement of traditional stoves, (2) shifting to liquified petroleum gas (LPG), (3) tighter emission standards for vehicles, and (4) vehicle inspection and maintenance. These solutions were chosen because they lowered the PM2.5 containing black carbon that degraded air quality while leading to near-term climate changes [57,58]. To illustrate with relevant examples, an assessment of the effects of interventions in the transport and clean energy sector in Southeast Asia found that successfully implementing solutions could reduce atmospheric concentrations of PM2.5. by approximately 12 μg/m3 by 2030 [59].
In addition to their potential for co-benefits, the solutions were selected because they often required government support to persuade users of their merits and realize their full potential. This was frequently the case with co-benefits solutions because they were often closely related to changing lifestyles and shifting energy demands. For instance, a sizable body of literature suggests the implementation of inspection and maintenance is challenging for these reasons, especially in developing countries [60,61,62,63,64]. Studies have also underlined that consumers may need to be persuaded of the merits of electric vehicles to alter their preferences [65]. Similarly, a wide range of social and institutional challenges stand in the way in transitions to clean cookstoves and clean cooking fuels [66,67,68].

3.2. The Size of Implementation Barriers for Transport and Residential Energy

Before turning to estimates of transaction costs, an important part of the analysis is the size of non-economic barriers. This study employed an approach that has been used elsewhere that combined stakeholder surveys and a systematic literature review to arrive at estimates of the size of different types of barriers in the transport and residential energy sectors [69].
The approach, detailed in the Supplementary Materials, had three notable features. First, it converted qualitative assessments of barriers into quantitative estimates of lost time or delayed implementation. Second, by making the conversion into time, it was easier for the data on delays to be included in modeling. Third, since it drew on surveys with policymakers/experts in a specific country, it could offer a reasonably accurate picture of how different types of barriers influenced a key solution in a given place and time. Beyond these three features, the study estimated the effects of those barriers over a 15-year period [70]. This 15-year period was selected because studies contended the full uptake of sustainable solutions could be between “1 and 16 years” [71,72], although some argued for longer time frames and noted periods might vary greatly across contexts [73,74] (see Figure 1 for estimated delays).

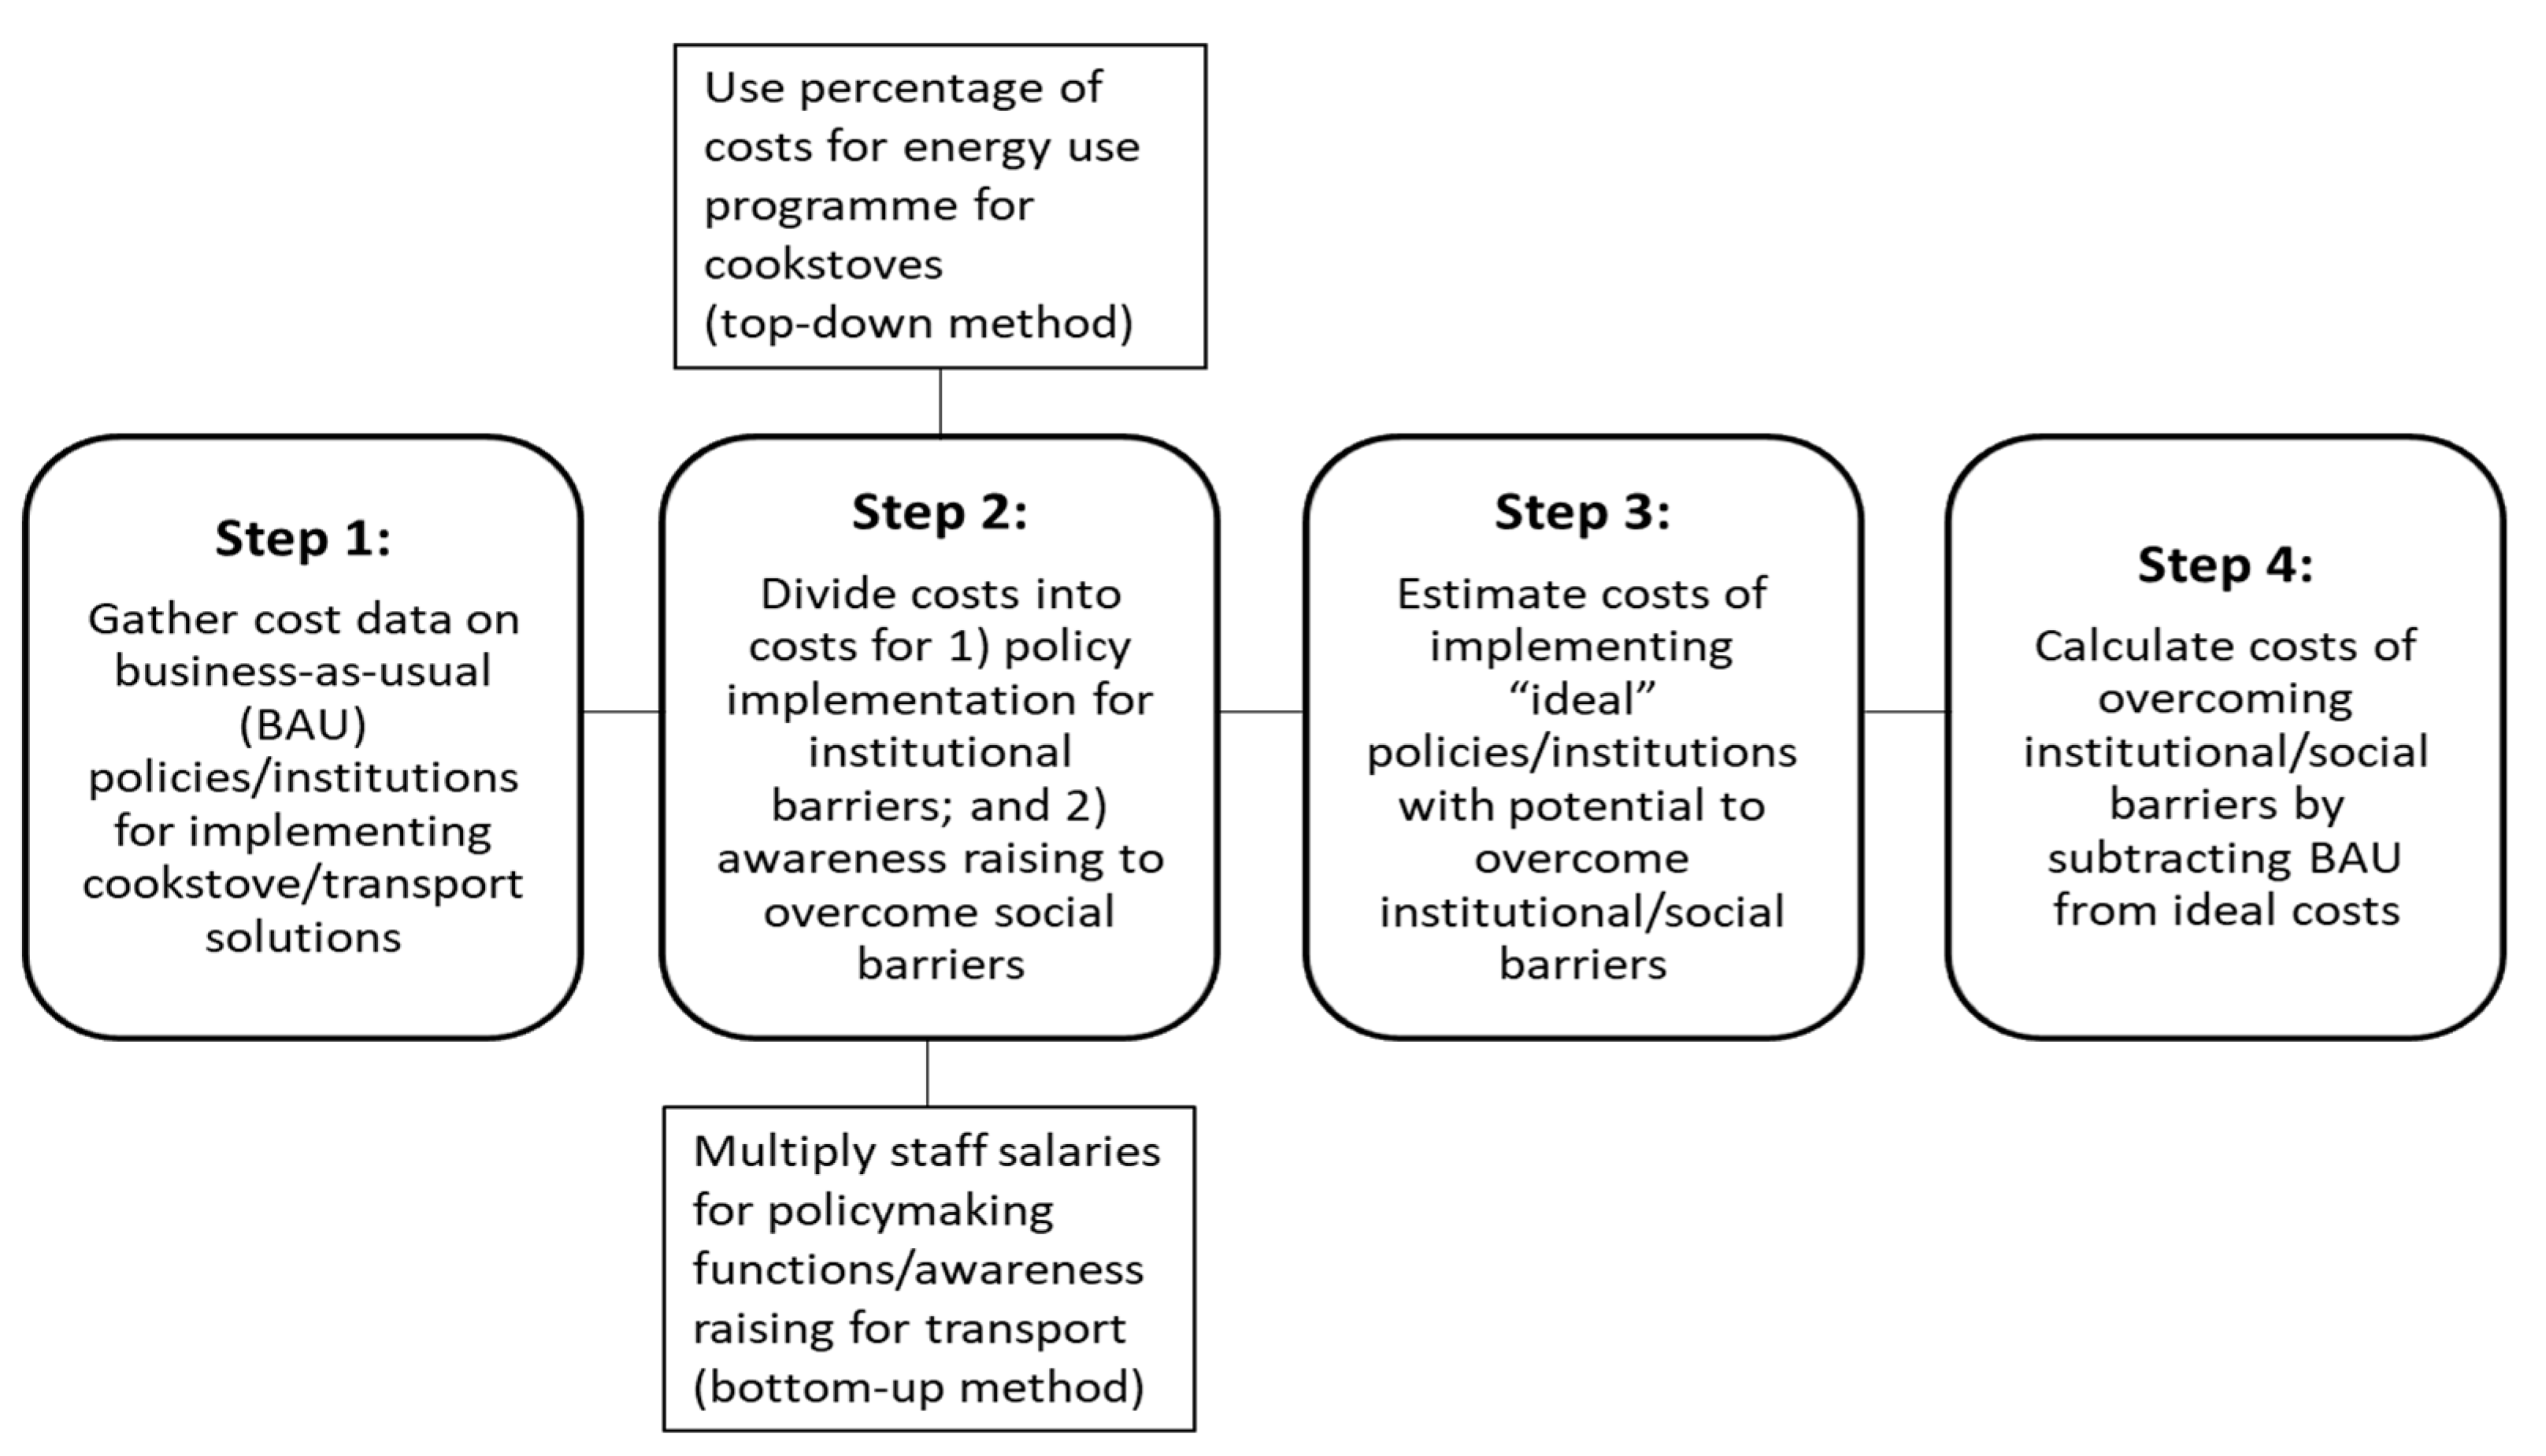
3.3. The Costs of Overcoming Barriers

While understanding the size of the barriers is important, the focus of this study was estimating the costs of overcoming social and institutional barriers. To help simplify that analysis, the authors followed a series of four steps, presented in Figure 2. The steps used a mixed method approach aimed at connecting the work on feasibility with implementation costs. The approach followed some of the work on transaction costs that suggested using government budgets, policymaker consultations, and staff wage data to look at these costs across different stages of the policy cycle [50,51,75,76]. While the approach was relatively straightforward, it took a rather narrow view of these costs, a limitation discussed in the article’s Conclusions Section.
The first step involved a set of consultations with current and former policymakers to acquire official budget data on programs or to estimate personnel devoted to different functions of policymaking and awareness-raising functions in key sectors. These consultations were aided by the use a of set of questions about the costs of different parts of the policymaking processes. Those questions helped in arriving at the estimate of the current “business-as-usual” (BAU) costs of implementing policies and programs relevant to the mitigation actions listed in Figure 1. These data could be used to determine the costs of implementing a policy that was still confronting institutional and social barriers. The data generated from these discussions were entered onto a simple spreadsheet.
This seemingly straightforward calculation, however, proved more complicated because governments did not always allocate resources for a specific solution. In addition, budgeting allocations changed over time due to shifting policy and political priorities. These limitations notwithstanding, the authors worked with the aforementioned current and former Thailand officials to employ two approaches to arrive at a reasonable approximation of the current costs borne chiefly by the government of implementing a solution.
To generate these estimates, two types of approaches were used for residential energy and transport. In the case of residential energy, data were gathered on the money spent to implement the entire alternative energy program, as well as a portion of the recent PM2.5 action plan that focused on raising awareness in Thailand [77]. The alternative energy program has been the area that has typically employed the most staff concentrating on residential energy, while the new PM2.5 plan has recently allocated resources for raising awareness on clean cookstoves. Based on discussions with the same above officials, as well as government budgeting documents, a small 2% percentage of the entire alternative energy program was assumed to apply to policy design, implementation, and monitoring for clean cookstoves (budgetary data were extracted from the Bureau of the Budget and the Ministry of Energy, Thailand). The same discussions revealed that most of the alternative energy budget was concentrated on renewable energy and energy efficiency; only a small portion of that total figure was dedicated to residential energy (see Equation (1)). The 2% figure approximated the amount that had been allocated in the past for specific shorter-term cookstoves. The amount allocated for raising awareness on cookstoves was simply carried over directly from the budget for the PM2.5 plan.
T C C o o k s t o v e = ( B A l t   E n e r g y ) ( P C o o k s t o v e )
T C C o o k s t o v e = T r a n s a c t i o n   C o s t s   f o r   C o o k s t o v e s
B A l t   E n e r g y = B u d g e t   f o r   A l t e r n a t i v e   E n e r g y
P C o o k s t o v e = P e r c e n t a g e   o f   G o v e r n m e n t   B u d g e t   f o r   A l t e r n a t i v e   E n e r g y   A l l o c a t e d   t o   C o o k s t o v e s
Another more bottom-up approach—applied to the case of the transport solutions such as inspection and maintenance programs—involved an estimate based on staffing on different parts of the policymaking process. That approach entailed asking current government staff how many people were working on different roles in inspection and maintenance, emission standards, and electric vehicles. In this case, it was possible to make estimates based on the amount of staff time for each of the roles for each type of solution.
An important point for the bottom-up approach used for the transport solutions was that most of the estimated transaction costs were labor costs. That is, it was the amount of time spent by a given number of staff persons on two types of policymaking functions: (1) formulating, implementing, and monitoring the impacts of policy and (2) raising public and user awareness of a policy (in some cases, the calculation for the transaction could also be a modest amount of indirect costs for organizing meetings, trainings, and pilot projects). The data on staff salaries were based on the Bank of Thailand, which estimated the average monthly salary to be approximately USD 400 in 2023 (or THB 15,000) [78].
T C I M = L I M S a l ¯ + ( I n I M )
T C I M = T r a n s a c t i o n   C o s t s   f o r   I n s p e c t i o n   a n d   M a i n t e n a n c e
L I M = N u m b e r   o f   P e o p l e   W o r k i n g   o n   I n s p e c t i o n   a n d   M a i n t e n a n c e
S a l = A v e r a g e   G o v e r m e n t   S t a f f   S a l a r y
I n I M = I n d i r e c t   C o s t s   f o r   I n s p e c t i o n   a n d   M a i n t e n a n c e   ( i . e . ,   o r g a n i z i n g   m e e t i n g s )
In the next step, the authors then decided to divide the transaction costs into two categories: (1) one focused chiefly on policy design and implementation that was assumed to be used to overcome institutional barriers and (2) the other applied to raising awareness and training that was assumed to be used to overcome social barriers. As shown in Equation (3), the transaction costs for the example of inspection maintenance were a simple sum of the costs involving the institutional functions and (social) awareness-raising functions. This figure was relatively easy to calculate for the transport solutions because the costs were generated using the previously described bottom-up approach.
For the cookstove case, the calculation was more challenging because the costs were not divided into distinctively different functions. It was nonetheless possible to approximate the proportion of the total transaction costs by using the percentages from previous short-term cookstove programs that had a clear differentiation between the costs involving the program design and implementation and raising awareness and training.
T C I M = T C I M , p o l + T C I M , s o c
T C I M = T r a n s a c t i o n   C o s t s   f o r   I n s p e c t i o n   a n d   M a i n t e n a n c e
T C I M , p o l = T r a n s a c t i o n   C o s t s   f o r   P o l i c y   F u n c t i o n s   f o r   I n s p e c t i o n   a n d   M a i n t e n a n c e
T C I M , s o c = T r a n s a c t i o n   C o s t s   f o r   A w a r e n e s s   R a i s i n g   F u n c t i o n s   f o r   I n s p e c t i o n   a n d   M a i n t e n a n c e
T C C o o k s t o v e = T C C o o k s t o v e , p o l + T C C o o k s t o v e , s o c
where
T C C o o k s t o v e , p o l = ( P P r e - C o o k s t o v e , p o l ) ( B A l t   E n e r g y )
T C C o o k s t o v e , s o c = ( P P r e - C o o k s t o v e , s o c ) ( B A l t   E n e r g y )
T C C o o k s t o v e = T r a n s a c t i o n   C o s t s   f o r   C o o k s t o v e
T C C o o k s t o v e , p o l = T r a n s a c t i o n   C o s t s   f o r   P o l i c y   F u n c t i o n s   f o r   C o o k s t o v e s
T C C o o k s t o v e , s o c = T r a n s a c t i o n   C o s t s   f o r   A w a r e n e s s   R a i s i n g   F u n c t i o n s   f o r   C o o k s t o v e s
The third step was to estimate the amount involved in overcoming the barriers. For this purpose, the same former and current Thailand government staff were asked to consider what it would it cost to implement an “ideal” program that could overcome the relevant institutional and social barriers.
To reach cost estimates for this ideal program, the authors employed a similar approach to the bottom-up approach outlined above. In this approach, the same current and former government officials were asked to estimate how many additional people and other supporting activities (workshops, awareness raising, and training) would be required to perform the relevant roles and functions involved in designing and implementing policies related to clean cookstoves (or fuel switching), vehicle inspection maintenance, vehicle emission standards, and E-vehicle promotional programs.
In the case of cookstoves, much of the effort for the ideal program would focus on a sustained multi-stakeholder effort with leadership from technical experts and universities. The proposed collaboration would help to build a cookstove program that was rolled out over two consecutive five-year intervals (from 2022 to 2027 and from 2028 to 2032). Note that the reason for the slight up and down pattern in the costs for the ideal program reflected the fact that the first year in the five-year interval began with relatively less expensive scoping activities, while the second through fourth years required more resources for implementation of activities based on that scoping (see Table 1 for the relevant assumptions).
In the case of transport, the ideal program would focus initially on increasing staffing and building capacities for relevant human resources for inspection and maintenance but would then shift toward the end of the ten-year interval to promoting E-vehicles. The assumed shift was based on assumptions of a growing emphasis on electric vehicles and a decrease in the number of non-compliant super emitting vehicles over the ten years in question (see Table 1 for the relevant assumptions).
Finally, in the fourth step, the additional people and activities for an ideal program were added onto the existing funding (the existing people and activities for a program stalled by the barriers). This composite figure was calculated for both the policy design and implementation costs to overcome institutional barriers, as well as the awareness raising and training costs to overcome the social barriers. Those composite figures were then assumed to be the cost required to overcome the institutional and social barriers and thereby accelerate implementation.
In sum, the methods outlined herein can offer policymakers and researchers a set of potentially replicable steps to estimate the size of costs for implementing different solutions. They also suggest that there may be some differences in the approach for sectors and solutions that do or do not have a clear budget line.

4. Results

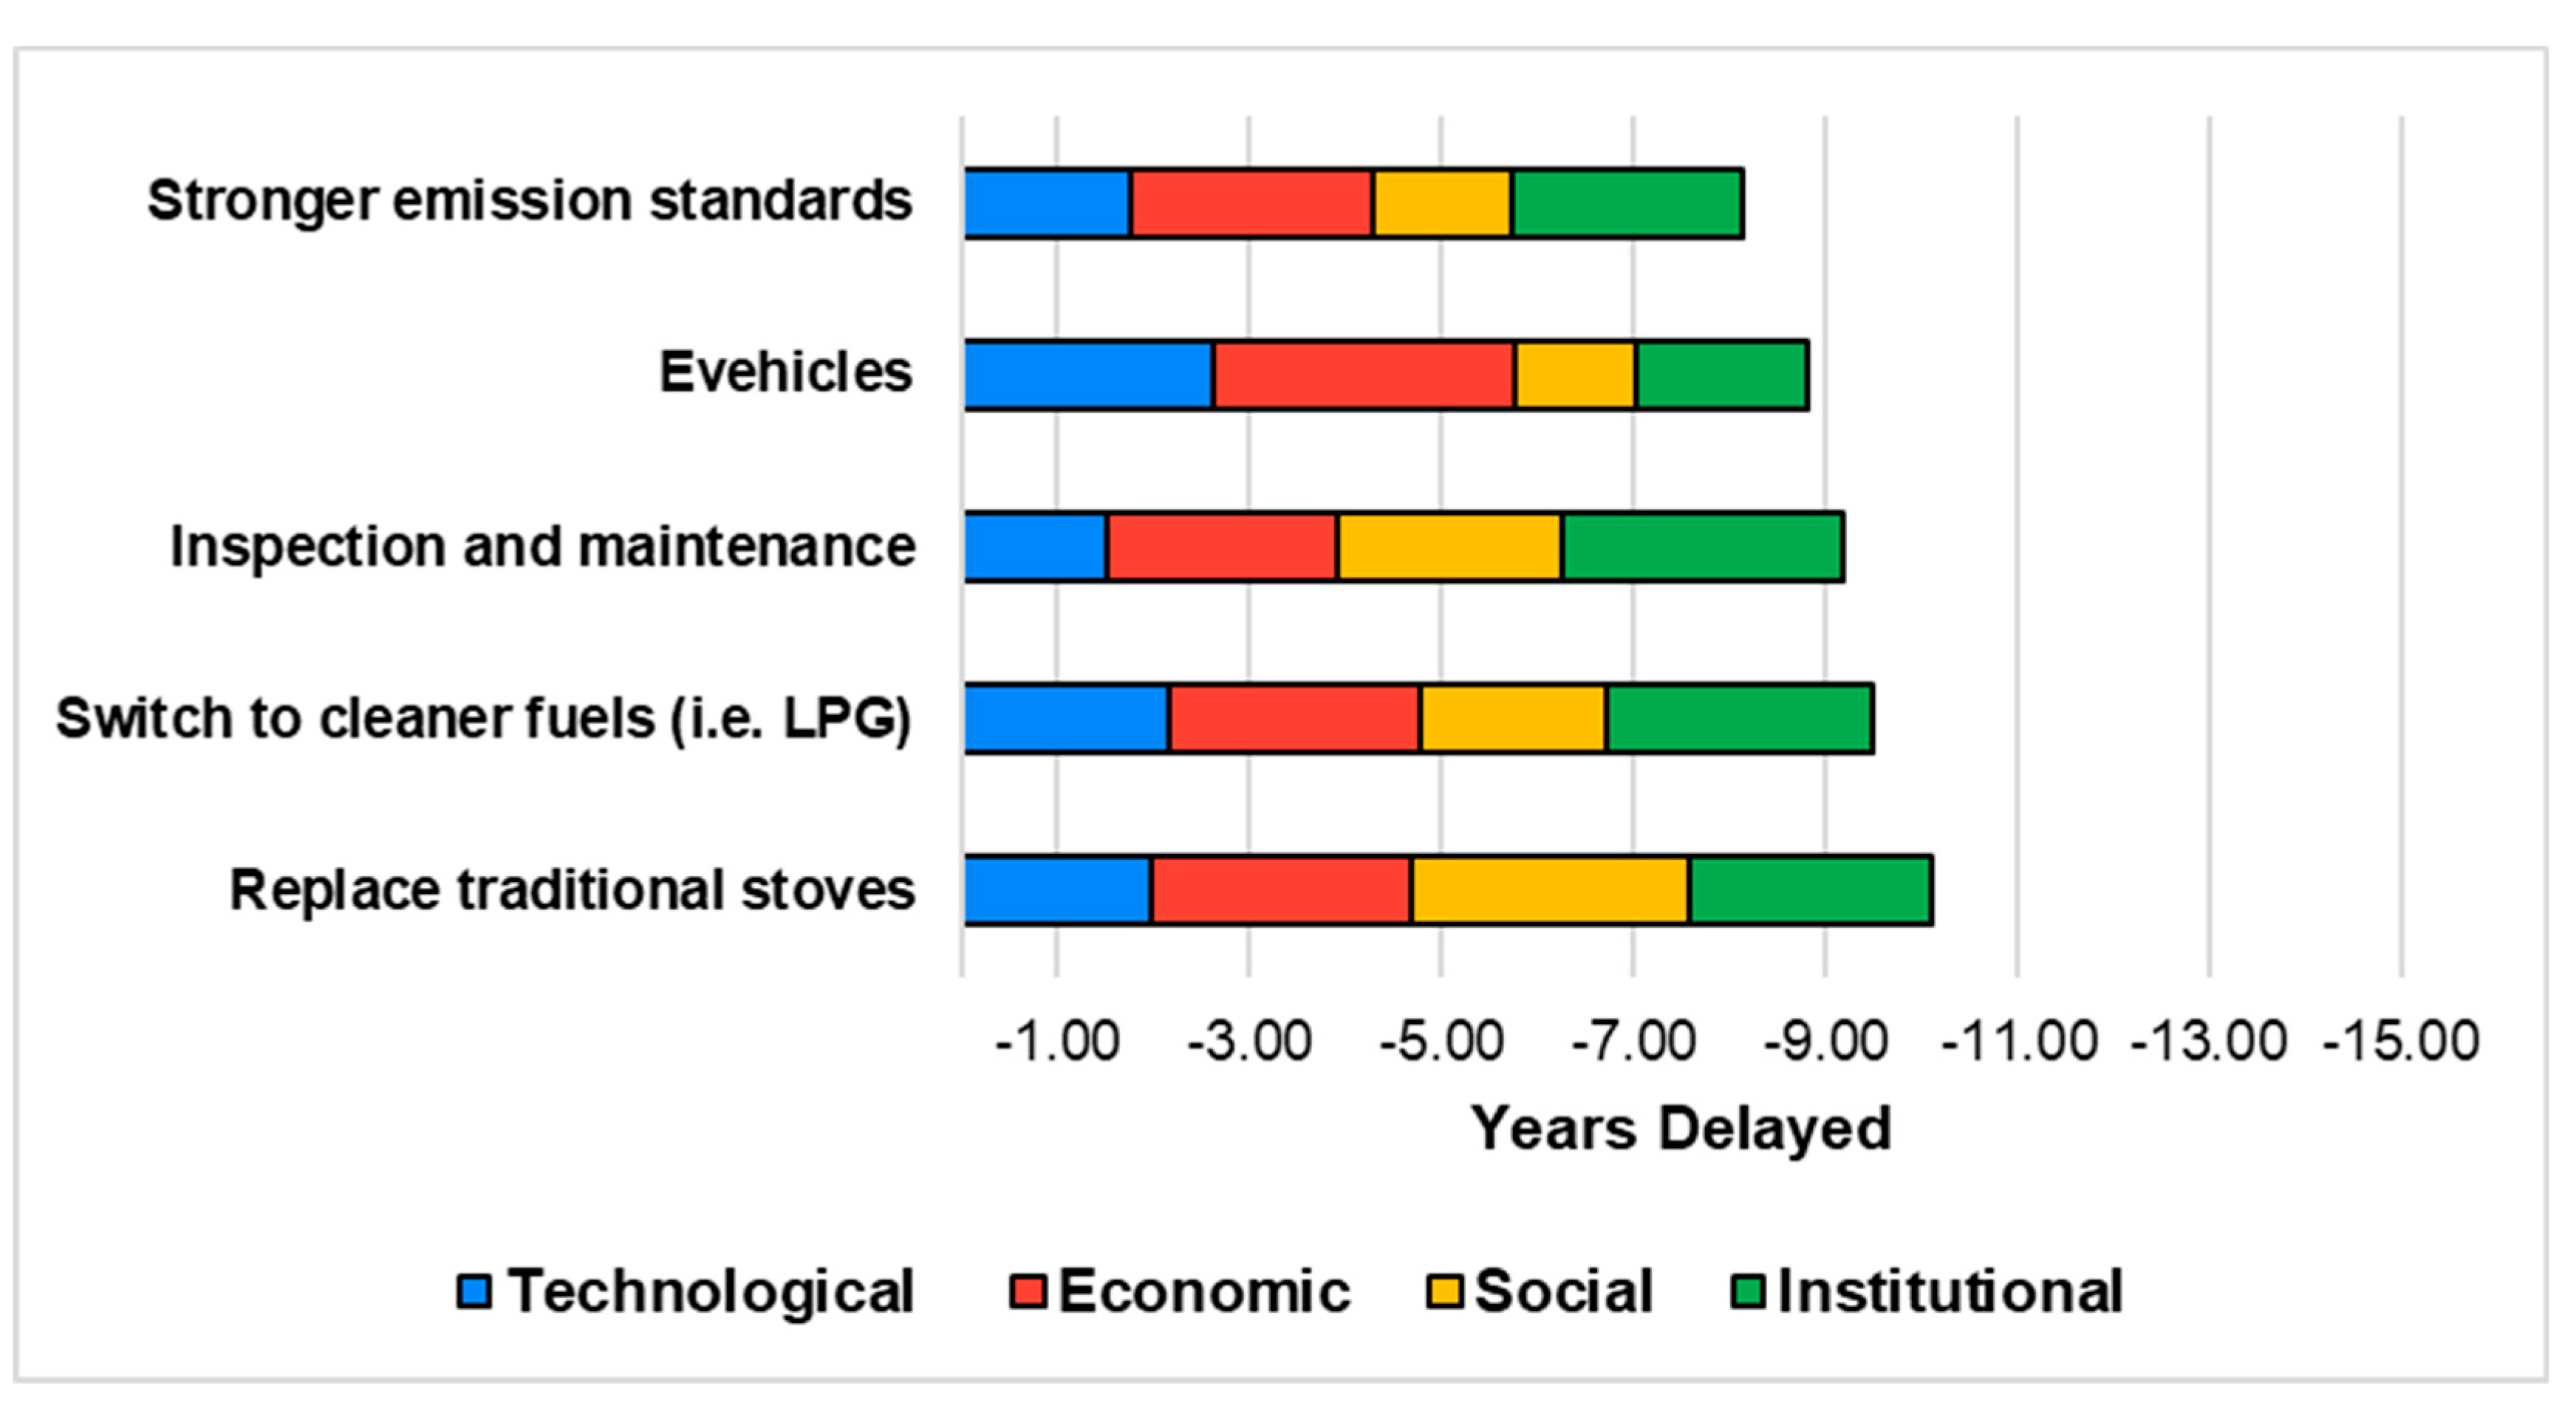
4.1. The Effects of Implementation Barriers

This Results Section begins with the effects of the previously discussed delays due to social and institutional barriers. The potential impacts of those delays are illustrated in Figure 3a,b and demonstrate the effect of delays approximating the size of the institutional and social barriers on PM2.5 emissions using the aforementioned AIM/Enduse model [43]. The AIM/Enduse Model is a framework that can support the selection of technologies and other solutions to climate change and air pollution. The blue line in Figure 3a,b illustrates the emissions reduction pathway, and the solid bar depicts emissions for full implementation without barriers or delays for a 2060 net-zero scenario. The black line illustrates what could happen from delay due to barriers, and the shaded bar indicates the impacts of the delayed implementation of the transport and residential solutions listed in Figure 1.
Note that to reflect the potentially varying effect of the delays, social and institutional barriers offered an approximately five-year and ten-year delay as shown in Figure 3a,b, respectively. The ten-year delay was consistent with what would happen if institutional and social barriers locked in existing development patterns and delayed transitions to cleaner technologies and/or undermined implementation [79,80,81]. Importantly, Figure 3b demonstrates the growing level of emissions over not simply the next 15 but the next 30 years. In fact, emission reductions for the full implementation scenario were approximately 30% greater than the five-year delay scenario by 2050 (in the range of 8 kton BC for full implementation compared with 12 kton BC for the five-year delay), while the difference was closer to 50% for the longer ten-year locked-in delay by 2050 (in the range of 8 kton BC for full implementation compared with 16 kton BC for a five-year delay).

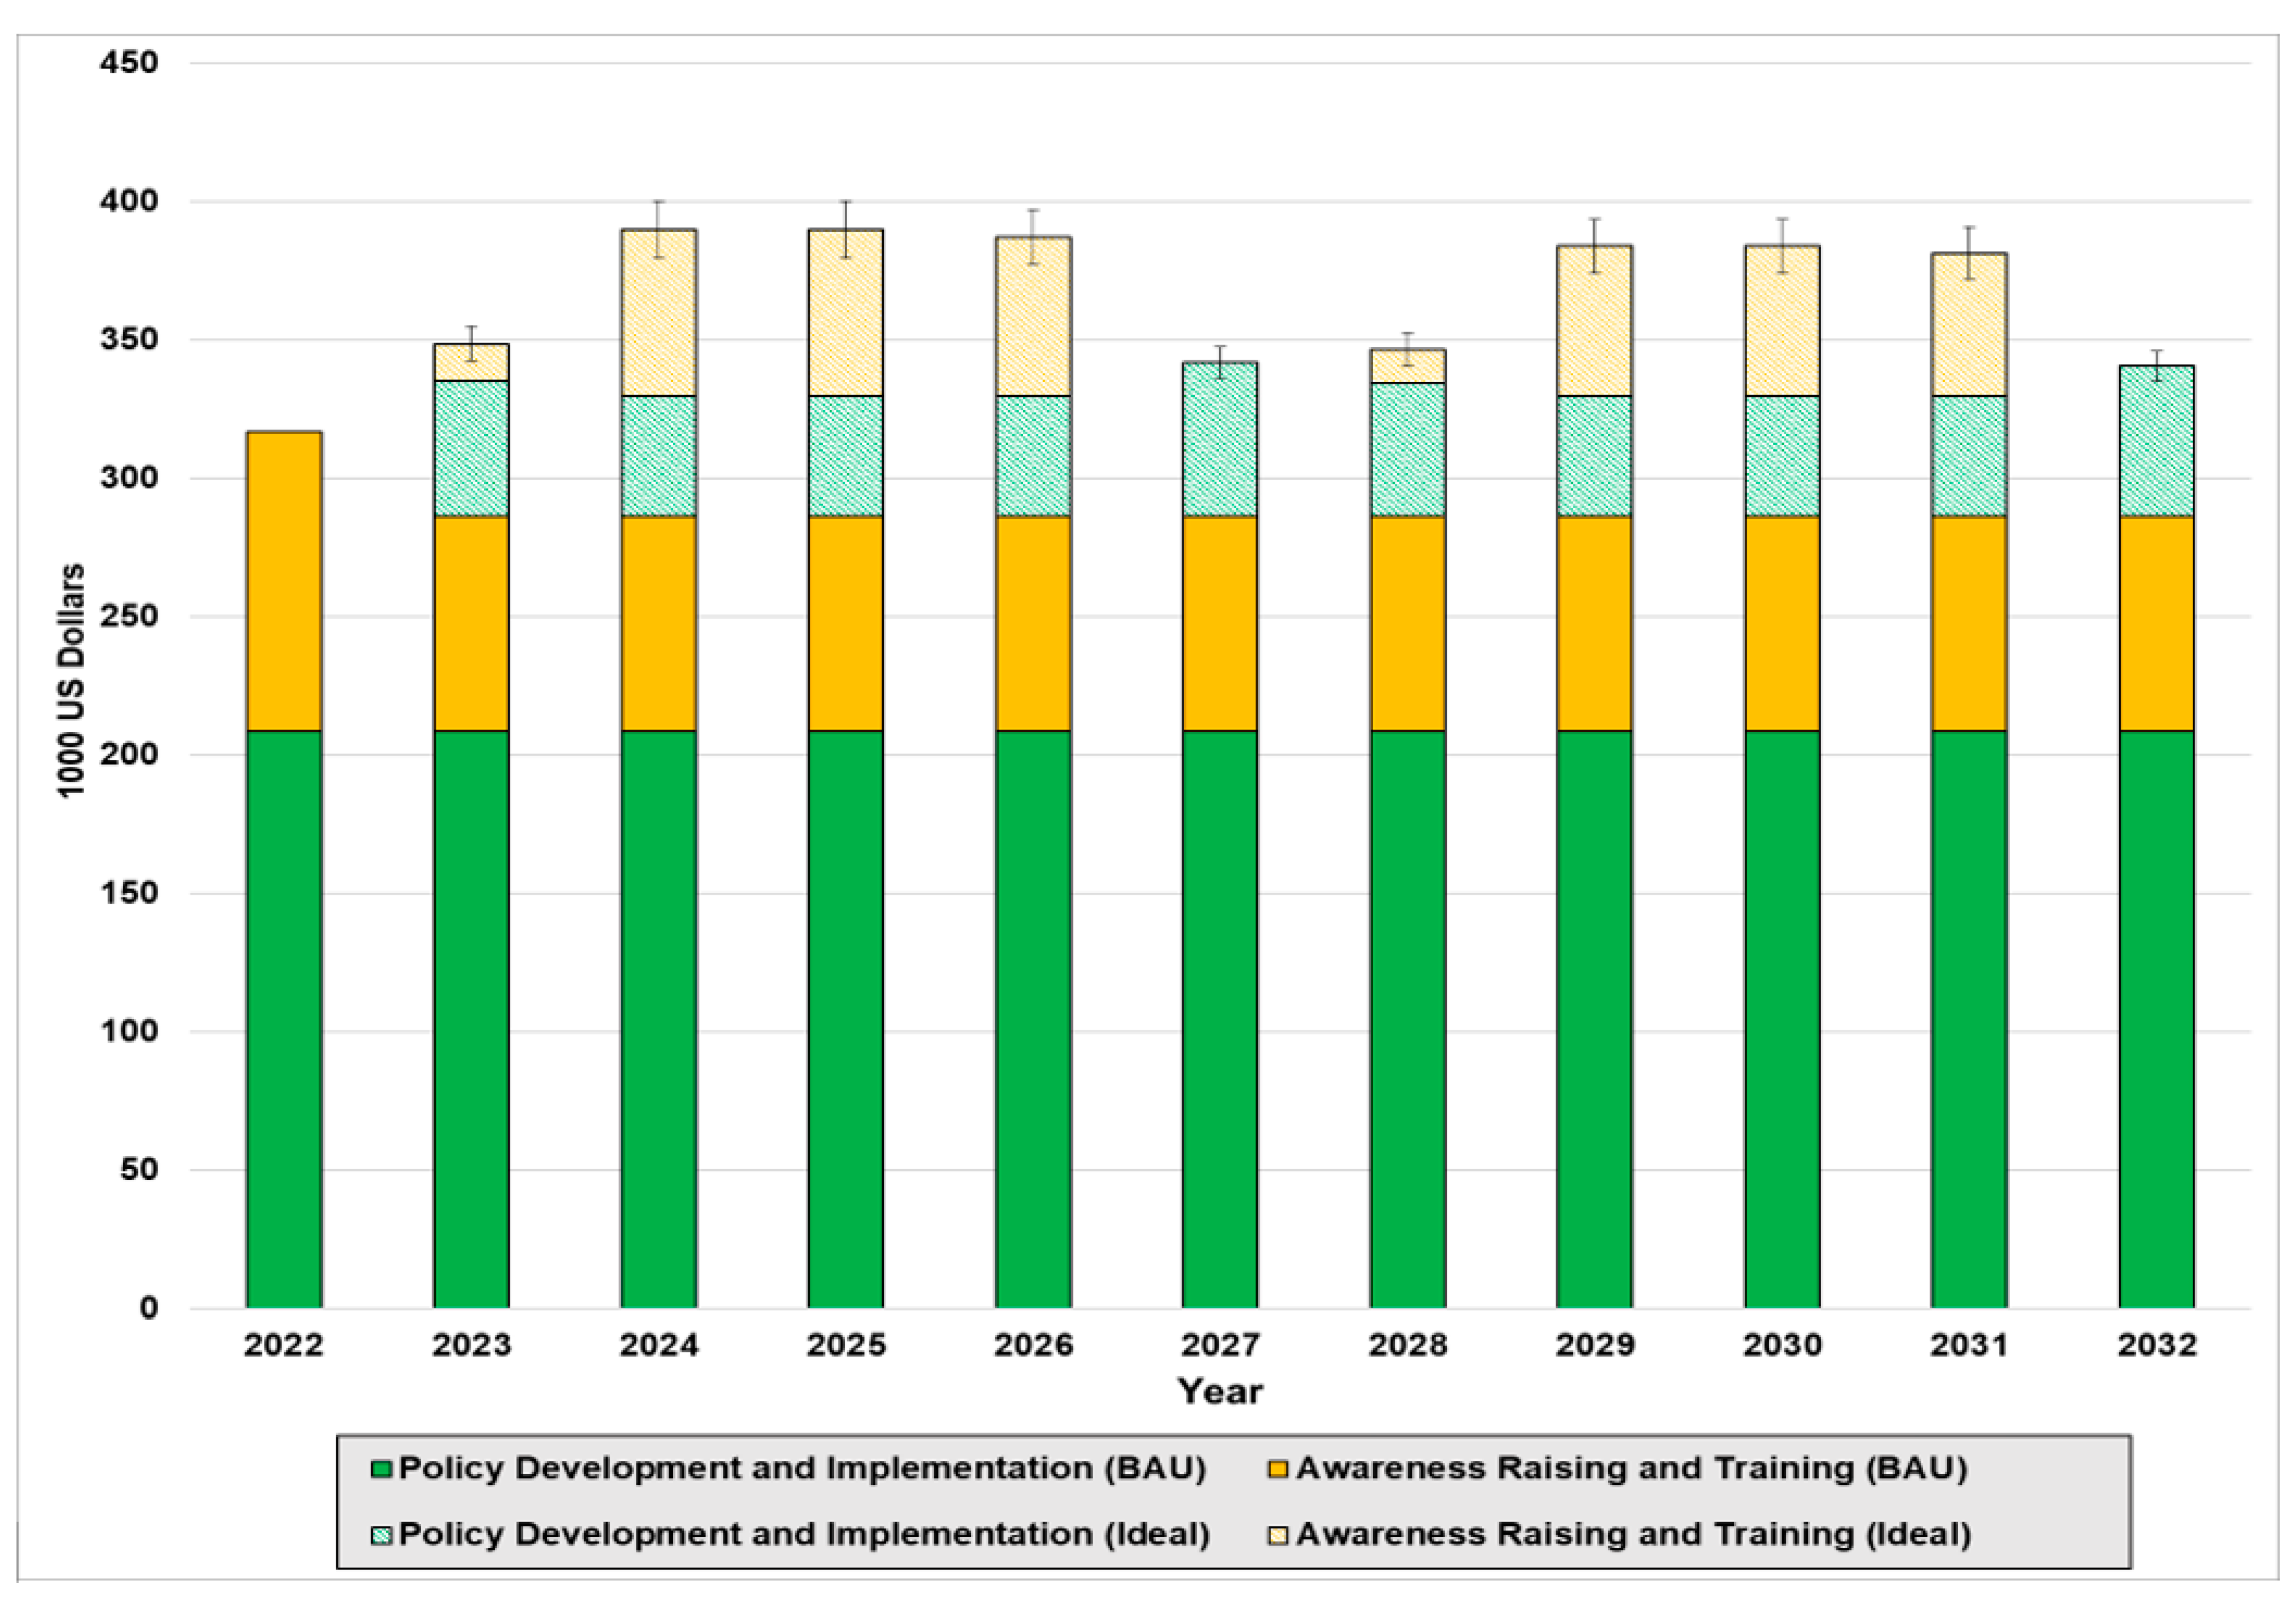
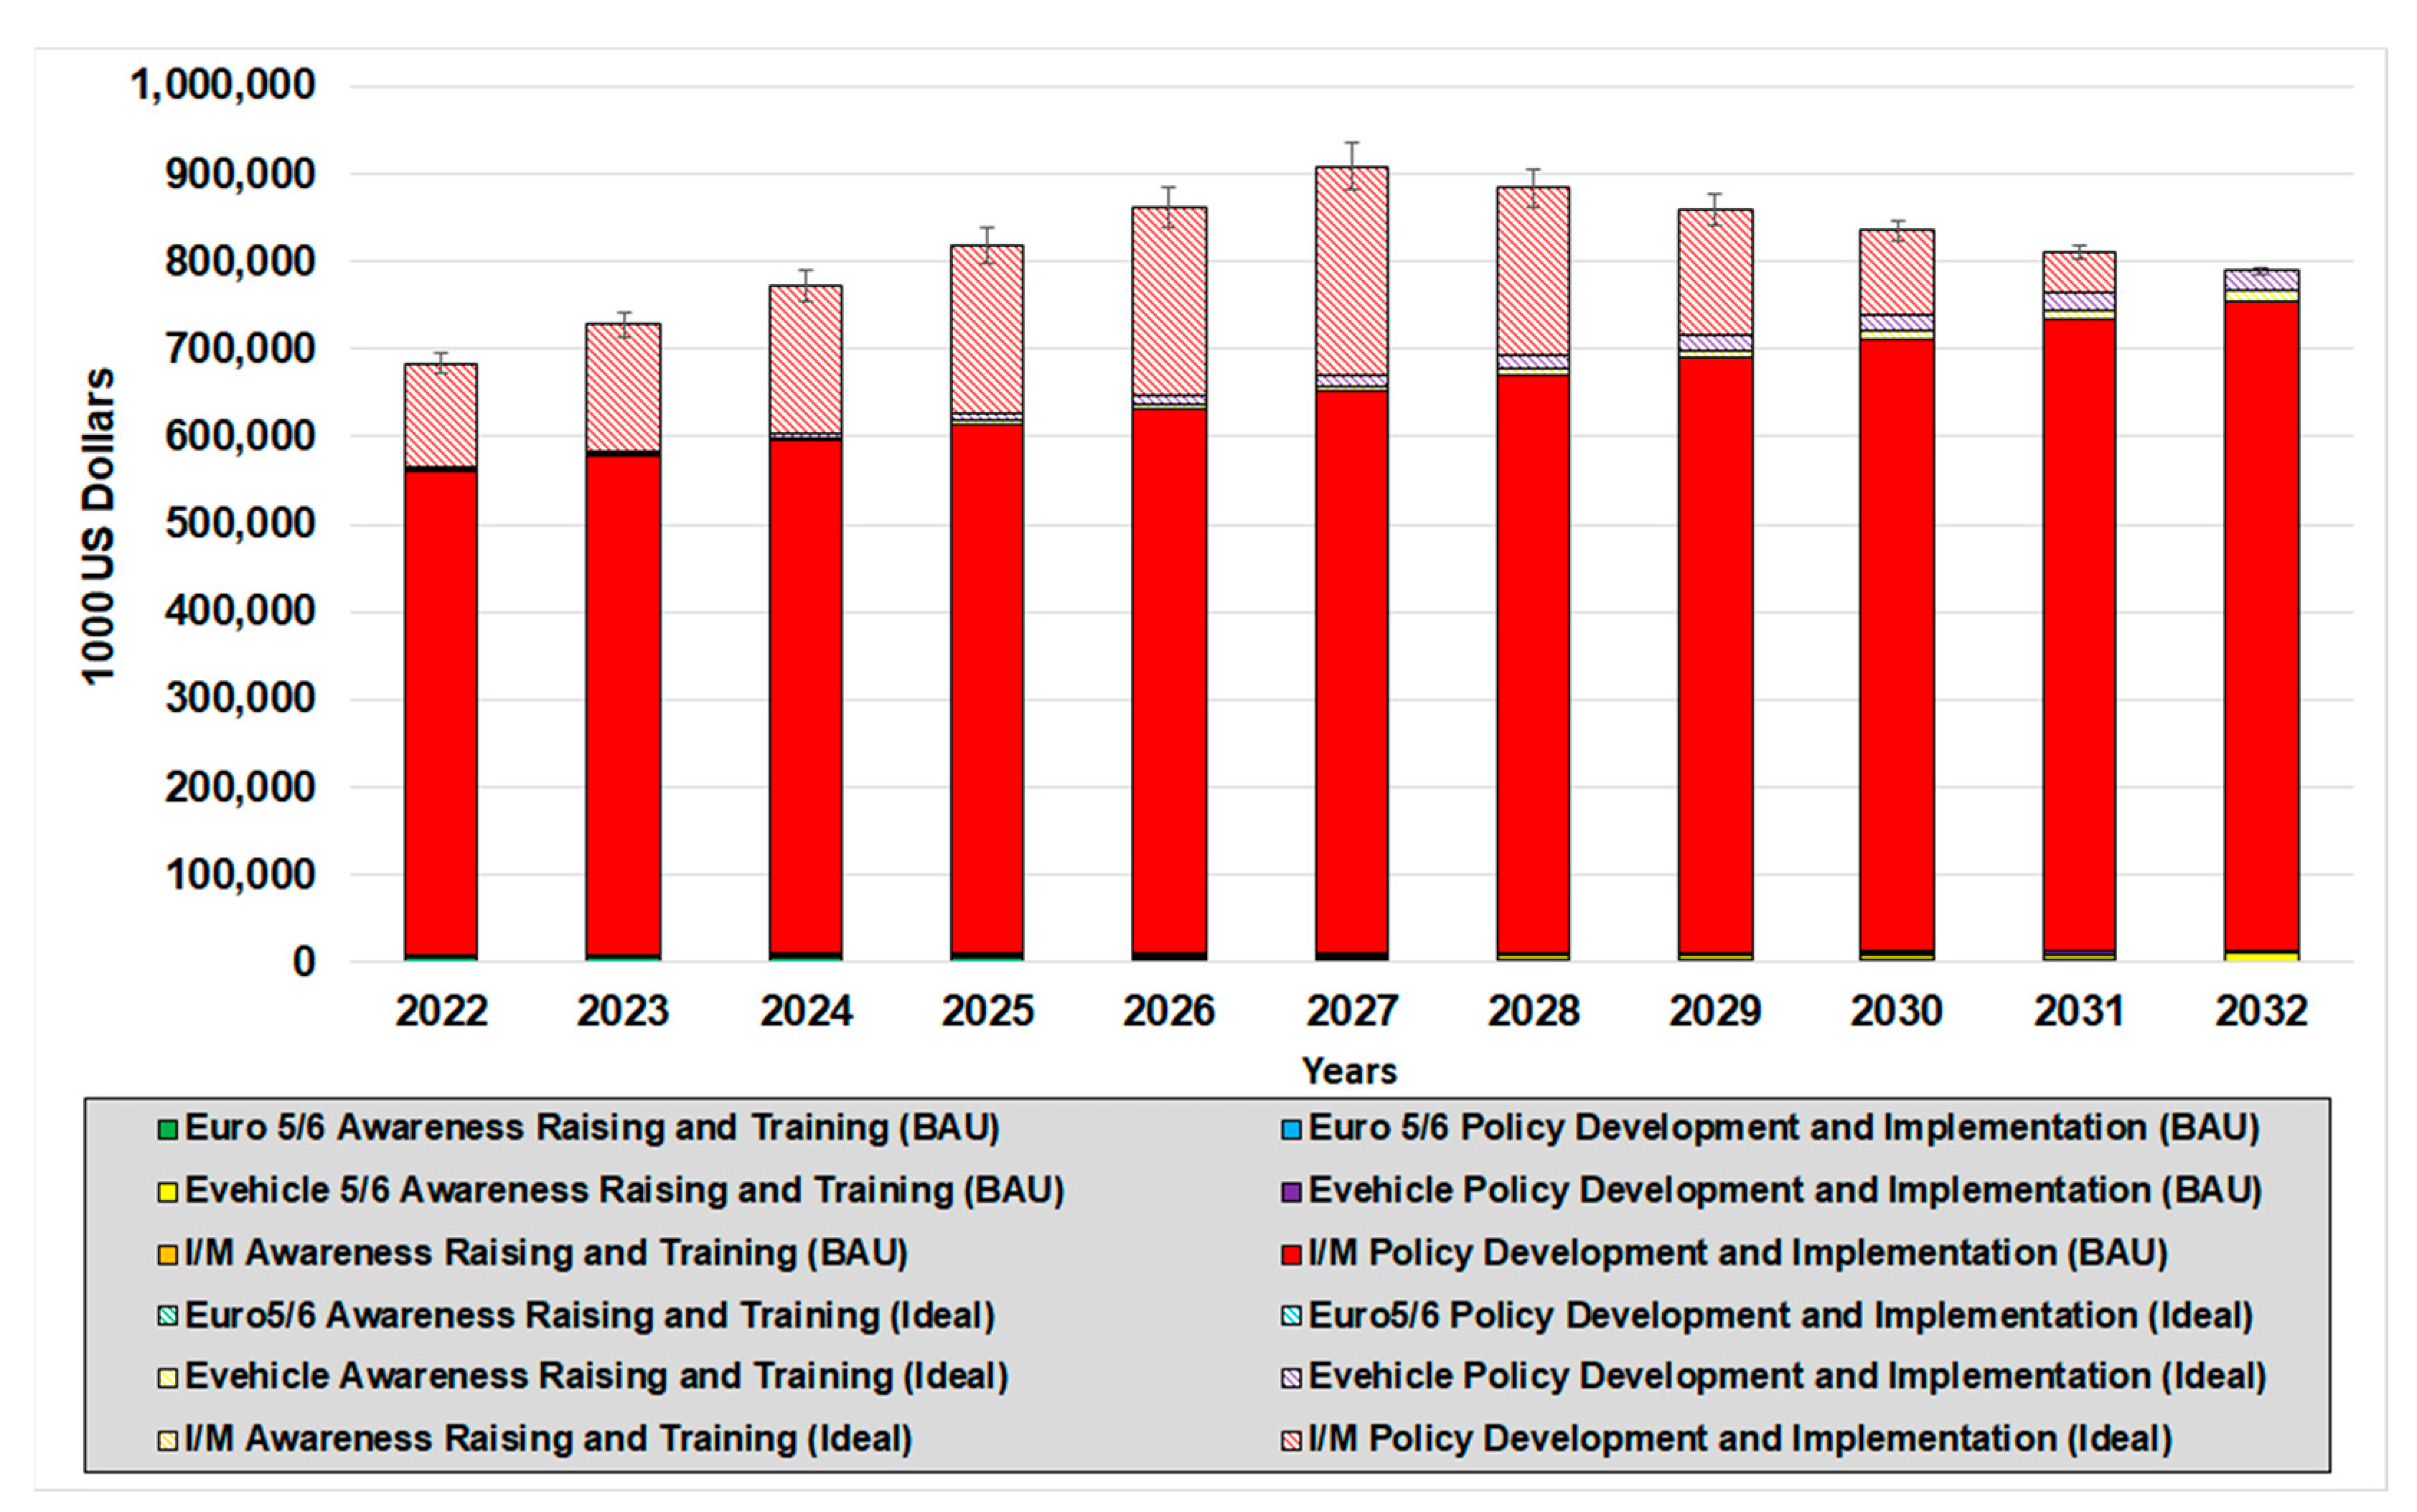
4.2. The Costs of Overcoming Implementation Barriers

This subsection focuses on the costs for implementing the solutions that would help overcome institutional and social barriers to effective implementation, leading to the reductions illustrated by the differences between the black and the blue lines in Figure 3a,b. The results of the estimation of the costs are presented in Figure 4 for cookstoves and Figure 5 for transport. Figure 4 illustrates the implementation costs of the existing programs in solid green and yellow and then the additional costs for an ideal program in shaded green and yellow over a ten-year period. Figure 4 suggests that the costs for implementing the cookstoves programs are approximately USD 300,000 per year (or approximately THB 12 to 14 million); about 70% of that overall total is allocated for policy implementation functions, and the remaining 30% is allocated for awareness-raising functions. Figure 4 also demonstrates that an additional USD 70,000 to 100,000 would be needed for an ideal program that would enhance implementation. In the case of the ideal program, the levels allocated for the ideal program varied over a five-year period (the variation over time was attributable to the decision to focus the first year on scoping activities, the intervening three years on implementation activities, and the last year on monitoring impacts).
Figure 5 presents the transaction costs for implementing solutions in the transport sector. Similar to Figure 4, the colored shades are for existing programs focusing on inspection and maintenance, tighter Euro 5 and 6 emissions standards, and E-vehicles in Figure 4. Figure 4 also suggests that current costs are approximately USD 550 million (i.e., THB 20 billion) per year with the vast majority of those costs allocated for inspection and maintenance. The figure also suggests that approximately an additional USD 180 million in 2027 to USD 270 million in 2032 would improve upon the current performance and that much of the increased costs would shift from inspection and maintenance to E-vehicles over a ten-year period.
To check the robustness of the findings, a sensitivity analysis was performed that increased and reduced the key variable of the “ideal cost” for awareness raising and training and policy development and implementation by 10%. The results of that sensitivity analysis are reflected in the error bars in Figure 4 and Figure 5. The adjustments did not significantly alter the size of those costs or the inferences that could be drawn from the figure that the costs were relatively modest.

5. Discussion

A key implication was related to the findings to shed light on the size of the implementation costs. More concretely, the results suggested that those costs were relatively modest for the transport and cookstove interventions. This was particularly true when comparing the magnitude of those costs with the benefits of effective implementation. To some extent, this might suggest why those costs are not typically factored into modeling. One might argue that the costs were neither significant nor visible and therefore were unlikely to alter policy decisions. However, when viewed from a different perspective, one could also argue that the investments in institutional strengthening and awareness raising needed to achieve benefits were relatively affordable (the difference between the blue and black lines in Figure 3a,b).
A second implication from the estimates of the transaction costs involved the difference in their magnitudes between cookstove and transport interventions. As is evident from Figure 4 and Figure 5, the transaction costs for transport were several orders of magnitude greater than those for cookstoves. To some extent, this may reflect the fact that cleaner stoves and fuels have arguably spread to many parts of Thailand, while clean and sustainable transport remains a concern in most parts of the country. At the same time, when looking at the relative contributions to emissions and associated co-benefits, some might argue it is important to invest resources into a policy push that strengthens institutions and awareness raising to reduce emissions from residential energy. This also stands to reason since many of those investments could have synergies with children’s/women’s health and other Sustainable Development Goals (SDGs).
A third implication warranting attention was the difference between the transaction costs in the transport sector. As is also apparent from Figure 4, improving inspection and maintenance required the greatest investment of government funds. This was understandable as the program required creating and overseeing a network of entities and organizations that were engaged in labor-intensive monitoring of vehicles. At the same time, the estimates also underlined the importance of the design of the program and using advanced technologies to reduce these costs (such as low-cost sensors and cameras to identify super-emitting vehicles), as well as curbing incentives for engaging in corrupt practices.
A fourth implication was that the study offered a relatively straightforward set of methods for estimating the costs of overcoming barriers that are often discussed at the margins of the co-benefit literature. The approach used to assess those barriers and translate the costs of overcoming key hurdles was needed because it was often these non-economic barriers (and the related costs) that stood in the way of achieving co-benefits. Estimating the costs of overcoming these barriers was also useful because it opened opportunities for the inclusion of quantitative data in IAMs and other data-driven modeling that was used to estimate co-benefits. In so doing, it was building a bridge between quantitative work on co-benefits that tended to downplay difficult-to-measure barriers and work on feasibility and transaction costs that focused more on quantitatively assessing these issues.
A fifth implication pertained to what policymakers could do with the cost estimates that emerged from making connections between those literatures. The clearest application of the results involved looking more closely at how much governments would spend on implementing development-friendly climate solutions. A closer look at these costs could potentially motivate greater investments in institutional capacity building and awareness-raising programs. It might also encourage policymakers to take a closer look at whether existing institutional arrangements and other parts of the enabling environment are designed to support implementation.

6. Conclusions

This study sought to demonstrate and apply methods to assess the costs of overcoming barriers to implementing co-benefit solutions from the residential energy and transport sector in Thailand. It argued that those methods could help fill a critical gap in work on co-benefits. That gap is the inattention to the costs of implementing solutions that this line of work often recommends. By estimating these costs, the study makes a stronger link to the data-driven scenario-based modeling that is often used in that line of work. Presenting an estimate of those costs can also motivate discussions between decision-makers at different levels over the kinds of enabling reforms that can strengthen the implementation of co-benefit solutions in key sectors.
While the methods and the results that they generated were useful, the study also had limitations that could be addressed in future research. The first such limitation was that the framing of barriers and transaction costs was narrow. More concretely, the study concentrated on barriers to and the costs of implementing a solution from the perspective of a government official. There was less attention to the social barriers and costs that might be incurred by the user of a cleaner technology or non-technical solution. One might reasonably argue that this view leaves out the time and effort, for instance, a new cookstove user would have to make in selecting a new stove and adapting different ways of cooking to their lifestyles. A closer examination of these costs could offer a clearer picture of what it takes to overcome the social barriers. In the future, it would be helpful to complement the approach presented herein with a user-based survey or field research to determine what would be the magnitude of those costs at the individual and more aggregate levels. It would similarly be helpful to map the relationships between different kinds of barriers and determine if there are risks that even a well-designed strategy to remove a social barrier is complicated by an economic or institutional barrier that locks in the status quo.
Yet another related area for future research involves looking more closely at different types of costs. A fair criticism of this work involves the difficulty of drawing a clear line between different costs. Future research might examine more carefully how costs are calculated in work using IAMs and transaction costs. This research could more carefully classify and differentiate costs and determine where there is variation across models in cost categories. For example, there may be overlap between capital and operational costs and the transaction costs for E-vehicle promotional programs. Looking more closely at the classification of costs may also help clarify how transaction costs can be more explicitly captured in IAMs. For instance, it may be possible to add estimated transaction costs such as the 2% of the renewable energy program budget to an assumed set of “push” subsidies that are needed to make cleaner solutions more cost competitive. A closer look at costs of this will also be useful for cross-IAM comparison more generally.
A final limitation and area for future research involves expanding the number of sectors and solutions covered in this kind of analysis. More robust results would be obtained if more emission reduction measures were assessed. In addition, although the barriers and transaction costs were identified specifically for Thailand, a logical extension would involve applying the methodology to other countries and regions. This study relied heavily on not only publicly available data on actual budgets for policy implementation and personnel costs for government employees but also insights into future costs and staffing needs.

Supplementary Materials

Supplementary materials can be downloaded at: https://www.mdpi.com/article/10.3390/cli13030064/s1.

Author Contributions

Conceptualization, K.A., E.Z., T.H. (Tatsuya Hanaoka), K.K. and Y.G.; methodology, K.A., E.Z. and T.H. (Tatsuya Hanaoka); validation, S.W., N.O., and M.A.; data curation, S.W., I.P.-A.; writing—original draft preparation, writing—review and editing, K.A., E.Z., T.H. (Tatsuya Hanaoka), T.H. (Tomoki Hirayama), K.K. and Y.G.; visualization, K.A., E.Z. and T.H. (Tatsuya Hanaoka); supervision, K.A. and M.A.; funding acquisition, K.A.; investigation, K.A., E.Z., T.H. (Tatsuya Hanaoka). Funding: K.A., E.Z., T.H. (Tomoki Hirayama). All authors have read and agreed to the published version of the manuscript.

Funding

This research was partially funded by the Environment Research and Technology Development Fund S-20-3 [JPMEERF21S12013 and JPMEERF21S12030] of the Environmental Restoration and Conservation Agency with resources provided by the Ministry of Environment of Japan. K.A. and E.Z. also appreciate support from the Wellcome Trust for a project entitled ‘Leveraging co-benefits for healthy net-zero transitions in Japanese and other G7 cities: A scalable approach for transformative change’.

Institutional Review Board Statement

The study was conducted in accordance with the Declaration of Helsinki, and principles and ethics training offered at the Institute for Global Environmental Strategies.

Informed Consent Statement

Informed consent was obtained from all subjects involved in the study.

Data Availability Statement

The original contributions presented in the study are included in the article, further inquiries can be directed to the corresponding author.

Conflicts of Interest

Author Tomoki Hirayama and Yurie Goto were employed by the company Mizuho Research and Technologies, author Kazumasa Kawashima was employed by the company Mitsubishi UFJ Research and Consulting. The remaining authors declare that the research was conducted in the absence of any commercial or financial relationships that could be construed as a potential conflict of interest.

References

  1. Zusman, E.; Miyatsuka, A. Conference Report: Translating co-benefits research into action in Asia: Science, models, projects and policies. Carbon Manag. 2013, 4, 369–371. [Google Scholar] [CrossRef]
  2. Zusman, E.; Chae, Y.; Kim, H.; Farzaneh, H. An Introduction to Co-benefits: Core Concepts and Applications. In Aligning Climate Change and Sustainable Development Policies in Asia; Farzaneh, H., Zusman, E., Chae, Y., Eds.; Springer: Singapore, 2021; pp. 1–15. [Google Scholar]
  3. Zusman, E.; Miyatsuka, A.; Evarts, D.; Oanh, N.T.K.; Patdu, K.; Amann, M. Co-benefits: Taking a Multidisciplinary Approach. Carbon Manag. 2013, 4, 135–137. [Google Scholar]
  4. Miyatsuka, A.; Zusman, E. Fact Sheet No. 1 What are Co-benefits? ACP Fact Sheet 2008, 1, 1–3. [Google Scholar]
  5. Mayrhofer, J.P.; Gupta, J. The science and politics of co-benefits in climate policy. Environ. Sci. Policy 2016, 57, 22–30. [Google Scholar] [CrossRef]
  6. Karlsson, M.; Alfredsson, E.; Westling, N. Climate policy co-benefits: A review. Clim. Policy 2020, 20, 292–316. [Google Scholar]
  7. Zusman, E.; Unger, C.; Borgford-Parnell, N.; Mar, K.A. One Atmosphere: Integrating Air Pollution and Climate Policy and Governance. Atmosphere 2021, 12, 1570. [Google Scholar] [CrossRef]
  8. Schneider, S.H. The greenhouse effect: Science and policy. Science 1989, 243, 771–781. [Google Scholar] [CrossRef]
  9. Ayres, R.; Walter, J. The greenhouse effect: Damages, costs and abatement. Environ. Resour. Econ. 1991, 1, 237–270. [Google Scholar]
  10. Elkins, P. How large a carbon tax is justified by the secondary benefits of CO2 abatement? Environ. Resour. Econ. 1996, 18, 161–187. [Google Scholar]
  11. Aunan, K.; Fang, J.; Vennemo, H.; Oye, K.; Seip, M.H. Co-benefits of Climate Policy-Lessons Learned from a Study in Shanxi, China. Energy Policy 2004, 32, 567–581. [Google Scholar]
  12. Pearce, D. Policy Frameworks for the Ancillary Benefits of Climate Policies. In Ancillary Benefits and Costs of Greenhouse Gas Mitigation; OECD: Paris, France, 2000; pp. 517–560. [Google Scholar]
  13. IPCC. Climate Change 2022: Mitigation of Climate Change. In Contribution of Working Group III to the Sixth Assessment Report of the Intergovernmental Panel on Climate Change; Shukla, P.R., Skea, J., Slade, R., Khourdajie, A.A., Diemen, R., van McCollum, D., Pathak, M., Some, S., Vyas, P., Fradera, R., et al., Eds.; Cambridge University Press: Cambridge, UK; New York, NY, USA, 2022. [Google Scholar] [CrossRef]
  14. Dharmala, N.; Kholod, N.; Chaturvedi, V.; Ghosh, P.P.; Mathur, R.; Bali, S.; Behera, A.; Chamola, S.; Clarke, L.; Evans, M.; et al. Win-win transportation strategies for India: Linking air pollution and climate mitigation. Energy Clim. Change 2022, 3, 100072. [Google Scholar] [CrossRef]
  15. Ürge-Vorsatz, D.; Tirado-Herrero, S.; Dubash, N.; Lecocq, F. Measuring the Co-Benefits of Climate Change Mitigation. Annu. Rev. Environ. Resour. 2014, 39, 549–582. [Google Scholar]
  16. Islam, K.N. Municipal solid waste to energy generation: An approach for enhancing climate co-benefits in the urban areas of Bangladesh. Renew. Sustain. Energy Rev. 2018, 81, 2472–2486. [Google Scholar]
  17. Quam, V.G.M.; Rocklöv, J.; Quam, M.B.M.; Lucas, R.A.I. Assessing Greenhouse Gas Emissions and Health Co-Benefits: A Structured Review of Lifestyle-Related Climate Change Mitigation Strategies. Int. J. Environ. Res. Public Health 2017, 14, 468. [Google Scholar] [CrossRef] [PubMed]
  18. Song, J.; Dong, X.; Yang, W.; Xing, J.; Wang, X. Environmental co-benefits of energy recovery from wastewater of typical industrial sectors from life cycle perspective: Regional potentials in China. Energy Convers. Manag. 2023, 293, 117450. [Google Scholar] [CrossRef]
  19. Zhang, B.; Wang, Q.; Wang, S.; Tong, R. Coal power demand and paths to peak carbon emissions in China: A provincial scenario analysis oriented by CO2-related health co-benefits. Energy 2023, 282, 128830. [Google Scholar] [CrossRef]
  20. Dhar, S.; Pathak, M.; Shukla, P.R. Electric Vehicles and India’s Low Carbon Passenger Transport: A Long-Term Co-Benefits Assessment. J. Clean. Prod. 2017, 146, 139–148. [Google Scholar]
  21. Finn, O.; Brockway, P.E. Much broader than health: Surveying the diverse co-benefits of energy demand reduction in Europe. Energy Res. Soc. Sci. 2023, 95, 102890. [Google Scholar] [CrossRef]
  22. Chatterjee, S.; Ürge-Vorsatz, D. Measuring the productivity impacts of energy-efficiency: The case of high-efficiency buildings. J. Clean. Prod. 2021, 318, 128535. [Google Scholar]
  23. Bragge, P.; Lauren, N.; Pattuwage, L.; Waddell, A.; Lennox, A. Co-Benefits of Sustainable Building and Implications for Southeast Asia; Monash University and Global Buildings Performance Network: Melbourne, Australia, 2021; pp. 1–33. [Google Scholar]
  24. Ho, B.; Vu, K.; Nguyen, T.; Nguyen, H.; Huynh, N.; Tran, H.; Hoa, L.; Fukuda, K.; Shirakawa, Y.; Phu, V.L. Quantifying the Co-benefits of Air Pollution and Greenhouse Gas emission mitigation by operating Metro Line 1 in Ho Chi Minh City, Vietnam. IOP Conf. Ser. Earth Environ. Sci. 2024, 1391, 012014. [Google Scholar] [CrossRef]
  25. Zhang, X.; Yin, S.; Lu, X.; Liu, Y.; Wang, T.; Zhang, B.; Li, Z.; Wang, W.; Kong, M.; Chen, K. Establish of air pollutants and greenhouse gases emission inventory and co-benefits of their reduction of transportation sector in Central China. J. Environ. Sci. 2025, 150, 604–621. [Google Scholar] [CrossRef]
  26. Zhang, R.; Hanaoka, T.; Liu, J.; Li, Z.; Sun, L. Air pollution reduction co-benefits associated with low-carbon transport initiatives for carbon neutrality in China by 2060. Energy 2024, 313, 134090. [Google Scholar] [CrossRef]
  27. New Climate Institute. Assessing the Achieved and Missed Benefits of Japan’s Intended Nationally Determined Contribution (INDC); New Climate Institute: Berlin, Germany, 2015. [Google Scholar]
  28. Malley, C.S.; Sokharavuth, P.; Thiv, S.; Nara, C.; Him, C.; Sokyimeng, S.; Henze, D.K.; Holmes, R.; Kuylenstierna, J.C.I.; Michalopoulou, E.; et al. Air Pollution Mitigation Assessment to Inform Cambodia’s First Clean Air Plan. SSRN Electron. J. 2022, 220, 115230. [Google Scholar] [CrossRef]
  29. CCAC; UNEP. Short-Lived Climate Pollutants Short-Lived Climate Pollutants in Latin America; CCAC: Paris, France, 2018; ISBN 978-92-807-3549-9. [Google Scholar]
  30. UNEP; APCAP; CCAC. Air Pollution in Asia and the Pacific: Science-Based Solutions; United Nations Environment Programme; UNEP: Nairobi, Kenya, 2019; Available online: https://www.unep.org/resources/assessment/air-pollution-asia-and-pacific-science-based-solutions (accessed on 24 February 2025).
  31. Zusman, E.; Hengesbaugh, M.; Dang, E.-M.; Precious, B.; Merlin, L.; Miaojie, S.; Xuan, X. Training Curriculum Integrating Air Pollution and Climate Change Planning in Cities in Asia; CCAC: Paris, France, 2021. [Google Scholar]
  32. Jewell, J.; Cherp, A. On the political feasibility of climate change mitigation pathways: Is it too late to keep warming below 1.5 °C? Wiley Interdiscip. Rev. Clim. Change 2020, 11, 1–12. [Google Scholar] [CrossRef]
  33. Loftus, P.J.; Cohen, A.M.; Long, J.C.S.; Jenkins, J.D. A critical review of global decarbonization scenarios: What do they tell us about feasibility? Wiley Interdiscip. Rev. Clim. Change 2015, 6, 93–112. [Google Scholar] [CrossRef]
  34. Roe, S.; Streck, C.; Beach, R.; Busch, J.; Chapman, M.; Daioglou, V.; Deppermann, A.; Doelman, J.; Emmet-Booth, J.; Engelmann, J.; et al. Land-based measures to mitigate climate change: Potential and feasibility by country. Glob. Change Biol. 2021, 27, 6025–6058. [Google Scholar] [CrossRef]
  35. Majone, G. The feasibility of social policies. Policy Sci. 1975, 6, 49–69. [Google Scholar]
  36. Majone, G. On the notion of political feasibility. Eur. J. Political Res. 1975, 3, 259–274. [Google Scholar]
  37. IPCC. The Fourth Assessment Report of the Intergovernmental Panel on Climate Change; IPCC: Geneva, Switzerland, 2007. [Google Scholar]
  38. IPCC. Global Warming of 1.5 °C. In An IPCC Special Report on the Pathways, of Global Warming of 1.5 °C Above Pre-Industrial Levels and Related Global Greenhouse Gas Emission in the Context of Strengthening the Global Response to the Threat of Climate Change, Sustain; Masson-Delmotte, V., Zhai, P., Pörtner, H.-O., Roberts, D., Skea, J., Shukla, P.R., Pirani, A., Moufouma-Okia, W., Péan, C., Pidcock, R., et al., Eds.; IPCC: Geneva, Switzerland, 2018. [Google Scholar]
  39. Brutschin, E.; Pianta, S.; Tavoni, M.; Riahi, K.; Bosetti, V.; Marangoni, G.; Van Ruijven, B.J. A multidimensional feasibility evaluation of low-carbon scenarios. Environ. Res. Lett. 2021, 16, 064069. [Google Scholar] [CrossRef]
  40. Nielsen, K.S.; Stern, P.C.; Dietz, T.; Gilligan, J.M.; van Vuuren, D.P.; Figueroa, M.J.; Folke, C.; Gwozdz, W.; Ivanova, D.; Reisch, L.A.; et al. Improving Climate Change Mitigation Analysis: A Framework for Examining Feasibility. One Earth 2020, 3, 325–336. [Google Scholar] [CrossRef]
  41. Steg, L.; Veldstra, J.; de Kleijne, K.; Kılkış, Ş.; Lucena, A.F.P.; Nilsson, L.J.; Sugiyama, M.; Smith, P.; Tavoni, M.; de Coninck, H.; et al. A method to identify barriers to and enablers of implementing climate change mitigation options. One Earth 2022, 5, 1216–1227. [Google Scholar] [CrossRef]
  42. Bertram, C.; Brutschin, E.; Drouet, L.; Luderer, G.; van Ruijven, B.; Aleluia Reis, L.; Baptista, L.B.; de Boer, H.-S.; Cui, R.; Daioglou, V.; et al. Feasibility of peak temperature targets in light of institutional constraints. Nat. Clim. Change 2024, 14, 954–960. [Google Scholar] [CrossRef]
  43. Hanaoka, T.; Masui, T.; Matsuoka, Y.; Hibino, G.; Fujiwara, K.; Motoki, Y.; Oshiro, K. AIM/Enduse Model Manual; NIES: Tsukuba, Japan, 2015. [Google Scholar]
  44. Klaassen, G.; Amann, M.; Berglund, C.; Cofala, J.; Hoeglund-Isaksson, L.; Heyes, C.; Mechler, R.; Tohka, A.; Schoepp, W.; Winiwarter, W. The Extension of the RAINS Model to Greenhouse Gases; IIASA Interim Report; IIASA: Laxenberg, Austria, 2004. [Google Scholar]
  45. Amann, M.; Bertok, I.; Borken-Kleefeld, J.; Cofala, J.; Heyes, C.; Höglund-Isaksson, L.; Klimont, Z.; Nguyen, B.; Posch, M.; Rafaj, P.; et al. Cost-effective control of air quality and greenhouse gases in Europe: Modeling and policy applications. Environ. Model. Softw. 2011, 26, 1489–1501. [Google Scholar] [CrossRef]
  46. Coase, R. The Problem of Social Cost. J. Law Econ. 1960, III, 2–69. [Google Scholar]
  47. North, D.C. Institutions, Institutional Change and Economic Performance; Cambridge University Press: Cambridge, UK, 1990. [Google Scholar]
  48. Gordon, R.L. Transaction Costs, Property Rights, and the Limits of Government. In Regulation and Economic Analysis. Topics in Regulatory Economics and Policy Series; Springer: Boston, MA, USA, 1994. [Google Scholar]
  49. Kuperan, K. Measuring Transaction Costs of Fisheries Co-Management. Coast. Manag. 2008, 36, 225–240. [Google Scholar] [CrossRef]
  50. McCann, L.; Colby, B.; Easter, K.W.; Kasterine, A.; Kuperan, K.V. Transaction cost measurement for evaluating environmental policies. Ecol. Econ. 2005, 52, 527–542. [Google Scholar] [CrossRef]
  51. McCann, L.E.; Easter, W.K. Estimates of Public Sector Transaction Costs in NRCS Programs. J. Agric. Appl. Econ. 2000, 1, 555–563. [Google Scholar] [CrossRef]
  52. Fang, F.; Easter, K.W.; Brezonik, P.L. Point-nonpoint source water quality trading: A case study in the Minnesota River Basin. J. Am. Water Resour. Assoc. 2005, 41, 645–657. [Google Scholar] [CrossRef]
  53. Falconer, K.; Dupraz, P.; Whitby, M. An investigation of policy administrative costs using panel data for the English environmentally sensitive areas. J. Agric. Econ. 2001, 83–103. [Google Scholar] [CrossRef]
  54. Cuypers, I.R.P.; Hennart, J.-F.; Silverman, B.S.; Ertug, G. Transaction cost theory: Past progress, current challenges, and suggestions for the future. ANNALS 2021, 15, 111–150. [Google Scholar] [CrossRef]
  55. Li, C.-Y.; Fang, Y.-H. The more we get together, the more we can save? A transaction cost perspective. Int. J. Inf. Manag. 2022, 62, 102434. [Google Scholar] [CrossRef]
  56. Princz-Jakovics, T.; Szemenyei, M. Development of an e-governance system to support cooperative environmental policy actions. Env. Syst Decis 2024, 44, 763–778. [Google Scholar] [CrossRef]
  57. Janardhanan, N.; Zusman, E.; Hengesbaugh, M.; Olsen, S.; Lee, S.-Y.; Akahoshi, K.; Takai, E.; Patdu, M.K.; Nagatani-Yoshida, K.; Bathan-Baterina, G.; et al. Integrating Clean Air, Climate, and Health Policies in the COVID-19 Era; Asian Co-Benefits Partnership: Hayama, Japan, 2021. [Google Scholar]
  58. ACP. Asian Co-Benefits Partnership White Paper 2014 Bringing Development And Climate Together; Asian Co-benefits Partnership: Hayama, Japan, 2014. [Google Scholar]
  59. CCAC. Clean Air and Climate Change Solutions in Southeast Asia; UNEP: Nairobi, Kenya, 2025. [Google Scholar]
  60. Clean Air Asia. Vehicle Inspection & Maintenance in Asia: Status and Challenges 2016; Clean Air Asia: Manila, Philippines, 2016. [Google Scholar]
  61. Dandapat, S.; Ghosh, T.; Shankar, U.; Maitra, S.; Maitra, B. A relook at the pollution certification of in-use vehicles in India and a way forward. Asian Transp. Stud. 2020, 6, 100020. [Google Scholar] [CrossRef]
  62. Dasgupta, S.; Laplante, B.; Mamingi, N.; Wang, H. Inspections, pollution prices, and environmental performance: Evidence from China. Ecol. Econ. 2001, 36, 487–498. [Google Scholar]
  63. Hausker, K. Vehicle Inspection and Maintenance Programs: International Experience and Best Practices; US Office of Energy and Information Technology: Washington, DC, USA, 2004.
  64. Li, Y.; Crawford-Brown, D.J. Assessing the co-benefits of greenhouse gas reduction: Health benefits of particulate matter related inspection and maintenance programs in Bangkok, Thailand. Sci. Total Environ. 2011, 409, 1774–1785. [Google Scholar] [CrossRef] [PubMed]
  65. Chang, C.-W.; Chang, S.-H.; Chiu, H.-J.; Liu, Y.-C. Understanding consumers’ intention to switch to electric motorcycles: A transaction cost economics perspective. Australas. J. Environ. Manag. 2022, 29, 7–23. [Google Scholar] [CrossRef]
  66. Chalise, N.; Kumar, P.; Priyadarshini, P.; Yadama, G.N. Dynamics of sustained use and abandonment of clean cooking systems: Lessons from rural India. Environ. Res. Lett. 2018, 13, 035010. [Google Scholar] [CrossRef]
  67. Limmeechokchai, B.; Chawana, S. Sustainable energy development strategies in the rural Thailand: The case of the improved cooking stove and the small biogas digester. Renew. Sustain. Energy Rev. 2007, 11, 818–837. [Google Scholar] [CrossRef]
  68. Thoday, K.; Benjamin, P.; Gan, M.; Puzzolo, E. The Mega Conversion Program from kerosene to LPG in Indonesia: Lessons learned and recommendations for future clean cooking energy expansion. Energy Sustain. Dev. 2018, 46, 71–81. [Google Scholar] [CrossRef]
  69. Akahoshi, K.; Zusman, E.; Hanaoka, T.; Kim Oanh, N.T.; Huy, L.N.; Wangwongwatana, S.; Homyok, P.; Malley, C.S.; Hirayama, T.; Goto, Y.; et al. The Prospects of Controlling Open Burning of Crop Residues in Thailand: A Quantitative Assessment of Implementation Barriers and Costs. Atmosphere 2024, 15, 1309. [Google Scholar] [CrossRef]
  70. Zusman, E.; Akahoshi, K.; Hanaoka, T.; Malley, C.; Wangwongwatana, S.; Onmek, N.; Ittipol, P.; Kim Oanh, N.-T.; Huy Lai Nguyen Kuylenstierna, J.C.; Hirayama, T.; et al. The Truth About Co-Benefits: A Multidimensional Feasibility Assessment for Thailand and Beyond. Environ. Res. Commun. Rev. 2025, 7, 025009. [Google Scholar]
  71. Lund, P. Market penetration rates of new energy technologies. Energy Policy 2006, 34, 3317–3326. [Google Scholar] [CrossRef]
  72. Sovacool, B.K. How long will it take? Conceptualizing the temporal dynamics of energy transitions. Energy Res. Soc. Sci. 2016, 13, 202–215. [Google Scholar] [CrossRef]
  73. Grubler, A. Energy transitions research: Insights and cautionary tales. Energy Policy 2012, 50, 8–16. [Google Scholar] [CrossRef]
  74. Bento, N.; Wilson, C. Measuring the duration of formative phases for energy technologies. Environ. Innov. Soc. Transit. 2016, 21, 95–112. [Google Scholar] [CrossRef]
  75. McCann, L.; Easter, K.W. Transaction Costs of Policies to Reduce Agricultural Phosphorous Pollution in the Minnesota River. Land Econ. 1999, 75, 402–414. [Google Scholar] [CrossRef]
  76. Krutilla, K.; Krause, R. Transaction Costs and Environmental Policy: An Assessment Framework and Literature Review. IRERE 2011, 4, 261–354. [Google Scholar] [CrossRef]
  77. Pollution Control Department. PM2.5 Control Plan; Pollution Control Department: Bangkok, Thailand, 2019. [Google Scholar]
  78. Bank of Thailand. Average Wage Classified by Occupation. Available online: https://app.bot.or.th/BTWS_STAT/statistics/ReportPage.aspx?reportID=667&language=eng (accessed on 25 February 2025).
  79. Seto, K.C.; Churkina, G.; Hsu, A.; Keller, M.; Newman, P.W.G.; Qin, B.; Ramaswami, A. From Low- To Net-Zero Carbon Cities- To Next Global Agenda. Annu. Rev. Environ. Resour. 2021, 46, 377–415. [Google Scholar] [CrossRef]
  80. Unruh, G.C. Escaping carbon lock-in. Energy Policy 2002, 30, 317–325. [Google Scholar]
  81. Seto, K.C.; Davis, S.J.; Mitchell, R.B.; Stokes, E.C.; Unruh, G.; Urge-Vorsatz, D. Carbon lock-in: Types, causes and policy implications. Annu. Rev. Environ. Resour. 2016, 41, 425–452. [Google Scholar]
Figure 1. Estimated delays for co-benefit solutions in Thailand (see Supplementary Materials for a summary of how the sizes of barriers were estimated).
Climate 13 00064 g001
Figure 2. Steps for calculating costs.
Climate 13 00064 g002
Figure 3. (a,b) Black carbon emissions and estimated effects of barriers and delays (see Supplementary Materials for details on the calculation).
Climate 13 00064 g003
Figure 4. Estimated transaction costs for cookstove interventions from 2022 to 2032.
Climate 13 00064 g004
Figure 5. Estimated transaction costs for transport interventions from 2022 to 2032.
Climate 13 00064 g005
Table 1. Assumptions for transaction costs.
SectorSolutionBAUIdeal
TransportEmissions standardsIncrease budget by 3% annuallyReduce budget to 0 over a ten-year period (interpolate budget figures for 2022–2032)
E-vehiclesIncrease budget by 7% annuallyIncrease the budget by ten times over a ten-year period (interpolate budget figures for 2022–2032)
Inspection and maintenanceIncrease budget by 3% annuallyDouble the budget in the first five years, then reduce the budget to 0 at the end of ten years (interpolate budget figures for 2022–2032)
Residential energySwitch to LPGHold budget constant over ten-year periodFunds for a five-year program that begins with awareness raising/needs assessment and concludes with monitoring evaluation (run twice for a total of ten years)
Promote clean stove technologies
Disclaimer/Publisher’s Note: The statements, opinions and data contained in all publications are solely those of the individual author(s) and contributor(s) and not of MDPI and/or the editor(s). MDPI and/or the editor(s) disclaim responsibility for any injury to people or property resulting from any ideas, methods, instructions or products referred to in the content.

