Article

A Convection-Permitting Regional Climate Simulation of Changes in Precipitation and Snowpack in a Warmer Climate over the Interior Western United States

1
Department of Atmospheric and Geological Geosciences, State University of New York at Oswego, Oswego, NY 13126, USA
2
Department of Atmospheric Science, University of Wyoming, Laramie, WY 82071, USA
3
National Center for Atmospheric Research, Boulder, CO 80307, USA
4
Collaborative Innovation Center on Forecast and Evaluation of Meteorological Disasters (CIC-FEMD)/China Meteorological Administration Aerosol-Cloud and Precipitation Key Laboratory, Nanjing University of Information Science and Technology, Nanjing 210044, China
*
Author to whom correspondence should be addressed.
Climate 2025, 13(3), 46; https://doi.org/10.3390/cli13030046
Submission received: 14 January 2025 / Revised: 12 February 2025 / Accepted: 19 February 2025 / Published: 24 February 2025

Abstract

:
This study investigates the impacts of climate change on precipitation and snowpack in the interior western United States (IWUS) using two sets of convection-permitting Weather Research and Forecasting model simulations. One simulation represents the ~1990 climate, and another represents an ~2050 climate using a pseudo-global warming approach. Climate perturbations for the future climate are given by the CMIP5 ensemble-mean global climate models under the high-end emission scenario. The study analyzes the projected changes in spatial patterns of seasonal precipitation and snowpack, with particular emphasis on the effects of elevation on orographic precipitation and snowpack changes in four key mountain ranges: the Montana Rockies, Greater Yellowstone area, Wasatch Range, and Colorado Rockies. The IWUS simulations reveal an increase in annual precipitation across the majority of the IWUS in this warmer climate, driven by more frequent heavy to extreme precipitation events. Winter precipitation is projected to increase across the domain, while summer precipitation is expected to decrease, particularly in the High Plains. Snow-to-precipitation ratios and snow water equivalent are expected to decrease, especially at lower elevations, while snowpack melt is projected to occur earlier by up to 26 days in the ~2050 climate, highlighting significant impacts on regional water resources and hydrological management.

1. Introduction

The impact of a changing climate on precipitation and snowpack in mountainous regions is of significant concern due to the critical role they play in regional hydrology and water resources [1,2,3]. The western United States is characterized by its diverse climate and complex terrain, featuring prominent mountain ranges like the Rocky Mountains, Sierra Nevada, and Cascade Range [4,5]. Studies have shown that, in a warming climate, there is a widespread decline in mountain snowpack across the western United States [5], along with reduced streamflow in the Colorado, Columbia, and San Joaquin–Sacramento basins [6]. Some research attributes these declines in snowpack and streamflow to higher evapotranspiration (ET) and earlier snowmelt in a warming environment [6,7]. Ref. [2] suggested that part of the streamflow decline is also driven by a decrease in wintertime precipitation at higher elevations.
This study focuses on the interior western United States (IWUS), which covers much of the mountainous western United States, excluding the West Coast (Figure 1). Water availability is crucial for the IWUS, as it hosts the headwaters of several major river systems, including the Colorado, Missouri, and Snake rivers. For instance, the Colorado River supplies water for irrigation and serves around 40 million people in the southwestern United States [8]. However, this region is arid, with much of its agricultural and residential water use dependent on orographic precipitation [9]. The risk of severe droughts in the IWUS is expected to rise throughout the twenty-first century (e.g., [3]), further restricting water availability. Accurately modeling changes in precipitation and snowpack, two key components of the water cycle, is essential as water is a vital resource that impacts nearly every sector of the local economy, including agriculture and drinking water supply.
Recent studies show that current climate models with relatively coarse horizontal grid spacing tend to underestimate and poorly resolve snowfall and snowpack due to the inadequate representation of topography in the IWUS [11,12]. Additionally, accurate future streamflow estimates depend on correctly simulating both precipitation and ET because runoff is determined by the balance between these two factors [13]. Consequently, high-resolution climate models are essential for regions with complex terrain, such as the IWUS, as they can reduce errors from deep convection parameterizations and provide more accurate depictions of orography [14]. Recent studies using regional climate models (RCMs) with a convection-permitting horizontal grid spacing indicate a likely increase in winter precipitation for the IWUS under warmer climate scenarios [11,12,15,16]. Changes in snow–rain partitioning and seasonal snowpack evolution are critical in the relatively arid IWUS [12], yet studies addressing these issues remain limited.
The convection-permitting historical climate simulation, with a 4 km horizontal grid spacing, presented in [10], accurately captures precipitation and snowpack patterns in the IWUS. This study builds upon the model framework used in [10] to investigate how precipitation and snowpack in the IWUS are projected to change under a ~2050 climate, using a pair of 30-year RCM simulations. The 30-year period is essential to establish stable climate conditions, including both mean values and distributions. The paper is organized as follows: Section 2 outlines the numerical approach, Section 3 presents the results, Section 4 discusses the implications and limitations, and Section 5 summarizes the main findings.

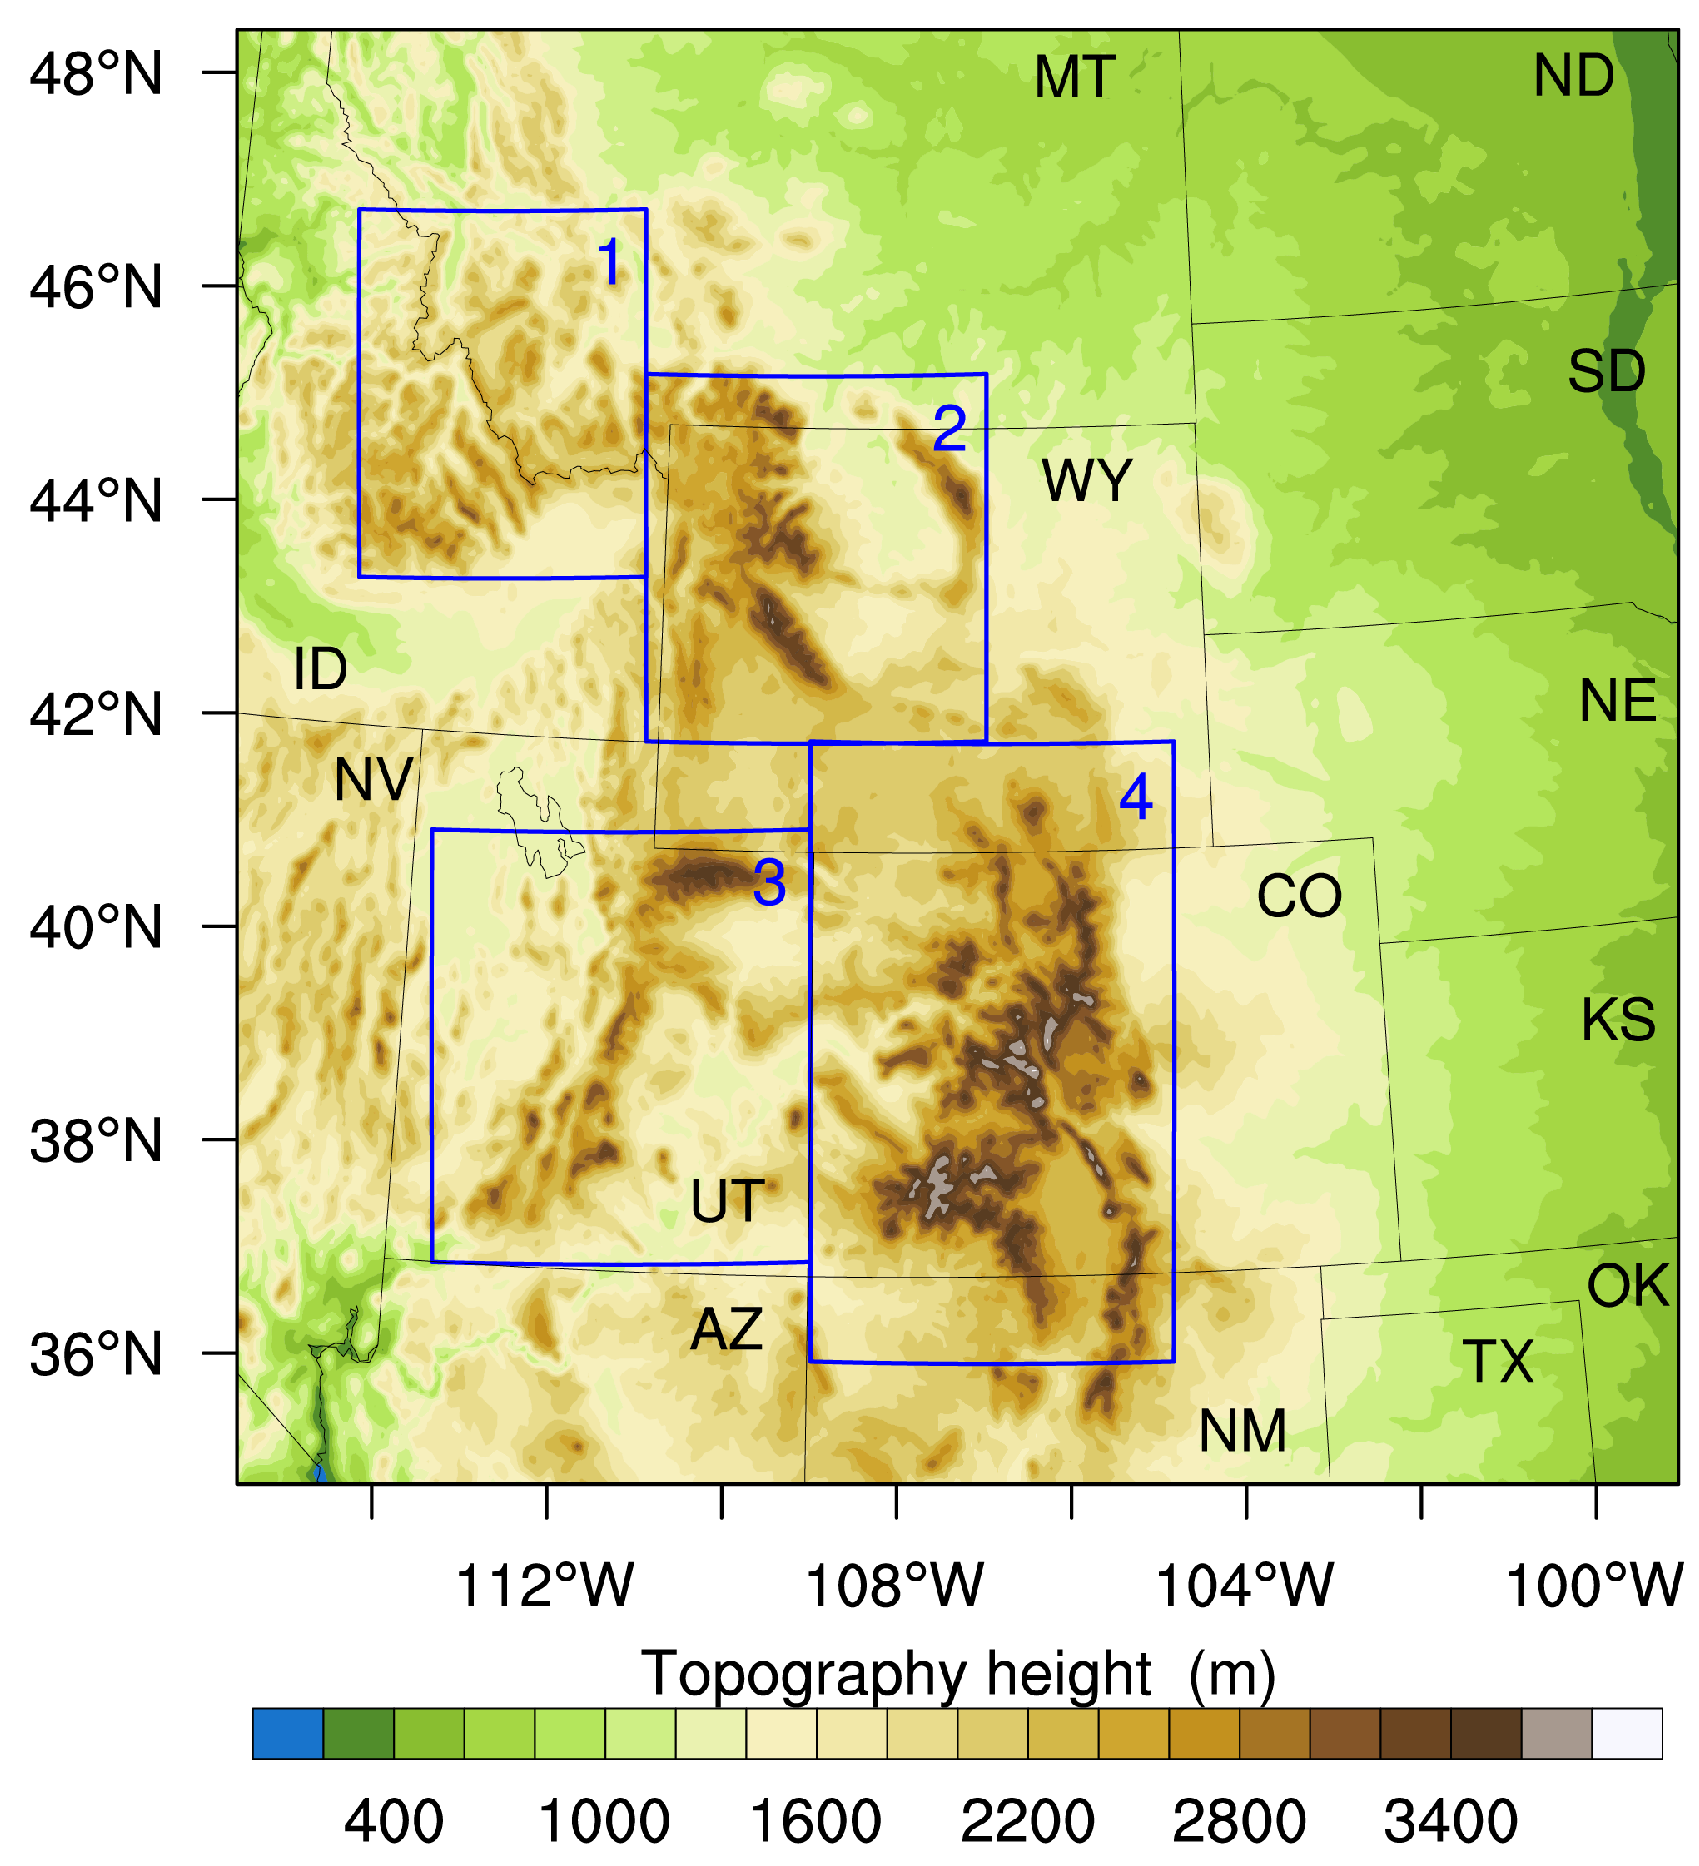
2. Numerical Approach

Two sets of 30-year RCM simulations have been conducted using the Weather Research and Forecasting (WRF) model: a past climate simulation, serving as the control run, and a future climate simulation, which will be compared to the control run to examine the impacts of climate change on precipitation and snowpack. The past and future climate conditions represent the ~1990s and ~2050s, respectively.

2.1. IWUS Historical Climate Simulation

The 30-year IWUS convection-permitting regional climate simulation (1 October 1981–30 September 2011) was introduced in [10] and is briefly summarized here. The WRF model version 3.7.1 [17] was applied to the IWUS domain (Figure 1) without nesting. The computational domain consists of 420 × 410 grid points, with 51 stretched vertical levels extending to 50 hPa. Convection is explicitly represented rather than parameterized, as the simulation uses a 4 km horizontal grid spacing to capture detailed terrain features and allow for convection [18,19,20].
The WRF model physics options are listed in Table 1. It is important to note that the combination of the Thompson cloud scheme and the YSU PBL scheme effectively captures orographic precipitation, the daily minimum and maximum temperatures in the IWUS when applied in 4 km resolution RCMs [10,11,12,18,21]. Initial and lateral boundary conditions were provided every 6 h from the NCEP Climate Forecast System Reanalysis (CFSR [22]).
In [10], the IWUS historical simulation was validated against observational datasets from SNOwpack TELemetry (SNOTEL [29]) point measurements and the Parameter-elevation Regressions on Independent Slopes Model (PRISM, with a 4 km horizontal resolution [30]), focusing on seasonal precipitation, daily precipitation extremes, surface temperature, and snow water equivalent (SWE). The study demonstrated that WRF accurately captured seasonal temperature patterns across the IWUS. Simulated seasonal precipitation showed strong agreement with observations, with spatial correlation coefficients exceeding 0.85 for PRISM across the entire domain and 0.88 for SNOTEL in the mountain ranges. Although simulated peak SWE was underestimated compared to SNOTEL measurements, the spatial pattern of observed SWE was captured by the model reasonably well.

2.2. IWUS Future Climate Simulation

The 30-year future climate simulation for the IWUS, representing ~2050 conditions, uses the same reanalysis data (CFSR), domain (Figure 1), and horizontal grid spacing (4 km) as the historical simulation described in Section 2.1. However, the WRF input files for initial and boundary conditions were continuously perturbed using a pseudo-global warming (PGW) approach. The core concept of the PGW approach is to apply climate change signals derived from global climate models (GCMs) to adjust the driver dataset for RCMs [31]. This method has been widely applied in various studies, including those investigating future changes in orographic precipitation and snowpack in the IWUS [11,12,32] and Western Canada [19], precipitation changes across the contiguous United States [15], and changes in precipitation and surface runoff in the southern United States [13].
As shown in Equation (1), the perturbation for this study was calculated based on the 30-year monthly multi-model ensemble-mean climate signal change, derived from a 50-year period: 1976–2005 for the past climate and 2036–2065 for the future climate, as predicted by phase 5 of the Coupled Model Intercomparison Project (CMIP5 [33]) under the Representative Concentration Pathway (RCP) 8.5 emission scenario [34]. The perturbed physical fields in the PGW approach include surface fields (sea level pressure and soil temperature) and 3D fields (temperature, geopotential, specific humidity, and horizontal wind). As discussed in [11], the PGW technique enables an unbiased assessment of climate change, relative to current low-frequency variability such as El Niño. This approach is grounded in the understanding that changes in intra- to inter-annual atmosphere–ocean teleconnections are not fully understood, and it is therefore more effective to preserve the low-frequency general circulation patterns and the characteristics of storms entering the domain.
WRF i n p u t = CFSR + ( CMIP 5 2036 2065 CMIP 5 1976 2005 )
Given the large range of climate sensitivity and internal variability inherent in individual GCMs, the climate change signal from a single model is not considered representative. Instead, a multi-model ensemble mean climate difference between the past and future decades is used to quantify climate change driven by greenhouse gas forcing in dynamical downscaling. Using a multi-model ensemble approach improves upon the single-model method typically employed in PGW simulations [12]. The selection of 15 GCMs (Table 2) in this study, to develop the climate perturbation signal, follows the approach of [15], who chose models based on their ability to simulate the North American climate during the twentieth century. All of these models have been run for various emission scenarios extending to 2050 and beyond, with the RCP8.5 scenario being chosen here, as it assumes relatively little action to reduce greenhouse gas emissions compared to other RCP scenarios [34]. The RCP8.5 scenario has been extensively utilized in climate change research to model potential future climate conditions under high greenhouse gas emissions [15,19]. The CFSR reanalysis data was perturbed with this climate change signal every 6 h to provide the initial and boundary conditions for the WRF model, enabling the simulation of future climate conditions.
The three most important parameters perturbed using the PGW technique are surface temperature (ST), sea level pressure (SLP), and 2 m relative humidity (RH). Figure 2 shows the mean seasonal difference of these three parameters between past (1976–2005) and future (2036–2065) periods over the study domain from the chosen CMIP5 ensemble members (Table 2). In comparison, SLP is projected to decrease over the IWUS domain for winter (DJF) and spring (MAM), with a mean reduction of 0.48 hPa (Figure 2a,d), whereas it is higher over the domain during summer (JJA), and the domain-average increase is 0.27 hPa (Figure 2g). As for the fall season (SON), the change in SLP is relatively smaller than the other seasons, with a mean reduction of 0.10 hPa (Figure 2j). A warming signal is projected in all seasons with an annual increase of ST 2.8 °C, and summer is projected to have the strongest warming with a domain-average increase of 3.13 °C for ST (Figure 2b,e,h,k). This is consistent with the fact that 2 m RH is predicted to decrease in all seasons, whereas a maximum decrease is found in summer with a spatial average of −0.45% (Figure 2c,f,i,l), since the saturation vapor pressure increases with warming. The impact of climate change on precipitation and snowpack projected by the PGW simulations will be examined in Section 3.

3. Results

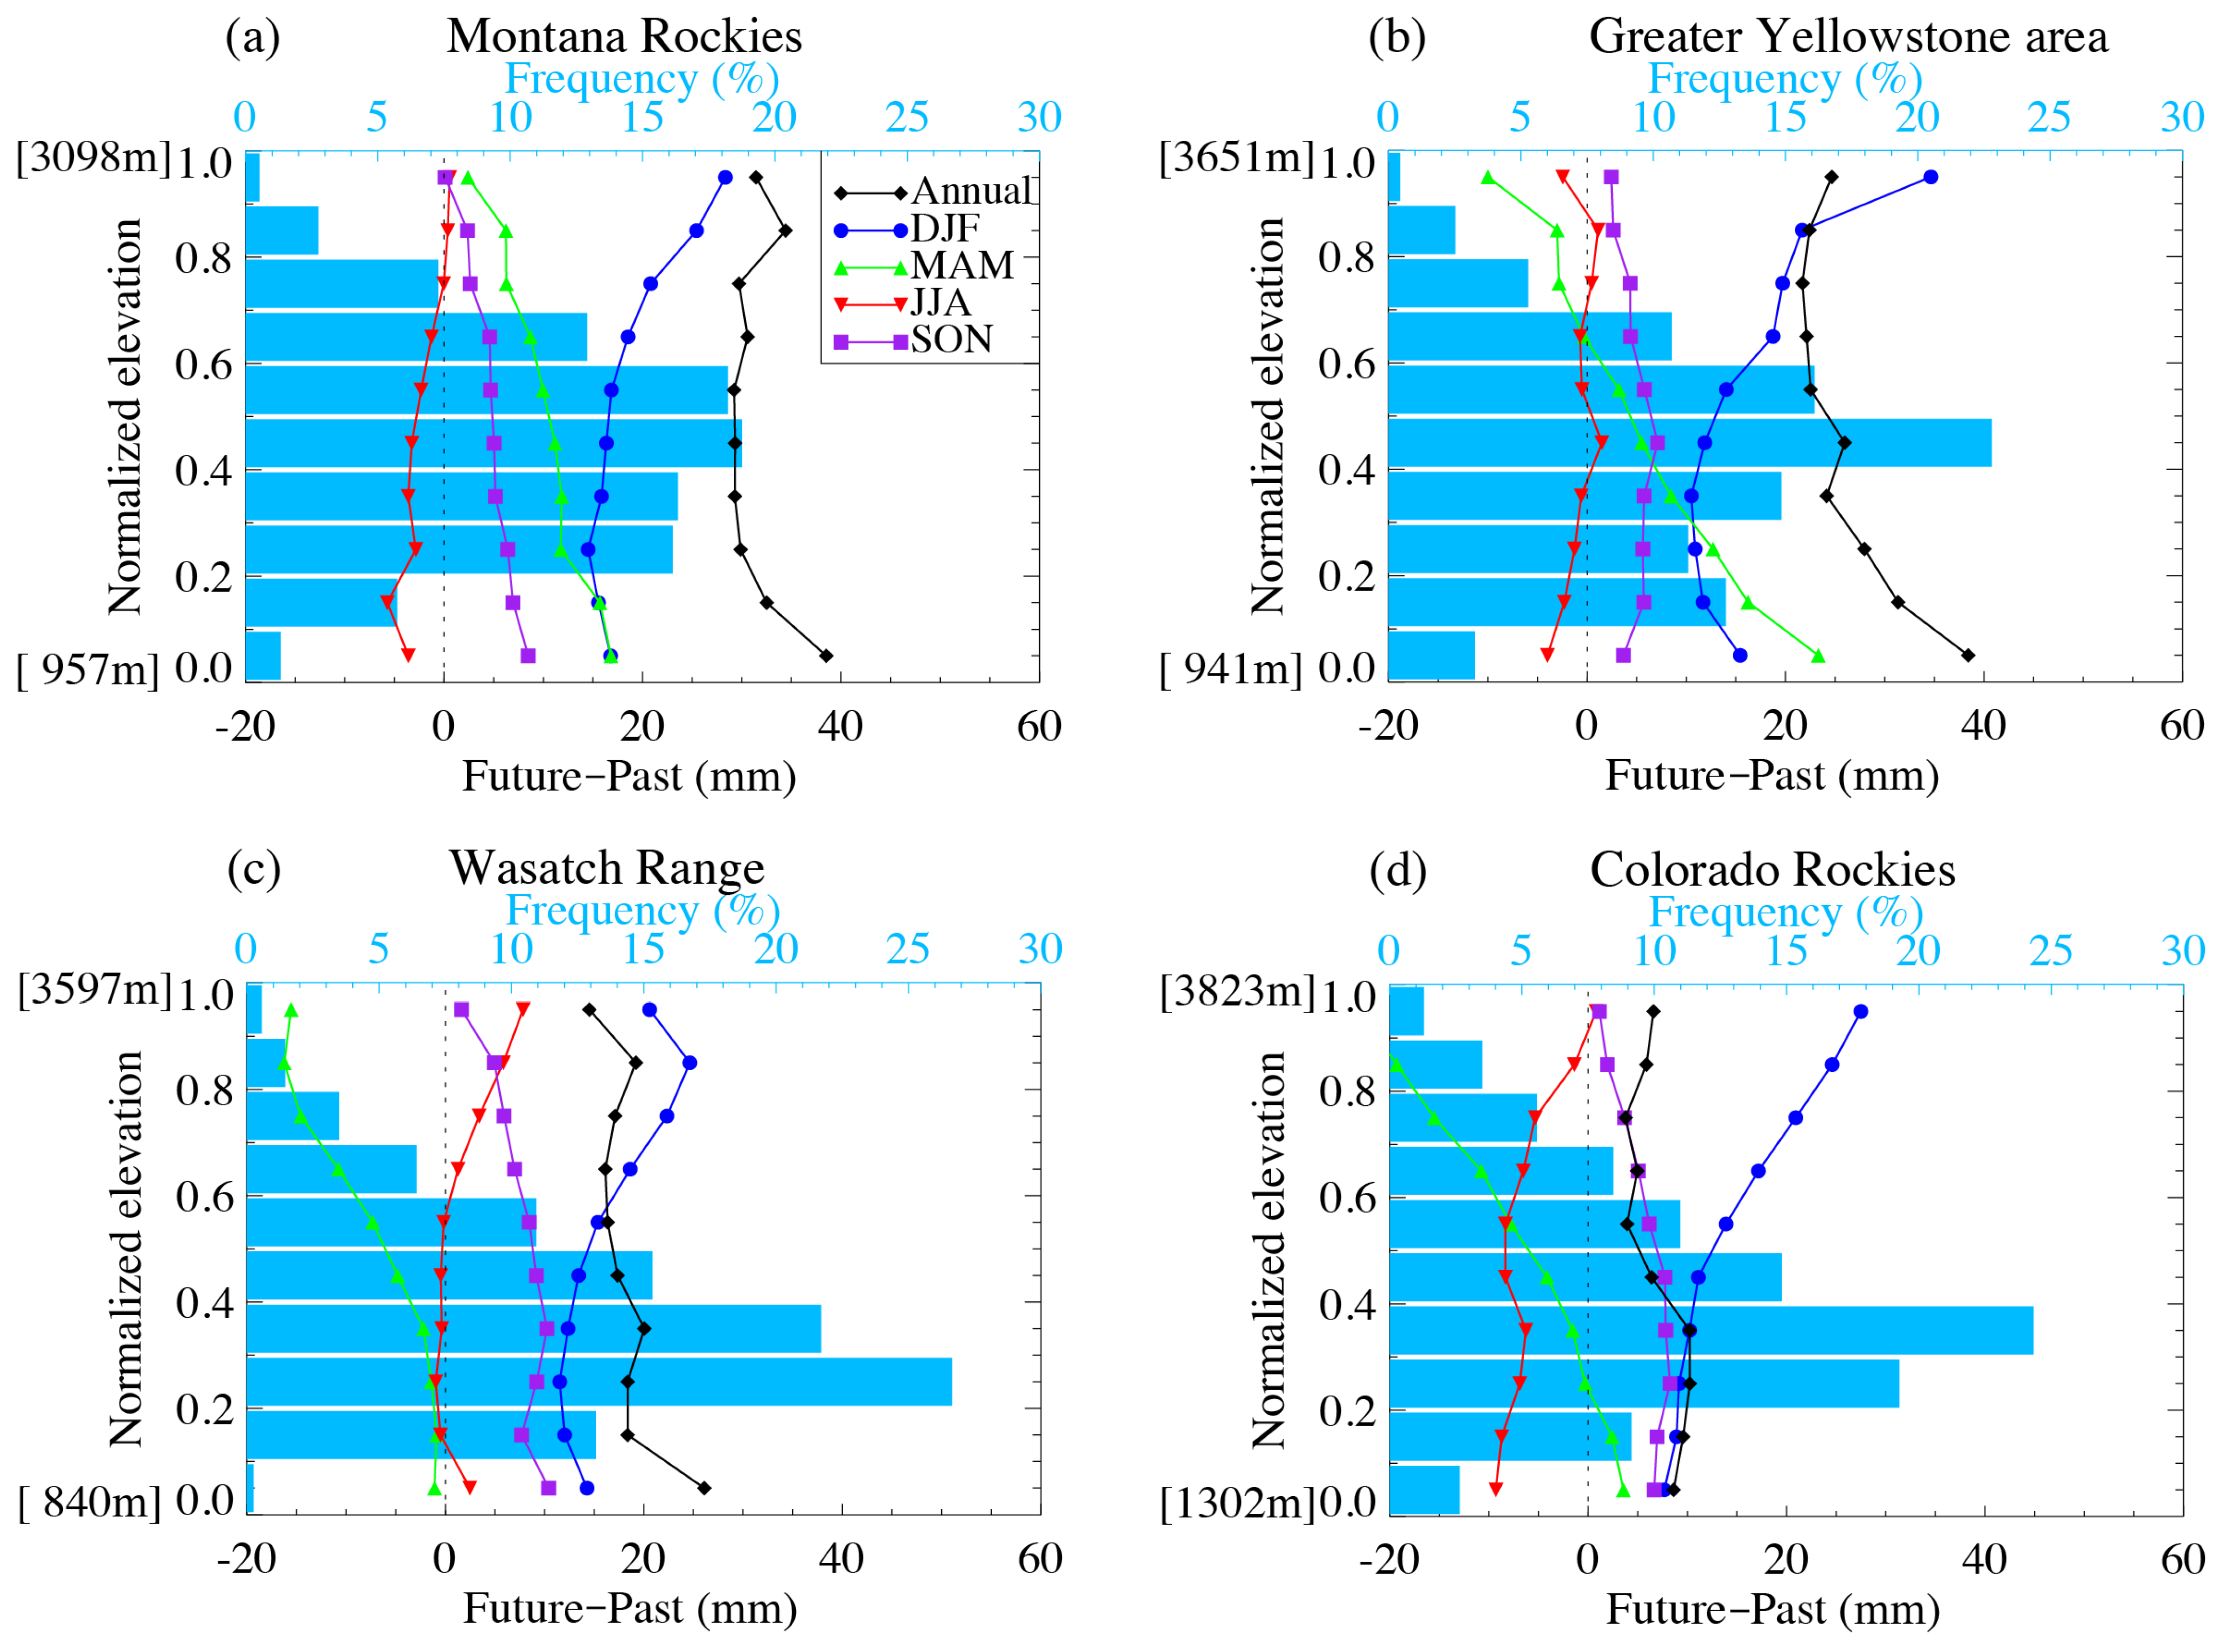
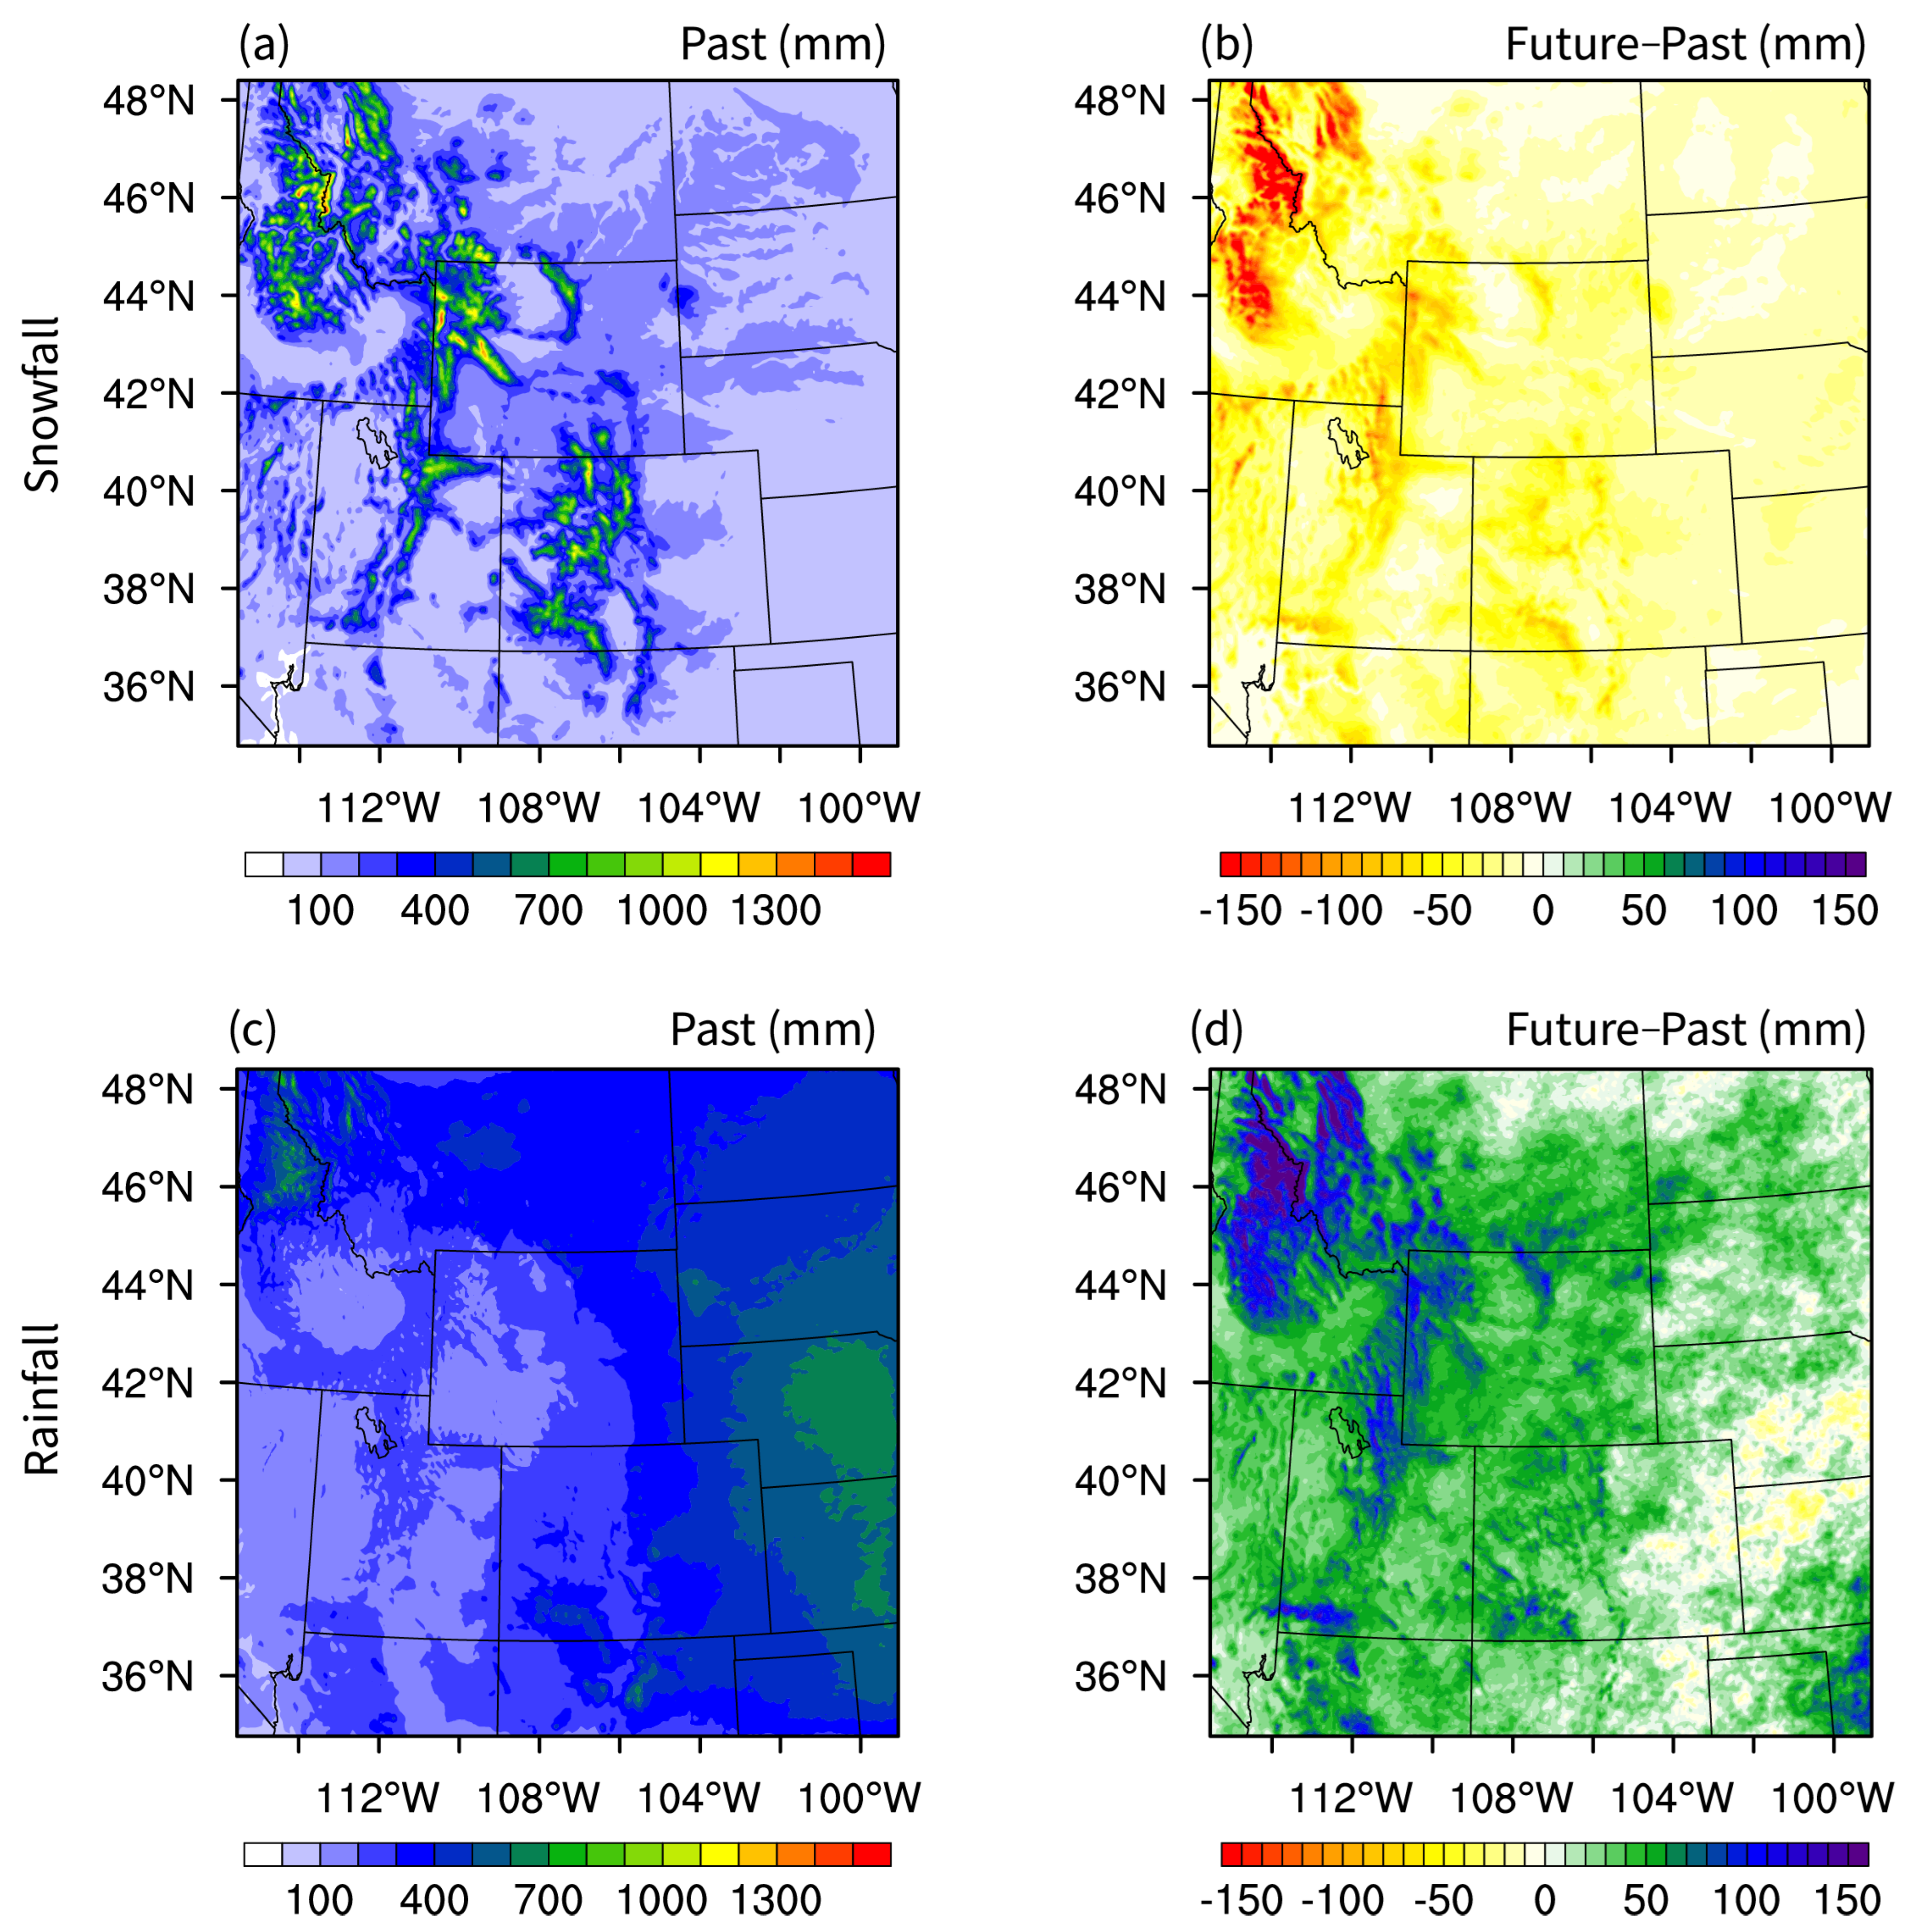
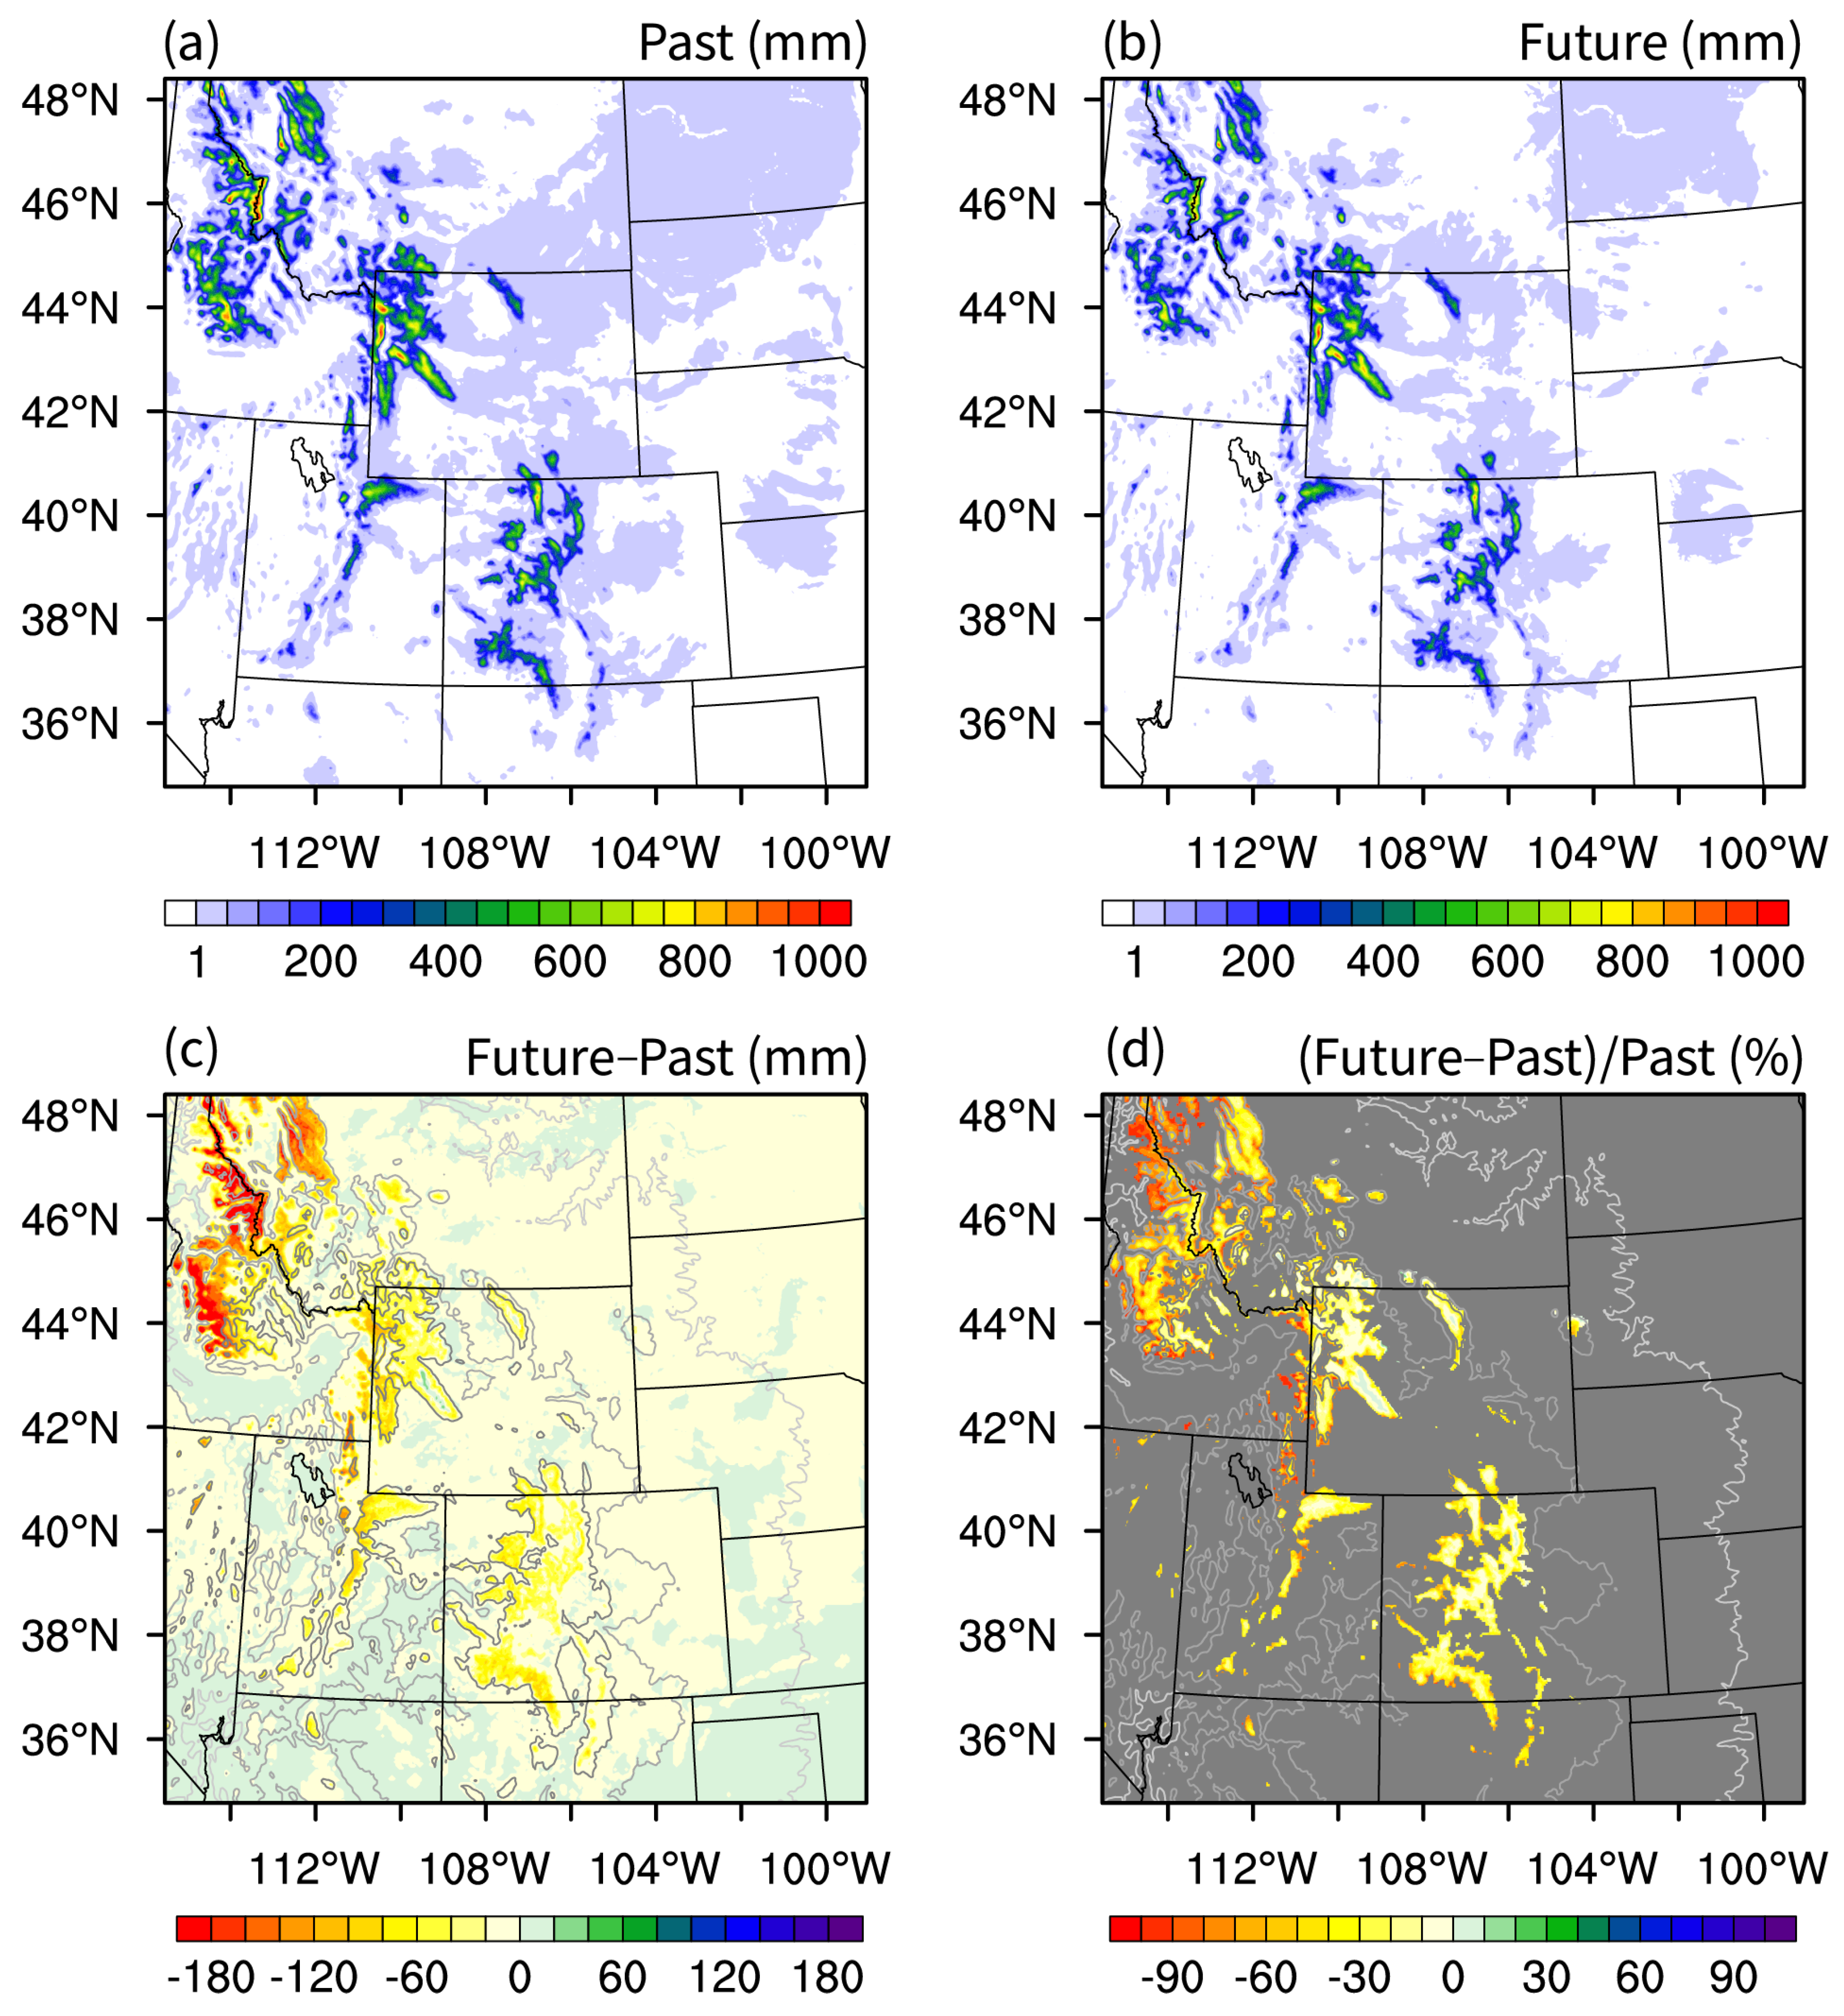
3.1. Projected Change in Precipitation

The simulated 30-year annual mean precipitation is compared between past and future climates in Figure 3. The past simulation indicates that higher precipitation is associated with higher mountain elevations, while lower precipitation occurs in the intermountain basins (Figure 3a), which replicates the observed spatial patterns of precipitation very well [10]. The magnitude and spatial pattern of annual mean precipitation for the future climate are comparable to that for the past climate (Figure 3a,b). For the most part, the projected precipitation changes are small compared with the annual magnitude (Figure 3c). Precipitation increase dominates the study domain, except in these states in the High Plains: Colorado, New Mexico, Nebraska, and Kansas (Figure 3c). The annual increase can reach up to 90 mm (Figure 3c), with the percentage increase going as high as 18% (Figure 3d). Note that, in the IWUS domain, most of the precipitation falls in the cold season, and mostly over the mountain ranges, while the surrounding high plains and basins are relatively dry [10,21].
The 30-year climatology of the seasonal precipitation change varies seasonally and geographically (Figure 4). Precipitation of winter season (DJF) is projected to increase over the whole domain (Figure 4a,b). The maximum increase in winter precipitation is approximately 40 mm, typically observed over high-elevation mountain peaks (Figure 4a). The percentage increase is more pronounced over the High Plains (Figure 4b), primarily due to the relatively low precipitation in the region (Figure 4a). During the spring season (MAM), a geospatial division distinguishes areas with differing precipitation changes: simulated precipitation is expected to decrease in the southwest of the domain, while it is projected to increase in the northeast (Figure 4c,d). The projected precipitation change for fall (SON) mirrors that of winter, with an overall increase across the study domain; however, the magnitude of the change is generally smaller than in winter (Figure 4a,g). The spatial pattern of summer (JJA) precipitation change differs from that of the other seasons, with a predominant decrease in precipitation across the IWUS domain, particularly over the High Plains (Figure 4e). The largest decrease in summer precipitation occurs over the states of Nebraska, Kansas, and eastern Colorado.
Table 3 provides the spatially averaged precipitation change for four mountainous subregions: the Montana Rockies, the Greater Yellowstone area, the Wasatch Range, and the Colorado Rockies (boundaries of subregions defined in Figure 1). In all four subregions, the spatially averaged orographic precipitation is projected to increase in DJF and decrease in JJA. In DJF, the largest absolute change of 17.0 mm occurs in the Montana Rockies, while the changes in the Greater Yellowstone area (13.5 mm), the Wasatch Range (13.6 mm), and the Colorado Rockies (12.3 mm) are relatively similar. The spatially average percentage increase in winter precipitation ranges from 13.4% in the Colorado Rockies to 17.9% in the Wasatch Range. In JJA, both the absolute and percentage decreases are smaller than the increases observed in DJF for all subregions. Summer precipitation is projected to decrease by 6.9 mm in the Colorado Rockies, while the change is negligible in the Wasatch Range at 0.1 mm. The change for SON is similar to that for DJF, with projected increases across all subregions; however, both the absolute and percentage changes are smaller than those in DJF. In MAM, spatially averaged precipitation is projected to increase in the Montana Rockies and the Greater Yellowstone area, but decrease in the Wasatch Range and the Colorado Rockies.
To further explore the impact of elevation on changes in orographic precipitation, annual and seasonal precipitation changes are plotted against normalized elevation for the four subregions (Figure 5). The normalized elevation ( Z n ) is defined as a function of elevation (Z) below:
Z n = Z Z m i n Z m a x Z m i n
where  Z m i n  and  Z m a x  are elevations of the lowest and highest grid within each subregion, respectively. Normalizing elevation for the mountainous subregions helps clarify how elevation affects the projected changes of precipitation and snow ratio (Section 3.2) without the interference of elevation differences across different subregions. It is important to note that the height of the crest above the upstream valley or plain is approximately the same for all four subregions.
The first notable thing is that annual precipitation is projected to increase at all elevations, but the magnitude of the change decreases with height, with smaller increases simulated over the higher mountain peaks (Figure 5a–d). Mean seasonal precipitation is projected to increase at all elevations for the two colder seasons, DJF and SON, but with different elevation-dependent patterns: a greater increase at higher elevations for DJF, while the opposite occurs for SON. Precipitation change for JJA is similar across the subregions of the Montana Rockies (Figure 5a), the Greater Yellowstone area (Figure 5b), and the Colorado Rockies (Figure 5d): precipitation decreases more at lower elevations, such as valley regions, while changes at higher elevations are minimal. In the Wasatch Range, the change in JJA precipitation is nearly zero at lower elevations, while it tends to increase at higher elevations, with a mean increase of 6 mm at the mountain tops (Figure 5c). The precipitation change in MAM is similar for the Wasatch Range and Colorado Rockies: there is a slight change at lower elevations, while precipitation decreases with elevation, reaching a nearly 20 mm reduction at the mountain tops (Figure 5c,d). Mean MAM precipitation is projected to increase at all elevations in the Montana Rockies, with a more significant increase at lower elevations (Figure 5a). In contrast, for the Greater Yellowstone area, MAM precipitation is projected to increase at lower elevations but decrease at higher elevations (Figure 5b).

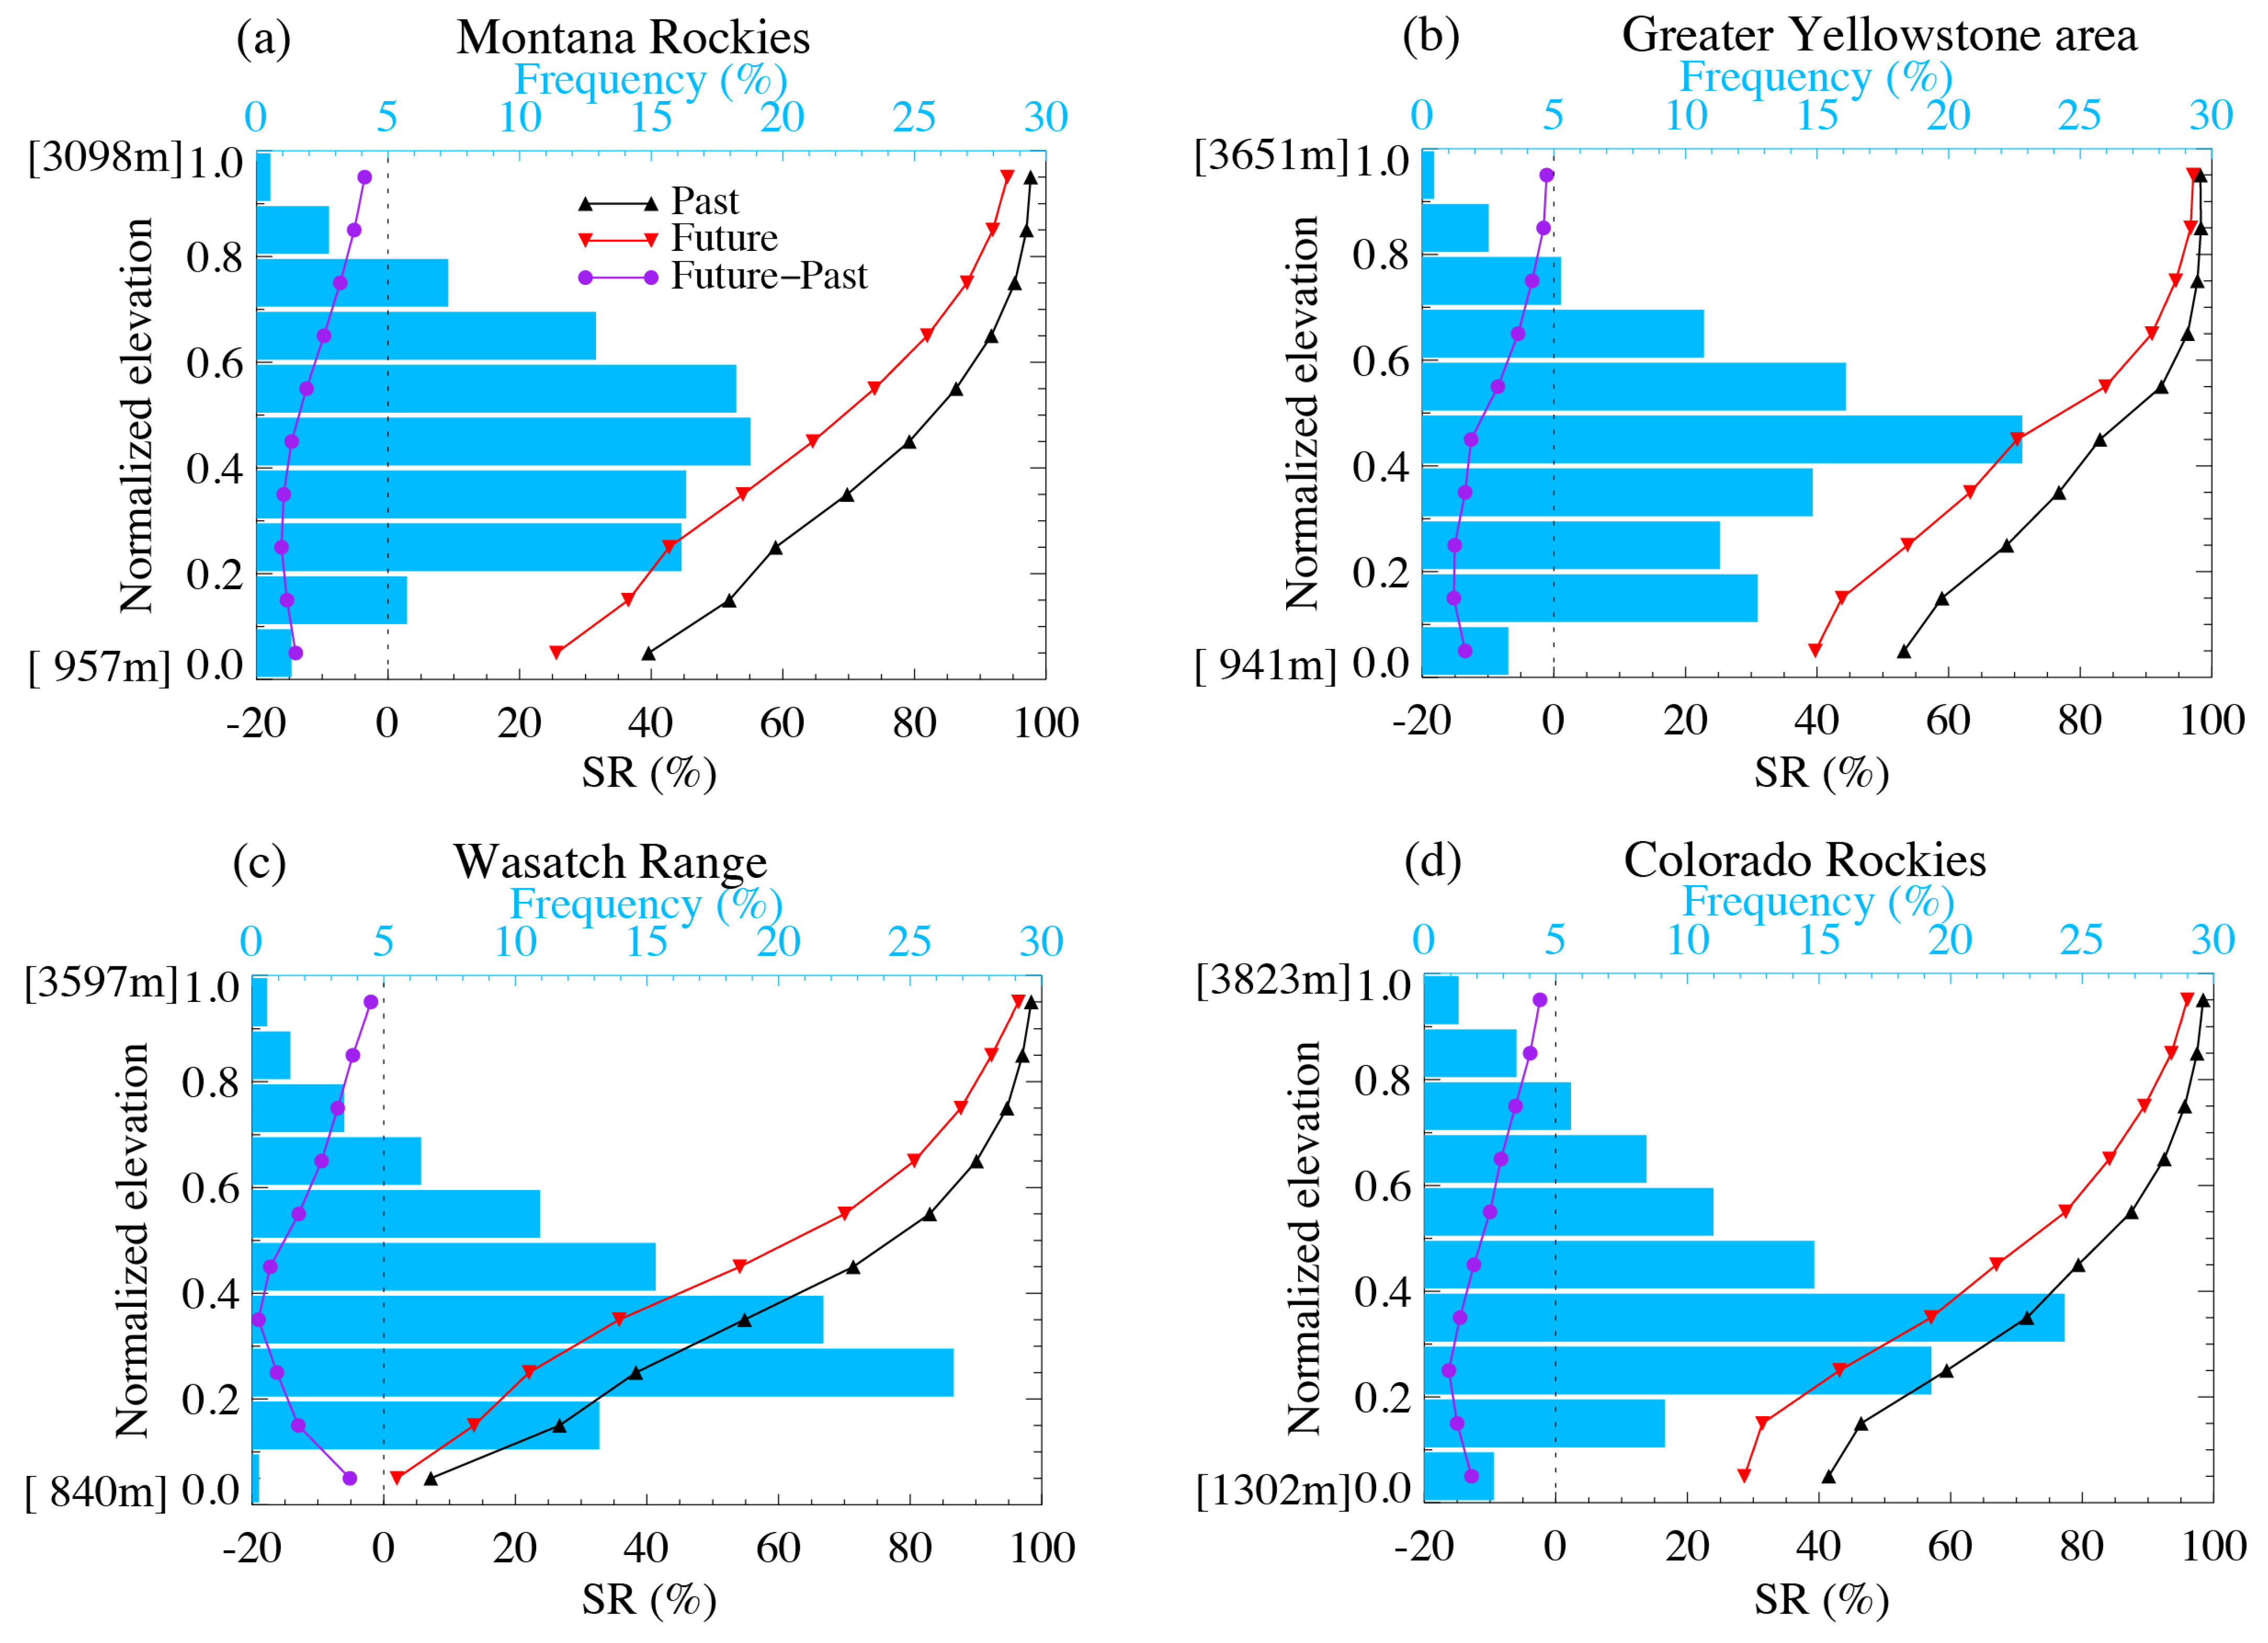
3.2. Projected Change in Cold-Season Snow Ratio

The climatology and projected changes in different phases of precipitation are critically important, as they can have varying impacts on Earth’s surface water and energy fluxes [35]. The spatial patterns of 30-year mean annual snowfall and rainfall for the current climate are presented in Figure 6a,c. Snowfall is concentrated in high-elevation mountains, reaching a maximum of around 1300 mm annually (Figure 6a). Meanwhile, high rainfall values, up to 700 mm annually, are observed in the High Plains (Figure 6c). Snowfall is projected to decrease across the entire domain (Figure 6b), while rainfall is expected to increase, with the exception of a small area in the High Plains (Figure 6d). Notably, the maximum increase in rainfall (and decrease in snowfall) occurs in the northwest corner of the domain, with changes as large as 150 mm annually.
To examine the change in snowfall more closely during the cold seasons, snow-to-precipitation ratio ( S R ), the proportion of precipitation that falls as snow rather than rain, is defined as below:
S R = snow accumulation precipitation accumulation · 100 %
Figure 7a,b show the spatial patterns of SR averaged over the cold season (October to April) for the past and future climates, respectively. Higher SR values are found in mountainous areas, while lower values are observed in valleys and the High Plains, in both the current and future climates. The map of the absolute difference between the past and future climates shows a projected decrease in SR across the entire domain (Figure 7c). The projected percentage decrease is generally within 30%, with smaller changes at higher elevations (Figure 7d). It is worth noting that the percentage decrease can reach as high as 90% in the southwest corner of the study domain (Figure 7d), though this is largely due to the small absolute SR in that area (Figure 7a).
Similar to the approach used in Section 3.1 to analyze the impact of elevation on precipitation, we investigate the effect of elevation on the change in SR across four mountainous subregions. The results indicate that, for all four subregions, SR increases with elevation in both the past and future climates. However, the projected future SR is lower than that of the past climate at all elevations (Figure 8a–d). The change in SR with elevation follows a similar pattern for the Montana Rockies (Figure 8a), the Greater Yellowstone area (Figure 8b), and the Colorado Rockies (Figure 8d): it decreases most significantly at lower elevations, with a change of around −15%, while the decrease is smaller at higher elevations, nearing zero percent in the highest elevation bins. For the Wasatch Range, SR is projected to decrease by 5% at the lowest elevation bins. The decrease reaches a maximum of −20% at a Zn near 0.3, after which the SR change diminishes toward higher elevations, approaching zero percent at the mountain tops (Figure 8c). These shifts of elevation gradients in SR can have significant implications for hydrological cycles, as snowmelt at higher elevations contributes to runoff in the spring and early summer, a key source of water for downstream regions [36].

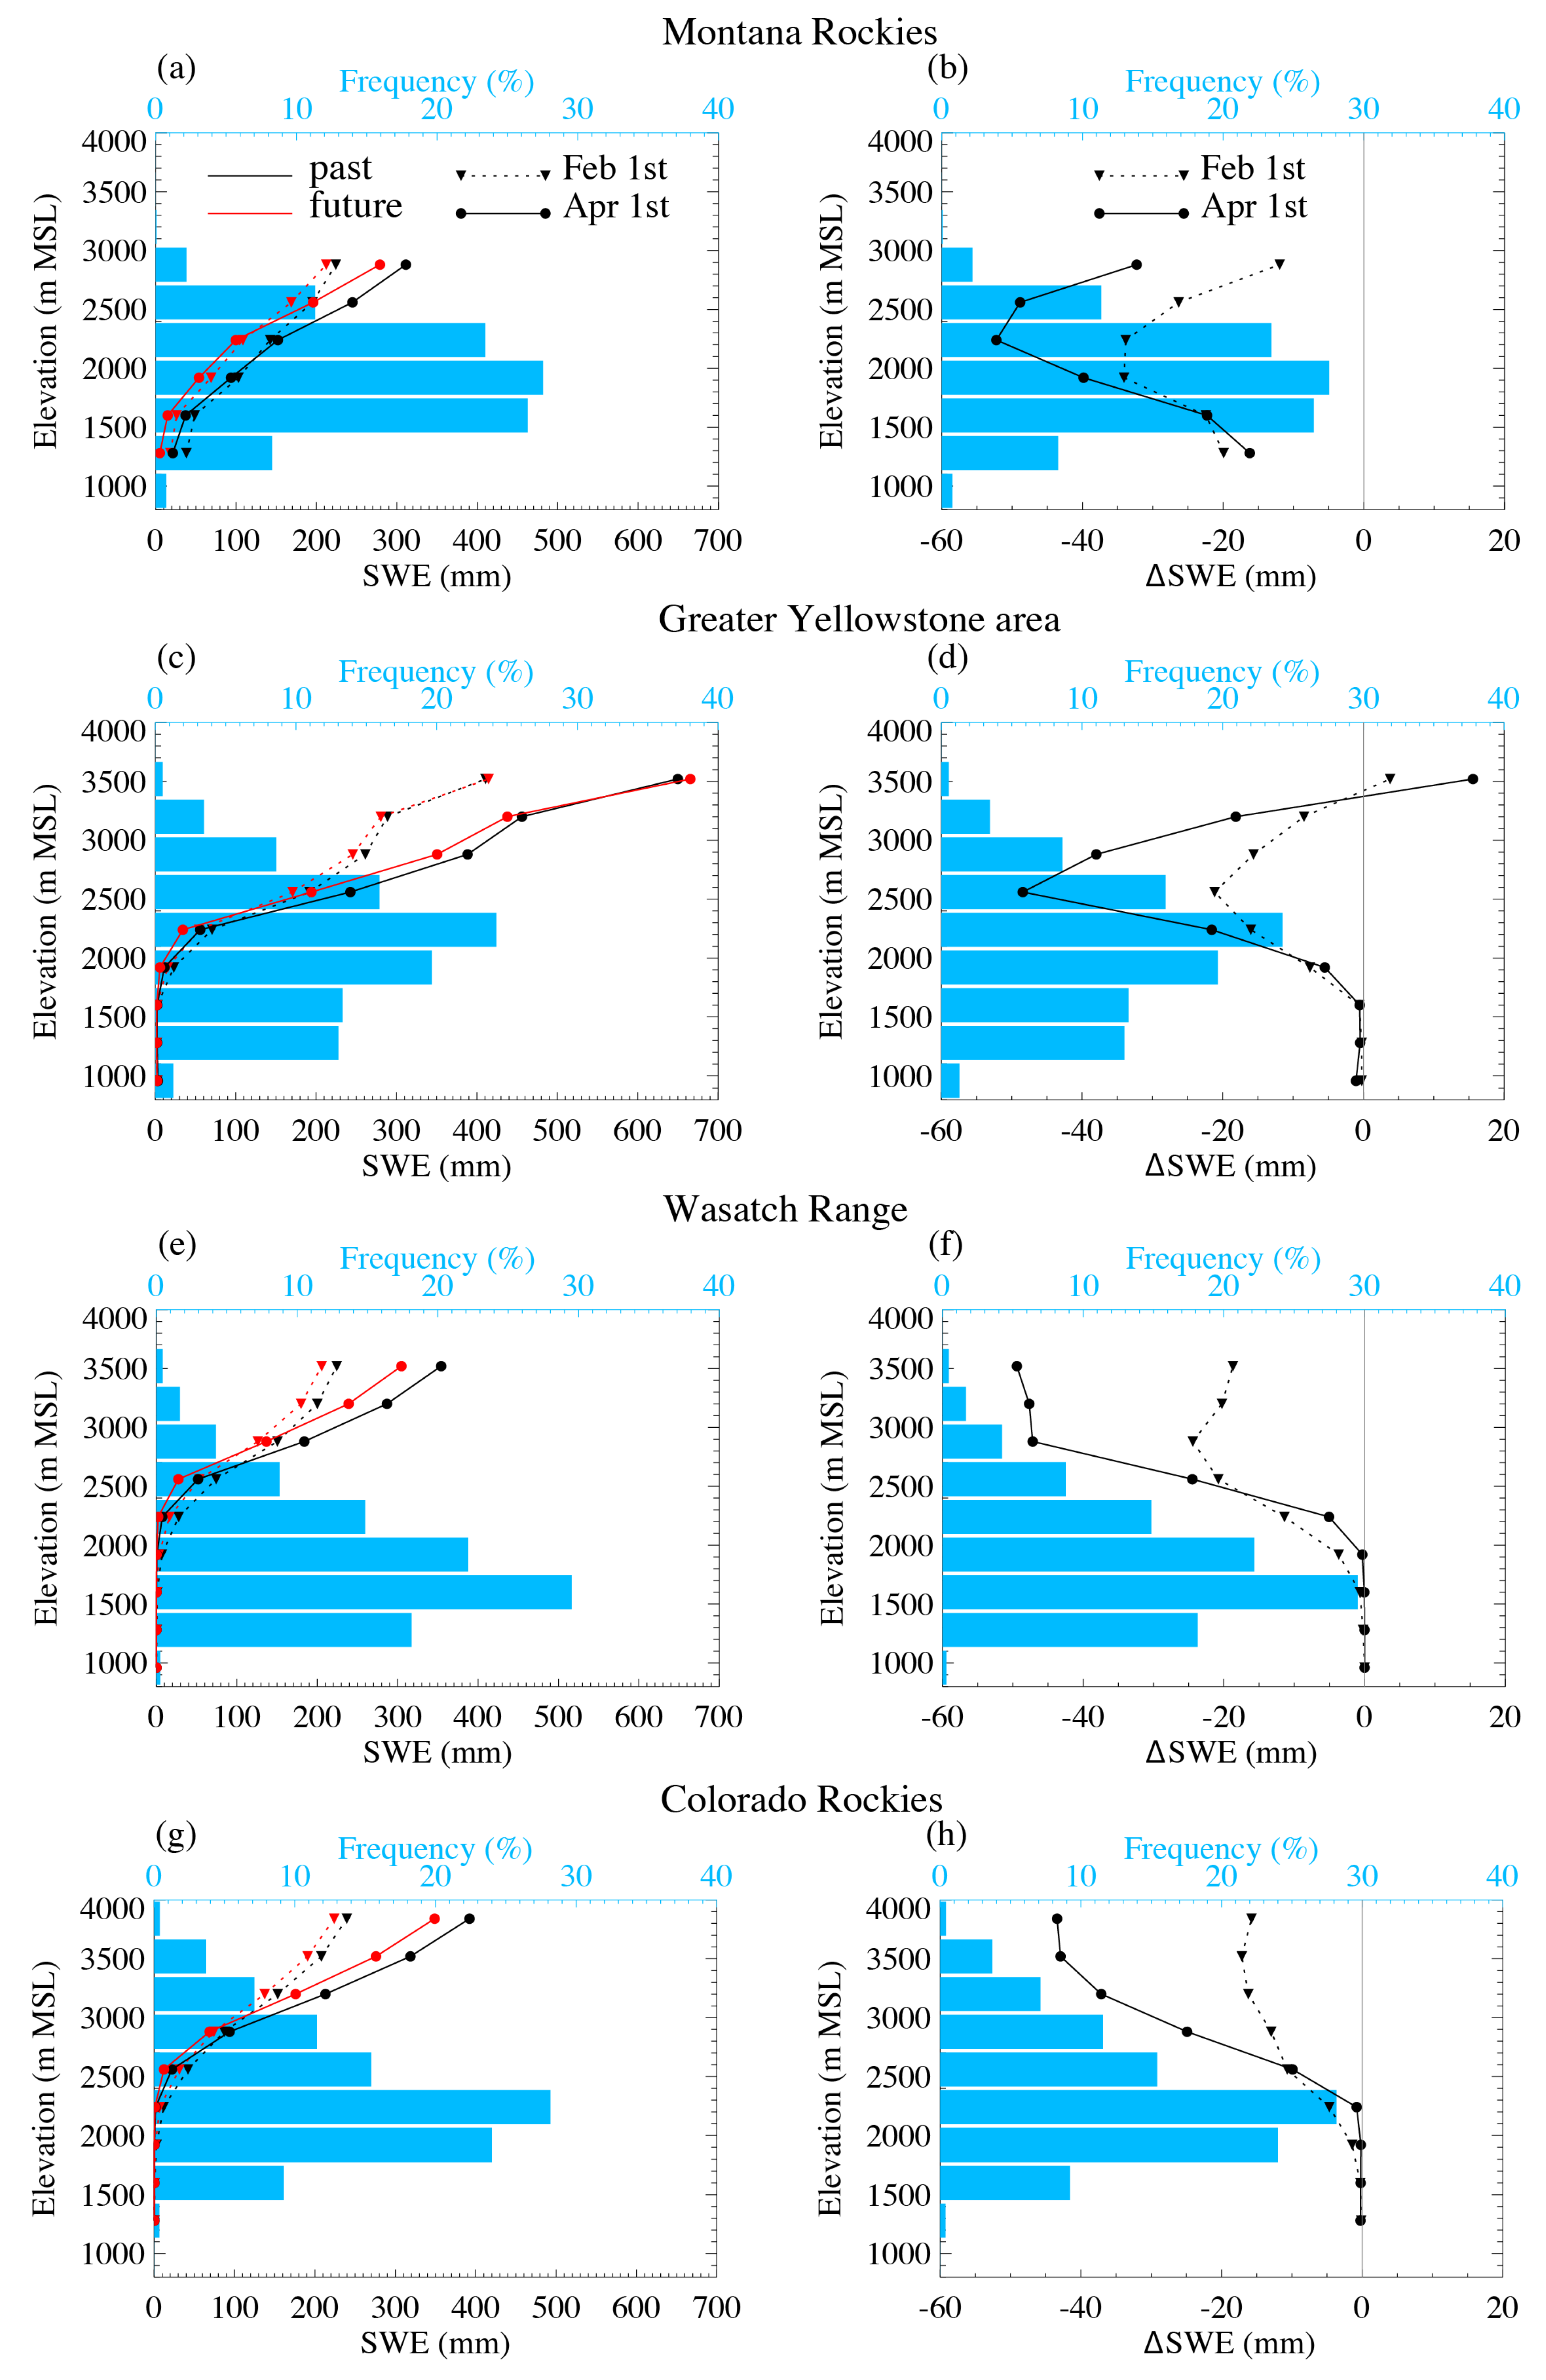
3.3. Projected Change in Snowpack

The snowpack on April 1st is commonly analyzed because it typically represents the peak of the annual snowpack, which is crucial for hydrological applications [37]. Therefore, we first compare the climatological average SWE on April 1st between the past and future climates (Figure 9). In general, the spatial pattern for the future climate closely mirrors that of the past climate, with a maximum SWE reaching up to 900 mm across the study domain (Figure 9a,b). This indicates that the projected change in snowpack is relatively small in comparison to the absolute values. The difference maps provide more detailed insights. The map of absolute differences shows that SWE is projected to decrease across most of the study domain, with the most pronounced reductions occurring in mountainous areas. The decrease can be as significant as −180 mm in the Montana Rockies (Figure 9c). The percentage decrease in SWE generally falls within the range of 30%, with larger changes observed in the Montana Rockies and the Greater Yellowstone area (Figure 9d).
To better examine how the projected snowpack changes with elevation, two key dates, 1 April and 1 February, are selected, given their significance for hydrological applications [5,37,38]. In general, for both dates and both climates, SWE increases with elevation, and it is projected to decrease at nearly every elevation bin across the four subregions (Figure 10a,c,e,g). The highest SWE values are associated with the Greater Yellowstone area (Figure 10c). Note that the absolute value of elevation is used here. The SWE change plots show similar patterns for both dates within the same subregion. For the Montana Rockies (Figure 10b) and the Greater Yellowstone area (Figure 10d), the change is smallest at lower elevations, reaching a maximum reduction of 50 mm around 2250 m MSL. This decrease then tapers off at higher elevations or even reverses, showing an increase at the highest elevations in the Greater Yellowstone area (Figure 10d). In the Wasatch Range and Colorado Rockies, the change in snowpack is minimal at lower elevations, with the decrease becoming more pronounced at higher elevations (Figure 10f,h).
For each of the four subregions, the grid boxes are categorized into three groups based on their elevations: low, medium, and high. This categorization is necessary from a statistical perspective to ensure that the analysis captures elevation-dependent variations in snowpack changes, allowing for more accurate comparisons across different elevation ranges within each subregion. Figure 11 illustrates the seasonal cycles of snowpack for the three elevation groups. The projected change in the peak SWE values for future climates is calculated as an index of magnitude change. The first notable thing is that the highest elevation subgroup is associated with the largest SWE, while the lowest elevation subgroup has the smallest SWE. Additionally, the SWE curve for the future climate lies below that of the current climate, indicating a projected decrease in peak SWE for all subgroups. The magnitude of SWE reduction in the future climate is similar across the three subgroups for the Montana Rockies (Figure 11a). However, for the Greater Yellowstone area (Figure 11b), the Wasatch Range (Figure 11c), and the Colorado Rockies (Figure 11d), the maximum SWE reduction occurs at the highest elevations, while the smallest reduction is seen at the lowest elevations.
Identifying a timing index that accurately measures how the timing of snowpack melt shifts under future climate projections is crucial, as it has significant implications for water availability, streamflow patterns, and effective hydrological management during the spring melt season. In this study, an index of timing is defined as the difference in days when 10% of the maximum SWE during the melting season (spring) occurs in the current climate. The timing index indicates that snowpack melting is projected to occur earlier for all subgroups. Specifically, the change ranges from 17 to 20 days for the Montana Rockies (Figure 11a), approximately 15 days for the Greater Yellowstone area (Figure 11b), 16 to 26 days for the Wasatch Range (Figure 11c), and 15 to 20 days for the Colorado Rockies (Figure 11d). The projected change in the timing index offers a clear indication of how the timing of snowpack melt is shifting under future climate scenarios.

4. Discussion

Over the IWUS domain, snowfall predominates in the mountainous regions, while rainfall is more prevalent over the plains (Figure 6). Projected changes in annual precipitation indicate an overall increase across the four subregions in a warming climate (Figure 5). For the winter season, although the absolute increase in precipitation is more pronounced in mountainous areas than on the plains, the percentage change is higher in the plains (Figure 4a,b). The areal mean precipitation is projected to rise in all mountainous subregions, but with varying magnitudes: a 30.0 mm (6.3%) increase over the Montana Rockies, 25.7 mm (5.7%) over the Greater Yellowstone area, 18.2 mm (6.6%) over the Wasatch Range, and 7.9 mm (2.0%) over the Colorado Rockies. In this section, we delve deeper into the projected changes in orographic precipitation, focusing on events with different precipitation intensities in the mountainous areas of the IWUS domain.
The histograms of daily precipitation over 30 years for both current and future climates are presented in Figure 12. In all subregions, precipitation is projected to increase at the higher end of the distribution, particularly when daily rainfall exceeds 20 mm (Figure 12a,c,e,g). This indicates that heavy and extreme precipitation events are expected to become more frequent in the future climate. In other words, the projected increase in precipitation over the mountain ranges is largely driven by the heightened frequency of moderate to heavy precipitation events in a warmer climate.
Classifying precipitation events by daily amounts offers a clearer understanding of how different levels of precipitation may change under future climate scenarios. Table 4 summarizes the comparison of daily precipitation between past and future climates across the four subregions. Precipitation events are grouped into three categories based on daily amounts: light precipitation (0.1–4 mm/day), medium precipitation (4–14 mm/day), and heavy precipitation (>14 mm/day). Most precipitation events fall into the light precipitation category, with approximately 70% of events across all subregions. The percentage change between the current and future climates is also calculated. The percentage of light precipitation events is projected to decrease in the future, and medium precipitation events are expected to decrease as well, with the exception of the Montana Rockies. Conversely, the frequency of heavy precipitation events is projected to increase in all subregions. The increase in heavy events ranges from 0.64% in the Colorado Rockies to 0.89% in the Wasatch Range. Additionally, the comparison of daily precipitation percentiles across 16 levels reveals that heavy to extreme precipitation events are expected to intensify in the future climate, as shown in the percentile–percentile plots of daily precipitation (Figure 12b,d,f,h).
The projected increase in precipitation over mountain ranges, driven by the increased frequency of heavy to extreme precipitation events under warmer climate conditions, holds significant implications for hydrological cycles and water resources. The changes of heavy to extreme precipitation events will result in higher runoff and changes to snowmelt timing [39,40]. This shift is particularly critical in mountainous regions, where snowpack accumulation and melt have traditionally been vital sources of freshwater during the spring and summer months [5]. Further, the shift in snowmelt timing could disrupt existing water management systems that rely on the seasonal nature of runoff from snowmelt [41]. Understanding these changes is essential for managing water resources, anticipating flood risks, and preparing for the impacts of a changing climate on both natural ecosystems and human infrastructure.
It is important to note that this study examines only one RCP (RCP8.5), which represents conditions in the mid-twenty-first century or later (if greenhouse gas emissions are cut more drastically). This scenario may overestimate the rate of global warming [42], meaning the “future” climate conditions presented here could occur several decades later than around 2050.

5. Conclusions

This study utilizes a pair of convection-permitting RCM simulations, the ~1990 climate and the ~2050 climate, to investigate the impacts of climate change on precipitation and snowpack in the IWUS. Climate perturbations for the future climate are derived from the CMIP5 GCM ensemble-mean under the high-end emission scenario via the PGW approach. Under this scenario, the IWUS experiences a surface temperature increase of approximately 2.8 °C. The study examines the changes in spatial patterns of seasonal precipitation and snowpack across the IWUS, with particular emphasis on the influence of elevation on projected shifts in orographic precipitation and snowpack. Four mountain ranges are specifically analyzed: the Montana Rockies, Greater Yellowstone area, Wasatch Range, and Colorado Rockies. The main findings are as follows:
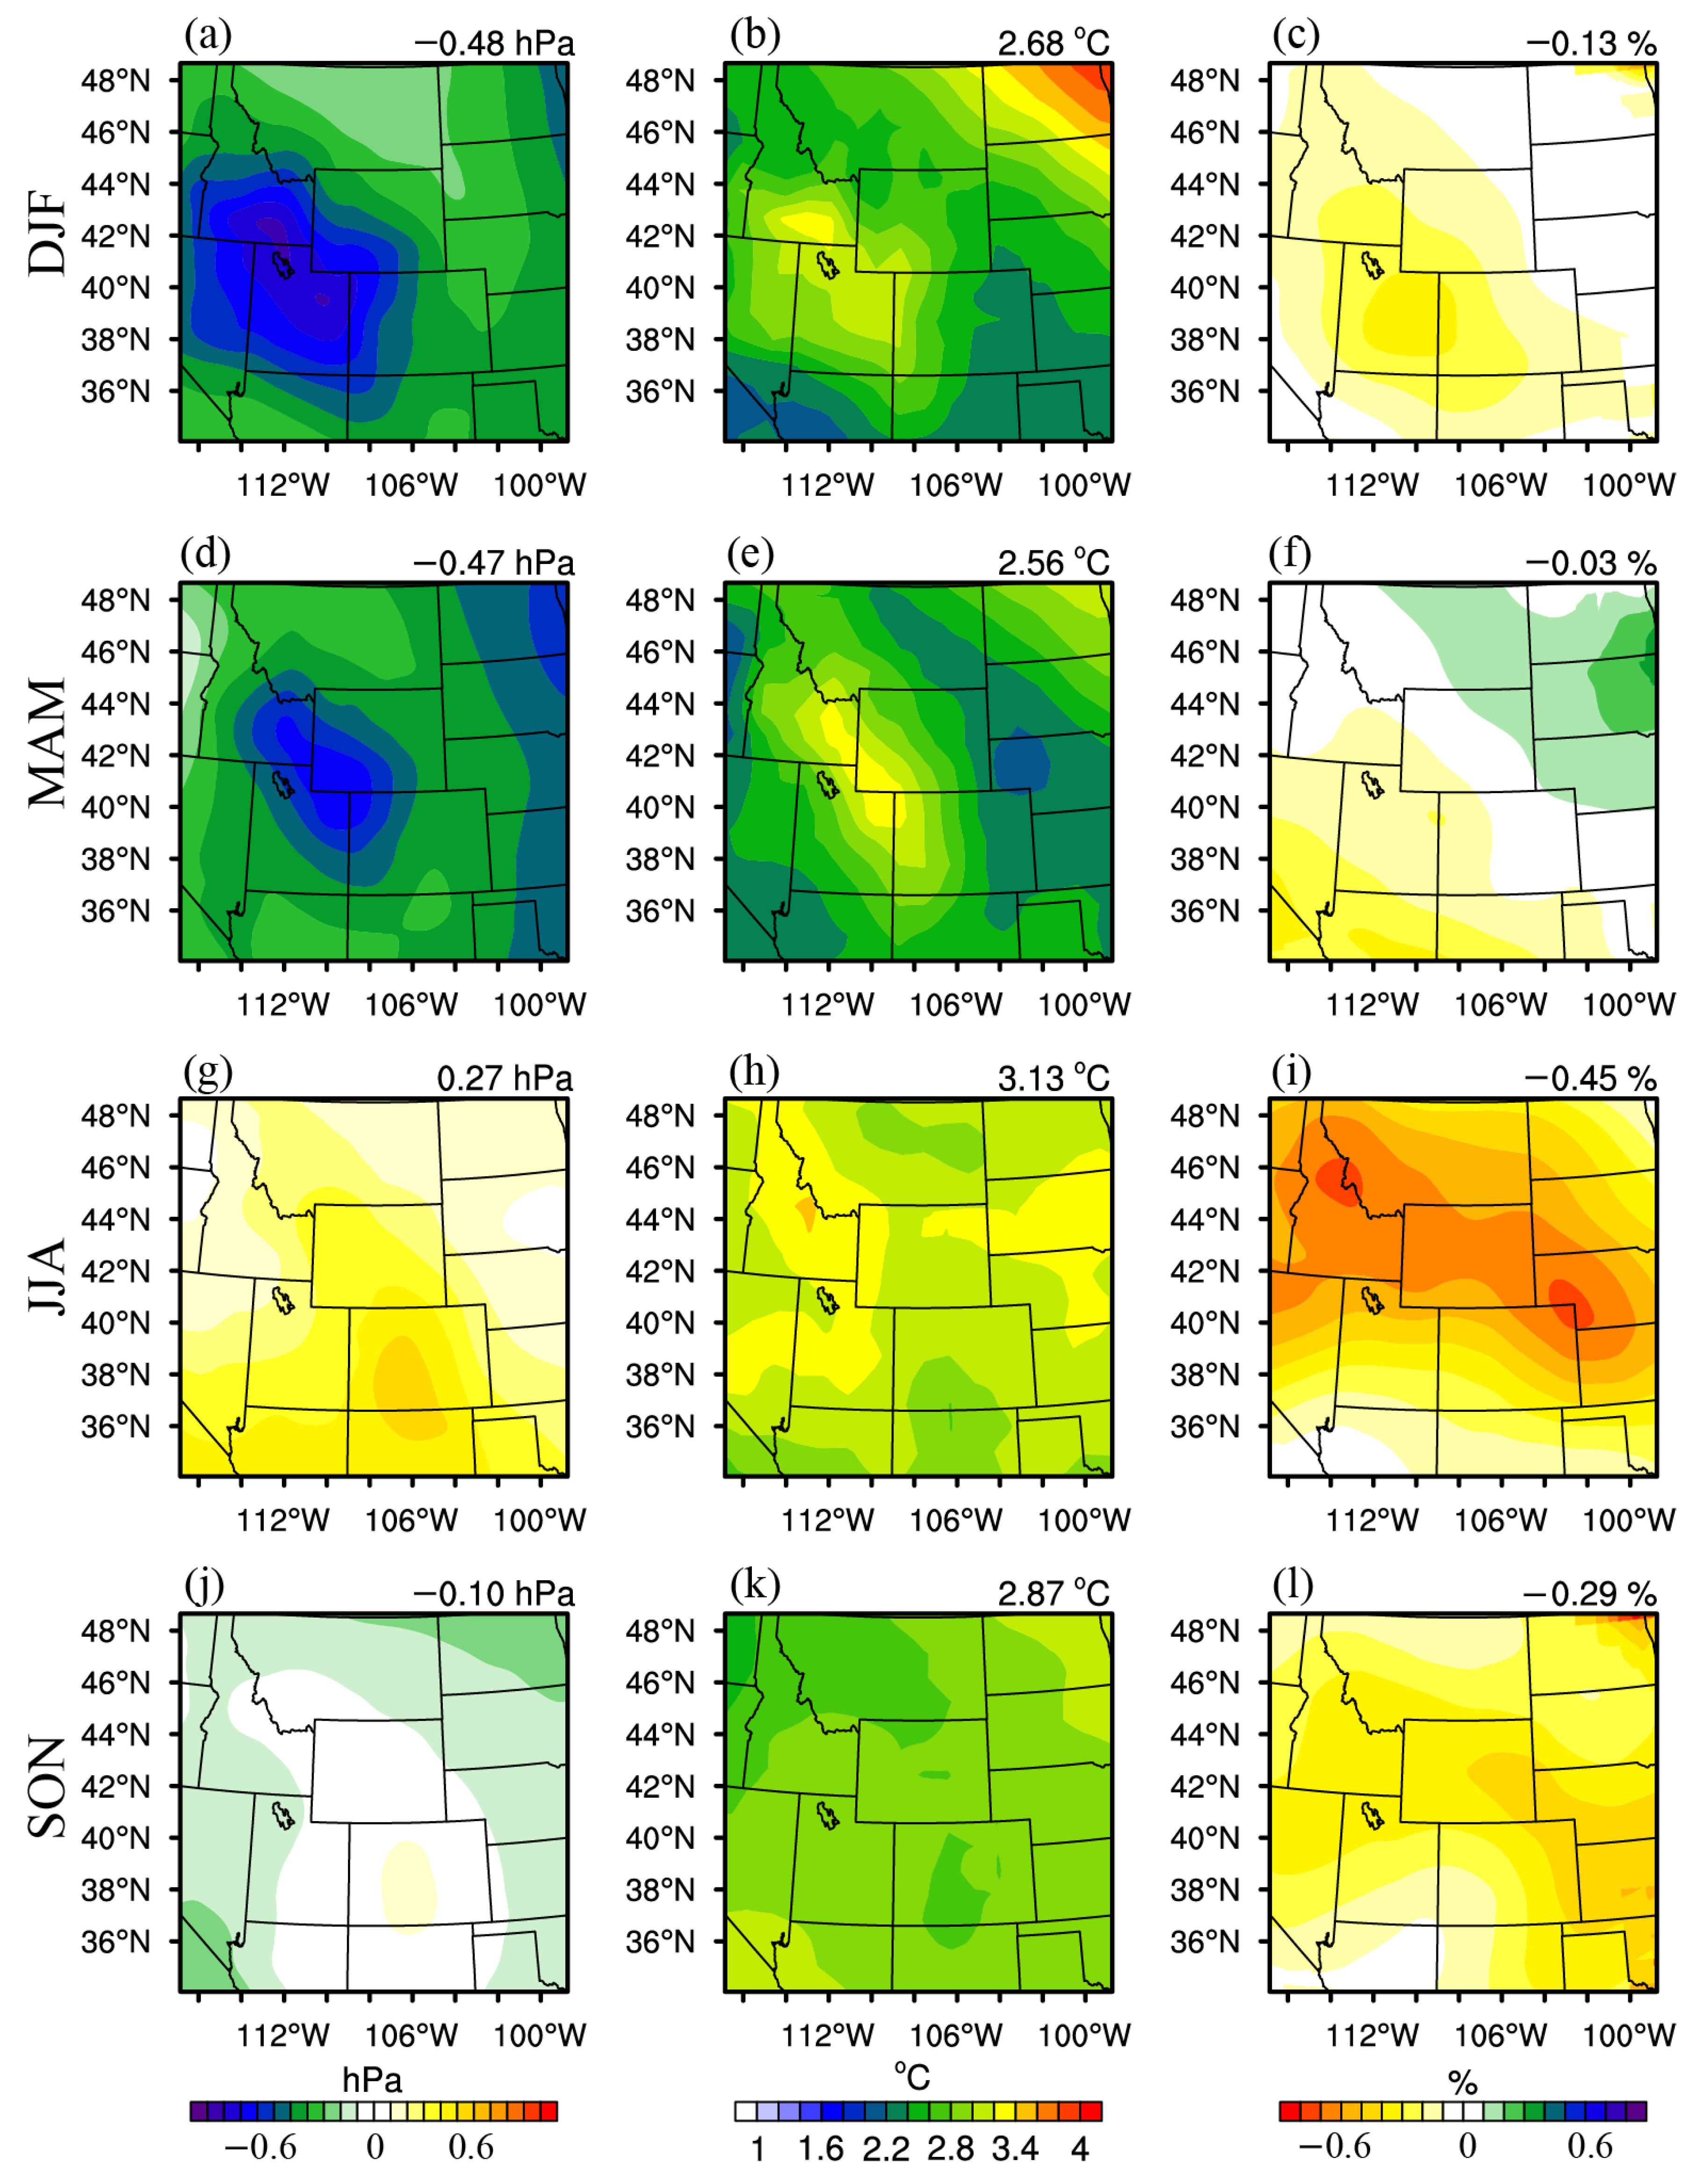
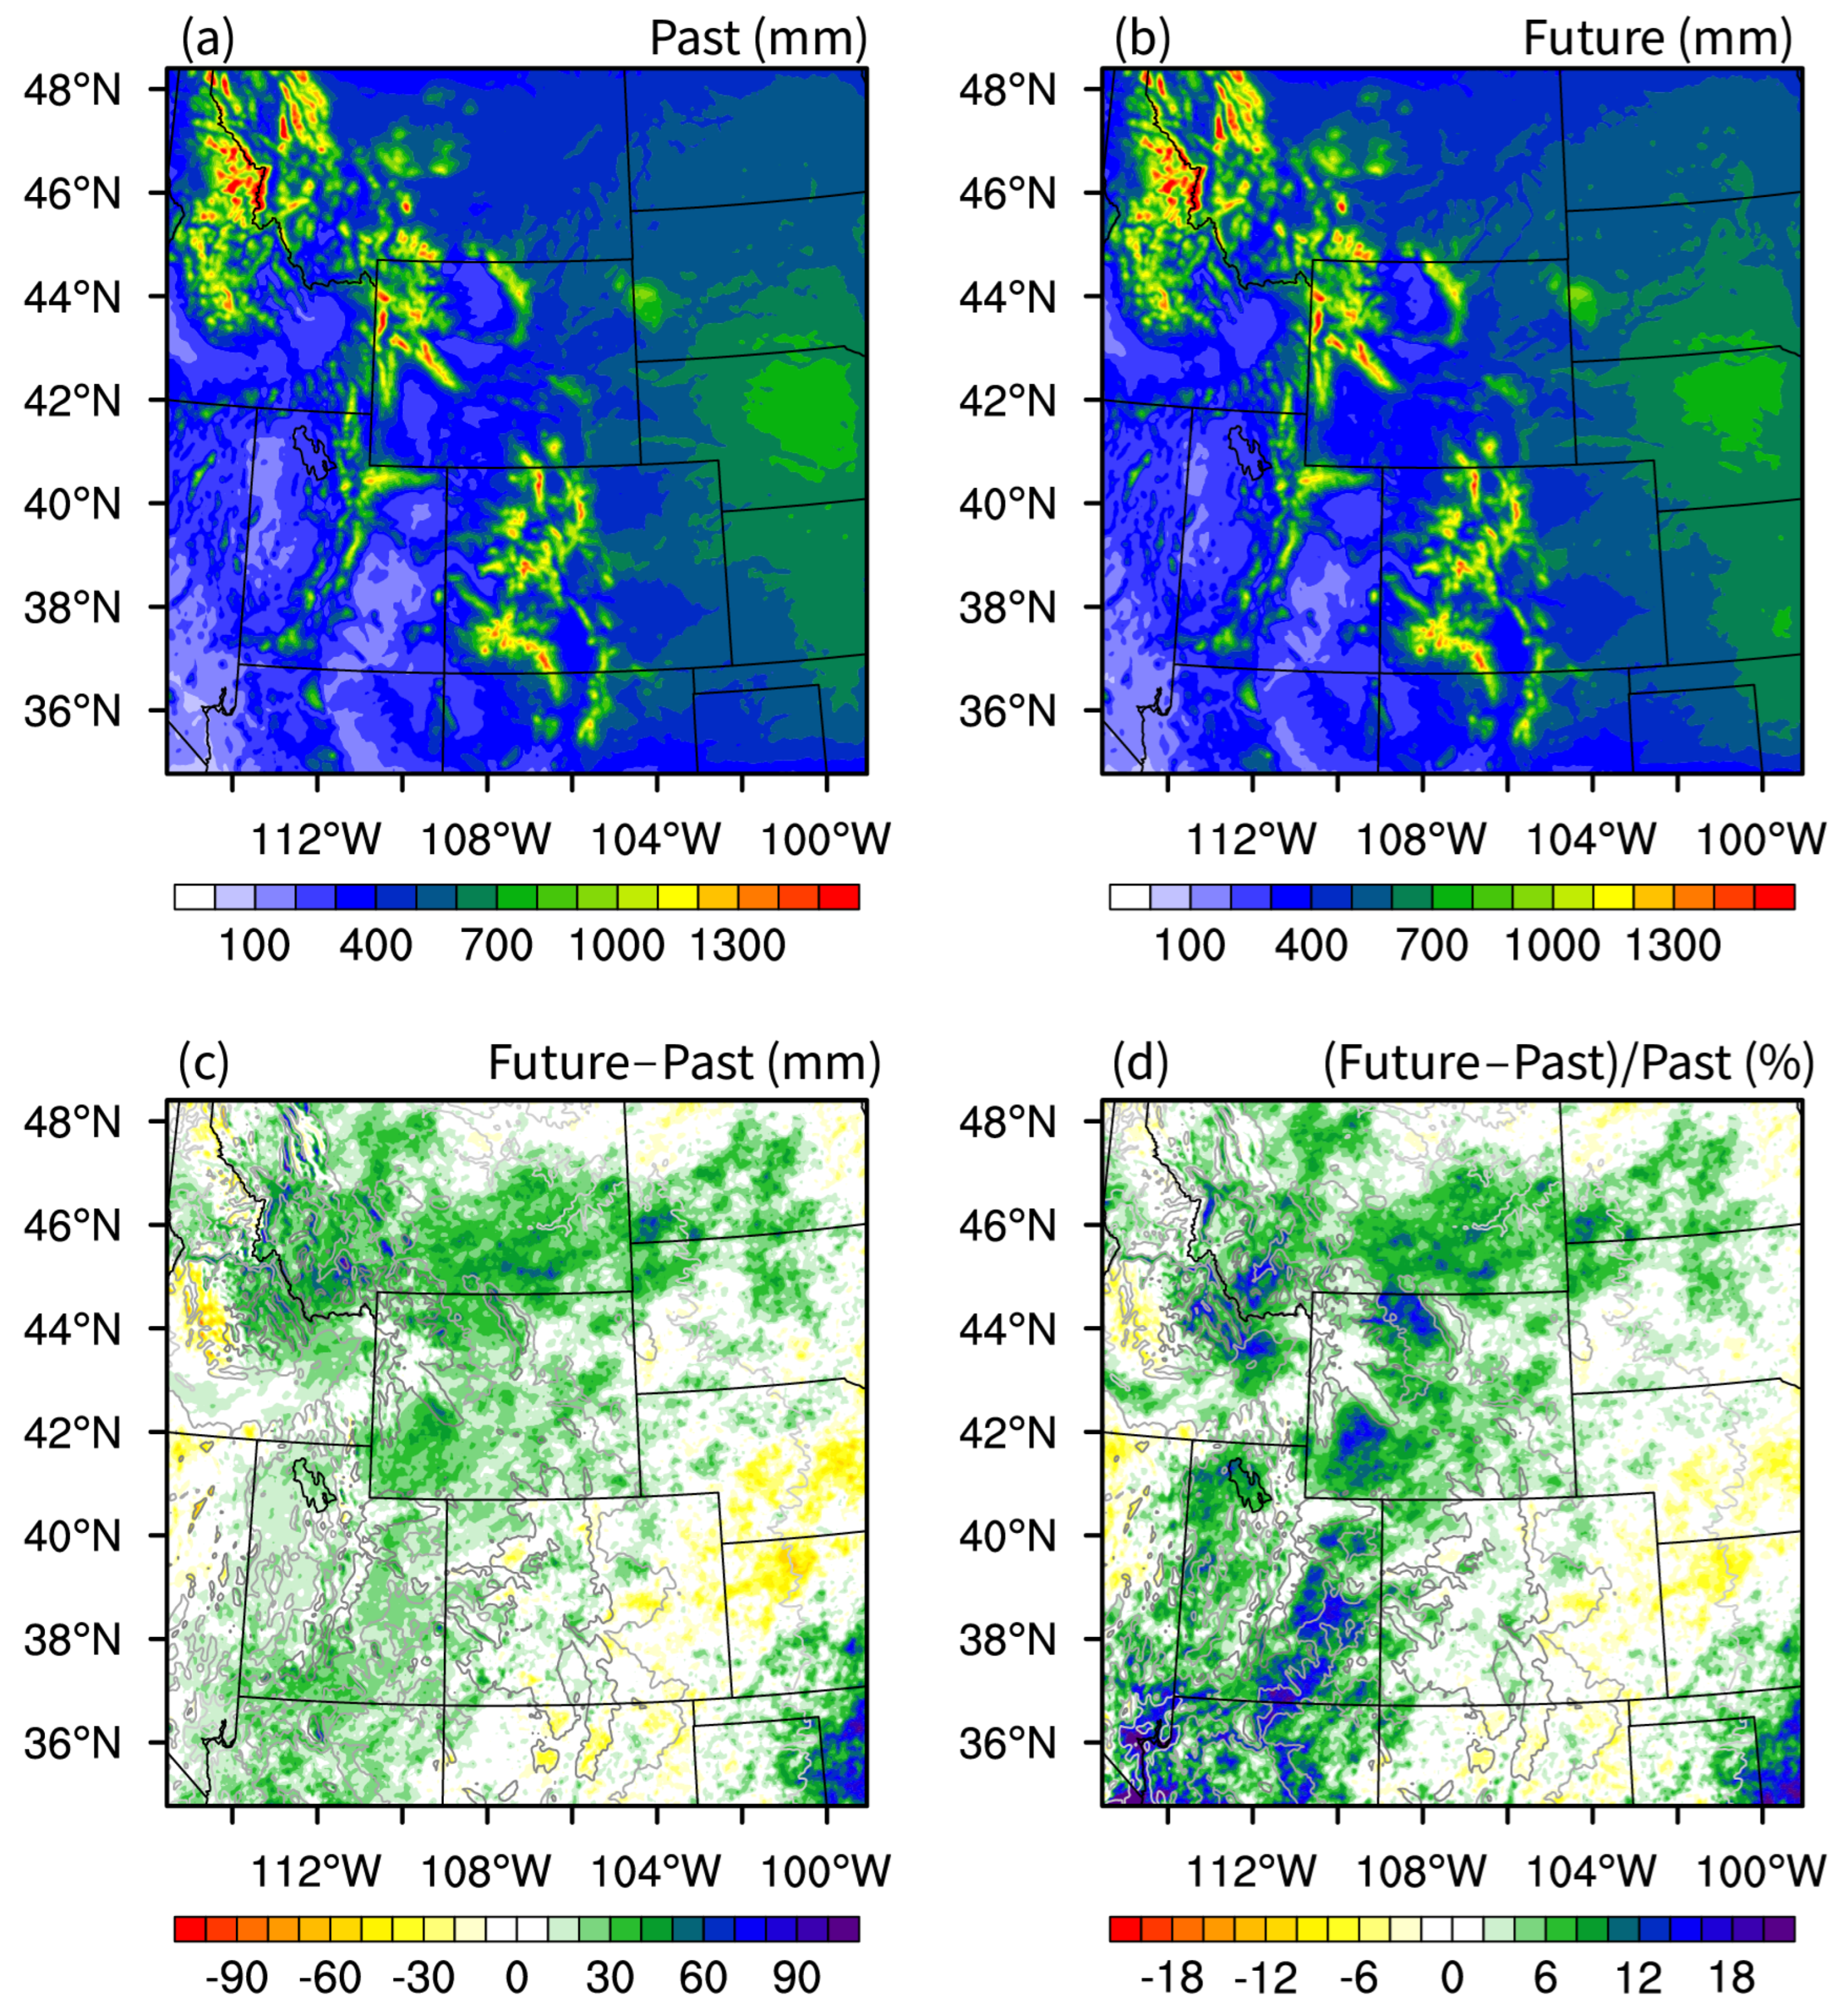
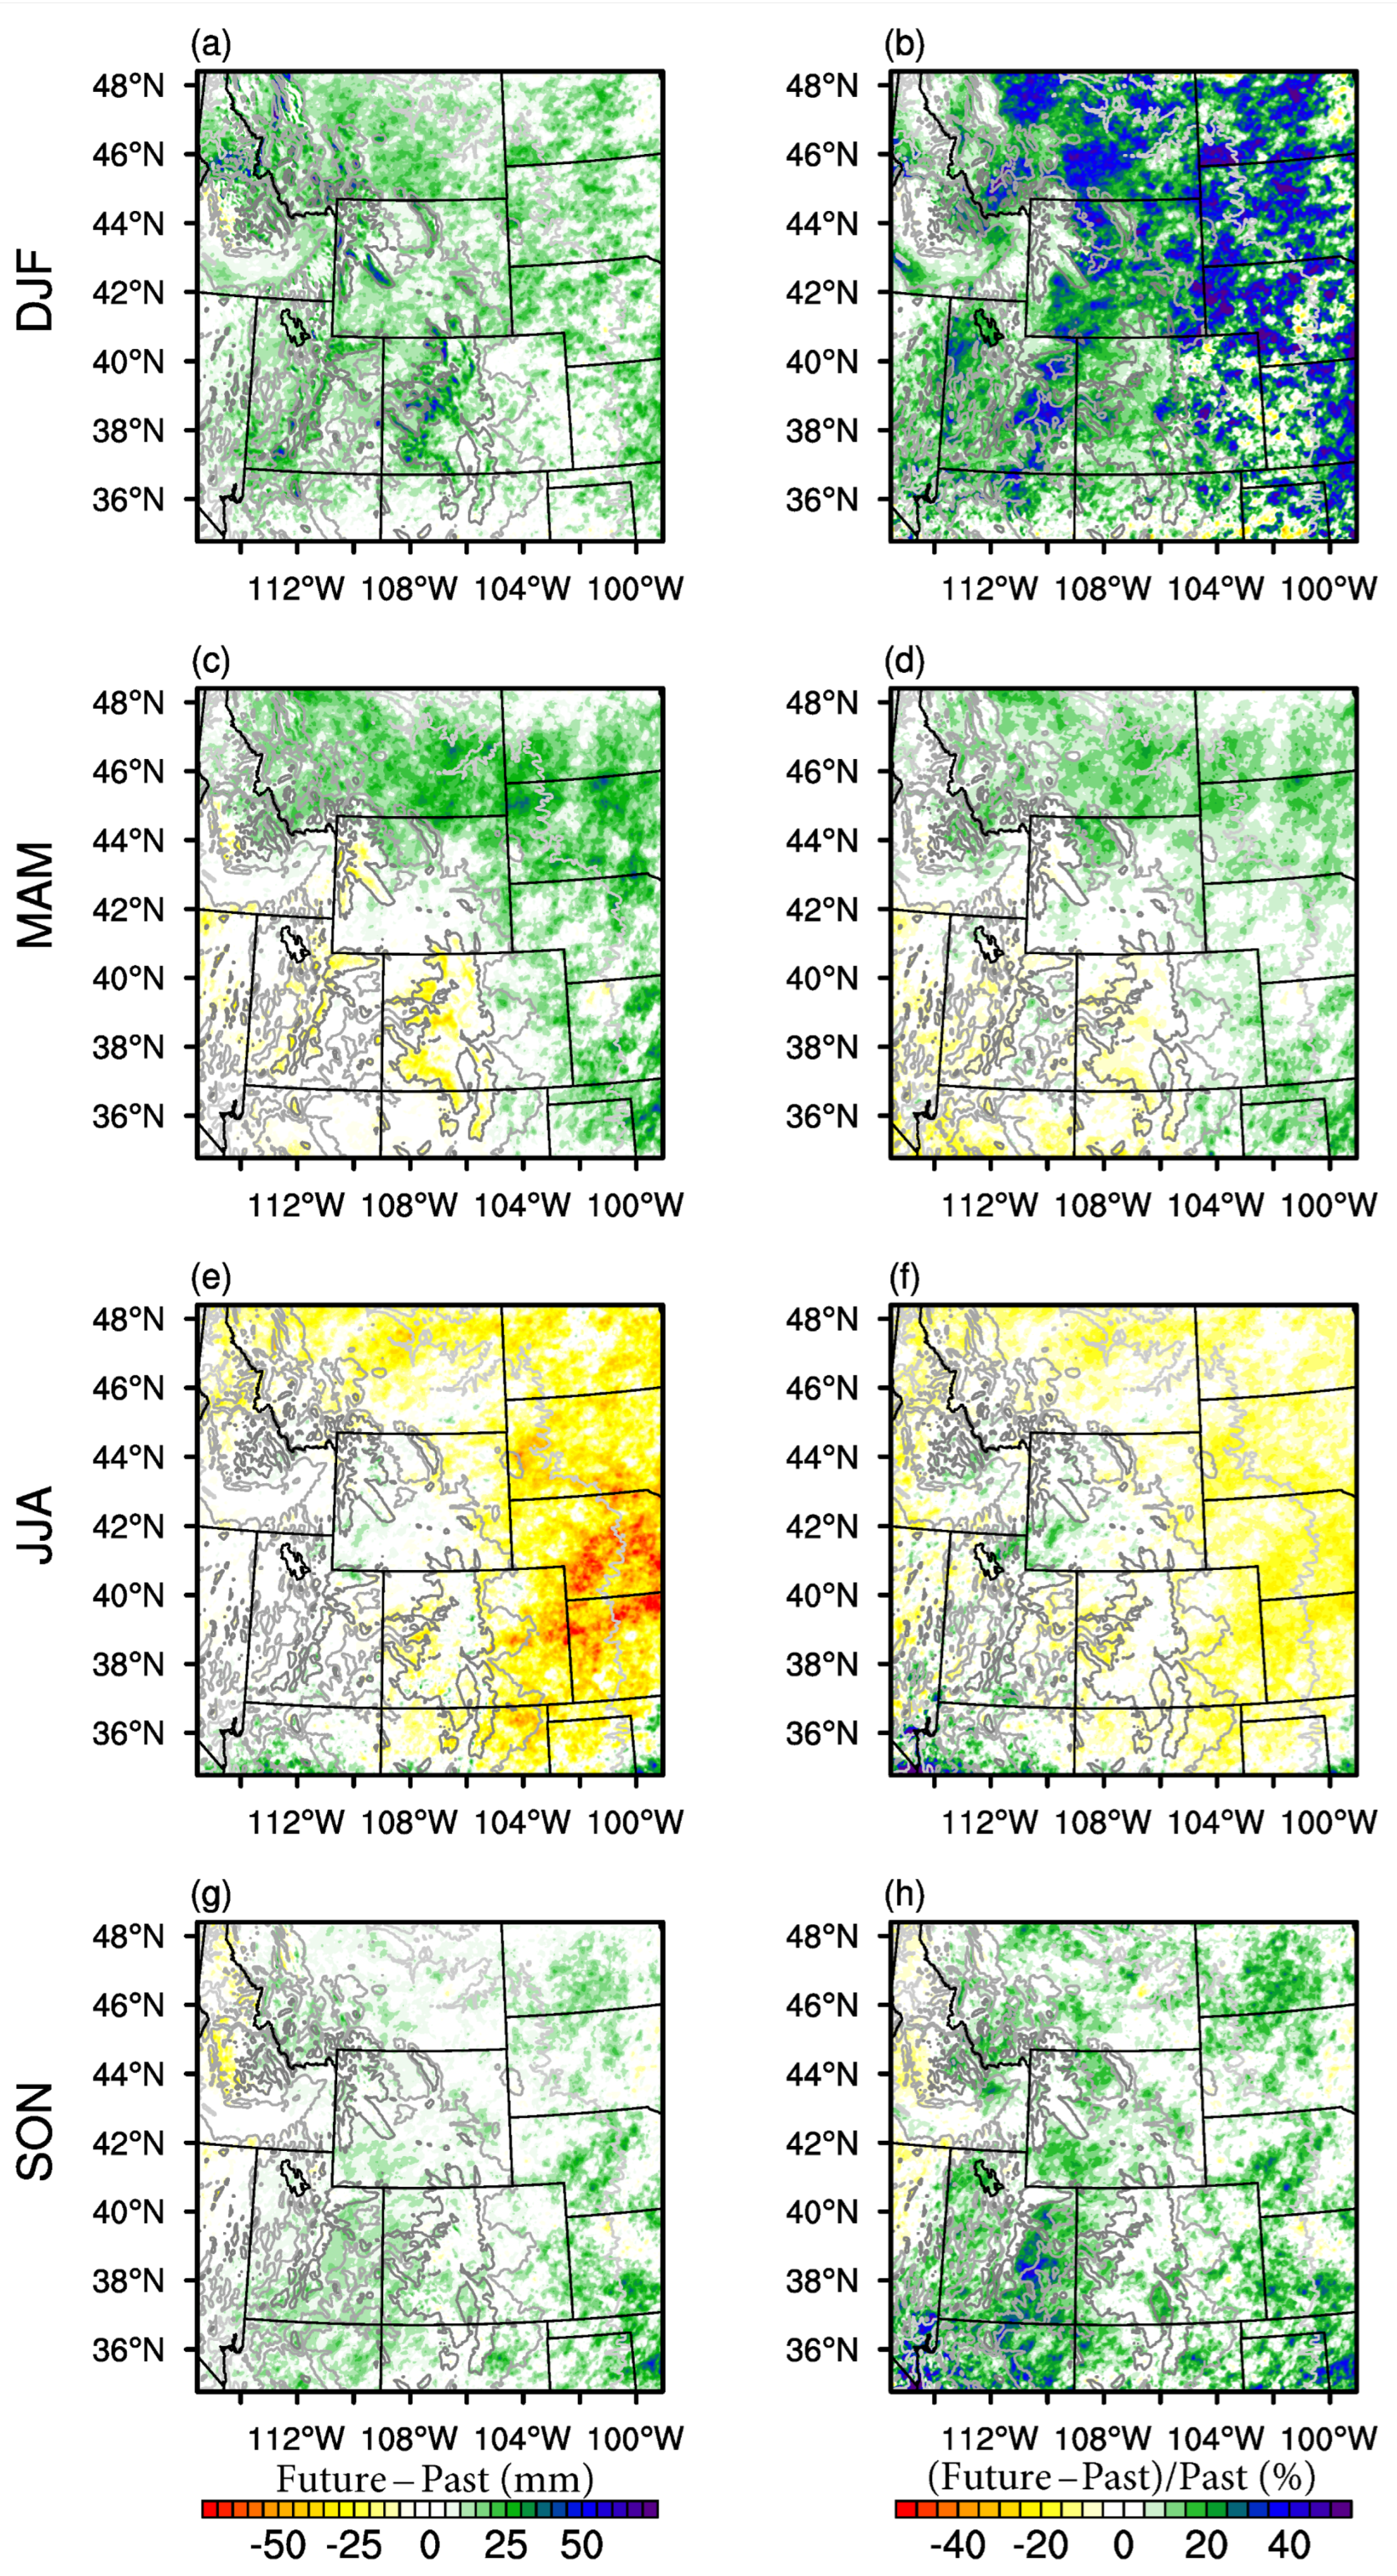
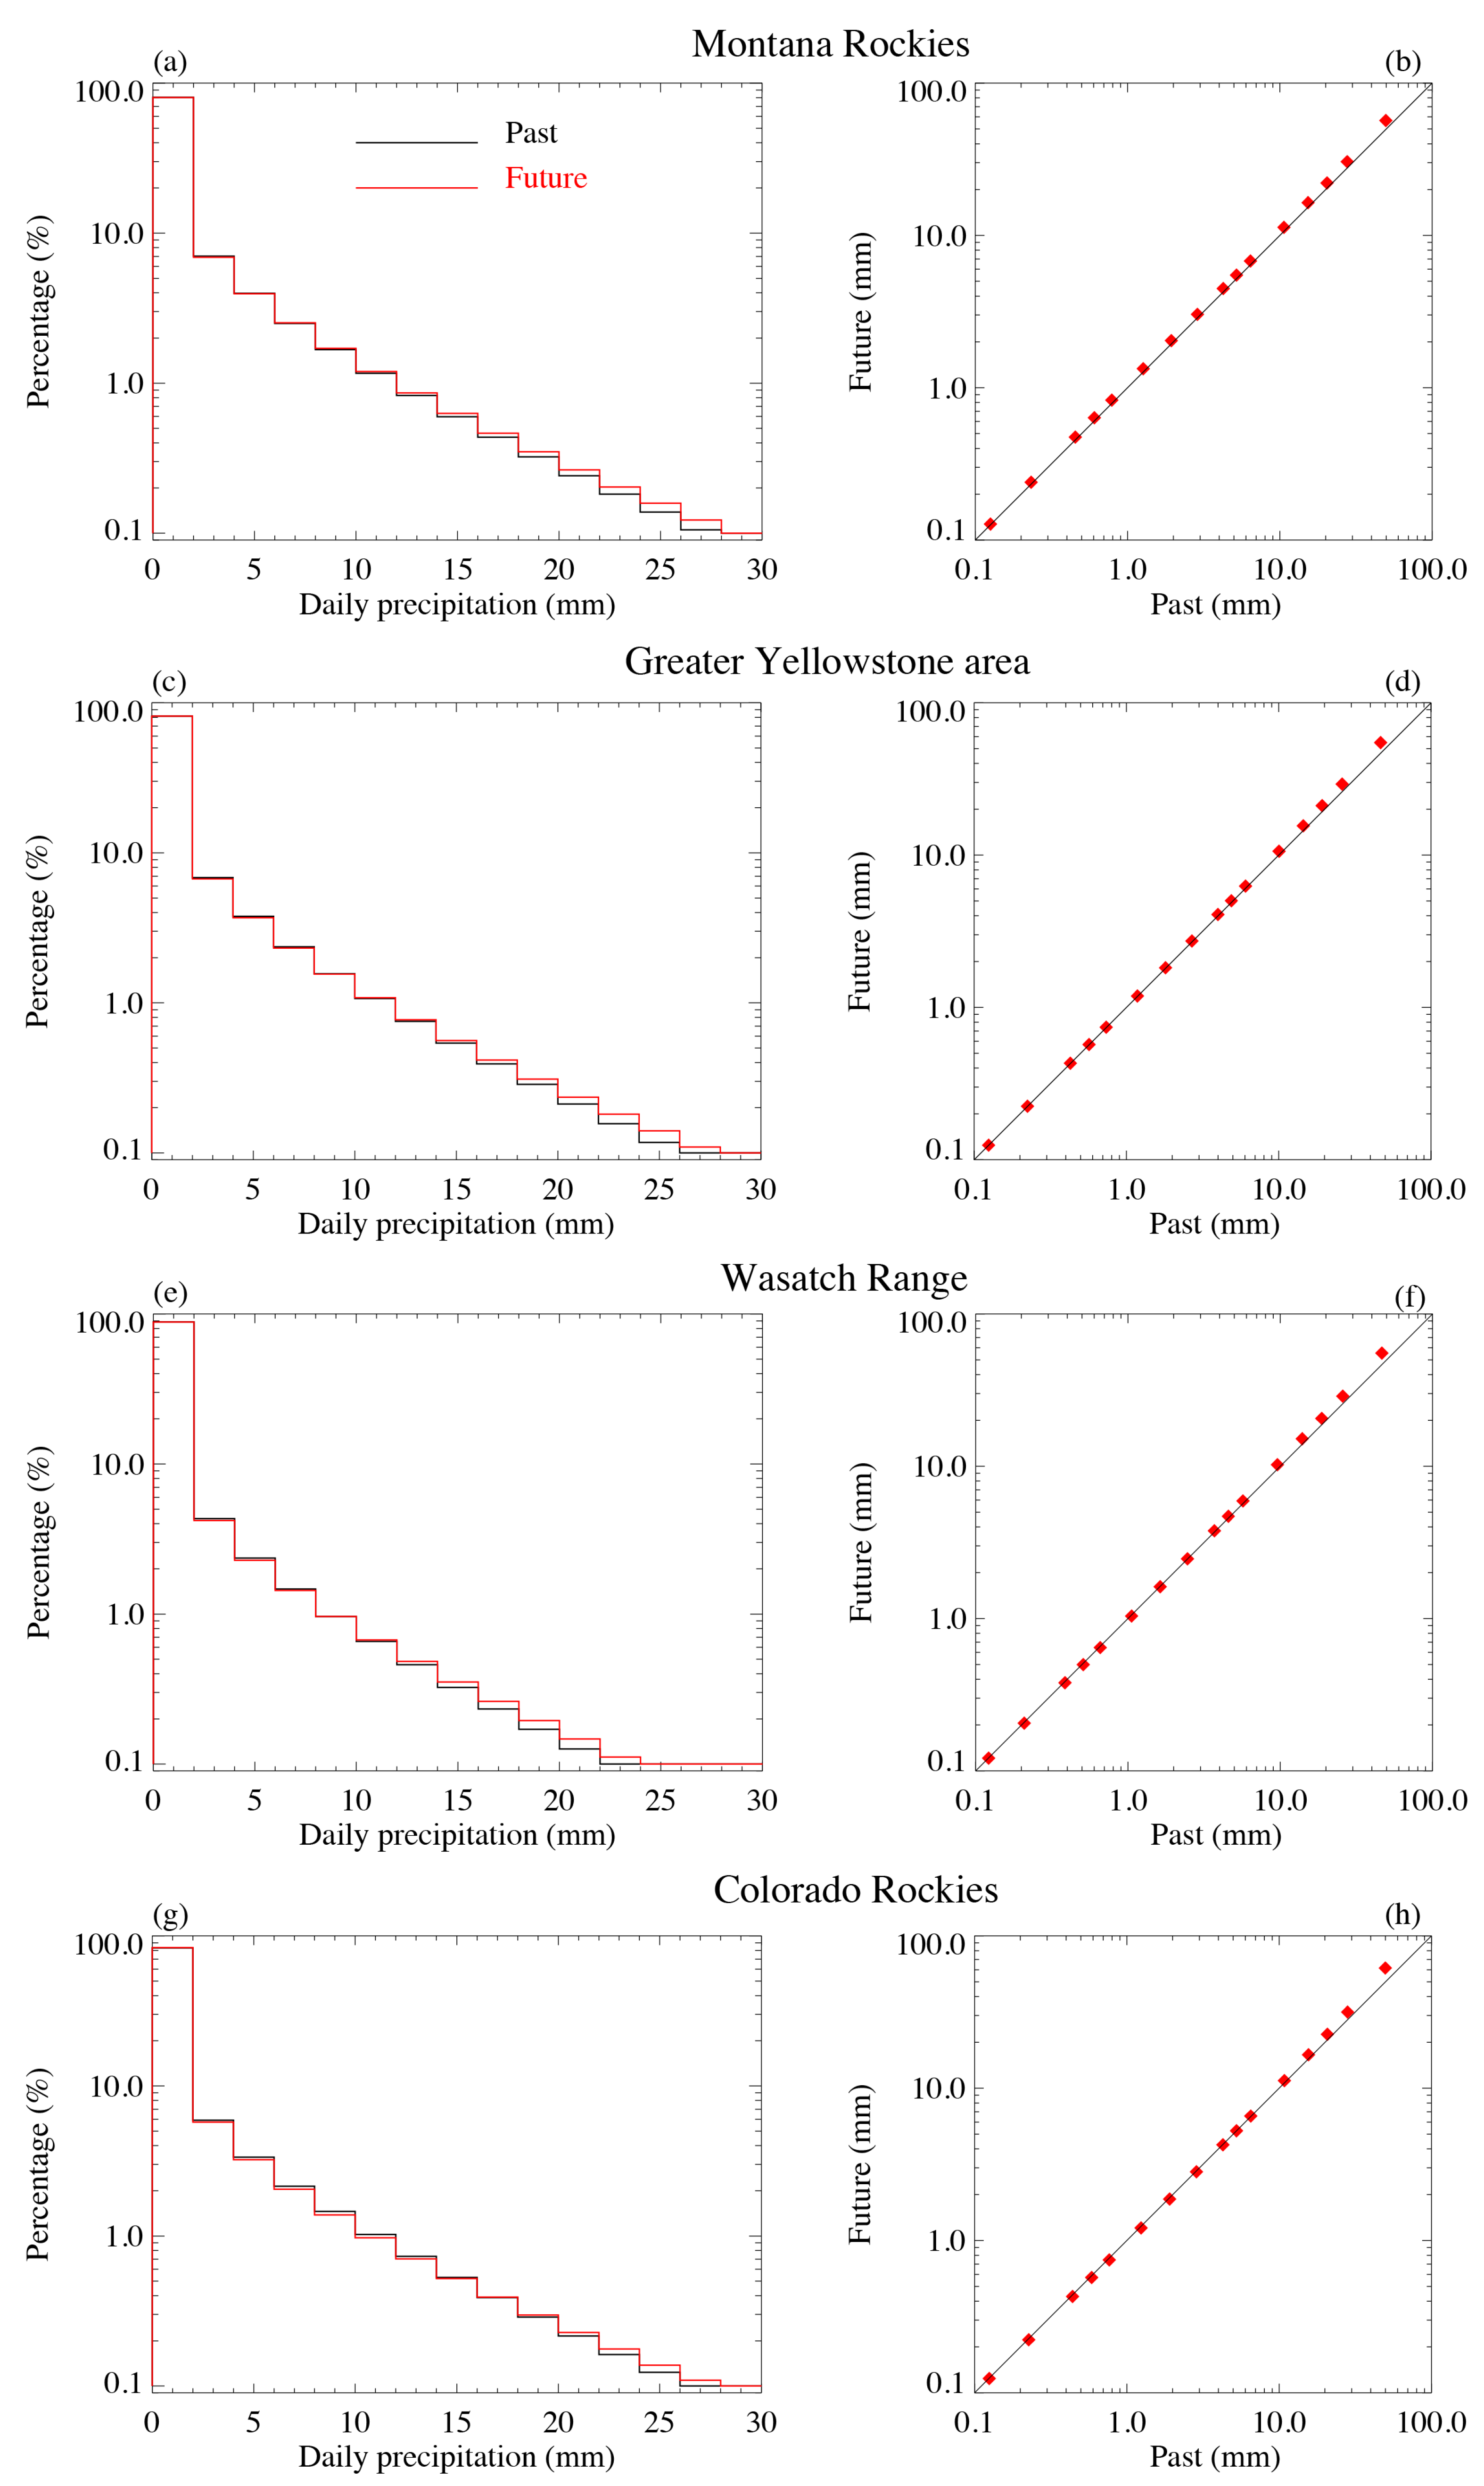
  • Annual precipitation is projected to rise across the majority of the IWUS, with increases of up to 90 mm and percentage changes reaching as high as 18%. Winter precipitation is projected to increase across the domain, while spring and fall show regional variations, and summer precipitation is expected to decrease, particularly in the High Plains and southwestern areas.
  • The projected increase in precipitation over the mountain ranges is largely driven by the heightened frequency of heavy to extreme precipitation events in a warmer climate. Precipitation is projected to increase at all elevations, though the magnitude of the change decreases with height, with smaller increases at higher mountain peaks. Seasonal patterns vary, with greater increases at higher elevations in winter, more pronounced increases at lower elevations in summer, and mixed responses in spring and fall, where lower elevations see precipitation increases or decreases depending on the region.
  • While higher SRs are found in mountainous areas and lower SR values in valleys and the High Plains, the projected future climate indicates a decrease in SR across the entire domain, with a general percentage decrease of up to 30%. In all four subregions, SR are projected to decrease in the future, with the most significant reductions occurring at lower elevations.
  • The snowpack is projected to decrease across most of the study domain, with the largest reductions occurring in the Montana Rockies and Greater Yellowstone, where decreases can reach up to 30%, although the overall change remains small relative to absolute SWE values.
  • SWE is projected to decrease at nearly all elevations, but the largest reductions occur at higher elevations, particularly in the Wasatch Range and Colorado Rockies, while the Greater Yellowstone area shows a reversal of this trend at its highest elevations. The most significant reductions of SWE occur at the highest elevations in the Greater Yellowstone area, Wasatch Range, and Colorado Rockies, and there are similar reductions across all subgroups in the Montana Rockies.
  • A timing index was defined to measure the shift in snowpack melt timing under future climate projections, revealing that snowpack melt is projected to occur earlier across all elevations, with changes ranging from 15 to 26 days.

Author Contributions

Conceptualization, Y.W. and B.G.; methodology, Y.W., C.L., and B.G.; formal analysis, Y.W.; investigation, Y.W., C.L., B.G., and X.J.; data curation, Y.W.; writing—original draft preparation, Y.W.; writing—review and editing, Y.W., C.L., B.G., and X.J.; funding acquisition, Y.W. and B.G. All authors have read and agreed to the published version of the manuscript.

Funding

This work was supported by National Science Foundation Grant AGS 2312316 and the Wyoming EPSCoR.

Institutional Review Board Statement

Not applicable.

Informed Consent Statement

Not applicable.

Data Availability Statement

The IWUS model output, for the historical climate, is available from https://doi.org/10.5281/zenodo.1157112. The future climate is available from https://doi.org/10.5281/zenodo.3934896.

Acknowledgments

We would like to acknowledge high-performance computing support from Yellowstone (ark:/85065/d7wd3xhc) provided by NCAR’s Computational and Information Systems Laboratory’s NCAR Strategic Capability allocation, sponsored by the NSF National Science Foundation. The authors sincerely thank the editor and three reviewers for their constructive comments and suggestions.

Conflicts of Interest

The authors declare no conflicts of interest.

References

  1. Milly, P.; Betancourt, J.; Falkenmark, M.; Hirsch, R.; Kundzewicz, Z.; Lettenmaier, D.; Stouffer, R. Stationarity is dead: Whither water management? Science 2008, 319, 573–574. [Google Scholar] [CrossRef]
  2. Luce, C.; Abatzoglou, J.; Holden, Z. The missing mountain water: Slower westerlies decrease orographic enhancement in the Pacific Northwest USA. Science 2013, 342, 1360–1364. [Google Scholar] [CrossRef]
  3. Ault, T.; Mankin, J.; Cook, B.; Smerdon, J. Relative impacts of mitigation, temperature, and precipitation on 21st-century megadrought risk in the American Southwest. Sci. Adv. 2016, 2, e1600873. [Google Scholar] [CrossRef]
  4. Barry, R.; Chorley, R. Atmosphere, Weather and Climate; Routledge: London, UK, 2009. [Google Scholar]
  5. Mote, P.; Hamlet, A.; Clark, M.; Lettenmaier, D. Declining mountain snowpack in western North America. Bull. Am. Meteorol. Soc. 2005, 86, 39–50. [Google Scholar] [CrossRef]
  6. Das, T.; Pierce, D.; Cayan, D.; Vano, J.; Lettenmaier, D. The importance of warm season warming to western US streamflow changes. Geophys. Res. Lett. 2011, L23403. [Google Scholar]
  7. Fu, G.; Barber, M.; Chen, S. Hydro-climatic variability and trends in Washington State for the last 50 years. Hydrol. Process. Int. J. 2010, 24, 866–878. [Google Scholar] [CrossRef]
  8. Udall, B.; Overpeck, J. The twenty-first century Colorado River hot drought and implications for the future. Water Resour. Res. 2017, 53, 2404–2418. [Google Scholar] [CrossRef]
  9. Woodhouse, C. A paleo perspective on hydroclimatic variability in the western United States. Aquat. Sci. 2004, 66, 346–356. [Google Scholar] [CrossRef]
  10. Wang, Y.; Geerts, B.; Liu, C. A 30-year convection-permitting regional climate simulation over the interior western United States. Part I: Validation. Int. J. Climatol. 2018, 38, 3684–3704. [Google Scholar] [CrossRef]
  11. Rasmussen, R.; Liu, C.; Ikeda, K.; Gochis, D.; Yates, D.; Chen, F.; Tewari, M.; Barlage, M.; Dudhia, J.; Yu, W. Others High-resolution coupled climate runoff simulations of seasonal snowfall over Colorado: A process study of current and warmer climate. J. Clim. 2011, 24, 3015–3048. [Google Scholar]
  12. Rasmussen, R.; Ikeda, K.; Liu, C.; Gochis, D.; Clark, M.; Dai, A.; Gutmann, E.; Dudhia, J.; Chen, F.; Barlage, M. Others Climate change impacts on the water balance of the Colorado headwaters: High-resolution regional climate model simulations. J. Hydrometeorol. 2014, 15, 1091–1116. [Google Scholar] [CrossRef]
  13. Wang, S.; Wang, Y. Improving probabilistic hydroclimatic projections through high-resolution convection-permitting climate modeling and Markov chain Monte Carlo simulations. Clim. Dyn. 2019, 53, 1613–1636. [Google Scholar] [CrossRef]
  14. Prein, A.; Langhans, W.; Fosser, G.; Ferrone, A.; Ban, N.; Goergen, K.; Keller, M.; Tölle, M.; Gutjahr, O.; Feser, F. Others A review on regional convection-permitting climate modeling: Demonstrations, prospects, and challenges. Rev. Geophys. 2015, 53, 323–361. [Google Scholar] [CrossRef]
  15. Liu, C.; Ikeda, K.; Rasmussen, R.; Barlage, M.; Newman, A.; Prein, A.; Chen, F.; Chen, L.; Clark, M.; Dai, A. Others Continental-scale convection-permitting modeling of the current and future climate of North America. Clim. Dyn. 2017, 49, 71–95. [Google Scholar] [CrossRef]
  16. Jing, X.; Geerts, B.; Wang, Y.; Liu, C. Ambient factors controlling the wintertime precipitation distribution across mountain ranges in the interior western United States. Part II: Changes in orographic precipitation distribution in a pseudo-global warming simulation. J. Appl. Meteorol. Climatol. 2019, 58, 695–715. [Google Scholar] [CrossRef]
  17. Skamarock, W.; Klemp, J.; Dudhia, J.; Gill, D.; Barker, D.; Duda, M.; Huang, X.; Wang, W.; Powers, J. Others A description of the advanced research WRF version 3. NCAR Tech. Note 2008, 475, 10–5065. [Google Scholar]
  18. Liu, C.; Ikeda, K.; Thompson, G.; Rasmussen, R.; Dudhia, J. High-resolution simulations of wintertime precipitation in the Colorado Headwaters region: Sensitivity to physics parameterizations. Mon. Weather Rev. 2011, 139, 3533–3553. [Google Scholar] [CrossRef]
  19. Li, Y.; Li, Z.; Zhang, Z.; Chen, L.; Kurkute, S.; Scaff, L.; Pan, X. High-resolution regional climate modeling and projection over western Canada using a weather research forecasting model with a pseudo-global warming approach. Hydrol. Earth Syst. Sci. 2019, 23, 4635–4659. [Google Scholar] [CrossRef]
  20. Newman, A.; Monaghan, A.; Clark, M.; Ikeda, K.; Xue, L.; Gutmann, E.; Arnold, J. Hydroclimatic changes in Alaska portrayed by a high-resolution regional climate simulation. Clim. Change 2021, 164, 17. [Google Scholar] [CrossRef]
  21. Jing, X.; Geerts, B.; Wang, Y.; Liu, C. Evaluating seasonal orographic precipitation in the interior western United States using gauge data, gridded precipitation estimates, and a regional climate simulation. J. Hydrometeorol. 2017, 18, 2541–2558. [Google Scholar] [CrossRef]
  22. Saha, S.; Moorthi, S.; Pan, H.; Wu, X.; Wang, J.; Nadiga, S.; Tripp, P.; Kistler, R.; Woollen, J.; Behringer, D. Others The NCEP climate forecast system reanalysis. Bull. Am. Meteorol. Soc. 2010, 91, 1015–1058. [Google Scholar] [CrossRef]
  23. Thompson, G.; Field, P.; Rasmussen, R.; Hall, W. Explicit forecasts of winter precipitation using an improved bulk microphysics scheme. Part II: Implementation of a new snow parameterization. Mon. Weather Rev. 2008, 136, 5095–5115. [Google Scholar] [CrossRef]
  24. Iacono, M.; Delamere, J.; Mlawer, E.; Shephard, M.; Clough, S.; Collins, W. Radiative forcing by long-lived greenhouse gases: Calculations with the AER radiative transfer models. J. Geophys. Res. Atmos. 2008, 113, D13103. [Google Scholar] [CrossRef]
  25. Hong, S.; Pan, H. Nonlocal boundary layer vertical diffusion in a medium-range forecast model. Mon. Weather Rev. 1996, 124, 2322–2339. [Google Scholar] [CrossRef]
  26. Jiménez, P.; Dudhia, J.; González-Rouco, J.; Navarro, J.; Montávez, J.; García-Bustamante, E. A revised scheme for the WRF surface layer formulation. Mon. Weather Rev. 2012, 140, 898–918. [Google Scholar] [CrossRef]
  27. Niu, G.; Yang, Z.; Mitchell, K.; Chen, F.; Ek, M.; Barlage, M.; Kumar, A.; Manning, K.; Niyogi, D.; Rosero, E. Others The community Noah land surface model with multiparameterization options (Noah-MP): 1. Model description and evaluation with local-scale measurements. J. Geophys. Res. Atmos. 2011, 116, D12109. [Google Scholar] [CrossRef]
  28. Yang, Z.; Niu, G.; Mitchell, K.; Chen, F.; Ek, M.; Barlage, M.; Longuevergne, L.; Manning, K.; Niyogi, D.; Tewari, M. Others The community Noah land surface model with multiparameterization options (Noah-MP): 2. Evaluation over global river basins. J. Geophys. Res. Atmos. 2011, 116, D12110. [Google Scholar] [CrossRef]
  29. Serreze, M.; Clark, M.; Armstrong, R.; McGinnis, D.; Pulwarty, R. Characteristics of the western United States snowpack from snowpack telemetry (SNOTEL) data. Water Resour. Res. 1999, 35, 2145–2160. [Google Scholar] [CrossRef]
  30. Daly, C.; Neilson, R.; Phillips, D. A statistical-topographic model for mapping climatological precipitation over mountainous terrain. J. Appl. Meteorol. Climatol. 1994, 33, 140–158. [Google Scholar] [CrossRef]
  31. Schär, C.; Frei, C.; Lüthi, D.; Davies, H. Surrogate climate-change scenarios for regional climate models. Geophys. Res. Lett. 1996, 23, 669–672. [Google Scholar] [CrossRef]
  32. Eidhammer, T.; Grubišić, V.; Rasmussen, R.; Ikdea, K. Winter precipitation efficiency of mountain ranges in the Colorado Rockies under climate change. J. Geophys. Res. Atmos. 2018, 123, 2573–2590. [Google Scholar] [CrossRef]
  33. Hurrell, J.; Visbeck, M.; Pirani, P. WCRP coupled model intercomparison project-phase 5-CMIP5. Clivar Exch. 2011, 16, 1–52. [Google Scholar]
  34. Pachauri, R.; Allen, M.; Barros, V.; Broome, J.; Cramer, W.; Christ, R.; Church, J.; Clarke, L.; Dahe, Q.; Dasgupta, P. Others Climate change 2014: Synthesis Report. Contribution of Working Groups I, II and III to the Fifth Assessment Report of the Intergovernmental Panel on Climate Change; IPCC: Hayama, Japan, 2014. [Google Scholar]
  35. Jennings, K.; Winchell, T.; Livneh, B.; Molotch, N. Spatial variation of the rain–snow temperature threshold across the Northern Hemisphere. Nat. Commun. 2018, 9, 1148. [Google Scholar] [CrossRef] [PubMed]
  36. Barnett, T.; Adam, J.; Lettenmaier, D. Potential impacts of a warming climate on water availability in snow-dominated regions. Nature 2005, 438, 303–309. [Google Scholar] [CrossRef] [PubMed]
  37. Cayan, D. Interannual climate variability and snowpack in the western United States. J. Clim. 1996, 9, 928–948. [Google Scholar] [CrossRef]
  38. Hamlet, A.; Lettenmaier, D. Effects of 20th century warming and climate variability on flood risk in the western US. Water Resour. Res. 2007, 43, W06427. [Google Scholar] [CrossRef]
  39. Mote, P.; Salathé, E., Jr. Future climate in the Pacific Northwest. Clim. Change 2010, 102, 29–50. [Google Scholar] [CrossRef]
  40. Georgakakos, A.; Fleming, P.; Dettinger, M.; Peters-Lidard, C.; Richmond, T.; Reckhow, K.; White, K.; Yates, D.C. 3: Water Resources. In Climate Change Impacts in the United States: The Third National Climate Assessment; Melillo, J.M., Richmond, T.C., Yohe, G.W., Eds.; U.S. Global Change Research Program: Washington, DC, USA, 2014; pp. 69–112. [Google Scholar]
  41. Viviroli, D.; Archer, D.; Buytaert, W.; Fowler, H.; Greenwood, G.; Hamlet, A.; Huang, Y.; Koboltschnig, G.; Litaor, M.; López-Moreno, J. Others Climate change and mountain water resources: Overview and recommendations for research, management and policy. Hydrol. Earth Syst. Sci. 2011, 15, 471–504. [Google Scholar] [CrossRef]
  42. Hausfather, Z.; Peters, G. Emissions–the ‘business as usual’ story is misleading. Nature 2020, 577, 618–620. [Google Scholar] [CrossRef]
Figure 1. Model domain with topography. Four subregions are highlighted as rectangular boxes: the Montana Rockies (1), the Greater Yellowstone area (2), the Wasatch Range (3), and the Colorado Rockies (4). Adopted from [10].
Climate 13 00046 g001
Figure 2. (a) CMIP5 model ensemble-mean seasonal difference of sea level pressure between future (2036–2065) and past (1976–2005) periods for DJF. (b) Same as (a), but of surface temperature. (c) Same as (a), but of 2 m relative humidity. (df) Same as (ac), but for MAM. (gi) Same as (ac), but for JJA. (jl) Same as (ac), but for SON. The numbers at upper right corners are the mean differences over the IWUS domain. DJF stands for December, January, and February; MAM stands for March, April, and May; JJA stands for June, July, and August; and SON stands for September, October, and November.
Climate 13 00046 g002
Figure 3. (a) The 30-year mean annual precipitation from the past climate simulation. (b) Same as (a), but for the future simulation. (c) Absolute difference between the past and future climates. (d) Percentage difference between the past and future climates. The contours in (c,d) are terrain elevation, at 800 m intervals starting at 800 m MSL, whereas higher elevations are associated with darker colors.
Climate 13 00046 g003
Figure 4. (a) The 30-year mean seasonal precipitation difference between the past and future climates for DJF. (b) Same as (a), but for percentage difference. (c,d) Same as (a), but for MAM. (e,f) Same as (a), but for JJA. (g,h) Same as (a), but for SON. The contours are terrain elevation, at 800 m intervals starting at 800 m MSL, whereas higher elevations are associated with darker colors.
Climate 13 00046 g004
Figure 5. Variation of annual and seasonal precipitation changes between past and future climates as a function of elevation over the subregion of (a) the Montana Rockies, (b) the Greater Yellowstone area, (c) the Wasatch Range, and (d) the Colorado Rockies. The boxes represent the frequency of elevation bins. Elevation is normalized between the lowest and highest grid point within each subregion.
Climate 13 00046 g005
Figure 6. (a) The 30-year mean annual snowfall from the past simulation. (b) The 30-year mean annual snowfall difference between the past and future climates. (c,d) Same as (a,b), but for annual rainfall.
Climate 13 00046 g006
Figure 7. (a) The 30-year mean SR averaged over the cold season (October-April) from the past climate simulation. (b) Same as (a), but for the future simulation. (c) Absolute difference between the past and future climates. (d) Percentage difference between the past and future climates. The contours in (c,d) are terrain elevation, at 800 m intervals starting at 800 m MSL, whereas higher elevations are associated with darker colors.
Climate 13 00046 g007
Figure 8. Variation of SR as a function of elevation for past climate (black upward triangles), future climate (red downward triangles), and the difference between past and future climates (purple circles) for (a) the Montana Rockies, (b) the Greater Yellowstone area, (c) the Wasatch Range, and (d) the Colorado Rockies. The boxes represent the frequency of elevation bins. Elevation is normalized between the lowest and highest grid point.
Climate 13 00046 g008
Figure 9. (a) The 30-year mean SWE on Apr 1st from the past climate simulation. (b) Same as (a), but for the future simulation. (c) Absolute difference between past and future climates. (d) Percentage difference between past and future climates, with grey shade representing past SWE less than 10 mm.
Climate 13 00046 g009
Figure 10. (a) Variation of mean SWE as the function of elevation for the Montana Rockies. (b) Same as (a), but for the difference between the past and future climates. (c,d) Same as (a,b), but for the Greater Yellowstone area. (e,f) Same as (a,b), but for the Wasatch Range. (g,h) Same as (a,b), but for the Colorado Rockies. The blue boxes represent the frequency of elevation bins.
Climate 13 00046 g010
Figure 11. Seasonal snowpack cycle as a function of elevation for (a) the Montana Rockies, (b) the Greater Yellowstone area, (c) the Wasatch Range, and (d) the Colorado Rockies. The solid curves represent the past climate and the dashed ones represent the future climate. The black color represents grid boxes with the lowest 1/3 elevations, the red color for the middle 1/3, and the blue color for the highest 1/3. The numbers of days shown in each panel are the difference in calendar days between the past and future climates that 10% of the current SWE maximum is reached, and the numbers in mm are the difference in SWE maximum from the past and future climates.
Climate 13 00046 g011
Figure 12. (a) Histogram and (b) percentile–percentile plot of daily precipitation from the past and future simulations for the subregion of the Montana Rockies. Days with zero precipitation are included in (a) but not in (b). The 16 dots in (b) represent the following precipitation distribution percentiles: 2.5, 10, 20, 25, 30, 40, 50 (median), 60, 70, 75, 80, 90, 95, 97.5, 99, and 99.9%. (c,d) Same as (a,b), but for the Greater Yellowstone area. (e,f) Same as (a,b), but for the Wasatch Range. (g,h) Same as (a,b), but for the Colorado Rockies.
Climate 13 00046 g012
Table 1. WRF model physics options for the IWUS historical and future climate simulations.
WRF PhysicsParameterization SchemesReferences
MicrophysicsThompson scheme[23]
RadiationRapid Radiative Transfer Model (RRTMG)[24]
Planetary boundary layerYonsei University (YSU) scheme[25]
Surface layerRevised Monin–Obukhov scheme[26]
Land surfaceNoah-MP scheme[27,28]
Table 2. Summary of 15 CMIP5 GCMs used to develop climate perturbation signal field.
CMIP5 I. D.Atmospheric Grid Spacing (°)Ensemble Members Used
LatitudeLongitude
ACCESS1.31.251.8751 (1)
CCSM40.941.253 (1, 2, 6)
CESM1-CAM50.941.253 (1, 2, 3)
CNRM-CM51.401.413 (2, 4, 6)
CSIRO-Mk3.6.01.871.883 (1, 2, 3)
GFDL-CM32.02.51 (1)
GFDL-ESM2M1.522.51 (1)
GISS-E2-H2.02.52 (1, 2)
HadGEM2-CC1.21.8752 (2, 3)
HadGEM2-ES1.251.8752 (2, 3)
INM-CM41.52.01 (1)
IPSL-CM5A-MR1.272.501 (1)
MIROC51.401.413 (1, 2, 3)
MIROC-ESM2.792.811 (1)
MRI-CGCM31.121.121 (1)
Table 3. Spatial-average of absolute and percentage change of seasonal precipitation between past and future climates for four subregions: Montana Rockies, Greater Yellowstone area, Wasatch Range, and Colorado Rockies.
Montana RockiesGreater Yellowstone AreaWasatch RangeColorado Rockies
DJFFuture − Current (mm)17.013.513.612.3
Percent Change (%)15.216.917.913.4
MAMFuture − Current (mm)10.67.0−4.0−4.3
Percent Change (%)6.64.9−2.6−2.5
JJAFuture − Current (mm)−2.6−0.4−0.1−6.9
Percent Change (%)−1.1−0.4−0.3−4.0
SONFuture − Current (mm)5.05.78.86.8
Percent Change (%)6.66.513.57.1
Table 4. Comparison of spatial-average daily precipitation between past and future climates for four subregions: Montana Rockies, Greater Yellowstone area, Wasatch Range, and Colorado Rockies.
Montana RockiesGreater
Yellowstone Area
Wasatch RangeColorado
Rockies
Light precipitation
(0.1–4 mm)
Past68.45%70.06%71.88%68.35%
Future67.10%69.54%71.36%68.19%
Future − Past−1.35%−0.52%−0.52%−0.16%
Medium precipitation
(4–14 mm)
Past25.50%24.54%23.15%25.38%
Future26.03%24.28%22.78%24.91%
Future − Past0.53%−0.26%−0.37%−0.47%
Heavy precipitation
(>14 mm)
Current6.06%5.40%4.96%6.27%
Future6.87%6.18%5.85%6.91%
Future − Past0.81%0.78%0.89%0.64%
Disclaimer/Publisher’s Note: The statements, opinions and data contained in all publications are solely those of the individual author(s) and contributor(s) and not of MDPI and/or the editor(s). MDPI and/or the editor(s) disclaim responsibility for any injury to people or property resulting from any ideas, methods, instructions or products referred to in the content.

