Understanding Changing Trends in Extreme Rainfall in Saudi Arabia: Trend Detection and Automated EVT-Based Threshold Estimation
Abstract
1. Introduction
- To develop a data-driven, automated method for threshold estimation of extreme rainfall events using the Peaks Over Threshold (POT) approach within Extreme Value Theory (EVT), based on the Generalized Pareto Distribution (GPD), thereby improving objectivity, accuracy, and reproducibility compared to traditional percentile-based methods.
- To detect long-term trends in rainfall using the non-parametric Mann–Kendall test applied to robust statistical measures, including the first quartile (Q1), median (Q2), third quartile (Q3), and maximum rainfall values.
- To characterize regional rainfall patterns across Saudi Arabia by applying the k-means clustering algorithm to annual rainfall cycles, offering a data-driven classification beyond conventional regional divisions.
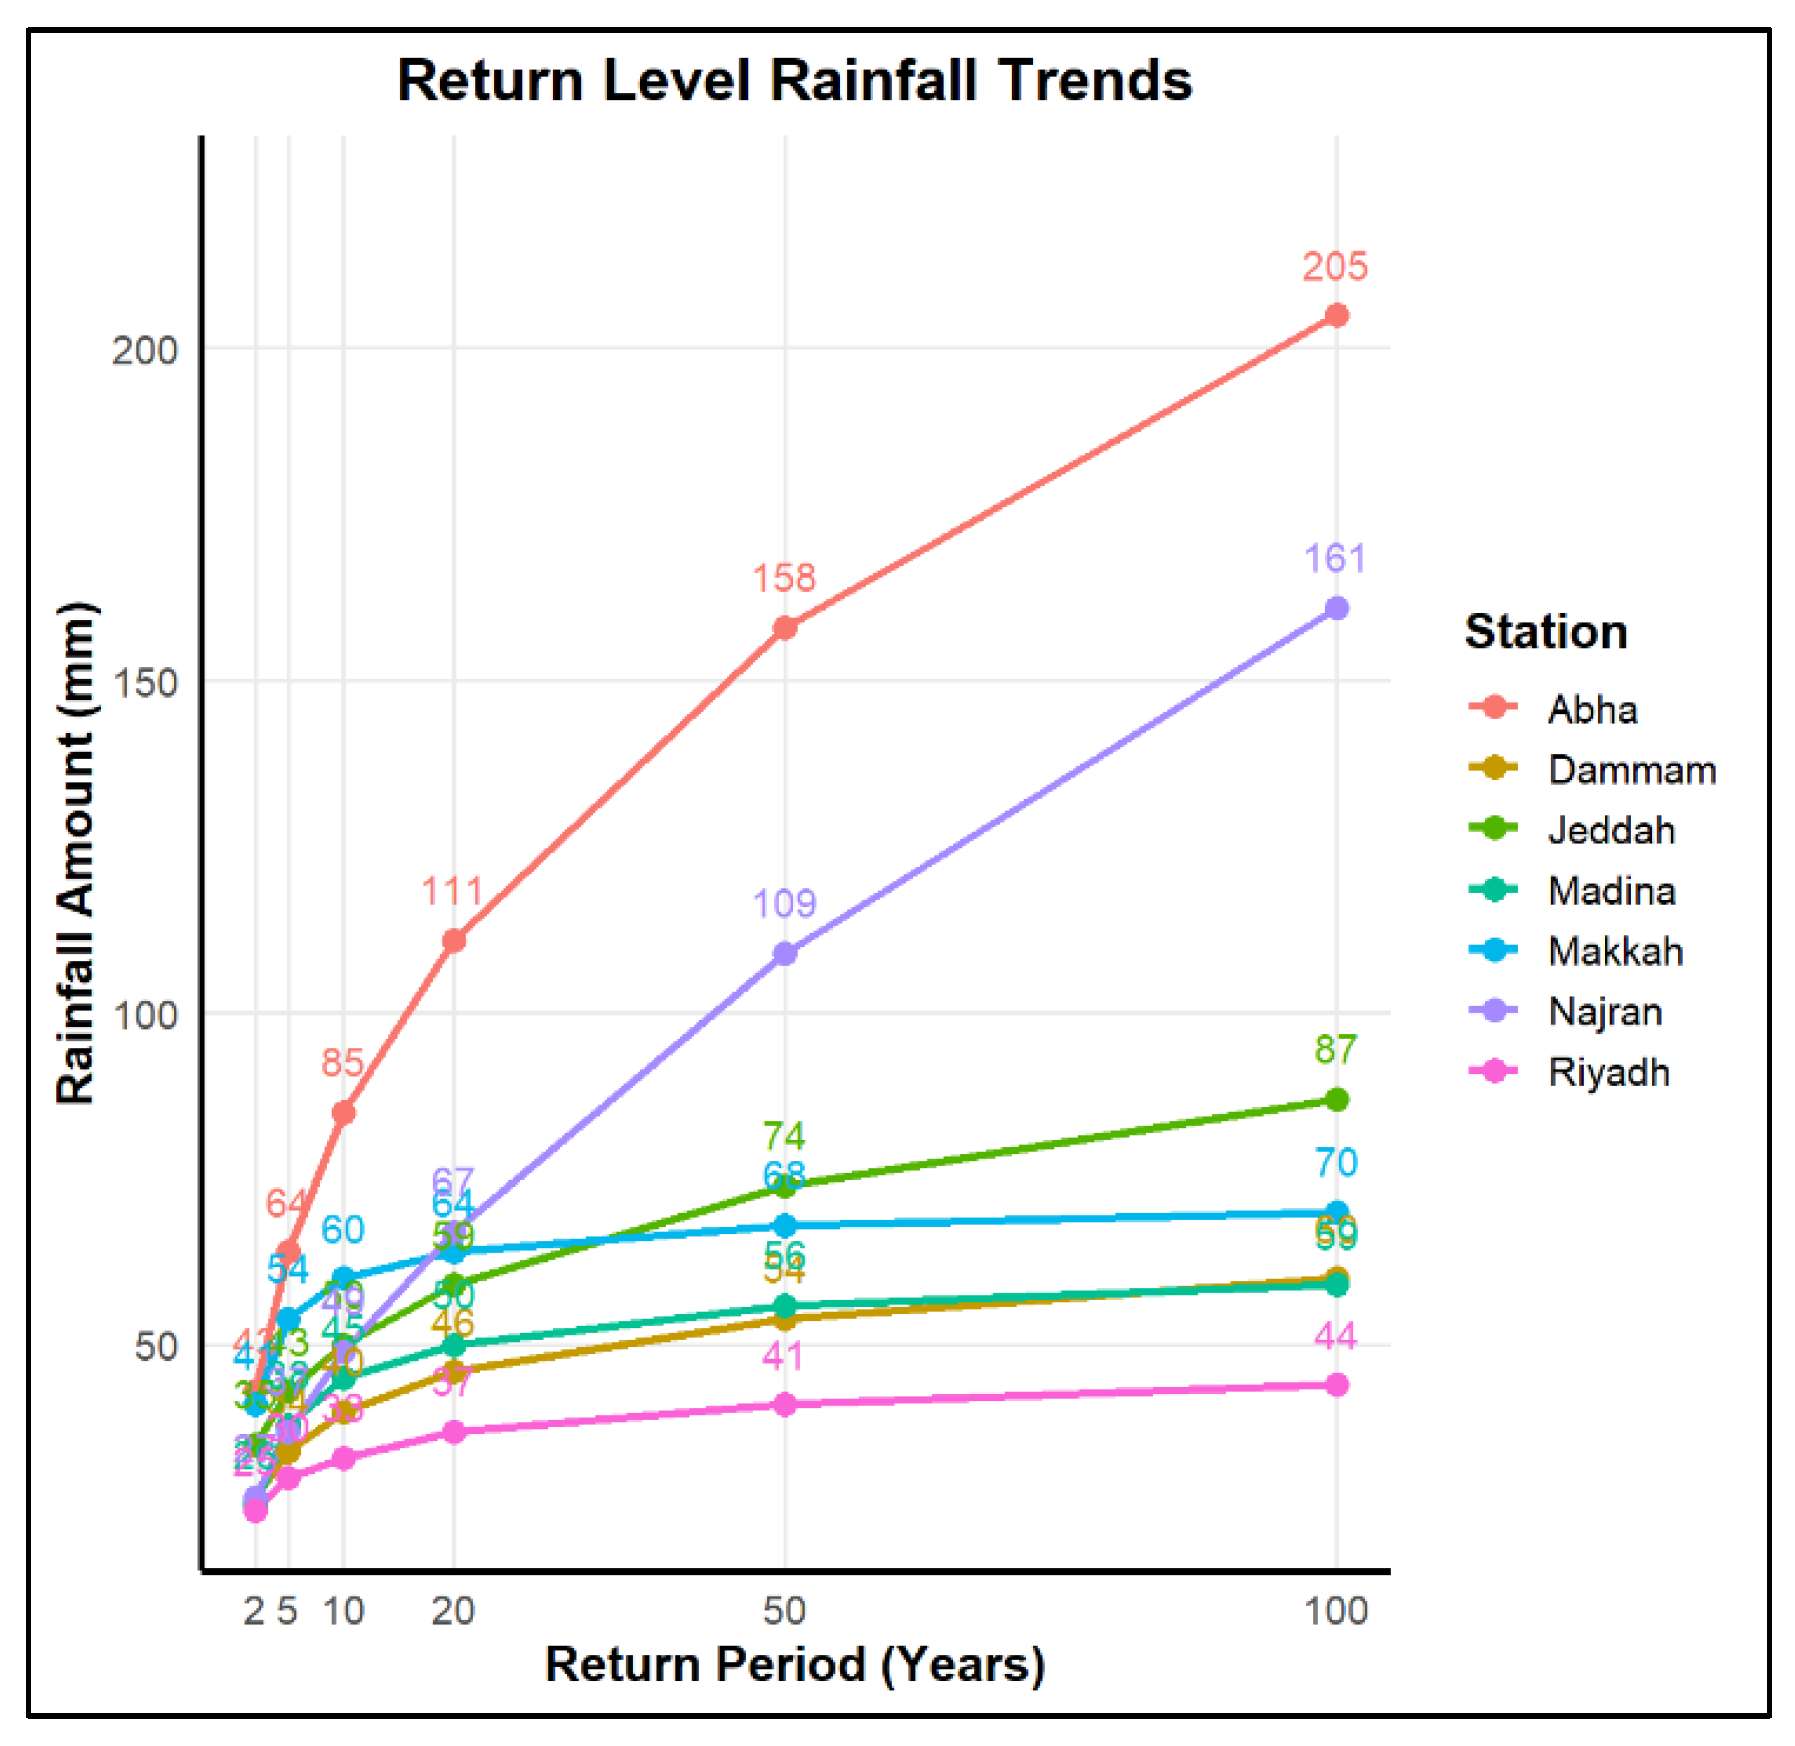
- To estimate site-specific return levels for extreme rainfall events for return periods of 2, 5, 10, 20, 50, and 100 years using the fitted GPD parameters.
- To analyze extreme rainfall trends in both the frequency and intensity exceeding the site-specific EVT-based thresholds.
2. Methodology
2.1. Meteorological Monitoring Network
2.2. Descriptive Statistics for Skewed Rainfall Distributions
2.3. Mann–Kendall Test
2.4. K-Means Clustering
- k = number of clusters
- Ci = set of points belonging to cluster i
- xj = a data point
- μi = centroid of cluster i
- ∥xj − μi∥ = Euclidean distance between data point xj and centroid μi
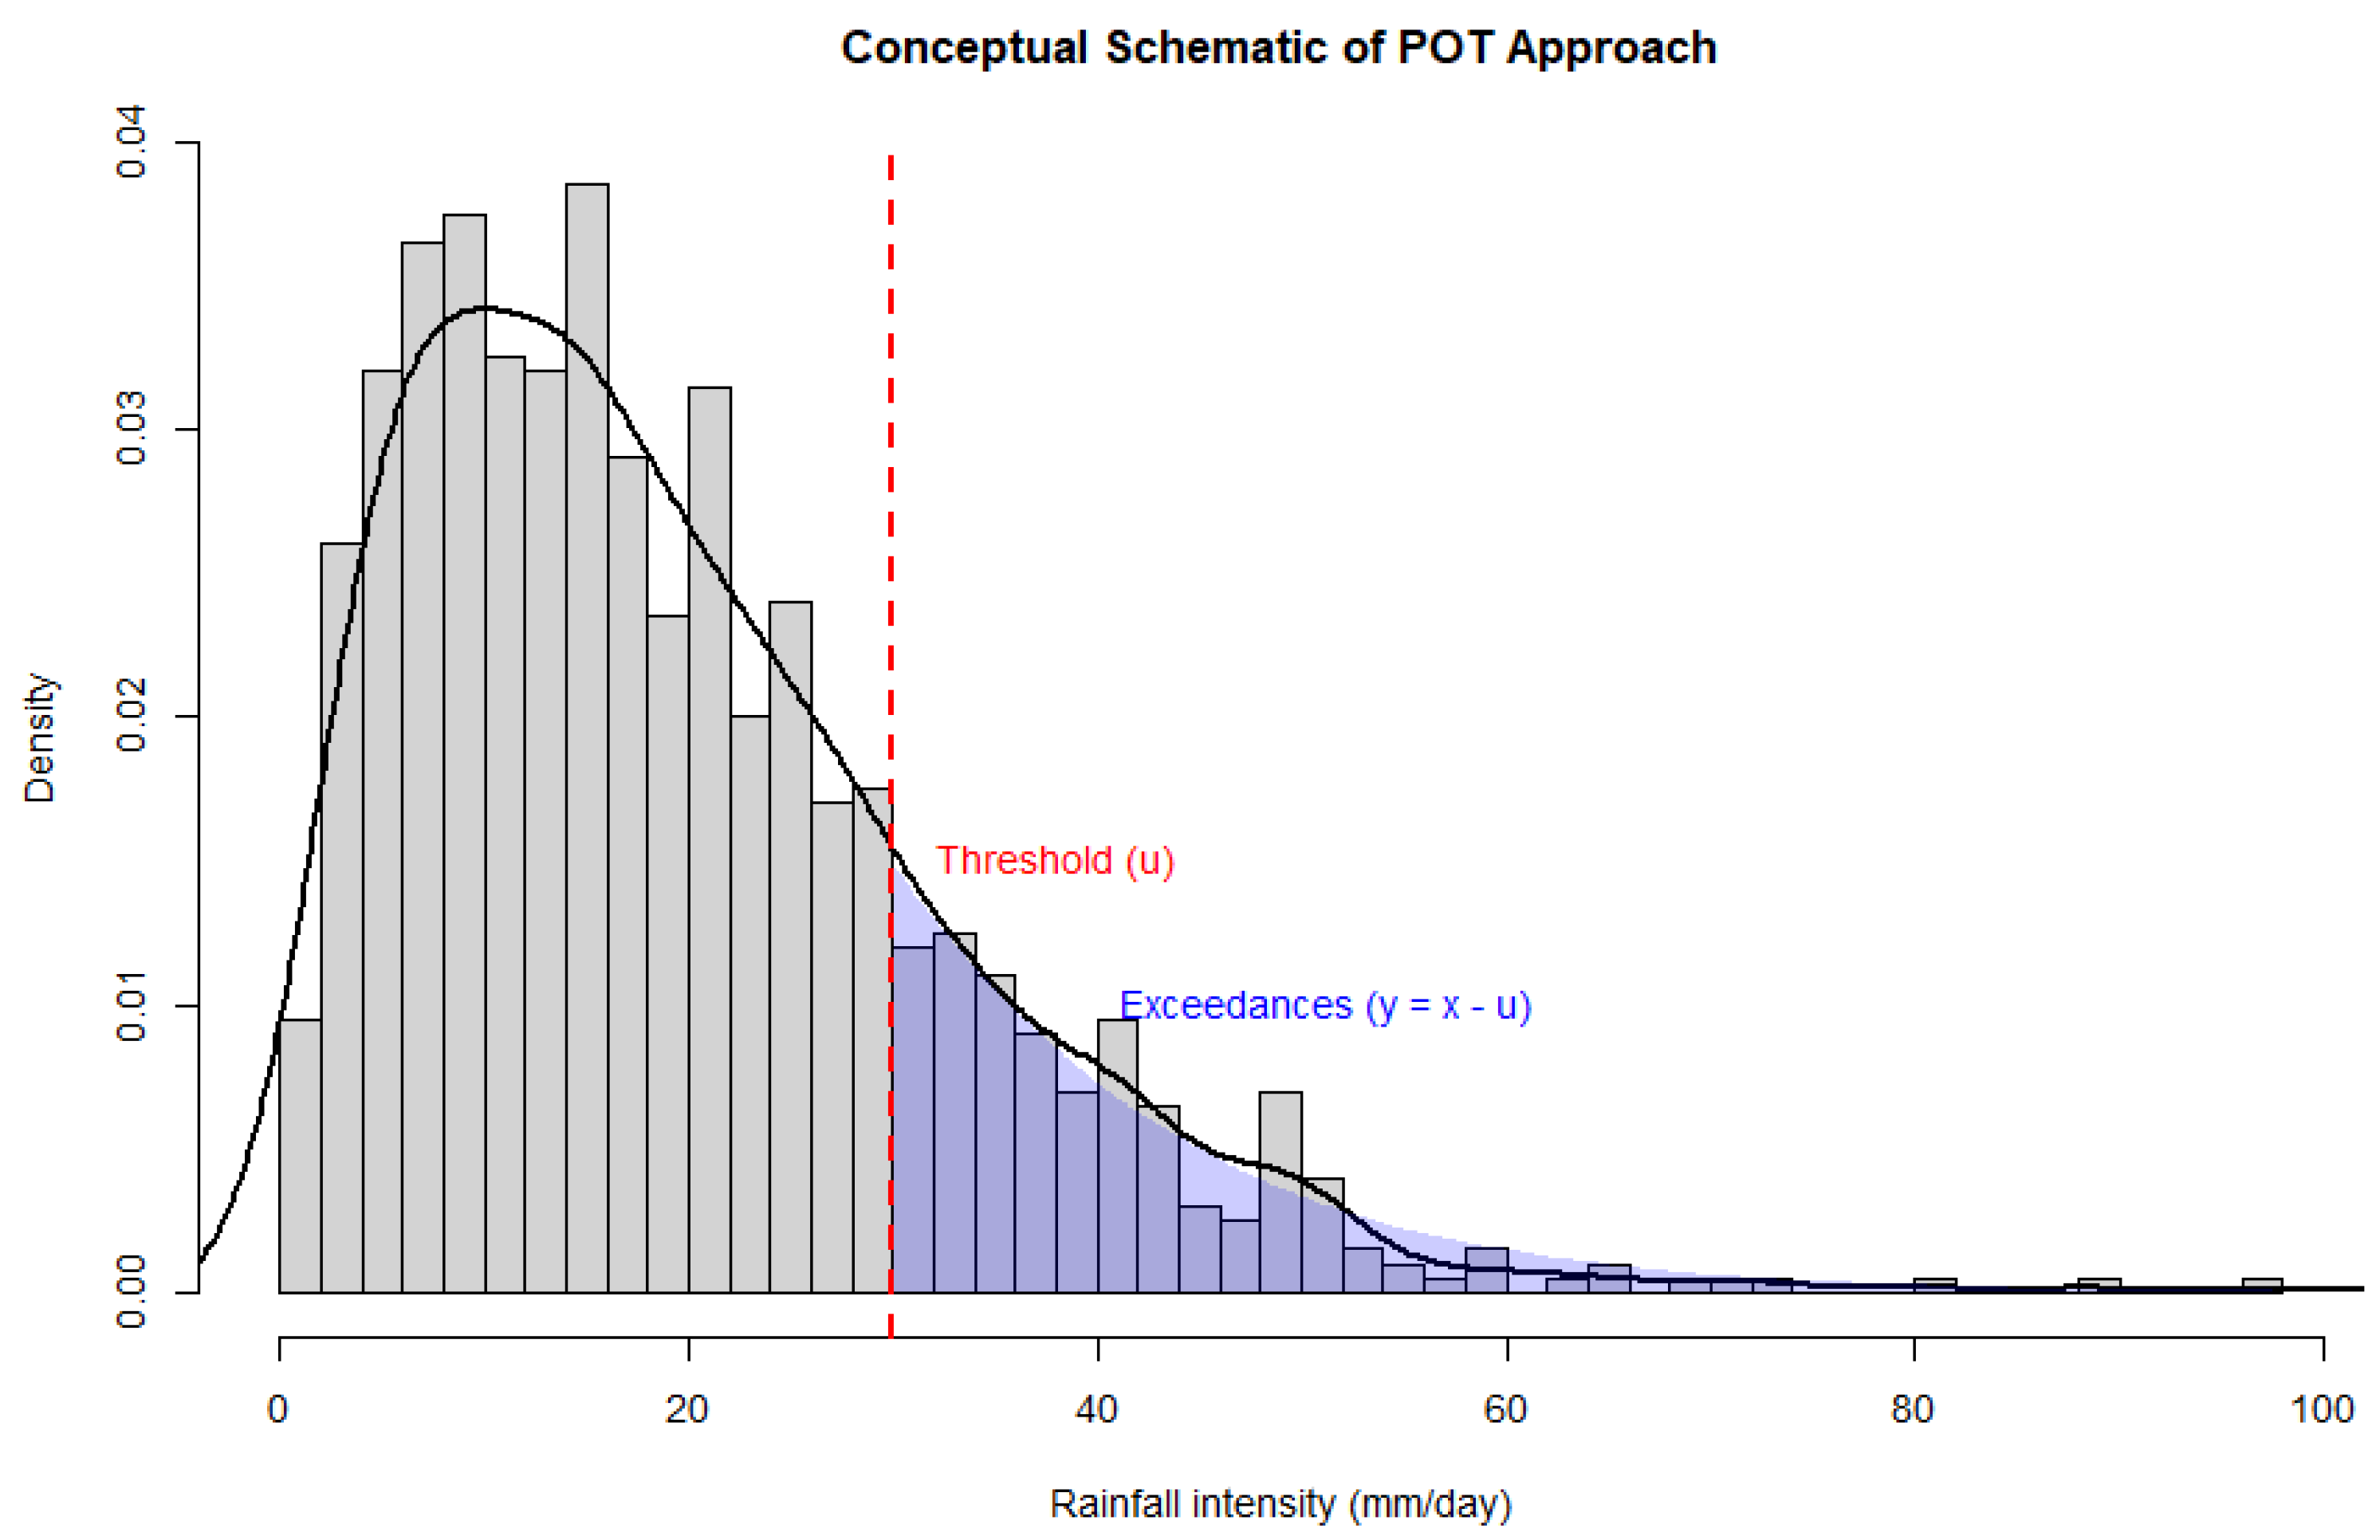
2.5. Extreme Value Theory: Peaks over Threshold (POT) Model
- -
- ξ < 0 → light-tailed (bounded) distribution, implying an upper limit to rainfall intensity;
- -
- ξ = 0 → exponential (medium-tailed) distribution, corresponding to a rapid decay of probability for extreme events;
- -
- ξ > 0 → heavy-tailed distribution, suggesting a higher probability of rare but very intense rainfall, often associated with convective or tropical moisture-driven systems.
2.6. Software and Data Analysis
3. Results
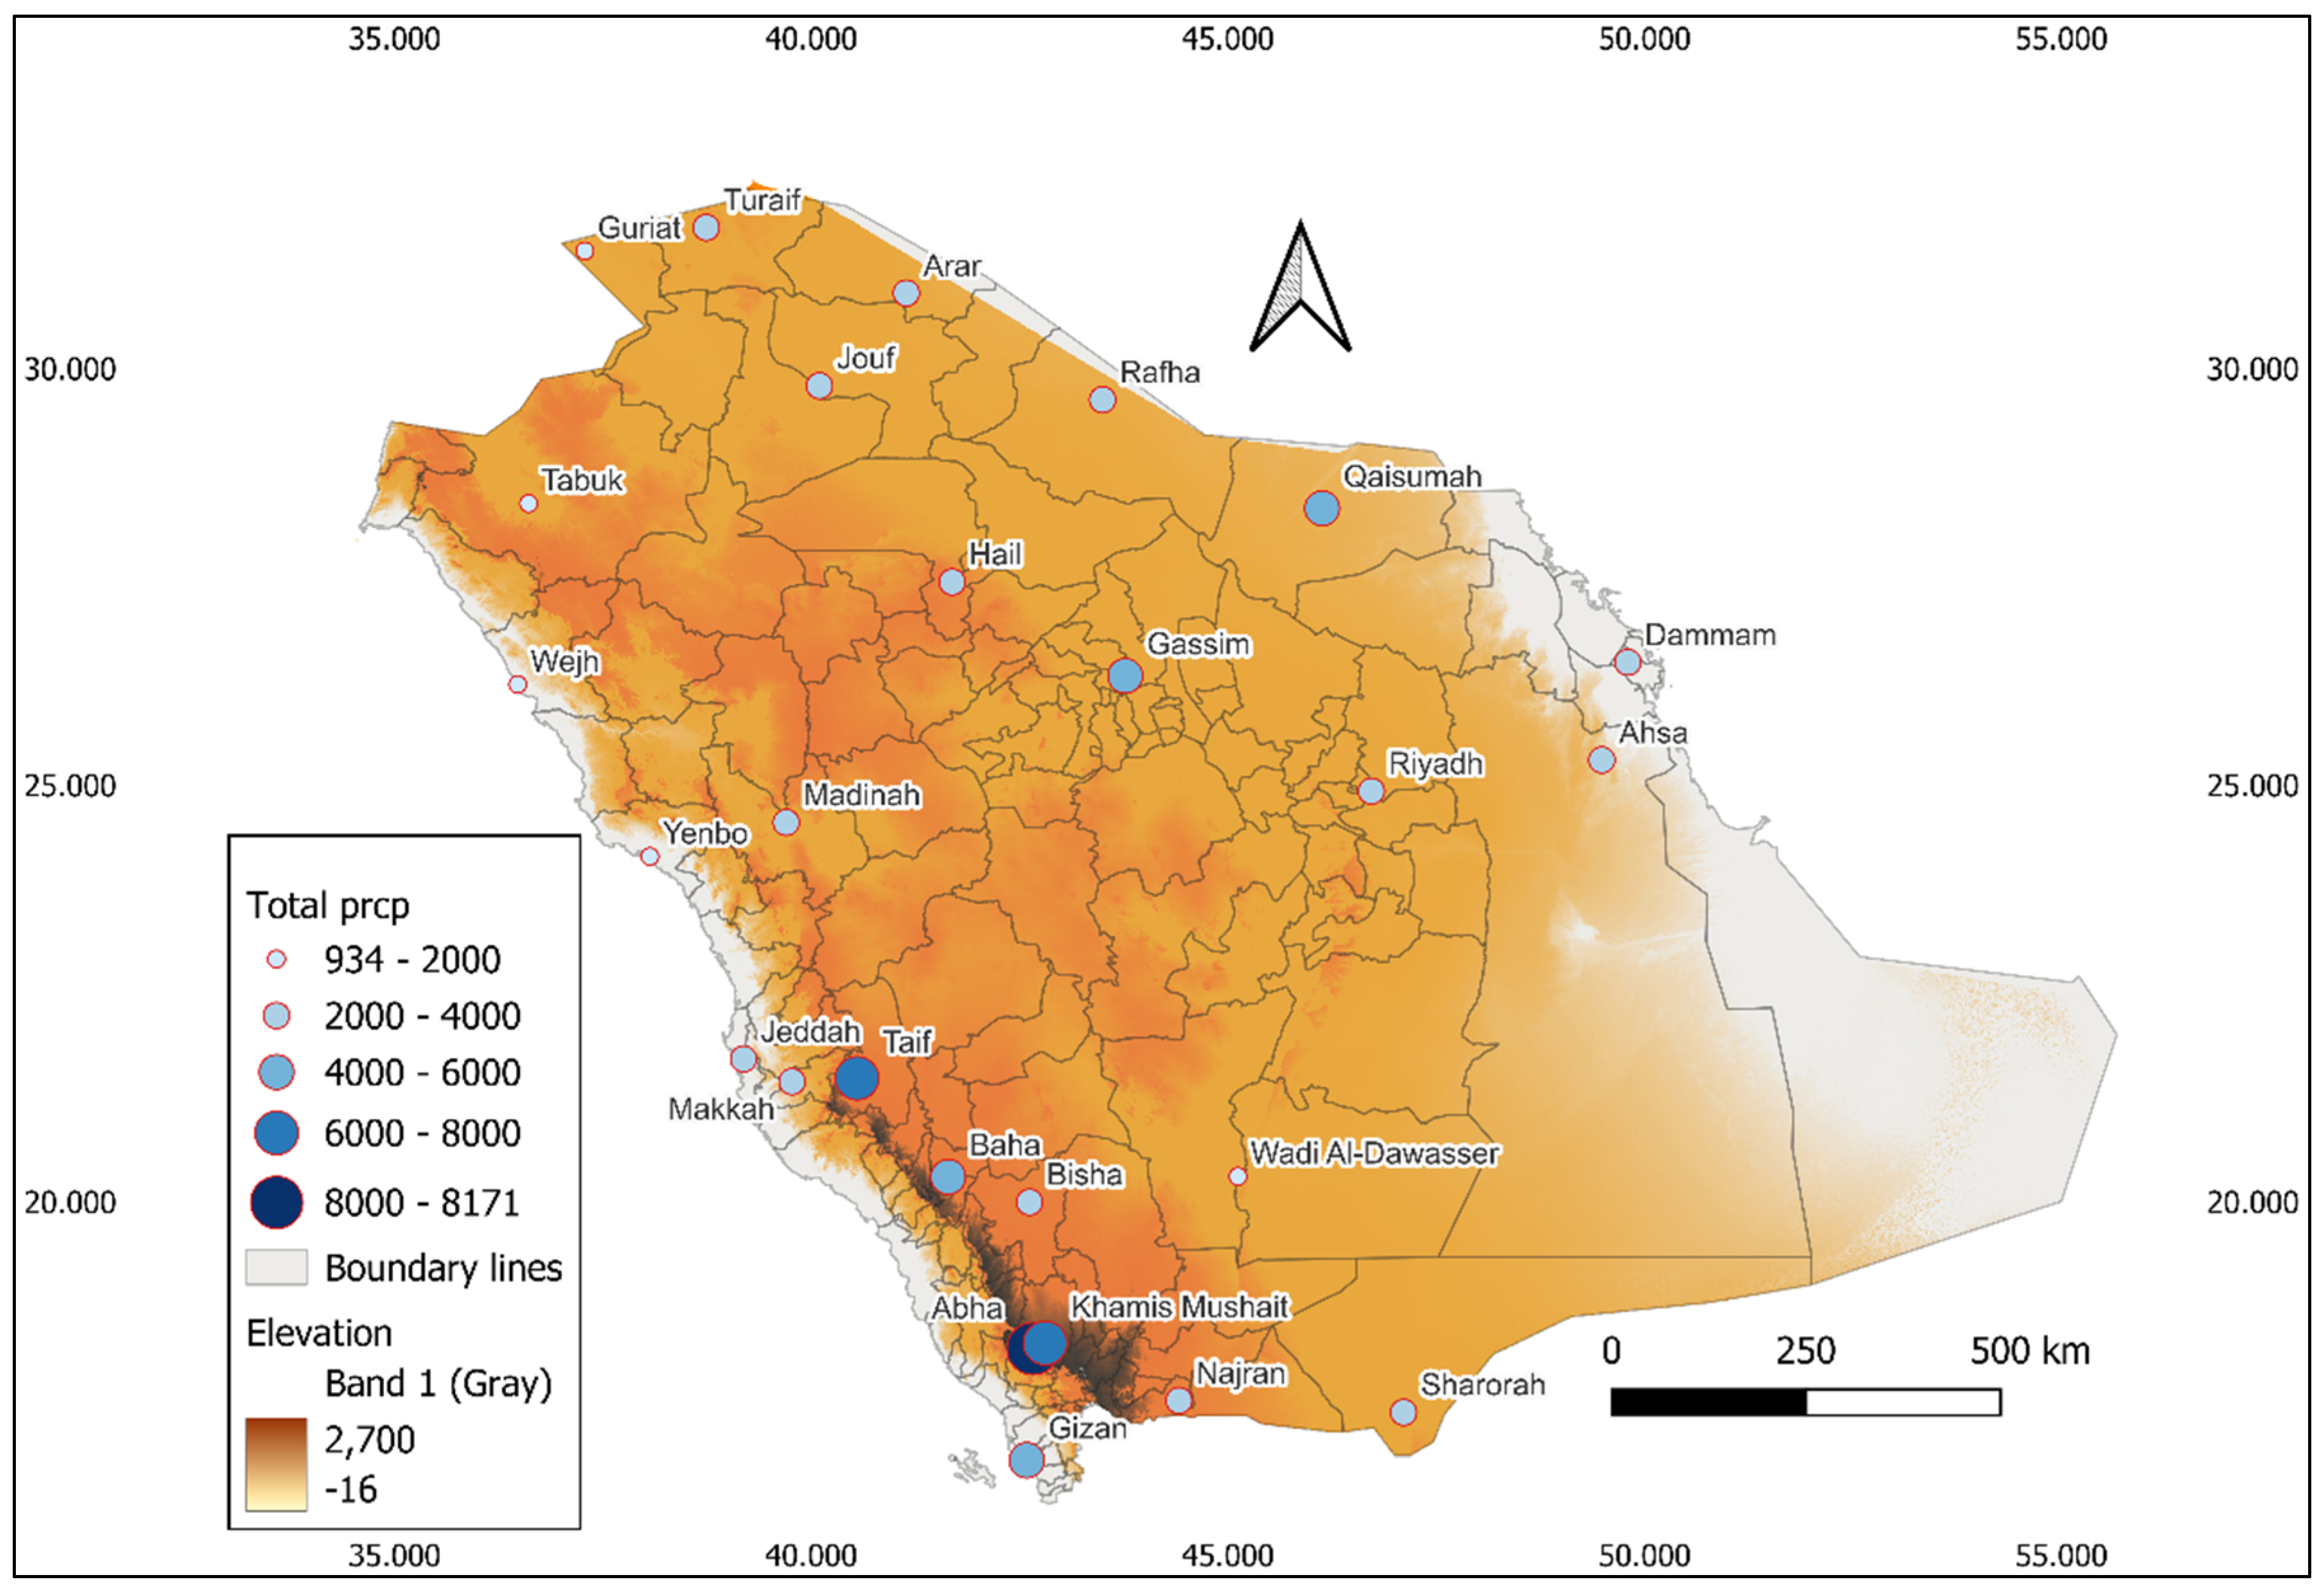
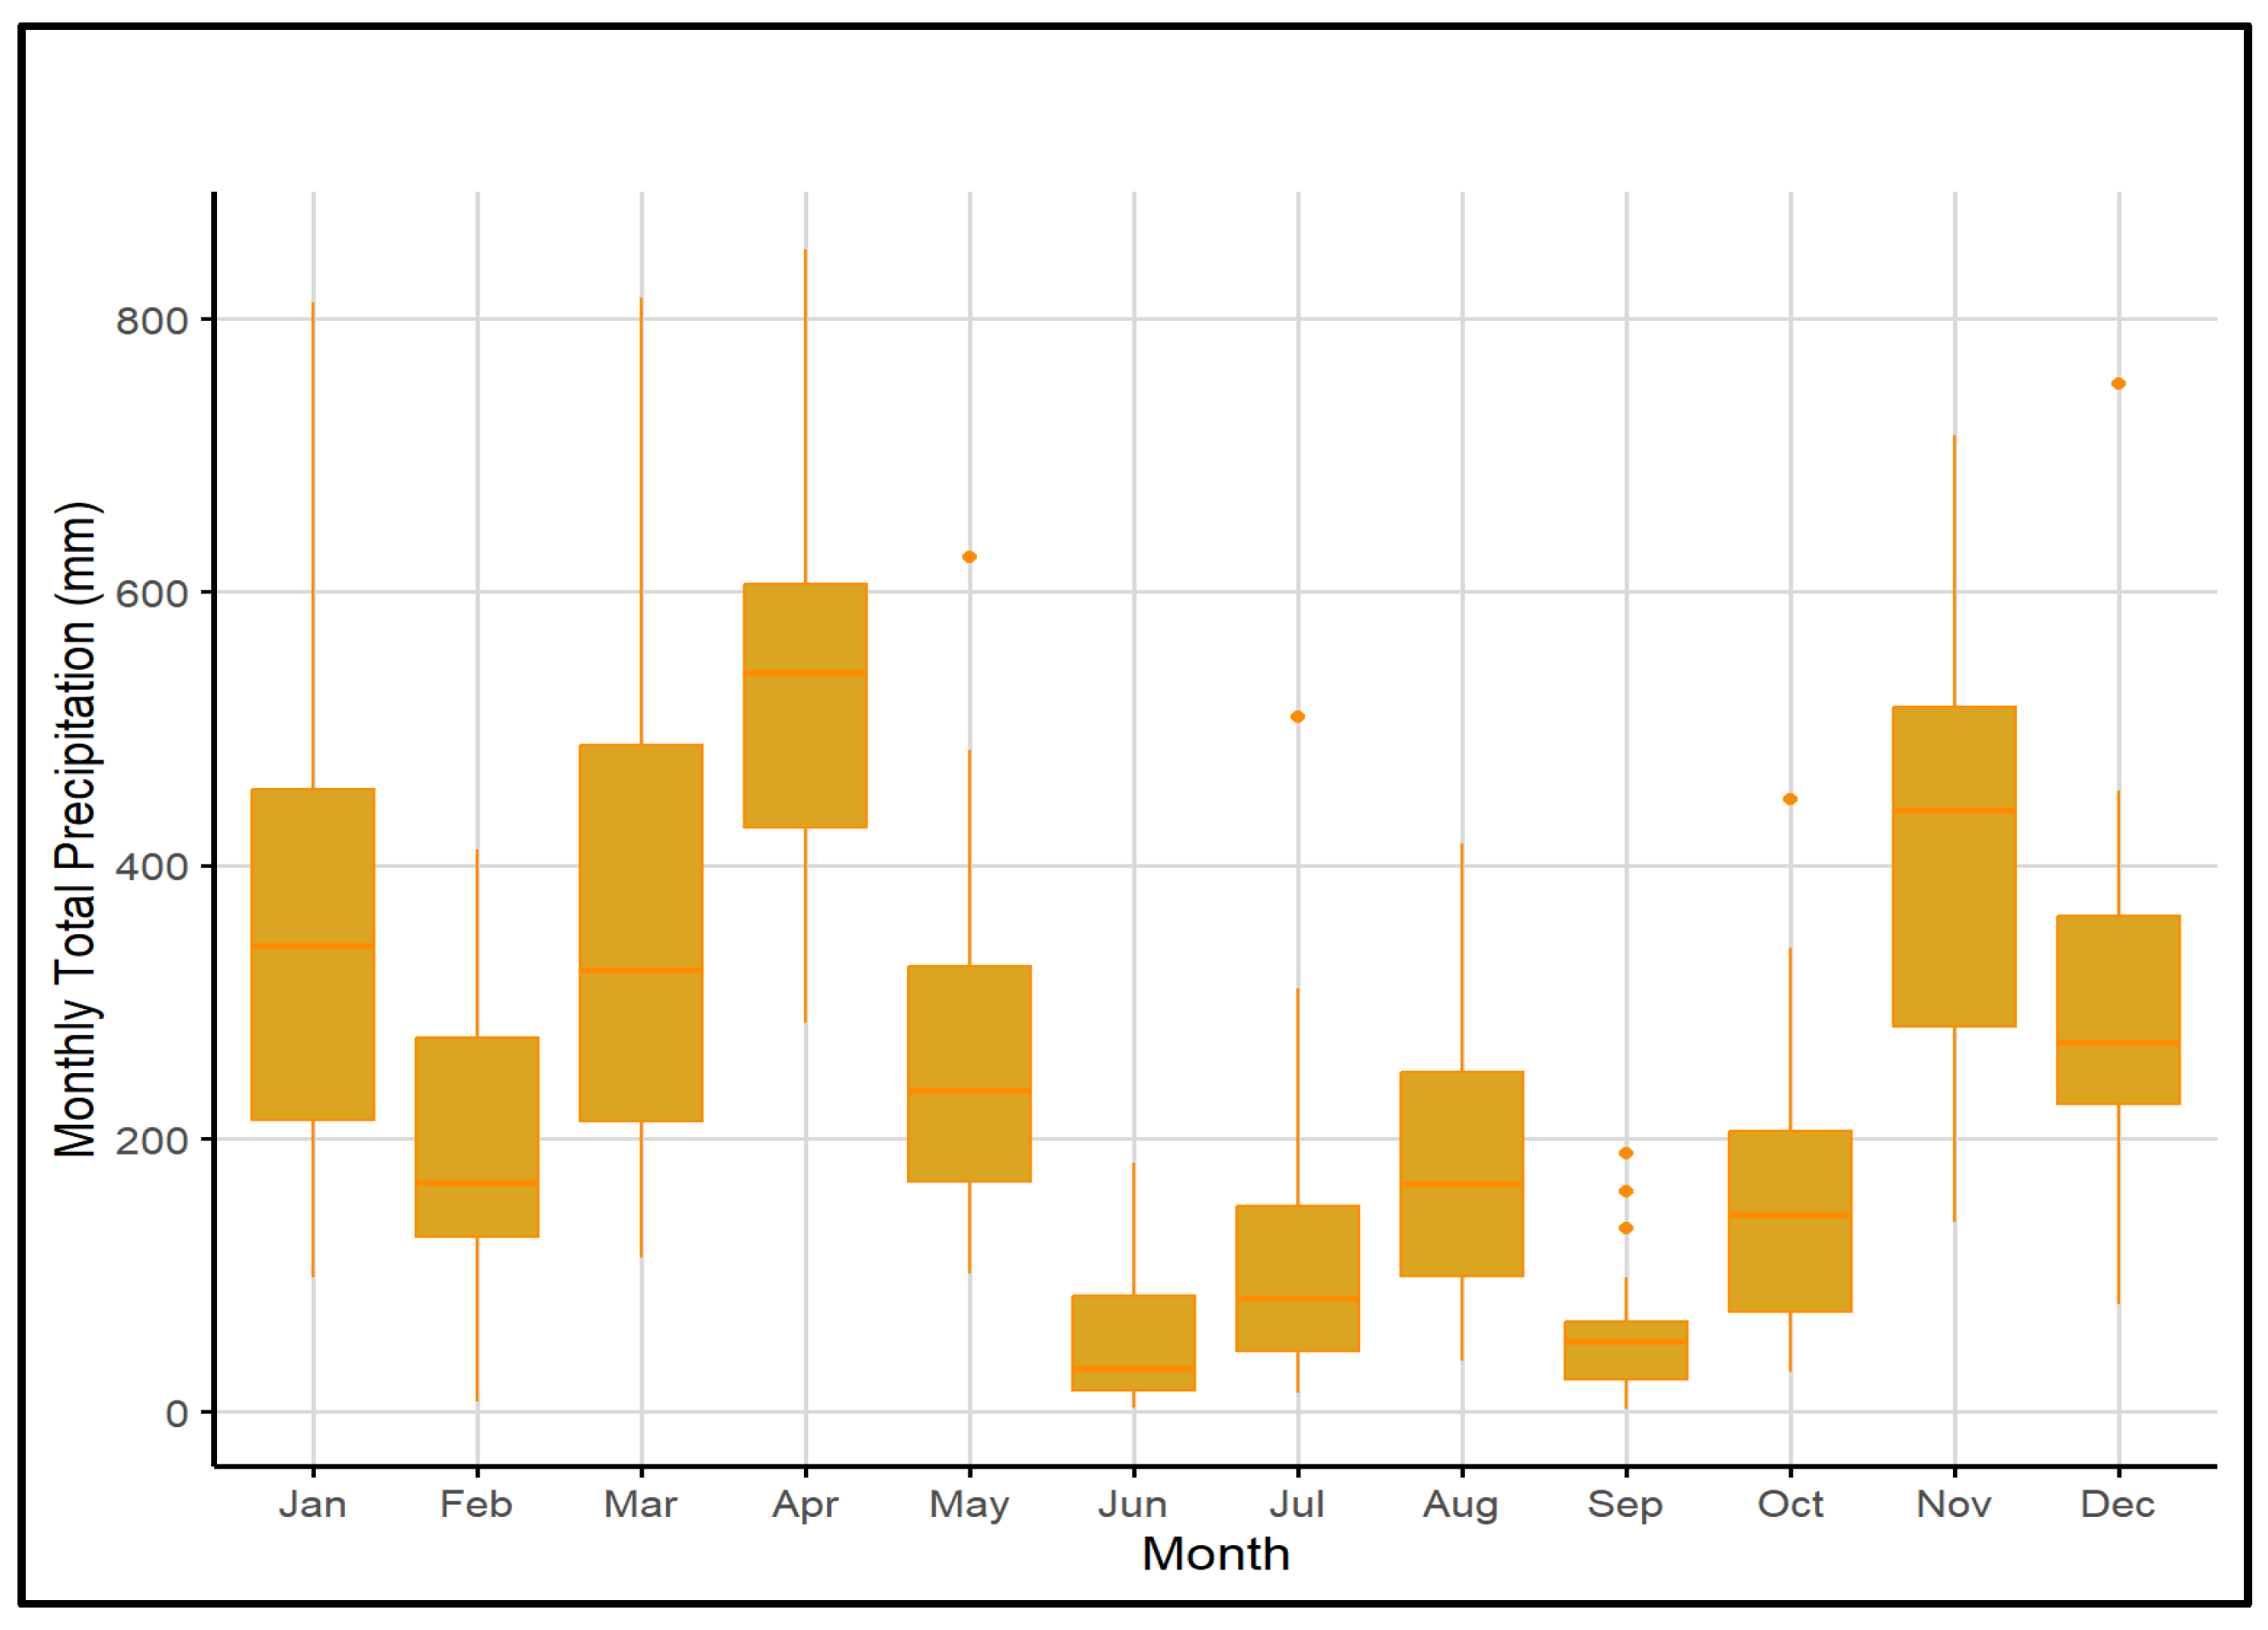
3.1. Rainfall Spatial Variability
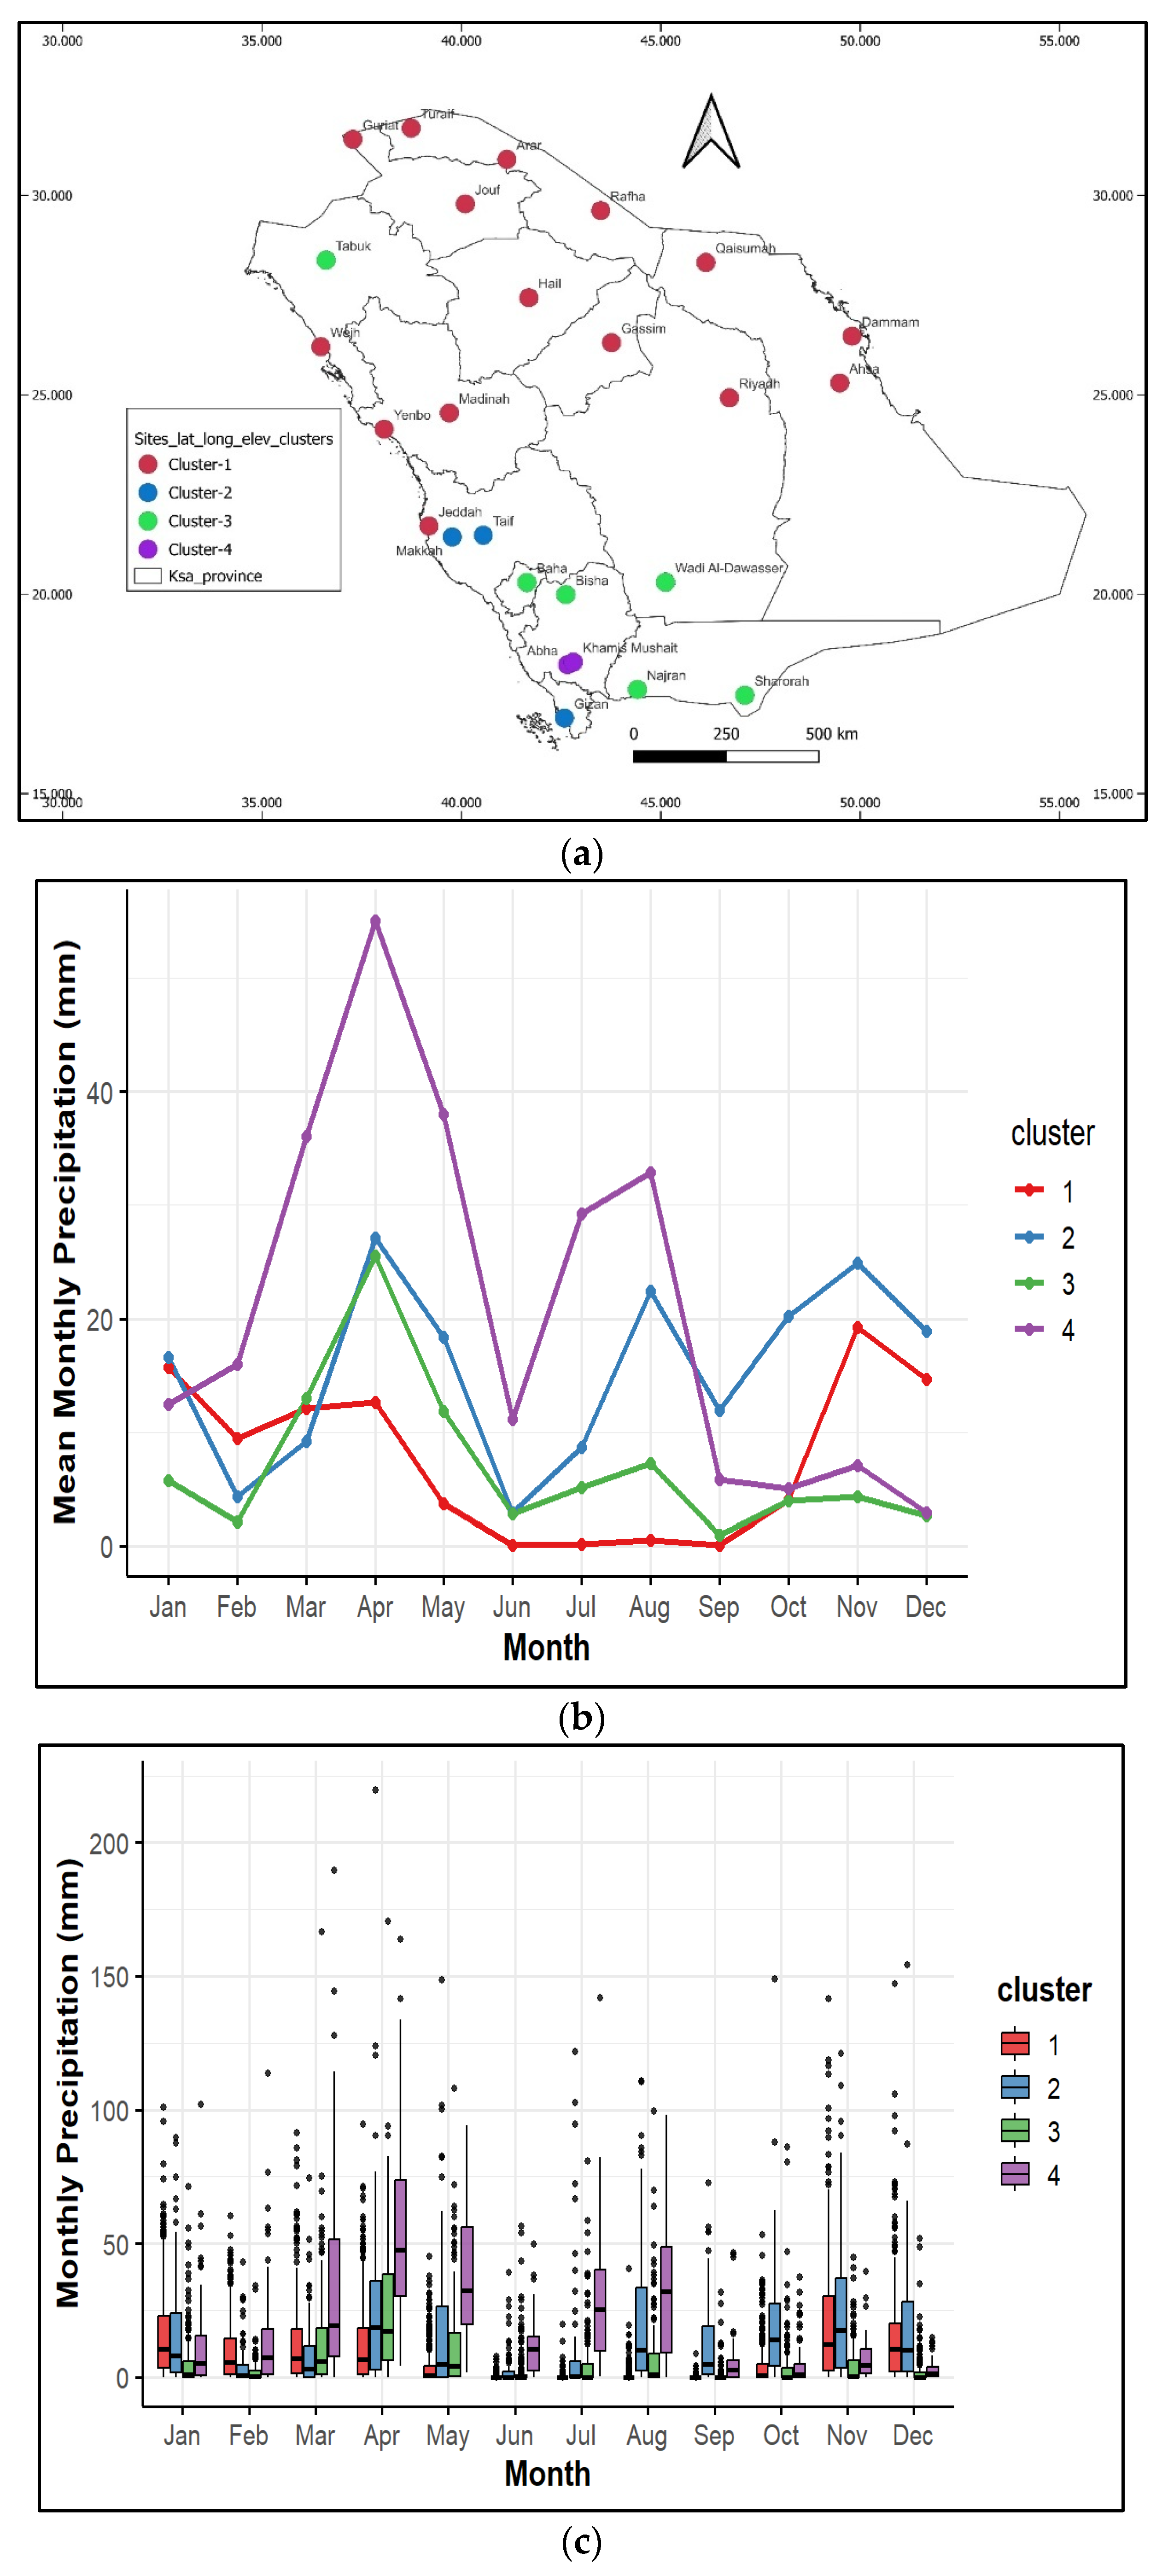
3.2. Annual Rainfall Cycle and K-Means Clustering Analysis
3.3. Long-Term Trends in Rainfall Using Mann–Kendall Test
3.4. Extreme Values Theory (EVT) for Determining Extreme Rainfall Events
4. Discussion
4.1. Regional and Global Context of Rainfall Trends
4.2. Comparison with Previous EVT-Based Rainfall Studies
4.3. Methodological and Practical Implications
5. Conclusions
Author Contributions
Funding
Data Availability Statement
Acknowledgments
Conflicts of Interest
References
- Islam, M.N.; Zamreeq, A.O.; Ismail, M.; Habeebullah, T.M.A.; Ghulam, A.S. Jazan Rainfall’s Seasonal Shift in Saudi Arabia: Evidence of a Changing Regional Climate. Atmosphere 2025, 16, 300. [Google Scholar] [CrossRef]
- IPCC. Climate Change: The Physical Science Basis. Contribution of Working Group I to the Fifth Assessment Report of the Intergovernmental Panel on Climate Change; Cambridge University Press: Cambridge, UK, 2013. [Google Scholar]
- Katz, R.W.; Brown, B. Extreme Events in a Changing Climate: Variability Is More Important Than Averages. Clim. Change 1992, 21, 289–302. [Google Scholar] [CrossRef]
- Almazroui, M. Rainfall Trends and Extremes in Saudi Arabia in Recent Decades. Atmosphere 2020, 11, 964. [Google Scholar] [CrossRef]
- Saharwardi, M.S.; Dasari, H.P.; Gandham, H.; Ashok, K.; Hoteit, I. Spatiotemporal Variability of Hydro-Meteorological Droughts over the Arabian Peninsula and Associated Mechanisms. Sci. Rep. 2024, 14, 20296. [Google Scholar] [CrossRef]
- Kaniewski, D.; Van Campo, E.; Weiss, H. Drought Is a Recurring Challenge in the Middle East. Proc. Natl. Acad. Sci. USA 2012, 109, 3862–3867. [Google Scholar] [CrossRef]
- Petraglia, M.D.; Groucutt, H.S.; Guagnin, M.; Breeze, P.S.; Boivin, N. Human Responses to Climate and Ecosystem Change in Ancient Arabia. Proc. Natl. Acad. Sci. USA 2020, 117, 8263–8270. [Google Scholar] [CrossRef]
- Almazroui, M. Assessment of Meteorological Droughts over Saudi Arabia Using Surface Rainfall Observations during the Period 1978–2017. Arab. J. Geosci. 2019, 12, 694. [Google Scholar] [CrossRef]
- Fleitmann, D.; Mudelsee, M.; Burns, S.J.; Kramers, J.; Neff, U.; Mangini, A.; Matter, A. Droughts and Societal Change: The Environmental Context for the Emergence of Islam in Late Antique Arabia. Science 2022, 376, 1317–1321. [Google Scholar] [CrossRef] [PubMed]
- Syed, F.S.; Adnan, S.; Zamreeq, A.; Ghulam, A. Identification of Droughts over Saudi Arabia and Global Teleconnections. Nat. Hazards 2022, 112, 2717–2737. [Google Scholar] [CrossRef]
- Ajjur, S.B.; Al-Ghamdi, S.G. Seventy-Year Disruption of Seasons Characteristics in the Arabian Peninsula. Int. J. Climatol. 2021, 41, 5920–5937. [Google Scholar] [CrossRef]
- Amin, T.M.; Mahmoud, S.H.; Alazba, A.A. Observations, Projections and Impacts of Climate Change on Water Resources in Arabian Peninsula: Current and Future Scenarios. Environ. Earth Sci. 2016, 75, 864. [Google Scholar] [CrossRef]
- Donat, M.G.; Alexander, L.V.; Yang, H.; Durre, I.; Vose, R.; Caesar, J. Changes in Extreme Temperature and Precipitation in the Arab Region: Long-Term Trends and Variability Related to ENSO and NAO. Int. J. Climatol. 2014, 34, 581–592. [Google Scholar] [CrossRef]
- Hasanean, H.; Almazroui, M. Rainfall: Features and Variations over Saudi Arabia—A Review. Climate 2015, 3, 578–626. [Google Scholar] [CrossRef]
- Chowdhury, S.; Al-Zahrani, M. Implications of Climate Change on Water Resources in Saudi Arabia. Arab. J. Sci. Eng. 2013, 38, 1959–1971. [Google Scholar] [CrossRef]
- Almazroui, M.; Saeed, S. Contribution of Extreme Daily Precipitation to Total Rainfall over the Arabian Peninsula. Atmos. Res. 2020, 231, 104672. [Google Scholar] [CrossRef]
- Munir, S.; Kamil, S.; Habeebullah, T.M.; Zaidi, S.; Alhajji, Z.; Siddiqui, M.H. Drought Variabilities in Saudi Arabia: Unveiling Spatiotemporal Trends through Observations and Projections. Earth Syst. Environ. 2025, 9, 563–587. [Google Scholar] [CrossRef]
- ElKenawy, A.M.; McCabe, M.F. A Multi-Decadal Assessment of the Performance of Gauge- and Model-Based Rainfall Products over Saudi Arabia: Climatology, Anomalies and Trends. Int. J. Climatol. 2016, 36, 656–674. [Google Scholar] [CrossRef]
- Almazroui, M.; Islam, M.N. Coupled Model Inter-comparison Project Database to Calculate Drought Indices for Saudi Arabia: A Preliminary Assessment. Earth Syst. Environ. 2019, 3, 419–428. [Google Scholar] [CrossRef]
- Martius, O.; Sodemann, H.; Joos, H.; Pfahl, S.; Winschall, A.; Croci-Maspoli, M.; Graf, H.-F.; Sprenger, M.; Schwierz, C. The Role of Upper-Level Dynamics and Surface Processes for the Pakistan Flood of July 2010. Q. J. R. Meteorol. Soc. 2013, 139, 1780–1797. [Google Scholar] [CrossRef]
- Almazroui, M. The Life Cycle of Extreme Rainfall Events over Western Saudi Arabia Simulated by a Regional Climate Model: Case Study of November 1996. Atmósfera 2012, 25, 23–41. [Google Scholar]
- Almazroui, M.; Islam, M.N.; Athar, H.; Jones, P.D.; Rahman, M.A. Recent Climate Change in the Arabian Peninsula: Annual Rainfall and Temperature Analysis of Saudi Arabia for 1978–2009. Int. J. Climatol. 2012, 32, 953–966. [Google Scholar] [CrossRef]
- Alexandersson, H. A homogeneity test applied to precipitation data. J. Climatol. 1986, 6, 661–675. [Google Scholar] [CrossRef]
- Khaliq, M.N.; Ouarda, T.B.M.J. On the critical values of the standard normal homogeneity test (SNHT). Int. J. Climatol. 2007, 27, 681–687. [Google Scholar] [CrossRef]
- Toreti, A.; Kuglitsch, F.G.; Xoplaki, E.; Della-Marta, P.M.; Aguilar, E.; Prohom, M.; Luterbacher, J. A note on the use of the standard normal homogeneity test (SNHT) to detect inhomogeneities in climatic time series. Int. J. Climatol. 2010, 31, 630–632. [Google Scholar] [CrossRef]
- Mann, H.B. Nonparametric tests against trend. Econometrica 1945, 13, 245–259. [Google Scholar] [CrossRef]
- Kendall, M.G. Rank Correlation Methods, 4th ed.; Charles Griffin: London, UK, 1975. [Google Scholar]
- MacQueen, J. Some Methods for Classification and Analysis of Multivariate Observations. In Proceedings of the Fifth Berkeley Symposium on Mathematical Statistics and Probability, Berkeley, CA, USA, 21 June–18 July 1965; University of California Press: Berkeley, CA, USA, 1967; Volume 1, pp. 281–297. [Google Scholar]
- Coles, S. An Introduction to Statistical Modeling of Extreme Values; Springer Series in Statistics; Springer: London, UK, 2001. [Google Scholar]
- Davison, A.C.; Smith, R.L. Models for Exceedances over High Thresholds. J. R. Stat. Soc. Ser. B Stat. Methodol. 1990, 52, 393–442. [Google Scholar] [CrossRef]
- Pickands, J. Statistical inference using extreme order statistics. Ann. Stat. 1975, 3, 119–131. [Google Scholar] [CrossRef]
- Gilleland, E.; Katz, R.W. extRemes 2.0: An Extreme Value Analysis Package in R. J. Stat. Softw. 2016, 72, 1–39. [Google Scholar] [CrossRef]
- R Core Team. R: A Language and Environment for Statistical Computing; R Foundation for Statistical Computing: Vienna, Austria, 2023; Available online: https://www.R-project.org/ (accessed on 2 May 2025).
- McLeod, A.I. Kendall: Kendall Rank Correlation and Mann-Kendall Trend Test, R Package Version 2.2.1; R Foundation for Statistical Computing: Vienna, Austria, 2022; Available online: https://CRAN.R-project.org/package=Kendall (accessed on 3 June 2025).
- Wickham, H. ggplot2: Elegant Graphics for Data Analysis; Springer: New York, NY, USA, 2016; Available online: https://cran.r-project.org/web/packages/ggplot2/ (accessed on 3 June 2025).
- Wickham, H.; François, R.; Henry, L.; Müller, K.; Vaughan, D. dplyr: A Grammar of Data Manipulation, R Package Version 1.1.4; Posit PBC: Boston, MA, USA, 2023; Available online: https://CRAN.R-project.org/package=dplyr (accessed on 23 August 2025).
- Wickham, H.; Hester, J.; Bryan, J. readr: Read Rectangular Text Data, R Package Version 2.1.5; CRAN: Detroit, MI, USA, 2024; Available online: https://CRAN.R-project.org/package=readr (accessed on 23 August 2025).
- Grolemund, G.; Wickham, H. Dates and Times Made Easy with lubridate. J. Stat. Softw. 2011, 40, 1–25. Available online: https://www.jstatsoft.org/v40/i03/ (accessed on 23 August 2025). [CrossRef]
- Yue, S.; Pilon, P.; Cavadias, G. Power of the Mann–Kendall and Spearman’s Rho Tests for Detecting Monotonic Trends in Hydrological Series. J. Hydrol. 2002, 259, 254–271. [Google Scholar] [CrossRef]
- García, J.A.; Gallego, M.C.; Serrano, A.; Vaquero, J.M. Trends in block-seasonal extreme rainfall over the Iberian Peninsula in the second half of the twentieth century. J. Clim. 2007, 20, 113–120. [Google Scholar] [CrossRef]
- Gallego, M.C.; Trigo, R.M.; Vaquero, J.M.; Brunet, M.; García, J.A.; Sigró, J.; Valente, M.A. Trends in frequency indices of daily precipitation over the Iberian Peninsula during the last century. J. Geophys. Res. Atmos. 2011, 116, D02109. [Google Scholar] [CrossRef]
- Asikoglu, O.L.; Ciftlik, D. Recent Rainfall Trends in the Aegean Region of Turkey. J. Hydrometeorol. 2015, 16, 1873–1885. [Google Scholar] [CrossRef]
- Zhang, Y.; Ren, Y.; Ren, G.; Wang, G. Precipitation trends over mainland China from 1961–2016 after removal of measurement biases. J. Geophys. Res. Atmos. 2020, 125, e2019JD031728. [Google Scholar] [CrossRef]
- Haylock, M.R.; Peterson, T.C.; Alves, L.M.; Ambrizzi, T.; Anunciação, Y.M.T.; Baez, J.; Vincent, L. Trends in total and extreme South American rainfall in 1960–2000 and links with sea surface temperature. J. Clim. 2006, 19, 1490–1512. [Google Scholar] [CrossRef]
- Nazeri Tahroudi, M. Comprehensive global assessment of precipitation trend and pattern variability considering their distribution dynamics. Sci. Rep. 2025, 15, 22458. [Google Scholar] [CrossRef] [PubMed]
- Liu, P.; Washington, W.M.; Meehl, G.A.; Wu, G.; Potter, G.L. Historical and future trends of the Sahara Desert. Geophys. Res. Lett. 2001, 28, 239–242. [Google Scholar] [CrossRef]
- Biasutti, M. Rainfall Trends in the African Sahel: Characteristics, Processes, and Causes. WIREs Clim. Change 2019, 10, e591. [Google Scholar] [CrossRef]
- Acero, F.J.; García, J.A.; Gallego, M.C. Peaks-over-Threshold Study of Trends in Extreme Rainfall over the Iberian Peninsula. J. Clim. 2011, 24, 1089–1105. [Google Scholar] [CrossRef]
- Singirankabo, E.; Iyamuremye, E. Modelling Extreme Rainfall Events in Kigali City Using Generalized Pareto Distribution. Meteorol. Appl. 2022, 29, e2076. [Google Scholar] [CrossRef]
- Kołodziejczyk, K.; Rutkowska, A. Estimation of the Peak over Threshold-Based Design Rainfall and Its Spatial Variability in the Upper Vistula River Basin, Poland. Water 2023, 15, 1316. [Google Scholar] [CrossRef]
- Phoophiwfa, T.; Chomphuwiset, P.; Prahadchai, T.; Park, J.-S.; Apichottanakul, A.; Theppang, W.; Busababodhin, P. Employing the Generalized Pareto Distribution to Analyze Extreme Rainfall Events on Consecutive Rainy Days in Thailand’s Chi Watershed: Implications for Flood Management. Hydrol. Earth Syst. Sci. 2024, 28, 801–816. [Google Scholar] [CrossRef]
- Garba, I.; Abdourahamane, Z.S. Extreme rainfall characterisation under climate change and rapid population growth in the city of Niamey, Niger. Heliyon 2023, 9, e13326. [Google Scholar] [CrossRef] [PubMed]
- Kim, W.M.; Blender, R.; Sigl, M.; Messmer, M.; Raible, C.C. Statistical characteristics of extreme daily precipitation during 1501 BCE–1849 CE in the Community Earth System Model. Clim. Past 2021, 17, 2031–2053. [Google Scholar] [CrossRef]
- Vicente-Serrano, S.M.; Beguería, S.; Reig, F.; Royo, A.; Arretxea, M.; Gil, M.; Latorre, B.; El Kenawy, A.; Franquesa, A.; Halifa-Marin, A.; et al. Developing science-informed maps and climate service for extreme rainfall in Spain. Nat. Hazards 2025, 1–22. [Google Scholar] [CrossRef]
- Latif, M.; Syed, F.S.; Hannachi, A. Rainfall trends in the South Asian summer monsoon and its related large-scale dynamics with focus over Pakistan. Clim. Dyn. 2017, 48, 3565–3581. [Google Scholar] [CrossRef]
- Elfeki, A.; Bahrawi, J.; Latif, M.; Hannachi, A. Spatiotemporal analysis of monthly rainfall over Saudi Arabia and global teleconnections. Geomat. Nat. Hazards Risk 2022, 13, 2618–2648. [Google Scholar] [CrossRef]






| Station | Snht_Value | Break_Index | Break_Year |
|---|---|---|---|
| Abha | 9.58 | 15 | 1999 |
| Al-Ahsa | 3.83 | 14 | 1998 |
| Al-Baha | 5.38 | 19 | 2003 |
| Al-Jouf | 10.02 | 34 | 2018 |
| Al-Qaysumah | 4.47 | 23 | 2007 |
| Arar | 17.56 | 34 | 2018 |
| Bisha | 4.79 | 16 | 2000 |
| Dammam | 3.09 | 21 | 2020 |
| Gassim | 4.90 | 22 | 2006 |
| Gizan | 11.94 | 35 | 2019 |
| Guriat | 4.18 | 30 | 2014 |
| Hail | 10.16 | 19 | 2003 |
| Jeddah | 2.25 | 8 | 1992 |
| Khamis-Mushait | 5.74 | 15 | 1999 |
| Madina | 2.69 | 37 | 2021 |
| Makkah | 8.06 | 34 | 2018 |
| Najran | 2.98 | 12 | 1996 |
| Rafha | 6.88 | 17 | 2001 |
| Riyadh | 8.09 | 14 | 1998 |
| Sharurah | 4.74 | 25 | 2009 |
| Tabuk | 6.85 | 6 | 1990 |
| Taif | 8.55 | 15 | 1999 |
| Turaif | 2.74 | 34 | 2018 |
| Wadi-Aldawasser | 5.63 | 6 | 1990 |
| Wejh | 1.11 | 25 | 2009 |
| Yenbo | 3.40 | 7 | 1991 |
| Names | Latitude (°N) | Longitude (°E) | Elevation (m) | Precipitation (Annual Climatology, mm) |
|---|---|---|---|---|
| Abha | 18.2330 | 42.6608 | 2093.35 | 209.50 |
| Ahsa | 25.2980 | 49.4863 | 178.17 | 83.77 |
| Arar | 30.9022 | 41.1405 | 548.88 | 63.57 |
| Baha | 20.2947 | 41.6430 | 1651.88 | 132.24 |
| Bisha | 19.9911 | 42.6191 | 1161.97 | 81.45 |
| Dammam | 26.4711 | 49.7979 | 12.00 | 52.49 |
| Gassim | 26.3077 | 43.7675 | 646.71 | 123.45 |
| Jazan | 16.8969 | 42.5847 | 7.24 | 151.64 |
| Guriat | 31.4075 | 37.2822 | 503.90 | 49.68 |
| Hail | 27.4344 | 41.6911 | 1001.52 | 85.71 |
| Jeddah | 21.7102 | 39.1866 | 16.88 | 58.26 |
| Jouf | 29.7886 | 40.0986 | 668.74 | 62.15 |
| K-Mushait | 18.2994 | 42.8063 | 2055.93 | 184.59 |
| Madinah | 24.5480 | 39.6986 | 635.60 | 63.48 |
| Makkah | 21.4377 | 39.7688 | 240.35 | 85.56 |
| Najran | 17.6113 | 44.4136 | 1212.33 | 68.29 |
| Al-Qaysumah | 28.3188 | 46.1302 | 357.60 | 111.12 |
| Rafha | 29.6213 | 43.4947 | 444.10 | 79.04 |
| Riyadh | 24.9252 | 46.7219 | 613.55 | 102.30 |
| Sharorah | 17.4677 | 47.1080 | 724.65 | 58.89 |
| Tabuk | 28.3763 | 36.6069 | 768.11 | 33.26 |
| Taif | 21.4788 | 40.5488 | 1452.75 | 173.18 |
| Turaif | 31.6877 | 38.7394 | 852.44 | 76.26 |
| W.Aldawasser | 20.3000 | 45.1200 | 622.00 | 23.94 |
| Wejh | 26.2052 | 36.4769 | 23.73 | 33.65 |
| Yenbo | 24.1400 | 38.0638 | 10.40 | 37.65 |
| Sites | Max | Mean | Median | Minimum | Q1 | Q3 | Total |
|---|---|---|---|---|---|---|---|
| Abha | −0.045 | −0.190 + | −0.045 | −0.175 | −0.131 | −0.177 | −0.190 + |
| Al-Ahsa | −0.085 | −0.015 | 0.136 | - | - | −0.009 | −0.015 |
| Al-Baha | −0.116 | −0.158 | −0.116 | - | 0.003 | −0.142 | −0.158 |
| Al-Jouf | −0.015 | 0.004 | 0.058 | - | 0.038 | −0.026 | 0.004 |
| Qaysumah | −0.107 | −0.198 + | −0.275 * | - | −0.186 | −0.252 * | −0.198 + |
| Arar | 0.077 | 0.031 | 0.111 | - | - | 0.012 | 0.031 |
| Bisha | −0.204 + | −0.179 | −0.053 | - | −0.083 | −0.009 | −0.179 |
| Dammam | −0.152 | −0.138 | 0.242 | - | - | −0.072 | −0.138 |
| Gassim | −0.182 | −0.287 * | −0.219 + | - | −0.043 | −0.350 ** | −0.287 * |
| Jazan | 0.198 + | 0.161 | 0.180 | - | 0.303* | 0.144 | 0.161 |
| Guriat | −0.039 | 0.036 | 0.084 | - | 0.072 | 0.132 | 0.036 |
| Hail | −0.422 ** | −0.393 ** | −0.074 | - | −0.030 | −0.220 + | −0.393 ** |
| Jeddah | 0.082 | 0.061 | 0.339 ** | - | - | 0.121 | 0.061 |
| K-Mushait | −0.055 | −0.128 | −0.204 + | −0.115 | −0.217 + | −0.204 + | −0.128 |
| Madina | −0.054 | −0.136 | −0.225 + | - | −0.043 | −0.082 | −0.136 |
| Makkah | 0.041 | 0.093 | 0.297 * | - | 0.444 ** | 0.081 | 0.093 |
| Najran | 0.112 | 0.131 | 0.051 | - | −0.143 | 0.124 | 0.131 |
| Rafha | −0.139 | −0.139 | −0.170 | - | 0.143 | −0.182 | −0.139 |
| Riyadh | −0.188 + | −0.080 | 0.077 | - | - | −0.058 | −0.080 |
| Sharurah | −0.065 | −0.020 | 0.082 | - | - | 0.106 | −0.020 |
| Tabuk | −0.005 | −0.018 | −0.121 | - | −0.107 | −0.045 | −0.018 |
| Taif | −0.096 | −0.136 | 0.016 | 0.205 | 0.150 | −0.109 | −0.136 |
| Turaif | 0.050 | 0.047 | 0.113 | - | 0.108 | 0.031 | 0.047 |
| W.Aldawasser | −0.027 | −0.091 | 0.122 | - | - | 0.007 | −0.087 |
| Wejh | 0.024 | 0.019 | 0.026 | - | - | −0.057 | 0.019 |
| Yenbo | 0.066 | 0.077 | 0.036 | - | - | 0.012 | 0.077 |
| Station | Threshold | Percentile | RL2 | RL5 | RL10 | RL20 | RL50 | RL100 |
|---|---|---|---|---|---|---|---|---|
| Abha | 27.70 | 97.37 | 43 | 64 | 85 | 111 | 158 | 205 |
| Al-Ahsa | 26.39 | 97.67 | 27 | 36 | 42 | 49 | 60 | 68 |
| Al-Baha | 23.00 | 97.57 | 29 | 43 | 55 | 70 | 95 | 118 |
| Al-Jouf | 18.24 | 97.36 | 18 | 26 | 30 | 32 | 35 | 37 |
| Qaysumah | 23.53 | 97.51 | 29 | 40 | 47 | 53 | 60 | 65 |
| Arar | 16.26 | 97.34 | 18 | 26 | 31 | 35 | 39 | 42 |
| Bisha | 22.36 | 97.22 | 24 | 35 | 44 | 54 | 68 | 80 |
| Dammam | 25.60 | 97.72 | 27 | 34 | 40 | 46 | 54 | 60 |
| Gassim | 25.90 | 97.20 | 30 | 40 | 49 | 59 | 74 | 86 |
| Jazan | 47.04 | 96.49 | 49 | 61 | 69 | 76 | 84 | 89 |
| Guriat | 17.30 | 98.11 | 16 | 25 | 31 | 36 | 41 | 44 |
| Hail | 22.54 | 97.62 | 24 | 30 | 34 | 37 | 42 | 45 |
| Jeddah | 41.30 | 96.97 | 35 | 43 | 50 | 59 | 74 | 87 |
| K-Mushait | 26.22 | 97.33 | 38 | 52 | 63 | 74 | 90 | 102 |
| Madina | 29.53 | 97.50 | 26 | 38 | 45 | 50 | 56 | 59 |
| Makkah | 40.30 | 96.89 | 41 | 54 | 60 | 64 | 68 | 70 |
| Najran | 28.05 | 97.38 | 27 | 37 | 49 | 67 | 109 | 161 |
| Rafha | 17.88 | 97.66 | 19 | 24 | 29 | 35 | 45 | 55 |
| Riyadh | 23.00 | 97.30 | 25 | 30 | 33 | 37 | 41 | 44 |
| Sharurah | 31.43 | 96.28 | 30 | 35 | 42 | 54 | 86 | 132 |
| Tabuk | 26.00 | 98.36 | −2 | 29 | 39 | 44 | 47 | 47 |
| Taif | 27.48 | 96.99 | 35 | 49 | 62 | 79 | 107 | 135 |
| Turaif | 17.58 | 97.35 | 19 | 25 | 30 | 34 | 39 | 44 |
| Wadi Aldawasser | 17.96 | 98.01 | 9 | 20 | 28 | 36 | 46 | 54 |
| Wejh | 33.95 | 97.51 | 19 | 34 | 48 | 62 | 84 | 102 |
| Yenbo | 42.43 | 97.13 | 34 | 41 | 49 | 59 | 77 | 94 |
| Station | Frequency | p-Value | Intensity | p-Value |
|---|---|---|---|---|
| Abha | −0.155 | 0.359 | −0.029 | 0.862 |
| Al-Ahsa | 0.099 | 0.710 | 0.099 | 0.661 |
| Al-Baha | −0.358 | 0.043 * | −0.095 | 0.543 |
| Al-Jouf | −0.105 | 0.671 | 0.167 | 0.392 |
| Qaysumah | 0.263 | 0.187 | 0.270 | 0.115 |
| Arar | 0.508 | 0.044 * | 0.545 | 0.016 * |
| Bisha | 0.159 | 0.507 | −0.086 | 0.692 |
| Dammam | −0.075 | 0.903 | NA | NA |
| Gassim | 0.198 | 0.333 | 0.072 | 0.705 |
| Jazan | 0.041 | 0.903 | −0.055 | 0.827 |
| Guriat | −0.055 | 0.876 | 0.044 | 0.869 |
| Hail | −0.153 | 0.457 | −0.123 | 0.484 |
| Jeddah | 0.258 | 0.652 | NA | NA |
| K-Mushait | −0.041 | 0.832 | 0.091 | 0.573 |
| Madina | 0.134 | 0.669 | 0.182 | 0.451 |
| Makkah | 0.110 | 0.668 | 0.019 | 0.960 |
| Najran | −0.114 | 0.715 | −0.198 | 0.409 |
| Rafha | 0.322 | 0.116 | 0.105 | 0.570 |
| Riyadh | −0.274 | 0.175 | 0.020 | 0.940 |
| Sharurah | 0.155 | 0.640 | 0.018 | 1.000 |
| Tabuk | NA | NA | NA | NA |
| Taif | −0.347 | 0.042 * | −0.336 | 0.027 * |
| Turaif | 0.015 | 0.967 | 0.076 | 0.651 |
| W. Aldawasser | −0.365 | 0.487 | NA | NA |
| Wejh | 0.115 | 1.000 | NA | NA |
| Yenbo | NA | NA | NA | NA |
Disclaimer/Publisher’s Note: The statements, opinions and data contained in all publications are solely those of the individual author(s) and contributor(s) and not of MDPI and/or the editor(s). MDPI and/or the editor(s) disclaim responsibility for any injury to people or property resulting from any ideas, methods, instructions or products referred to in the content. |
© 2025 by the authors. Licensee MDPI, Basel, Switzerland. This article is an open access article distributed under the terms and conditions of the Creative Commons Attribution (CC BY) license (https://creativecommons.org/licenses/by/4.0/).
Share and Cite
Munir, S.; Habeebullah, T.M.A.; Zamreeq, A.O.; Alfehaid, M.M.A.; Ismail, M.; Khalil, A.A.; Baligh, A.A.; Islam, M.N.; Jamaladdin, S.; Ghulam, A.S. Understanding Changing Trends in Extreme Rainfall in Saudi Arabia: Trend Detection and Automated EVT-Based Threshold Estimation. Climate 2025, 13, 233. https://doi.org/10.3390/cli13110233
Munir S, Habeebullah TMA, Zamreeq AO, Alfehaid MMA, Ismail M, Khalil AA, Baligh AA, Islam MN, Jamaladdin S, Ghulam AS. Understanding Changing Trends in Extreme Rainfall in Saudi Arabia: Trend Detection and Automated EVT-Based Threshold Estimation. Climate. 2025; 13(11):233. https://doi.org/10.3390/cli13110233
Chicago/Turabian StyleMunir, Said, Turki M. A. Habeebullah, Arjan O. Zamreeq, Muhannad M. A. Alfehaid, Muhammad Ismail, Alaa A. Khalil, Abdalla A. Baligh, M. Nazrul Islam, Samirah Jamaladdin, and Ayman S. Ghulam. 2025. "Understanding Changing Trends in Extreme Rainfall in Saudi Arabia: Trend Detection and Automated EVT-Based Threshold Estimation" Climate 13, no. 11: 233. https://doi.org/10.3390/cli13110233
APA StyleMunir, S., Habeebullah, T. M. A., Zamreeq, A. O., Alfehaid, M. M. A., Ismail, M., Khalil, A. A., Baligh, A. A., Islam, M. N., Jamaladdin, S., & Ghulam, A. S. (2025). Understanding Changing Trends in Extreme Rainfall in Saudi Arabia: Trend Detection and Automated EVT-Based Threshold Estimation. Climate, 13(11), 233. https://doi.org/10.3390/cli13110233


