Abstract
This study investigated the historical climate data and future projections under the SSP5-8.5 scenario for Jammu, Kashmir (J&K), and its adjoining regions in India. Agriculture is a critical economic pillar of this region, making it highly vulnerable to climate change. This study focused on temperature and precipitation trends. Statistical analysis and modeling methods, including cloud computing, were employed to predict changes and assess their impact on agricultural productivity and water resources. The results indicated that by 2100, the mean maximum and minimum temperatures are projected to increase by approximately 2.90 °C and 2.86 °C, respectively. Precipitation variability is expected to rise, with a mean increase of 2.64 × 10⁻⁶ mm per day. These changes have significant consequences for crop yield, water stress, and ecosystem dynamics. An analysis of Gross Primary Productivity (GPP) as a proxy for agricultural productivity using linear regression revealed a concerning trend. Although the total GPP of the study area remained stable over time, it declined by −570 g yr−1 in 2010, coinciding with a 1 °C temperature rise. Projections based on the expected 3 °C temperature increase by 2100 suggest a total GPP loss of −2500 g yr−1. These findings highlight the urgent need for proactive adaptation measures, including sustainable agricultural practices, improved water management, and enhanced socioeconomic infrastructure, to mitigate the impact of climate change and ensure long-term resilience and food security in the region.
1. Introduction
Jammu, Kashmir, and adjoining regions, an area of extreme geographical and cultural significance, is situated in the northern region of the Indian subcontinent [1]. This territory is characterized by its diverse geographical features, ranging from the subtropical expanses of Jammu to the temperate climate of the Kashmir Valley and the stark, frigid desert of Ladakh. Beyond its physical diversity, it is critically dependent on agriculture, which forms the backbone of its economy [2]. Agriculture not only supports the livelihoods of the local population, which numbers over 12.5 million as of the latest census, but also plays a pivotal role in sustaining the cultural and social fabric of the region [3]. This dependence highlights the urgency to study the impact of climate variability on food security and agricultural productivity in this region.
In the face of the rising global crisis of climate change, regions with economies heavily reliant on agriculture find themselves at a crossroads of vulnerability with the urgent need for adaptive resilience [4]. The profound impacts of climate change, characterized by rising temperatures and erratic precipitation patterns, pose significant threats to the delicate ecological balance, agricultural productivity, and water resources of the region [5,6,7]. This study aimed to understand these impacts, thus providing a localized view through which the broader narrative of global climate change and its repercussions on food security can be understood and addressed. Moreover, the backdrop of this region’s diverse geographical and climatic landscapes also offers a unique opportunity to study the multifaceted effects of climate change [8]. From its lush green valleys to high-altitude deserts, this region supports rich biodiversity and sustains a significant population dependent on agriculture and horticulture for their livelihood. The looming challenges of climate change threaten to destabilize this intricate socioeconomic fabric, making an investigation into its impacts not only pertinent, but also critical for the region’s future.
Various studies have been conducted that have explored the impacts of climate change on agricultural productivity. Nicholson et al. (2021) critiqued the narrow focus on food availability in agricultural system models, overlooking food access, utilization, and stability. They advocated the incorporation of these broader food security dimensions into models, emphasizing the need for empirical data and dynamic modeling to enhance accuracy. This study warned against equating agricultural output with overall food security, calling for specific and localized modeling practices [9]. Malik et al. (2023) assessed agricultural vulnerability to climate change in Jammu, Kashmir, and Ladakh, highlighting the negative effects of cooler temperatures and smaller landholdings on agricultural GDP. Positive effects were noted from increased cropping intensity and improved rural literacy. This study identified varying vulnerability levels across districts and utilized an LSTM-based model for climate forecasting. The findings of this study were also intended to guide policy and strategies for climate resilience in agriculture [10]. Singh et al. (2023) reviewed the impact of climate change on plant disease outbreaks, highlighting the threats to global food security and environmental sustainability. They emphasized how climate change influences pathogen evolution and the spread of diseases, potentially affecting plant productivity in various ecosystems. The authors called for revisions in research frameworks to better predict and mitigate future disease risks, suggesting closer collaboration between science and policy interfaces and intergovernmental organizations for effective disease management. The goal of this study was to ensure the sustainability of food production and natural ecosystems under changing climate conditions [11].
The intersection of climate change, agricultural productivity, and food security forms a critical area of inquiry, as recent studies have illustrated the profound and multifaceted impacts of climatic variability across various regions. Studies have emphasized the severe risks that climate change poses to food security and nutrition, particularly highlighting the role of extreme weather events, such as droughts, floods, and changing precipitation patterns, in exacerbating these risks [12]. Mirzabaev et al. (2022) explored the vulnerability of global food systems to climate-induced extremes, identifying populations at risk of food insecurity and malnutrition and advocating for adaptation strategies focused on institutional management and governance [13]. Similarly, Sirilakshmi et al. (2023) discussed the escalating issue of food insecurity triggered by climate events, stressing the necessity for action against the impact of climate change on food systems [14]. Kitole et al. (2024) provided insights into the complex nexus between climate change, food security, and public health in Tanzania, revealing how climate stress increases susceptibility to health issues like diarrhea, thereby compromising food production and access [15]. Further contributing to this discourse, Mekonnen et al. (2021) analyzed the effects of climate change on crop production and household food security in Ethiopia, emphasizing the importance of local adaptation strategies and climate change awareness [16]. Affoh et al. (2022) examined the relationship between climate variables and the dimensions of food security in sub-Saharan Africa, finding that rainfall positively impacts food security, while temperature and CO2 emissions present mixed effects [12].
These studies emphasize the need for the development of strategies that address the immediate and long-term effects of climate change on agriculture and food systems. These strategies must consider the impact of climate variability on agricultural output and food accessibility, as well as the sustainability of food systems under changing climatic conditions. The studies suggest that a multifaceted approach that combines sustainable agricultural practices, public health interventions, and targeted policy frameworks is necessary to build resilient communities and food systems that can withstand the challenges posed by climate change. Although previous research has provided a foundation for this study, there is a notable gap in comprehensive, localized analyses that use historical climate data with socioeconomic implications for the study area. To address this gap, this study employs advanced modeling techniques and leverages cloud computing to analyze and predict the impacts of temperature and precipitation changes on the region’s agricultural productivity and water resources. The significance of this work lies in its potential to contribute actionable insights and evidence-based strategies to mitigate climate change’s adverse effects on one of India’s most climate-vulnerable regions.
The aim of this research is to quantify the effects of climate-induced changes in temperature and precipitation on crop yields and water availability, to identify vulnerable areas and communities for targeted interventions, and to recommend adaptation strategies that are tailored to the specific needs and conditions of the region. The ultimate goal is to provide stakeholders with the necessary knowledge and tools to build a sustainable and resilient future for the region, preserving its agricultural heritage and ensuring socio-economic stability in the face of climate change. This study was carried out using the Google Earth Engine platform, and the related JavaScript code is presented in Figure 1.
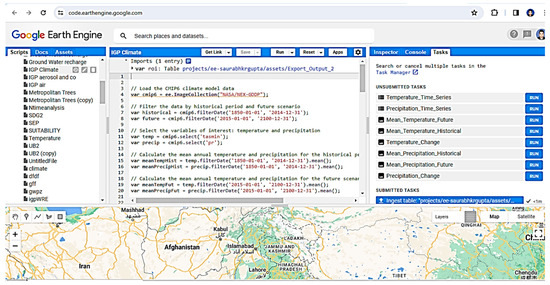
Figure 1.
The figure shows cloud computing for climate modeling on the Google Earth Engine platform.
2. Materials and Methods
2.1. Study Area
The northernmost area of the Indian subcontinent, comprising Jammu, Kashmir, and its surrounding regions, is distinguished by its significant geographical and cultural attributes [1]. This region spans from 33°17′ to 37°20′ north latitude and 73°25′ to 80°30′ east longitude, as illustrated in Figure 2. As a result, the area has a diverse range of landscapes, including the subtropical expanses of Jammu, the temperate climate of the Kashmir Valley, and the harsh, cold desert of Ladakh [17]. This heterogeneity in terrain and the rich cultural fabric of the region makes it a subject of interest for researchers from various disciplines. The region’s uniqueness lies in its physical characteristics and the intricate cultural and historical narratives that have formed its identity over the centuries.
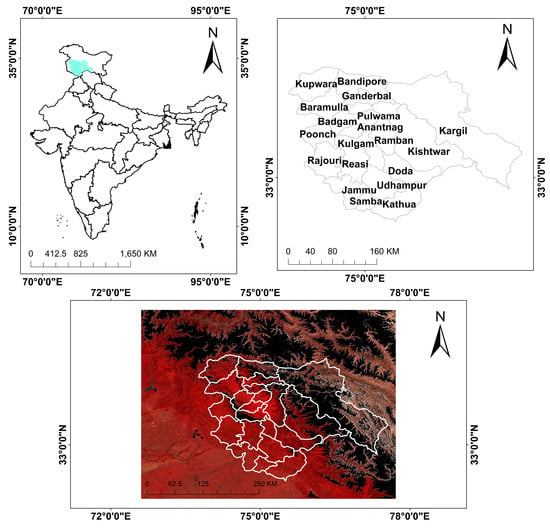
Figure 2.
Jammu, Kashmir, and its adjoining regions as visualized using a false-color composite image from the Landsat satellite.
In order to assess the effects of future climate scenarios on food security in this region, a detailed methodology was developed. This framework integrated data from CMIP6 climate models, which provide projections of future climate conditions, and Landsat satellite imagery, which offers high-resolution visualizations of land use patterns and temporal changes. In addition, the land use datasets obtained from the European Space Agency (ESA) provide valuable insights into the interactions between humans and nature that are shaping the landscape of the region. The integration of these diverse data sources, as shown in Figure 3, provided a basis for a holistic investigation into the potential effects of climate variability and land use changes on the agricultural productivity and food security prospects of the region.
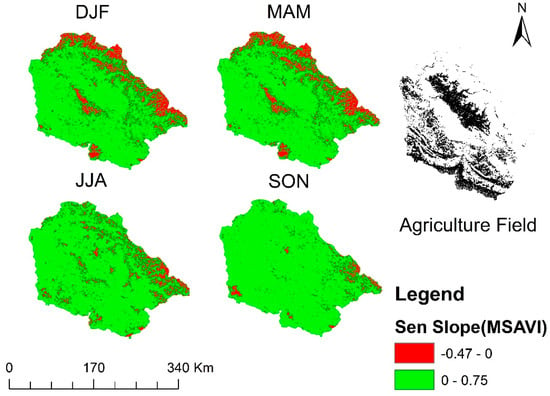
Figure 3.
The Sen slop estimate of the Modified Soil-Adjusted Vegetation Index (MSAVI) to determine the crop health and yield (1984–2020) is classified as a negative and positive trend.
2.2. NASA/NEX-GDDP CMIP6 Climate Model Data
This study utilized the Coupled Model Intercomparison Project Phase 6 (CMIP6) downscaled climate model data provided by NASA’s NEX-GDDP, which were derived from the General Circulation Model (GCM) [18] accessed via the Earth Engine API. This dataset underwent a filtration process to differentiate between historical (1850–2014) and future (2015–2100) climate scenarios, focusing specifically on variables, i.e., temperature and precipitation. We computed average yearly values for these across both timelines to analyze their variance patterns from historical benchmarks for future projections, providing a means for assessing climate change impacts on regional agriculture and ecosystem health. The Coupled Model Intercomparison Project Phase 6 (CMIP6) includes a wide range of climate models and scenarios from the updated and extended high-emission scenario RCP8.5 to the SSP5-8.5 scenario. The CMIP6 models, both the Non-Interactive Version (NINT) and One-Moment Aerosol Model (OMA), exhibit approximately 15% greater effective climate sensitivity and a more robust transient climate response compared to their CMIP5 counterparts, resulting in more pronounced warming by 2100 under the SSP emission scenarios than under the similar Representative Concentration Pathway (RCP) scenarios in CMIP5 [19]. The Shared Socioeconomic Pathway (SSP) scenarios offer a more holistic perspective into the plausible futures that are possible through a set of narratives spanning aspects of change in society, politics, demographics, and the environment, including climate change [20].
2.3. Landsat Satellite Imagery Utilization for Vegetation Index Analysis
Utilizing the Earth Engine API provided by USGS and NASA, Landsat satellite imagery was imported spanning the years 1984 to 2020. A critical component of this analysis involved the computation of the MSAVI, to assess the health and productivity of vegetation. The MSAVI, a refinement of the Soil-Adjusted Vegetation Index (SAVI), was formulated to mitigate the influence of bare soil reflectance on vegetation assessment, rendering it useful during the initial vegetation growth stages characterized by significant soil exposure. The calculation of the MSAVI is based on the following formula:
MSAVI = (NIR − Red)/(NIR + Red + L) × (1 + L)
L = (NIR − Red) × (NIR − s × Red)/(NIR + Red)
In Equations (1) and (2), “NIR” denotes the reflectance in the near-infrared band, and “Red” signifies the reflectance in the red band of the electromagnetic spectrum, capturing the essential components of plant health. The “L” factor serves as a soil brightness compensation factor, adjusting the index to diminish the background soil effect, while “s” represents the slope of the soil line derived from plotting red against near-infrared reflectance data. This approach to vegetation monitoring through the MSAVI provided us with a means to assess the vegetation dynamics by highlighting areas of plant growth and zones potentially impacted by environmental stressors. By using the temporal depth and spatial resolution of Landsat data, this approach offered insights into vegetation trends over the period, contributing significantly to the goal of understanding the effects of climate variability on ecosystem health and agricultural productivity.
2.4. Integration of ESA Land Use Data
Land use data from the European Space Agency (ESA) were imported via the Earth Engine API and reclassified to delineate areas designated for agricultural production. This reclassification was crucial for assessing land use dynamics within the study area and its implications for agricultural productivity and ecosystem services.
2.5. Integration and Analysis
An integration of CMIP6 climate data, Landsat imagery, and ESA land use data was then conducted. We used Sen’s slope analysis to identify trends in the MSAVI values across different seasons (December, January, February, or DJF; March, April, May, or MAM; June, July, August, or JJA; and September, October, November, or SON), that offered insights into the health and productivity of vegetation. Sen’s slope is defined as follows [21]:
S = Median (Xj − Xi)/(j − i)
In Equation (3), Xj and Xi denote the values of the variable at time points j and i, respectively, where j > i. The expression (j − i) denotes the time interval between these two points.
2.6. Data Visualization and Reporting
Various visualization tools were used to illustrate the temporal variations in temperature, precipitation, plant health, and land use patterns. By integrating insights from CMIP6 climate projections, Landsat-derived vegetation indices, and ESA land use data, this study offers valuable perspectives on the potential effects of climate change and land use dynamics on the future of food security.
2.7. Modeling Future GPP Loss
The methodology incorporates the GPP data obtained from the MODIS GPP dataset at 500 m resolution (MOD17A2H). The MODIS GPP data are derived using satellite-based reflectance data and incorporate a light-use efficiency model that estimates GPP by taking into account factors such as absorbed photosynthetically active radiation (APAR) and the efficiency with which plants use this radiation to fix carbon. To begin, the data preparation involves reading raster files for GPP and temperature data for the years 2000, 2005, 2010, 2015, and 2020 using the read\_raster function in Python. The data included the annual mean temperatures corresponding to each of these years. The code then projects an increase in temperature of 3 degrees Celsius and a 10% increase in precipitation for future scenarios, as suggested by [19]. The GPP response modeling is carried out using the calculate\_gpp function, which calculates GPP based on the temperature and precipitation inputs. This function assumes a simple linear relationship where GPP decreases with an increase in both temperature and precipitation. In the simulation step, our code simulates the changes in GPP from the year 2000 to 2100, first interpolating the mean temperature for each year and then calculating GPP based on this interpolated temperature and the increased precipitation. This process is repeated for several temperature variations up to the projected future temperature of 2100. Finally, the visualization step involves plotting the simulated GPP data for the selected years, displaying how GPP might vary with different temperature conditions. Based on the information provided in study [22], the relationship between GPP, temperature (T), and precipitation (P) can be represented as linear equations. However, these are simplified representations and the actual relationships may be more complex and nonlinear.
For crop and grassland ecosystems, the relationship can be represented as follows:
In these equations,
- P represents precipitation.
- T represents temperature.
- are constants that would need to be determined through regression analysis based on actual data.
3. Results
The geographical map (Figure 3) delineates Sen’s slope estimations of the MSAVI across the study area, spanning from 1984 to 2020. We categorized the maps into negative and positive trends in value per year, offering insights into the dynamics of vegetation growth and production throughout the specified period (Table 1).

Table 1.
The statistics of Sen’s slope for MSAVI raster.
During the months of JJA, Sen’s slope for the MSAVI exhibited a range of −0.47 to 0.75 per year. This range indicated fluctuation in the MSAVI trend over the summer months. While the average value of −0.00011 per year suggests a relatively horizontal pattern, significant variations are evident. The standard deviation (SD) of 0.0056 per year indicates a modest level of variability around the average trend. During the SON period, Sen’s slope varied from −0.29 to 0.4, indicating comparatively lower trend variability. The average value of 0.0012 per year suggested a slight upward trend in the MSAVI during the fall months, with a very small amount of variation around the average trend, as indicated by the SD of 0.0032. For the period MAM, Sen’s slope ranged from −0.37 to 0.27 per year, indicating a significant level of heterogeneity in the trend of the MSAVI over the spring months. The average value of 0.00023 per year suggests a virtually constant pattern akin to that observed during the summer months. The SD of 0.0047 per year indicates a modest level of variability around the average trend. Similarly, during the DJF period, Sen’s slope ranged from −0.37 to 0.26 per year, highlighting fluctuations in the trajectory of the MSAVI over the winter months. The average value of 0.000225 per year indicated a constant pattern resembling that of the spring and summer months. The SD of 0.0047 per year indicated a modest level of variability around the average trend. These data offer crucial insights into seasonal fluctuations and patterns in the MSAVI, contributing to our understanding of changes in vegetation and the overall health of the ecosystem over time.
3.1. Temperature
The temperature analysis for the study area shows significant climatic changes over the years, highlighted by the changes in mean maximum and minimum temperatures. Historically, the mean maximum temperature recorded was 16.4 °C, with a range from 2.9 °C to 29.8 °C (SD, 7.1 °C). This temperature is projected to rise, with future predictions indicating a mean maximum of 19.3 °C, extending from 5.8 °C to 32.7 °C. The SD remains constant at 7.1 °C, suggesting a consistent range of temperature variability.
3.1.1. Minimum Temperature
Similarly, the mean minimum temperature has shown a rising trend. Historically, it was recorded at 5.2 °C, with temperatures varying from −7.5 °C to 16.3 °C (SD, 6.5 °C). In future projections, the mean minimum temperature is expected to increase to 8.1 °C, with a range from −4.5 °C to 19.0 °C. The slight decrease in SD to 6.4 °C indicates a minor reduction in variability despite the increase in temperature range. Figure 4 represents these changes, displaying the spatial distribution of historical and projected minimum and maximum temperatures, providing a clear visual context to these trends.
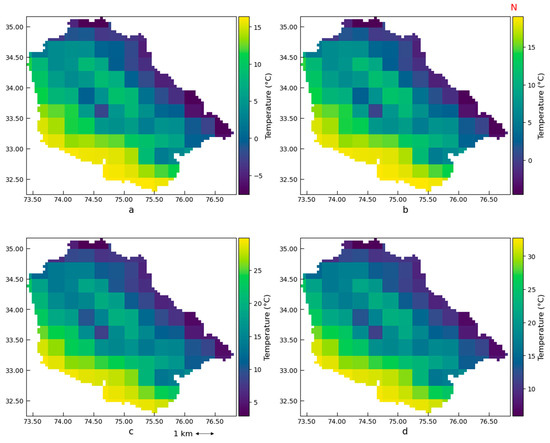
Figure 4.
Spatial maps of (a) historical minimum temperature, (b) future minimum temperature, (c) historical maximum temperature, and (d) future maximum annual temperature.
Table 2 shows these temperature statistics, covering the changes between past and projected temperatures.

Table 2.
The statistics of min and max temperatures both for the future and historically.
3.1.2. Maximum Temperature Change (2100 Projection)
The projections indicate a notable increase in the mean maximum temperature for the study area by 2100, rising by approximately 2.90 °C from historical averages (Figure 5). The variation in maximum temperature changes is expected to range between 2.79 °C and 2.98 °C. Additionally, the SD for these temperature changes will slightly adjust by about 0.04 °C, while the overall temperature range is anticipated to broaden by 0.19 °C (Table 3). Regarding minimum temperatures, a similar upward trend is expected, with an average increase of 2.86 °C by the year 2100. The range of change for minimum temperatures will vary from 2.66 °C to 3.03 °C. The SD associated with these changes will increase by 0.10 °C, and the temperature range is projected to widen by 0.36 °C. These changes highlight significant shifts in climatic conditions that could impact regional agriculture and ecosystems [23].
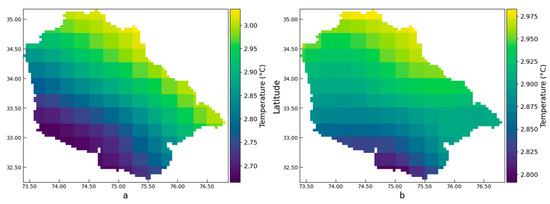
Figure 5.
The raster map of (a) minimum and (b) maximum temperature change both historically and in the future.

Table 3.
The statistics of change for min and max temperatures.
3.1.3. Historic and Future Distribution of Temperature
The historic and future temperature distributions, as shown in Table 4 and visualized in Figure 6, point towards a warming trend that has significant implications for the region’s agricultural and socioeconomic stability.

Table 4.
Zonal distribution of temperature both historically and for the future.
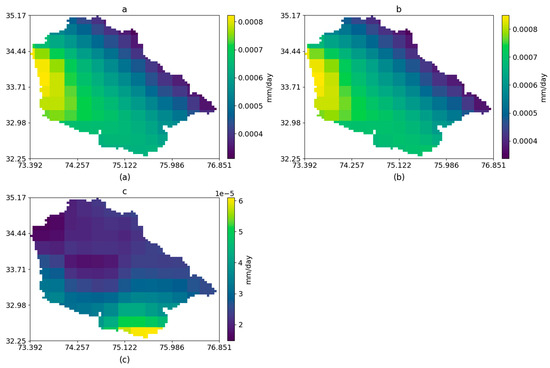
Figure 6.
Spatial distribution of (a) mean annual precipitation rate, (b) historical precipitation rate for the future, and (c) changes between historic and future rates.
Historically, regions such as Chamba and Lahul and Spiti recorded mean temperatures of 12.90 °C and 5.47 °C, respectively. These are expected to rise to 15.80 °C and 8.38 °C in the future, denoting a substantial increase. The mean maximum temperature, indicative of peak seasonal warmth, shows an ascending pattern, with Chamba’s future projection at 25.52 °C, which is a notable rise from its historical average of 22.64 °C. Lahul and Spiti’s mean maximum temperature is forecasted to climb from a historical 6.20 °C to 9.11 °C. Similarly, minimum temperatures are set to increase across all zones, highlighting an overall shift toward higher temperature ranges. Higher temperatures can accelerate glacial melt, impact water supply, alter crop growth cycles, and potentially reduce the yields of temperature-sensitive crops. Such changes necessitate urgent adaptation measures in agricultural practices, water management, and infrastructural development to mitigate adverse impacts. The zonal distribution analysis underscores the urgency to enhance climate resilience in agricultural planning and policymaking. As temperatures rise, understanding localized impacts enables targeted interventions to maintain food security and protect livelihoods in the face of climate change.
3.2. Historical Mean Precipitation
The average precipitation rate is about 0.21462 mm/year, with annual variability ranging from about 0.113004 mm/year to 0.299592 mm/year and a standard deviation (SD) of around 0.044676 mm/year. Future projections indicate an average precipitation rate of about 0.224256 mm/year, fluctuating with a high amplitude between 0.12264 mm/year and 0.309228 mm/year, while the dispersion from this mean is rather high at about 0.045552 mm/year. It is noted that the average precipitation rate changes, increasing at about 0.000964 mm/year historically compared to the future period (calculated as 0.000964 mm/year). Overall, these results suggest a slight increase in the average precipitation rate from the historical period to the future period. These future projections indicate a higher variability in precipitation rates compared to the historical period, with potentially higher maximum precipitation rates (Table 5).

Table 5.
Precipitation rate historically, for the future, and for change.
Historic and Future zonal Distribution of Precipitation
The effects of climate change on food security, as well as an examination of zonal precipitation patterns, provide essential information about the study area. As depicted in Table 6 and Figure 7, the data indicate a steady rise in precipitation levels across different zones. For instance, the lowest recorded historical precipitation in Chamba is 0.139722 mm/year, which is projected to increase to 0.149094 mm/year in the future. This pattern holds true for maximum precipitation, which is expected to rise from 0.221102 mm/year historically to 0.23836 mm/year in the future. The study area’s food security is influenced by the effects of climate change, and the analysis of zonal precipitation patterns is crucial. The data in Table 6 and Figure 7 reveal a consistent increase in precipitation across all zones, with the mean precipitation rate in Chamba projected to increase from its historical value of 0.192547 mm/year to a future mean of 0.205358 mm/year. Additionally, the future precipitation is anticipated to be more variable, as indicated by the rise in the SD.

Table 6.
Zonal distribution of precipitation historically and for the future (mm/year).
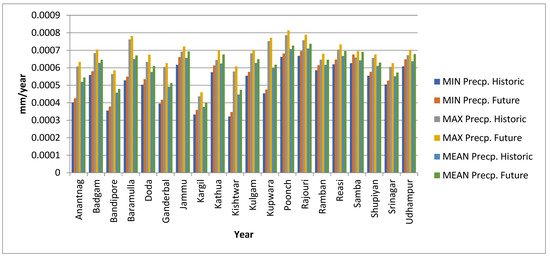
Figure 7.
Zonal distribution of temperature historically and for the future of the study area.
These findings are critical in the context of this research, which focuses on the implications of climatic changes for agricultural stability and food security. The anticipated increase in precipitation will have profound implications for water availability and crop production, potentially alleviating water stress and impacting crop yields positively. However, the increased variability and potential for extreme precipitation events could also pose new challenges, necessitating adaptive strategies for effective water resource management and resilient agricultural practices to safeguard food security in the region.
3.3. Estimation of Gross Primary Productivity (GPP)
GPP is a key indicator of photosynthetic activity within an ecosystem [22], signifying the amount of carbon dioxide captured by plants and its conversion into organic compounds. In our study area, where the economy and food security are intricately linked to agricultural productivity, understanding GPP is critical [24]. It provides insights into the health of vegetation and its response to climatic changes, which are essential for maintaining food security stability systems [25]. For the climatic changes impacting the study area, the GPP data presented in Figure 8 and Table 7 offer an important perspective on the region’s ecological productivity. The data, categorized by classes likely indicative of varying vegetation cover or land use types, reveal the amount of carbon assimilation that occurred for the years 2005, 2010, 2015, and 2020. The absence of data for Class 1 point to areas beyond the reach of vegetative cover or regions where data collection was not feasible. However, regarding Class 2, which falls under 3795 g C m−2 yr−1, the GPP figures suggest a gradation in productivity. In 2005, the total GPP of the study area for Class 2 amounted to 2,471,700 g yr−1, while for Class 3 (8764 g C m−2 yr−1), it was 2,931,420 g yr−1, and for Class 4 (12,985 g C m−2 yr−1), it was 2,931,000 g yr−1. Classes 2 and 3 primarily cover the crop area, while Class 4 encompasses the forest or higher vegetation areas. By applying Equation 4, the pattern appears to remain relatively steady over the following years, indicating a level of consistency in productivity. However, in 2010, GPP decreased by −570 g yr−1 compared to other years. This drop can be attributed to the increase in temperature by 1 °C in 2010 (Figure 9). It is estimated that the GPP loss will amount to −2500 g yr−1 by 2100, assuming a 3 °C rise in temperature.
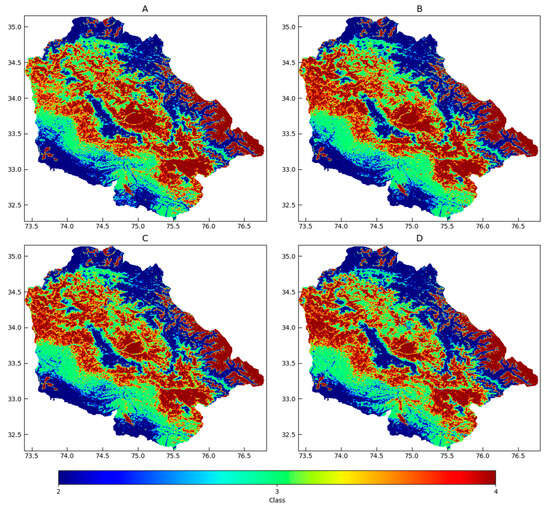
Figure 8.
Comparative GPP trends across various years depicting vegetative productivity the study area: (A) 2005, (B) 2010, (C) 2015, and (D) 2020.

Table 7.
Gross primary productivity for various vegetation classes over time in g/y.
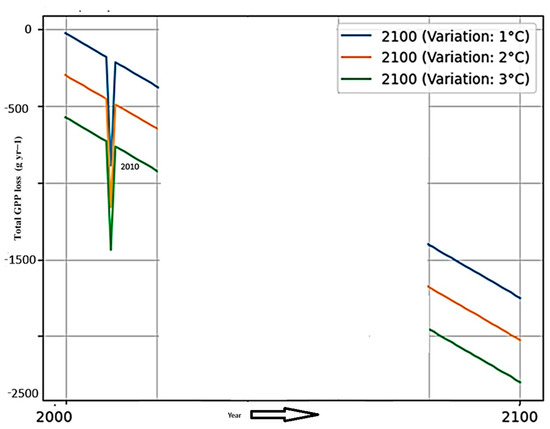
Figure 9.
GPP loss projection from 2000, 2010, and 2100 due to a rise in temperature.
These values also represent the carbon uptake by the vegetation, which has direct implications for agricultural output and the broader ecosystem services. Understanding the trends in these values over time is vital as they reflect the region’s ability to sustain crop production amidst environmental and climatic challenges. Increasing GPP values signal healthier, more productive vegetation, potentially benefiting food security. Conversely, declining values might point to ecological stress, emphasizing the need for adaptive strategies to ensure continued agricultural viability. In this context, GPP estimation served as an indicator of ecological function and as a gauge for the sustainability of the region’s food production systems in the face of climatic variability. This highlights the importance of proactive management and policymaking aimed at enhancing the resilience of agricultural systems, preserving ecological balance, and supporting the food security of the study area in the period of changing climate patterns.
3.4. Spatial-Temporal Variations in Temperature
The observed spatial–temporal variations in temperature across the study area, as illustrated in Figure 10 for the years 2005, 2010, 2015, and 2020, reveal significant fluctuations that demonstrate a clear shift in temperature patterns, with the color gradients signifying changes in temperature that potentially correlate with crop viability and phenological shifts. There are discernible trends that could contribute to changes in agricultural productivity. For instance, areas exhibiting consistent warming trends are indicative of altered growing seasons, which can affect the types of viable crops, as well as their expected yields and the sustainability of agricultural practices.
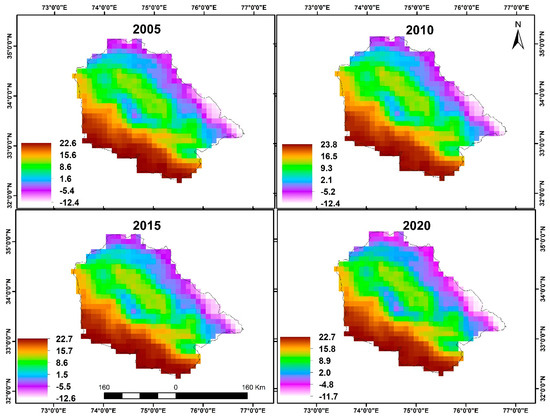
Figure 10.
Spatio-temporal changes in temperature from 2005 to 2020.
These data can be correlated with yield statistics, phenological data, and farmers’ observations to provide a more specific understanding of the direct and indirect effects of climate change on agricultural output and food security. It can be inferred that the increasing temperatures, particularly in critical growth periods, will have adverse effects on crop productivity and, hence, food security. These changes highlight the urgent need for implementing adaptive agricultural practices and policy interventions to mitigate the impacts of climatic variability.
4. Discussion
This study analyses the trends of the MSAVI in the study area from 1984 to 2020, and utilizes Sen’s slope estimates to provide a detailed analysis of the health and productivity of vegetation. The analysis highlights that while climate change, land use alterations, and human activities serve as pivotal factors influencing these trends, there is general stability or a mild improvement in vegetation growth throughout the observed period. This observation is substantiated by detailed spatial mapping and statistical analysis, providing a granular understanding of the variations across different seasons and locations within the region. Notably, an anticipated increase in both mean maximum and minimum temperatures can significantly influence crop growth, water availability, and soil health, posing challenges such as heat stress, altered crop phenology, and pest dynamics. These temperature changes will have a profound impact on the productivity of staple crops like rice and wheat, potentially exacerbating water scarcity issues through increased evapotranspiration rates [26,27,28]. Concurrently, these findings also address the subtle rise in average precipitation rates, indicating a possible shift in the region’s hydrological patterns. This shift, characterized by a potential increase in precipitation variability, would have mixed consequences for agricultural practices and ecosystem stability [29]. On the one hand, enhanced precipitation could ameliorate water availability and aid crop growth [30]; on the other, it could lead to adverse conditions like waterlogging and soil erosion, necessitating adaptive management practices to mitigate these effects [31,32,33]. The synthesis of findings from the MSAVI trend analysis with broader climate change projections offers a comprehensive outlook on the future of food security in the study area [34], and underscores the necessity for policy interventions, adaptation strategies, and community engagement to effectively navigate the challenges posed by climate change [35,36,37]. The discourse further elucidates that while increased precipitation might offset some negative impacts of rising temperatures [38,39], it does not entirely negate the challenges introduced by temperature elevations. The efficacy of such mitigation is contingent upon a range of factors, including soil characteristics, land use practices, and crop types, highlighting the complexity of the climate–agriculture nexus.
This study shows that increases in temperature might have a more pronounced impact on the region’s agricultural sector and food security than changes in precipitation patterns. This calls for a strategic approach of adaptation measures that address both immediate and long-term climate change impacts, fostering a resilient agricultural landscape that is capable of sustaining the region’s food security and livelihoods amidst evolving climatic conditions. The observed decline in total GPP in the region during the year 2010 of −570 g yr−1 is, therefore, in agreement with the broader patterns of climate impact on regional ecosystems. This decrease was attributable to an increase in temperature, specifically by 1 °C in 2010, which resulted in the sensitivity of GPP to climatic changes. This is very important as it shows how the smallest variation in temperature can lead to significant changes in the productivity levels of the ecosystem, without which it would be difficult to determine the exact future climatic conditions and the possible effects on agricultural output and biodiversity. In the future, this will translate to a GPP loss projection of −2500 g yr−1 by 2100 due to a 3 °C rise in temperature, underlining the growing risk from climate change. These projections are in line with global climate models, which predict the rising temperature and its adverse effect on GPP, especially in regions that are ecologically sensitive and dependent on climate-sensitive sectors, including agriculture and forestry. This relationship between increasing temperatures and declining GPPs underlines the need for region-specific studies and strategies to mitigate such impacts. For example, the adoption of climate-resilient agricultural practices, improvement of water management, and promotion of biodiversity may help buffer some of the negative effects of increased temperature on GPP. Shi et al. (2023) [22] provided an overview of a set of intercomparison projects in China and depicted similar findings to those in our study area.
Based on the findings of this study, several policy recommendations are proposed to enhance the resilience of the region’s agricultural sector. Tailored water resource management strategies, including small-scale decentralized storage and rainwater harvesting, are critical to buffer against increased precipitation variability and potential drought conditions. The introduction of crop diversification programs promoting heat-resistant and drought-tolerant varieties is recommended to combat the challenges posed by rising temperatures. The expansion of agricultural advisory services to provide real-time guidance on soil health, water use, and crop management can enhance farm operations. Infrastructure improvements in irrigation and rural road development can ensure sustainable agriculture and market access [40]. Furthermore, community educational programs focusing on sustainable practices and climate adaptation techniques are essential. Supporting research into adaptive agricultural technologies and practices that can equip this region to effectively handle the upcoming climatic challenges, thereby securing food production and socioeconomic stability.
To enhance the understanding of future agricultural losses in the study area, it is critical to explore the specific mechanisms by which climate change impacts agriculture. Increased temperatures, projected under future climate scenarios, are likely to accelerate crop maturation rates, reduce growing periods, and potentially diminish yields. For instance, staple crops like rice and wheat are particularly sensitive to temperature spikes during critical growth stages such as anthesis, which could result in lower productivity [41]. Previous research has demonstrated comparable consequences on various cash crops: elevated temperatures cause physiological stress, which decreases photosynthesis, impairs nutrient absorption, and raises respiration rates, ultimately reducing yields. For example, wheat experiences considerable reductions in yield during grain filling [42], while maize and soybean yields decline by approximately 6% for every degree Celsius increase [43]. Higher temperatures also lead to increased evapotranspiration, exacerbating soil moisture depletion, intensified by unpredictable precipitation patterns that may result in drought or flooding [44]. To address these challenges, it is necessary to implement adaptive measures, such as cultivating resilient crop varieties and advancing water management systems. Fruits and vegetables, highly sensitive to temperature and water stress, are also impacted; for instance, increased temperatures can decrease tomato fruit set and increase the likelihood of blossom-end rot [45], while heat stress can detract from lettuce quality, causing premature bolting and reduced market value. Recognizing the inherent uncertainties and limitations in climate models and agricultural projections is vital. Variability in climate model predictions, regional disparities in impacts, and the intricate interactions between climatic factors and agricultural practices introduce significant uncertainties [46]. Additionally, data limitations and the difficulties in downscaling global models to local contexts further complicate accuracy [47]. Although studies suggest that increased temperatures could significantly affect agricultural productivity, these uncertainties must be taken into account when developing adaptation strategies. It is essential to explore the specific pathways through which climatic factors influence agricultural output to ensure the future of agriculture in the region. Future research should refine climate models, improve data collection, and understand local context-specific impacts to enhance projections’ robustness and inform effective adaptation measures.
Additionally, heightened temperatures lead to increased evapotranspiration, exacerbating moisture depletion in soils. This challenge is compounded by more variable precipitation patterns, which may not adequately replenish soil moisture, leading to drought conditions. On the other hand, periods of intense rainfall could lead to flooding, which disrupts agricultural schedules, damages essential infrastructure, and leaches vital nutrients from the soil. Given these factors, the region’s unique geographical and climatic contexts necessitate targeted adaptive measures such as the development of crop varieties resilient to both drought and temperature extremes, advanced water management systems to optimize irrigation efficiency, and improved projection tools to prepare for and mitigate the effects of extreme weather events. Understanding and addressing these specific pathways through which climatic factors influence agricultural output are essential for securing the future of agriculture in the study area. While the climate community generally believes that lower emission scenarios (such as SSP1-2.6 and SSP2-4.5) are more plausible, we utilized the SSP5-8.5 scenario to establish an upper bound on potential consequences. This high emissions pathway is essential for comprehending the extreme outcomes of GPP responses and agricultural yields. By employing SSP5-8.5, we can provide a comprehensive perspective on worst-case scenarios, which helps with risk management by informing policymakers and stakeholders about the full range of potential impacts. This approach supports thorough planning, ensuring preparedness for severe yet less likely conditions, and enhances the robustness of our findings by evaluating a spectrum of scenarios. Therefore, using SSP5-8.5 is crucial for understanding the upper limits of climate change impacts and developing effective mitigation and adaptation strategies [48,49].
5. Conclusions
The results of these climatic trend analyses in the study area highlight a crucial necessity for strategic interventions directed at strengthening food security and regional resilience in the face of growing climate change challenges. By the year 2100, changes in the climate are projected; the increase in both the average maximum and minimum temperatures is estimated to be about 2.90 °C and 2.86 °C, respectively, coupled with a mild rise in precipitation by 0.0009636 mm/year. Therefore, such changes are expected to affect agricultural productivity significantly and, as a consequence, can have serious impacts on the livelihoods that depend on this sector. These, therefore, would make indigenous communities in the area more vulnerable to impacts that would be occasioned by reduced yield levels against a backdrop of higher risks of climate-induced adversities. The findings from 2010 are, thus, illustrative of the sensitivity of regional agriculture to climatic variations: The total GPP drops by −570 g yr−1 due to the temperature increase in the region. Indeed, this sensitivity is projected to escalate even further in the future, with potential total GPP losses of up to −2500 g yr−1 by 2100 if temperature projections of 3 °C are realized, thus emphasizing the need for urgent and specific adaptive responses aimed at minimizing these effects. These temperature increases could, therefore, exacerbate problems related to water shortages through an increase in rates of evapotranspiration, hence calling for improved methods of water management. Emphasizing sustainable agricultural practices and strengthened socioeconomic frameworks, this study prescribes strong measures that are imperative to ensure the long-term sustainability of food production. This is the point where the programs of community resilience are critical so that they can empower and enable the most vulnerable and marginalized sections of communities to adapt to the effectively emerging adversities. Furthermore, this study emphasizes the need for a cooperative approach to properly address the vast impacts of climate change. It involves the effort of policymakers, stakeholders, and local communities, all pulling toward a common interest guided by informed decisions and strong scientific evidence. This study’s results, therefore, could contribute significantly to the international debate on climatic change adaptation and sustainable development in that it unveils the expected climatic changes and possible effects on food security and agriculture.
Author Contributions
Conceptualization, S.K., A.A.B. and S.K.S.; Methodology, G.M., S.K., S.K.S., S.K.G., P.K. and A.A.B.; Software, S.K.G., B.S. and A.A.B.; Validation, S.K., P.K., A.A.B. and S.K.G.; Formal Analysis, S.K., A.A.B., P.K. and S.K.G.; Investigation, S.K., S.S. and S.K.G.; Resources, S.K. and P.K.; Data Curation, S.K. and P.K.; Writing—Original Draft Preparation, S.K., A.A.B. and S.K.G.; Writing—Review and Editing, S.K.S.; Visualization, S.S., B.S. and S.K.S.; Supervision, S.K. and S.K.S.; Project Administration, S.K.S. All authors have read and agreed to the published version of the manuscript.
Funding
This research received no external funding.
Data Availability Statement
The data are available from the first author on request.
Acknowledgments
We extend our gratitude to the United States Geological Survey (USGS) for supplying the indispensable Landsat data, and to Google Earth Engine for the provision of their robust analytical platform, which significantly facilitated our research. Furthermore, we sincerely appreciate the valuable insights and constructive feedback provided by four anonymous reviewers, whose diligent work and thoughtful suggestions have significantly enriched the quality and depth of this manuscript.
Conflicts of Interest
The authors declare no conflicts of interest.
References
- Sharma, I.; Sharma, V.; Khan, A.; Kumar, P.; Rai, E.; Bamezai, R.N.K.; Vilar, M.; Sharma, S. Ancient Human Migrations to and through Jammu Kashmir- India were not of Males Exclusively. Sci. Rep. 2018, 8, 851. [Google Scholar] [CrossRef] [PubMed]
- Zargar, S.A.; Islam, T.; Magray, J.A. Agricultural Crop Diversity of Kashmir Valley. Biol. Life Sci. Forum. 2021, 2, 30. [Google Scholar] [CrossRef]
- Food and Agriculture Organization of the United Nations (Ed.). The Future of Food and Agriculture: Trends and Challenges; Food and Agriculture Organization of the United Nations: Rome, Italy, 2017. [Google Scholar]
- On-the-brink.pdf. Available online: https://www.actionaidindia.org/wp-content/uploads/2018/06/On-the-brink.pdf (accessed on 12 April 2024).
- Malhi, G.S.; Kaur, M.; Kaushik, P. Impact of Climate Change on Agriculture and Its Mitigation Strategies: A Review. Sustainability 2021, 13, 1318. [Google Scholar] [CrossRef]
- Abbass, K.; Qasim, M.Z.; Song, H.; Murshed, M.; Mahmood, H.; Younis, I. A review of the global climate change impacts, adaptation, and sustainable mitigation measures. Environ. Sci. Pollut. Res. 2022, 29, 42539–42559. [Google Scholar] [CrossRef] [PubMed]
- Trenberth, K.E. Changes in precipitation with climate change. Clim. Res. 2011, 47, 123–138. [Google Scholar] [CrossRef]
- Parrey, H.; Shah, S.; Bhat, M.S. Analyzing Climate Change Manifestations Through People’s Perception In Kashmir Valley, India. J. Adv. Zool. 2024, 45, 819–832. [Google Scholar]
- Nicholson, C.F.; Stephens, E.C.; Kopainsky, B.; Jones, A.D.; Parsons, D.; Garrett, J. Food security outcomes in agricultural systems models: Current status and recommended improvements. Agric. Syst. 2021, 188, 103028. [Google Scholar] [CrossRef]
- Malik, I.; Ahmed, M.; Gulzar, Y.; Baba, S.H.; Mir, M.S.; Soomro, A.B.; Sultan, A.; Elwasila, O. Estimation of the Extent of the Vulnerability of Agriculture to Climate Change Using Analytical and Deep-Learning Methods: A Case Study in Jammu, Kashmir, and Ladakh. Sustainability 2023, 15, 11465. [Google Scholar] [CrossRef]
- Singh, B.K.; Delgado-Baquerizo, M.; Egidi, E.; Guirado, E.; Leach, J.E.; Liu, H.; Trivedi, P. Climate change impacts on plant pathogens, food security and paths forward. Nat. Rev. Microbiol. 2023, 21, 640–656. [Google Scholar] [CrossRef]
- Affoh, R.; Zheng, H.; Dangui, K.; Dissani, B.M. The Impact of Climate Variability and Change on Food Security in Sub-Saharan Africa: Perspective from Panel Data Analysis. Sustainability 2022, 14, 759. [Google Scholar] [CrossRef]
- Mirzabaev, A.; Kerr, R.B.; Hasegawa, T.; Pradhan, P.; Wreford, A.; von der Pahlen, M.C.T.; Gurney-Smith, H. Severe climate change risks to food security and nutrition. Clim. Risk Manag. 2023, 39, 100473. [Google Scholar] [CrossRef]
- Sirilakshmi, Y.; Gogoi, B.P.; Mahapatra, A. Climate Change and Its Impact on Food Security. 2023. Available online: https://www.researchgate.net/publication/376649506_Climate_Change_and_Its_Impact_on_Food_Security (accessed on 20 April 2024).
- Kitole, F.A.; Mbukwa, J.N.; Tibamanya, F.Y.; Sesabo, J.K. Climate change, food security, and diarrhoea prevalence nexus in Tanzania. Humanit. Soc. Sci. Commun. 2024, 11, 394. [Google Scholar] [CrossRef]
- Mekonnen, A.; Tessema, A.; Ganewo, Z.; Haile, A. Climate change impacts on household food security and farmers adaptation strategies. J. Agric. Food Res. 2021, 6, 100197. [Google Scholar] [CrossRef]
- Romshoo, S.; Rashid, I.; Altaf, S.; Dar, G.H. Jammu and Kashmir State: An Overview. In Biodiversity of the Himalaya: Jammu and Kashmir State; Springer: Singapore, 2020; pp. 129–166. [Google Scholar] [CrossRef]
- NASA Earth Exchange Global Daily Downscaled Projections (NEX-GDDP-CMIP6)|NASA Center for Climate Simulation. Available online: https://www.nccs.nasa.gov/services/data-collections/land-based-products/nex-gddp-cmip6 (accessed on 30 April 2024).
- Nazarenko, L.S.; Tausnev, N.; Russell, G.L.; Rind, D.; Miller, R.L.; Schmidt, G.A.; Bauer, S.E.; Kelley, M.; Ruedy, R.; Ackerman, A.S.; et al. Future Climate Change Under SSP Emission Scenarios With GISS-E2.1. J. Adv. Model. Earth Syst. 2022, 14, e2021MS002871. [Google Scholar] [CrossRef]
- Eyring, V.; Bony, S.; Meehl, G.A.; Senior, C.A.; Stevens, B.; Stouffer, R.J.; Taylor, K.E. Overview of the Coupled Model Intercomparison Project Phase 6 (CMIP6) experimental design and organization. Geosci. Model Dev. 2016, 9, 1937–1958. [Google Scholar] [CrossRef]
- Yan, Y.; Xin, Z.; Bai, X.; Zhan, H.; Xi, J.; Xie, J.; Cheng, Y. Analysis of Growing Season Normalized Difference Vegetation Index Variation and Its Influencing Factors on the Mongolian Plateau Based on Google Earth Engine. Plants 2023, 12, 2550. [Google Scholar] [CrossRef] [PubMed]
- Shi, X.; Shi, M.; Zhang, N.; Wu, M.; Ding, H.; Li, Y.; Chen, F. Effects of climate change and human activities on gross primary productivity in the Heihe River Basin, China. Environ. Sci. Pollut. Res. 2022, 30, 4230–4244. [Google Scholar] [CrossRef] [PubMed]
- He, M.; Schwarz, A.; Lynn, E.; Anderson, M. Projected Changes in Precipitation, Temperature, and Drought across California’s Hydrologic Regions in the 21st Century. Climate 2018, 6, 31. [Google Scholar] [CrossRef]
- Abdelhakim, L.O.A.; Zhou, R.; Ottosen, C.-O. Physiological Responses of Plants to Combined Drought and Heat under Elevated CO2. Agronomy 2022, 12, 2526. [Google Scholar] [CrossRef]
- Li, X.; Zou, L.; Xia, J.; Wang, F.; Li, H. Identifying the Responses of Vegetation Gross Primary Productivity and Water Use Efficiency to Climate Change under Different Aridity Gradients across China. Remote. Sens. 2023, 15, 1563. [Google Scholar] [CrossRef]
- Neupane, D.; Adhikari, P.; Bhattarai, D.; Rana, B.; Ahmed, Z.; Sharma, U.; Adhikari, D. Does Climate Change Affect the Yield of the Top Three Cereals and Food Security in the World? Earth 2022, 3, 45–71. [Google Scholar] [CrossRef]
- Kumar, L.; Chhogyel, N.; Gopalakrishnan, T.; Hasan, M.K.; Jayasinghe, S.L.; Kariyawasam, C.S.; Kogo, B.K.; Ratnayake, S. Chapter 4—Climate change and future of agri-food production. In Future Foods; Bhat, R., Ed.; Academic Press: Cambridge, MA, USA, 2022; pp. 49–79. [Google Scholar] [CrossRef]
- Mallareddy, M.; Thirumalaikumar, R.; Balasubramanian, P.; Naseeruddin, R.; Nithya, N.; Mariadoss, A.; Eazhilkrishna, N.; Choudhary, A.K.; Deiveegan, M.; Subramanian, E.; et al. Maximizing Water Use Efficiency in Rice Farming: A Comprehensive Review of Innovative Irrigation Management Technologies. Water 2023, 15, 1802. [Google Scholar] [CrossRef]
- Liu, J.; Ma, X.; Duan, Z.; Jiang, J.; Reichstein, M.; Jung, M. Impact of temporal precipitation variability on ecosystem productivity. WIREs Water 2020, 7, e1481. [Google Scholar] [CrossRef]
- Shayanmehr, S.; Porhajašová, J.I.; Babošová, M.; Sabouni, M.S.; Mohammadi, H.; Henneberry, S.R.; Foroushani, N.S. The Impacts of Climate Change on Water Resources and Crop Production in an Arid Region. Agriculture 2022, 12, 1056. [Google Scholar] [CrossRef]
- Balasundram, S.K.; Shamshiri, R.R.; Sridhara, S.; Rizan, N. The Role of Digital Agriculture in Mitigating Climate Change and Ensuring Food Security: An Overview. Sustainability 2023, 15, 5325. [Google Scholar] [CrossRef]
- Kopeć, P. Climate Change—The Rise of Climate-Resilient Crops. Plants 2024, 13, 490. [Google Scholar] [CrossRef] [PubMed]
- Grigorieva, E.; Livenets, A.; Stelmakh, E. Adaptation of Agriculture to Climate Change: A Scoping Review. Climate 2023, 11, 202. [Google Scholar] [CrossRef]
- Baghi, N.G.; Oldeland, J. Do soil-adjusted or standard vegetation indices better predict above ground biomass of semi-arid, saline rangelands in North-East Iran? Int. J. Remote. Sens. 2019, 40, 8223–8235. [Google Scholar] [CrossRef]
- Suhaeb, F.W.; Tamrin, S.; Jumadi. Community Adaptation Strategies To Climate Change: Towards Sustainable Social Development. Migr. Lett. 2024, 21, 943–953. [Google Scholar]
- Moser, S.C.; Pike, C. Community engagement on adaptation: Meeting a growing capacity need. Urban Clim. 2015, 14, 111–115. [Google Scholar] [CrossRef]
- Rezvani, S.M.H.S.; de Almeida, N.M.; Falcão, M.J. Climate Adaptation Measures for Enhancing Urban Resilience. Buildings 2023, 13, 2163. [Google Scholar] [CrossRef]
- Crimmins, A.; Balbus, J.; Gamble, J.L.; Beard, C.B.; Bell, J.E.; Dodgen, D.; Eisen, R.J.; Fann, N.; Hawkins, M.D.; Herring, S.C.; et al. The Impacts of Climate Change on Human Health in the United States: A Scientific Assessment; U.S. Global Change Research Program: Washington, DC, USA, 2016. [CrossRef]
- Khatibi, F.S.; Dedekorkut-Howes, A.; Howes, M.; Torabi, E. Can public awareness, knowledge and engagement improve climate change adaptation policies? Discov. Sustain. 2021, 2, 18. [Google Scholar] [CrossRef]
- Infrastructure for Agricultue & Rural Development.pdf. Available online: https://www.nabard.org/auth/writereaddata/tender/1110173446Infrastructure%20for%20Agricultue%20&%20Rural%20Development.pdf (accessed on 12 April 2024).
- Shrestha, S.; Mahat, J.; Shrestha, J.; Madhav, K.C.; Paudel, K. Influence of high-temperature stress on rice growth and development. A review. Heliyon 2022, 8, e12651. [Google Scholar] [CrossRef] [PubMed]
- Semenov, M.A.; Halford, N.G. Identifying target traits and molecular mechanisms for wheat breeding under a changing climate. Journal of Experimental Botany 2009, 60, 2791–2804. [Google Scholar] [CrossRef] [PubMed]
- Hatfield, J.L.; Boote, K.J.; Kimball, B.A.; Ziska, L.H.; Izaurralde, R.C.; Ort, D.; Thomson, A.M.; Wolfe, D. Climate impacts on agriculture: Implications for crop production. Agronomy Journal 2011, 103, 351–370. [Google Scholar] [CrossRef]
- Lobell, D.B.; Gourdji, S.M. The influence of climate change on global crop productivity. Plant Physiology 2012, 160, 1686–1697. [Google Scholar] [CrossRef] [PubMed]
- IPCC. Climate Change 2014: Impacts, Adaptation, and Vulnerability. Part A: Global and Sectoral Aspects. Contribution of Working Group II to the Fifth Assessment Report of the Intergovernmental Panel on Climate Change; Cambridge University Press: Cambridge, UK, 2014. [Google Scholar]
- Zhang, S.; Zhang, Y.; Chen, H.; Ren, Z. Effects of high temperature on fruit set and endogenous hormones in tomato. Scientia Horticulturae 2014, 167, 76–83. [Google Scholar]
- Challinor, A.J.; Watson, J.; Lobell, D.B.; Howden, S.M.; Smith, D.R.; Chhetri, N. A meta-analysis of crop yield under climate change and adaptation. Nature Climate Change 2014, 4, 287–291. [Google Scholar] [CrossRef]
- Roudier, P.; Sultan, B.; Quirion, P.; Berg, A. The impact of future climate change on West African crop yields: What does the recent literature say? Global Environmental Change 2011, 21, 1073–1083. [Google Scholar] [CrossRef]
- Siabi, E.K.; Awafo, E.A.; Kabo-bah, A.T.; Derkyi, N.S.A.; Akpoti, K.; Mortey, E.M.; Yazdanie, M. Assessment of Shared Soci-oeconomic Pathway (SSP) climate scenarios and its impacts on the Greater Accra region. Urban Climate 2023, 49, 101432. [Google Scholar] [CrossRef]
Disclaimer/Publisher’s Note: The statements, opinions and data contained in all publications are solely those of the individual author(s) and contributor(s) and not of MDPI and/or the editor(s). MDPI and/or the editor(s) disclaim responsibility for any injury to people or property resulting from any ideas, methods, instructions or products referred to in the content. |
© 2024 by the authors. Licensee MDPI, Basel, Switzerland. This article is an open access article distributed under the terms and conditions of the Creative Commons Attribution (CC BY) license (https://creativecommons.org/licenses/by/4.0/).