Abstract
Scenario analysis is a comprehensive approach to assess the impact of climate-related transition risk on businesses. Environmental, social, and governance (ESG) scores are popular tools with financial institutions (FI’s) for green-scoring practices and since they characterise a company’s performance from an ESG perspective, they have been criticised for enabling “greenwashing” when used within the context of climate risk. Commercially available ESG scores are also available for listed entities, while FI counterparties are often unlisted. This study develops a methodology for creating in-house environmental scores (E-scores), which are then used to effectively choose appropriate transition pathways to be used in company-specific forward-looking scenario analysis. Such scenario analysis can be used to forecast the company’s financial position, including the cost of its greenhouse gas (GHG) emissions, and quantify the impact of transition climate risk on specified metrics. The choice of metrics depends on what the results of the analysis are used for. Two metrics are identified for being useful for risk management and credit decisions: future profitability and weighted average carbon intensity. Finally, the study demonstrates how this process can be implemented with a practical worked example, using only publicly available data.
1. Introduction
1.1. Background
Combining scenario analysis with some form of environmental performance scoring system for appropriate scenario selection is a comprehensive approach to assess the impact of climate-related transition risk on businesses. The Task Force on Climate-Related Financial Disclosures (TCFD) recommendations include requirements for the use of scenario analysis for climate risk measurement because they are so well suited to modelling the interaction of different contributing factors within complex systems [1].
Scenario analysis is a useful tool for both physical and transition climate risk, as well as the combination of the two to analyse stranded asset risk. The types of scenario analysis employed for these different types of climate risks are, however, different. For physical risk, a shorter-term “what if” scenario approach is most relevant to assist with resilience planning. Transition risk requires a longer-term time-series approach to measure the impact of potential changes in policy and strategic initiatives over a span of decades.
Transition risk here refers to the potential negative financial impact on a company (micro-level) because of the world transitioning to a low-carbon economy (macro-level), which is currently a key focus for global regulators and governments.
1.2. Problem Statement
Challenges in using scenario analysis for quantifying climate transition risk include the following key aspects:
- Identifying appropriate scenarios to use at the micro company level;
- Identifying appropriate scenarios to use at the macro national level; and
- Building a scenario analysis model capable of modelling the impact of these micro scenarios on the selected target variables for the company being evaluated, against the backdrop of the macro scenarios.
ESG scores provide a convenient solution to the problem of selecting appropriate scenarios. Since many organisations already have ESG scoring methods in place, and several data providers sell ESG scores on listed entities, a potential solution is to map ESG scores to the different future states. Within the context of this study, with its focus on climate risk, the most important ESG aspect of interest is the environmental aspect. This mirrors the fact that in society and the economy at large, the environmental agenda has become the most important part of the broader drive for sustainability. Within the environmental agenda, climate change-related issues are dominant. The use of ESG scoring methods in finance for climate risk management, lending, and investment purposes has recently come under scrutiny and has been criticised for being misleading and for its potential to enable so-called “greenwashing”.
Firstly, since ESG scores evaluate a company’s performance in environmental, social, and governance aspects, they could hide a company’s poor performance relating to the environment. Scoring high on the Social and Governance aspects would raise the overall score, even if the company scores poorly on the environmental aspects. Secondly, if the ESG scores are purchased from a data vendor, this issue could be exacerbated by the weights applied to different aspects on the scorecard, which the buyer of the scores does not have visibility of, since all the vendors use their own proprietary models (the so-called “black box” problem).
1.3. Motivation and Contribution
This study addresses these challenges using free, publicly available data and scenarios. Rather than focusing on specific categories of transition risks like policy and regulatory changes, technology shifts, and reputational risk, the study develops a scoring methodology that captures the company’s position on a broad range of environmental aspects, and then maps the outcome to one of three different potential future states, each associated with its own set of future scenarios: a slow transition with gradual policy changes, a delayed but rapid transition to renewable energy, or a scenario where regulatory pressures are low.
The scenarios chosen for the company are modelled against the backdrop of the independent scenarios chosen for the macro environment in which the company operates. Such scenario analysis can then be used to forecast the company’s financial position, including the cost of their GHG emissions, and quantify the impact of transition climate risk on specified metrics. The choice of metrics will be determined by what the results of the analysis will be used for. In this study, the chosen metrics are future profitability and weighted average carbon intensity, both of which would be useful for risk management and credit decisions.
In response to the valid criticisms against the use of ESG scores, an E-Score methodology—based on how well a company is aligned to the United Nation’s environment-related Social Development Goals (SDGs)—is first developed. Then, these E-Scores are mapped to potential future states and associated scenarios to be used at the microeconomic company-level.
For selecting the appropriate macro scenarios, this study will map the national government’s stated support for the Paris Accord, as well as the progress made towards achieving the goals of the Paris Accord, to the different future states and associated scenarios. Figure 1 sets out the process at a high-level. This will be developed and demonstrated using a practical use case in this study.
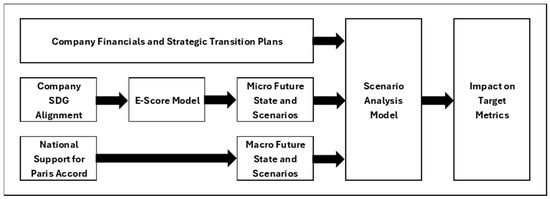
Figure 1.
High-level process flow. Source: Authors.
1.4. Paper Structure
The remainder of the paper is structured as follows: Section 2 gives the results of the literature review, which highlights the urgency of the problem and the need for practical solutions as developed in this study. Section 3 describes the data used and the methodology developed in this study. Section 4 gives a detailed discussion of the results of the study. Finally, Section 5 delivers the conclusions derived from the study and the recommendations for further research.
2. Literature Review
Climate risk poses significant threats to life on Earth and the global economy, but despite this, it is still underestimated by many. In its 2017 Final Report, the TCFD stated that “One of the most significant, and perhaps most misunderstood, risks that organisations face today relates to climate change.” [1]. Many organisations incorrectly perceive the implications of climate change to be long-term and irrelevant to decisions made today.
Climate risk is the biggest challenge faced by the current generation. The need for drastic and internationally coordinated climate risk adaptation and mitigation is urgent. The Intergovernmental Panel on Climate Change (IPCC) makes this clear in their latest assessment report [2]: “Climate change is a threat to human well-being and planetary health (very high confidence). There is a rapidly closing window of opportunity to secure a liveable and sustainable future for all (very high confidence). Climate resilient development integrates adaptation and mitigation to advance sustainable development for all and is enabled by increased international cooperation including improved access to adequate financial resources, particularly for vulnerable regions, sectors and groups, and inclusive governance and coordinated policies (high confidence). The choices and actions implemented in this decade will have impacts now and for thousands of years (high confidence).”
The Paris Agreement, a legally binding international treaty on climate change, was adopted by the international community at the 2015 Conference of the Parties (COP) 21 in Paris, with the overarching goal to hold “the increase in the global average temperature to well below 2 °C above pre-industrial levels” and pursue efforts “to limit the temperature increase to 1.5 °C above pre-industrial levels.” [3]. It became the golden standard for transitioning to a low-carbon economy. The IMF backed this up in 2019 by producing a guide on fiscal policies that governments could implement in support of the Paris Agreement [4]. In recent years, world leaders have stressed the need to limit global warming to the lower limit of the Paris Agreement goals, i.e., 1.5 °C by the end of this century, because the UN’s Intergovernmental Panel on Climate Change has shown that crossing the 1.5 °C threshold risks unleashing far more severe climate change impacts, including more frequent and severe droughts, heatwaves, and rainfall [2]. To limit global warming to 1.5 °C, greenhouse gas emissions must peak before 2025 at the latest and decline 43% by 2030, which further stresses the need for immediate action on a global scale. This increased urgency in the transition to a low-carbon economy naturally implies increased transition risk and the urgency of effectively measuring and managing this risk.
Indeed, business leaders, governments, and regulators around the world are increasingly concerned about the potential systemic risks posed by climate change. In its Global Risks Report 2023 [5], the World Economic Forum listed climate risk as the second largest risk over a two-year period, and the largest risk for the coming decade. Of the top 10 risks for the next 2 years, 50% are climate risks, and out of the top 10 risks for the coming decade, 60% are climate-related, with climate risk claiming the top 4 spots [5]. This increased concern amongst global stakeholders is further emphasised by the increasing cooperation between the public and private sectors to support the goals of the Paris Accord, which for the banking industry, is evidenced by [6,7,8].
Since banks play such pivotal roles in the economy, adaptation and risk mitigation to climate change for banks are crucial to not only safeguard the stability of the financial system, but also to help drive the transition to a low-carbon economy in all other sectors and, importantly, across all regions. In its 2023 Global Financial Stability Report [9], the IMF says that a major share of the large climate mitigation investment needs in EMDEs will have to be covered by the private sector, and that the financial sector needs to play a key role in this.
Climate risk has the potential to impact the financial sector through two primary channels: climate physical risk, involving extreme weather events leading to physical capital destruction, and climate transition risk, which refers to the disorderly implementation of climate policies causing a sudden revaluation of entire pools of asset classes [10]. Quantitative assessments, such as the climate stress test proposed by [11], indicate that individual investors face substantial exposure to losses from climate transition risks which could be amplified through network effects. Climate transition risk may also manifest in the credit market, affecting economic agents through financial contracts like loans, thereby influencing the debt performance of firms and households and impacting the financial stability of banks [12].
Regulators around the world have been grappling with climate risk and are in various stages of bank regulation and private sector consultation. The BOE is seen as the global leader, closely followed by the EBA. Mark Carney set the scene in 2015 with his speech titled “Breaking the Tragedy of the Horizon–Climate Change and Financial Stability”, in which he warns of the threats posed by climate risk to the stability of the financial system [13]. The UK PRA was the first financial regulator to publish a set of supervisory expectations on the management of climate-related financial risk in 2019 and expressed its expectation again in a January 2022 “Dear CEO” letter that banks integrate climate risks into their risk management and decision-making processes. The PRA and EBA both expect banks to actively identify and manage their climate-related risks, with potential Pillar 2 capital charge implications for weak performance in this area [14].
A BCBS survey in 2020 found that out of 27 regulatory jurisdictions, only six have issued supervisory guidance on the treatment of climate-related financial risks [15], which clearly points to the complexity of the issues at hand. This is further underscored by a 2023 IFC survey, in which only 47% of financial institutions were found to have some form of climate-related strategy in place, citing challenges such as scarcity of data to inform decisions, inadequate regulation and shortages of funding [16]. The expectation of increased future regulation directly translates to increased transition risk.
This is also the case with the expected increase in national policy responses to climate change. Government agencies have also been coming to grips with climate risk, often partnering with the private sector and international partners. A good local example of this is the DRAFT–June 2021 Sustainable Finance Handbook for South Africa, which was delivered by the Carbon Trust to the members of the South African National Treasury Sustainable Finance Working Group, chaired by the Johannesburg Stock Exchange and supported by BASA and ASISA as co-chairs [17]. Development of the Handbook was supported by Deutsche Gesellschaft für Internationale Zusammenarbeit (GIZ) GmbH and the IFC, a member of the World Bank Group [17]. Another example is the development of the South African Green Finance Taxonomy 1st edition, in 2022, by the South African National treasury, in cooperation with the IFC, the Swedish International Development Cooperation Agency, the Carbon Trust and the National Business Initiative [18].
Climate risk transmits to balance sheets via the real economy and crystalises in the traditional risk types as follows: credit risk, market risk, liquidity risk, operational risk, regulatory and legal risk, and reputation risk. For banks, their degree of exposure to these risks posed by climate change is determined by the degree to which their funded customers are exposed. Since banks play the role of financial intermediaries in the economy, their balance sheets are particularly exposed. Indeed, in its 2021 implementation guidelines, the TCFD gave specific supplemental guidance for banks to consider characterising their climate-related risks in the context of traditional banking industry risk categories [19].
Disclosure of climate-related financial information as recommended by the TCFD has become essential for transparency and is increasingly being considered a best practice in the financial industry, and the use of scenario analysis for climate risk is one of the TCFD’s key recommendations. The TCFD also published their guidance on climate-related metrics, targets, and transition plans, which includes a specific section on Scope 3 emissions, which are the most important type for banks [20]. Decarbonising their portfolios requires banks to have the ability to evaluate their corporate counterparties’ exposure to transition risk, which is the key focus of this study.
Ref. [21] emphasise the complexities of the transition to a low-carbon economy, highlighting its uncertainty and the need for economic actors to anticipate associated risks and opportunities. The authors advocate the use of scenarios, especially transition scenarios, as plausible representations of uncertain future states to understand medium- and long-term challenges. Key concepts related to climate-related scenarios are explained, categorising them into three families: transition scenarios, climate change scenarios, and climate impact scenarios. Transition scenarios explore possible low-carbon transitions, considering factors like climate targets, socio-economic changes, and mitigation solutions. The interpretation of these scenarios requires attention to the assumptions and model characteristics involved in their construction.
Ref. [22] discuss transition risk assessments in portfolios. They highlight the historical development of transition risks in climate-related financial disclosure frameworks and emphasise the need for analytical clarity. The proposed minimum requirements for disclosure include a focus on forward-looking financial impacts on counterparties resulting from the low-carbon transition. Disclosure should provide information on short and distant time horizons for risk analysis, aligning with operational and strategic time horizons. Transition impacts occur over the long-term, but their consequences can materialise in the short-term. Material risks must be considered over various time horizons and criteria used for risk selection, data sources, and potential gaps should be clearly established. The choice of technical parameters and indicators must be clarified to interpret analysis.
Ref. [23] investigated climate transition risk metrics and their impact on financial markets, recognising climate risks as financial risks. The analysis covers 69 transition risk metrics from nine providers, focusing on 1500 firms in the MSCI World index. The results reveal higher convergence among metrics for firms with greater exposure to transition risk. Metrics with similar scenarios were found to demonstrate more consistent risk assessments. Variables related to metric assumptions and scenario characteristics influence estimated transition risk changes. Implications of the work include the potential for coherent market pricing signals, the need for supervisory authorities to establish a baseline approach for comparability, and the importance of researchers justifying metric choices and interpreting findings considering the assumptions made.
Ref. [24] asserted that the assessment and handling of transition risks and opportunities are challenging due to the “deep uncertainty of the low-carbon transition”. This complexity arises from the difficulty in foreseeing the intricate and unprecedented dynamics that may unfold during the shift to a low-carbon system, posing uncertainties about how these dynamics might affect financial institutions. The deep uncertainty is marked by the inability to estimate an objective probability distribution of potential outcomes.
In response to growing expectations from disclosure frameworks, various methodologies based on scenarios have been developed to assist financial actors in assessing their exposure to transition risks and opportunities, as well as analysing the alignment of financial portfolios with a low-carbon trajectory. These methodologies, primarily created by service providers, have been widely used by financial institutions for climate-related disclosures and supervisory stress-testing exercises. The disclosed information on scenario analysis, however, has been criticised for its lack of quality, disappointing observers, financial regulators, and supervisors. The reported limited transparency regarding key assumptions and overall rationale of the analytical tools has raised concerns about the effectiveness of current scenario-based risk analyses in exploring the deep uncertainty of the low-carbon transition. Doubts also linger about how these analyses contribute to improving information on transition risks and opportunities for disclosure and internal decision-making processes [24].
The authors also examined the importance of scenario analysis as a valuable tool for financial institutions to integrate “deep uncertainty” into the management of transition risks and opportunities. Various factors (policies, technological innovations, and behavioural changes) are considered, and it is suggested that the exploration process should encompass different types of financial impacts, impact propagation channels, and time horizons. A forward-looking mindset and the integration of complex dynamics across sectors, emphasising the interconnected nature of transition impacts is advised [24].
Finally, in developing a practical approach for banks to evaluate the level of climate transition risk that their corporate counterparties are exposed to, this study will make extensive use of the wealth of contributions that the NGFS have made to the field, most notably when it comes to scenario analysis. Climate risk is, by nature, best managed in a strategic forward-looking manner, in other words, with scenario analysis. In addition to the comprehensive sets of sector-specific climate scenarios that the NGFS has developed [25], which are especially well-suited to transition risk, they have also published many articles to give guidance to regulators and financial institutions on dealing with climate risk. Some recent articles include “Nature-related Financial Risks: A Conceptual Framework to guide Action by Central Banks and Supervisors” [26], “NGFS Survey on Climate Scenarios Key findings” [27], and “Stocktake on Financial Institutions’ Transition Plans and their Relevance to Micro-prudential Authorities” [28].
The literature study clearly demonstrates how the urgency of climate risk management and the various stakeholders’ awareness of the urgency have progressively intensified over the years. The actual and perceived urgency to deal with the consequences of climate change is at critical levels and companies need practical tools and methodologies to address these issues. This study contributes to the solution by developing such a tool and methodology for practical deployment, using freely available data and commonly used software.
3. Data and Methodology
3.1. Data
The methodology developed here uses free, publicly available data. The reasons for this are two-fold. Firstly, it adds credibility. If the data are published on a publicly accessible platform, such as the company website, it shows that the board of the company has publicly committed to the data and are willing and able to be held accountable in the public eye. Secondly, it creates transparency. Since the data are publicly available, they can be used by anyone without any proprietary or cost barriers. The proposed methodology could still be used with non-public data, as would be the case where a relationship manager sources the information directly from a smaller counterparty, as long as the credibility issues that this creates are understood. This study employs only publicly available data.
To create a baseline for the analysis, the latest company financials are sourced from the company website. The specific financial data and their granularity are determined by the objective of the analysis and the chosen target metrics. The objective is to determine the impact of transition risk on profit and on the weighted average carbon intensity, which is defined as the CO2 equivalent emissions normalised by profit. Since the objective is to isolate the impact of transition risk, which is driven by emissions, on these target variables, it is not necessary to model the entire income statement, but rather a subset of income statement items that are relevant to the specific objective. In this case, that means turnover, cost of production, and depreciation of production capital since all these items could be impacted by price and emissions of energy. Also, it is not necessary to model the cash flow statement or balance sheet, with the exception that planned future capital expenditure climate risk adaptation will have to be accounted for to model the correct depreciation and amortisation of production capital.
The required granularity of the data being sourced is also determined by the objective of isolating the impact of transition risk. Since transition risk is directly linked to emissions, and emissions stem from the use of energy, the required financial data should be differentiated by energy type. If the resulting model is to be used for resource companies that create turnover from selling types of energy resources, this differentiation should include turnover. It is postulated by the authors that using the following categories should provide adequate granularity for most cases in the data being modelled: non-energy related, coal, gas, fuels, electricity, wind, solar, hydrogen, and nuclear.
The current emissions data are sourced from the company’s climate-related financial disclosures. It is recognised by the authors that there are persistent challenges with regards to the consistency, breadth, and cross-comparability of emissions data. Considerable progress has been made in standardising climate-related financial disclosures, with most jurisdictions gravitating towards TCFD (ISSB) recommendations [29]. Compliant companies’ disclosures of their emissions data, as well as their strategic adaptation and transition plans, can usually be found on their websites in the form of an official transition plan, or as part of a broader ESG report. One of the current shortcomings of reported emissions data is that not all companies report all the scopes of emissions, including Scope 1, Scope 2, and Scope 3, with Scope 3 the most challenging to account for. Figure 2 describes the different scopes of emissions.
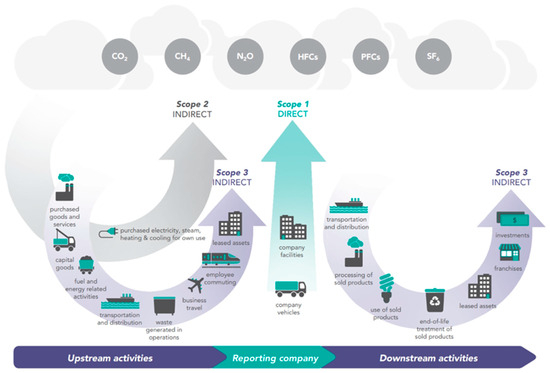
Figure 2.
Different emission scopes. Source: Reprinted with permission from GARP [30].
The materiality principle can be used to determine the extent to which a lack of Scope 2 and Scope 3 data impacts the credibility of the scenario analysis. Companies in different sectors tend to have most of their emissions concentrated in either Scope 1 or Scope 3. For example, utility companies such as Eskom (South Africa’s national electricity utility that provides approximately 95% of electricity used in South Africa, as well as a substantial share of the electricity generated on the African continent, but suffers from mismanagement, waning infrastructure, and heavy reliance on coal) will have most of their emissions concentrated in Scope 1, whereas resource companies supplying fossil fuels to downstream customers will have predominantly Scope 3 emissions. For the results of the analysis to be credible, the scope of emissions where most of the company’s emissions are concentrated should at least be captured. Ideally, though, all three scopes should be included in the analysis.
Scenarios are sourced from the latest set of GCAM 6.0 NGFS scenarios, as published by NGFS on their Phase 4 Scenario Explorer (NGFS, 2023). Relevant scenarios will be selected from the Below 2 °C, Delayed Transition, or Current Policies sets of sector-specific scenarios, depending on the mapped micro- and macro-level context.
Finally, since commodity market prices, the carbon price, and the monetary NGFS scenarios are all quoted in USD, the current and forecasted exchange rates are required. The spot FX rate is easily obtainable, but the correct forecast to use is less obvious, especially given the fact that transition risk scenario analysis spans a long period, typically decades. Any forecast of FX rates that far into the future will undoubtedly turn out to be inaccurate. This study will demonstrate the impact of FX rate changes on the analysis using three different FX scenarios: The first is a flat scenario throughout at the current FX rate, designed to isolate the impact of climate change only, and which will be used for the base case scenario. The second and third scenarios are where the FX rate increases and decreases, respectively, throughout the forecasting period.
3.2. Methodology
A transition risk scenario analysis model was built in Excel, according to the methodology described in this section. The model itself is not shown but is used to provide the results of the practical case study. Since each company, sector, and national jurisdiction have their own intricacies, the aim is not to build a one-size-fits-all model, but to use the methodology described below to build models to suit the needs of the user.
Two metrics were chosen by design because they directly link climate transition risk to financial performance via the cost of carbon and, therefore, are useful for linking transition risk to credit decisions. The first metric, , is defined as operating profit less depreciation and amortisation of production capital, less carbon tax. Defining in this way allows the impact of transition risk on profitability to be isolated. Therefore, for each period , with 0 being the baseline period and 1 through being the scenario forecast periods, can be written as:
where:
- = target metric 1 for period ;
- = turnover for period ;
- = cost of production for period ;
- = depreciation and amortisation for period ; and
- = carbon tax for period .
Factoring in the required granularity of the data, for each category {non-energy related; coal; gas; fuels; electricity; wind; solar; hydrogen; nuclear}, (1) can be rewritten as:
where:
- = turnover for period and category ;
- = cost of production for period and category ;
- = depreciation and amortisation for period and category ; and
- = carbon tax for period .
Since turnover is calculated as volume times price and carbon tax is emissions times the applied cost of carbon, (2) can be rewritten as:
where:
- = volume for period and category ;
- = price for period and category ;
- = total taxable CO2e emissions (CO2e (carbon dioxide equivalent) measures the number of metric tons of CO2 emissions with the same global warming potential as one metric ton of another greenhouse gas) for period ; and
- = cost of carbon for period .
The second metric, , is defined as weighted average carbon intensity, which is emissions normalised by profit, and expressed in CO2e/M ZAR, i.e., as:
where = total reported CO2e emissions for period .
For each period where it follows that the forecast values for , and are required to calculate values for the target metrics and . Forecast values are calculated sequentially, period by period, from the baseline position, by adjusting the previous period’s value up or down in line with the relevant scenario values. For each and , the following relationship is, therefore, used:
where = NGFS scenario value for period of the scenario applied to variable .
For this study, the scenarios are sourced from the GCAM 6.0 NGFS scenarios for South Africa, by choosing the most appropriate NGFS variable corresponding to the value of X and then using that NGFS variable’s scenario from the mapped NGFS scenario set, in other words the Below 2 °C, Delayed Transition, or Current Policies sets of sector-specific scenarios. It should be noted that this methodology can be adapted to analyse companies in other countries by sourcing the scenarios from the GCAM 6.0 NGFS scenarios for that specific country. The chosen NGFS variables will depend on the specific case at hand and requires the modeller to work through the NGFS variables to choose the most appropriate variable. The NGFS scenario mapping, on the other hand, is achieved using mapping tables.
At the macro-level, the mapping is straightforward, and only requires two inputs, both of which are easily obtainable. The first is whether the national government supports the Paris Accord, or not. The second is whether the commitment is on schedule, or behind schedule. With this information at hand, the macro NGFS scenario set is mapped according to Table 1.

Table 1.
Macro-level (country) mapping. Source: Authors.
At the micro-level, the mapping is not straightforward. It requires the company to be scored in some way and then to link the score to an NGFS scenario. In this study, an E-Score methodology has been developed based on the United Nation’s SDGs. Of the 17 SDGs, five are directly related to the environment. By studying the nature and intent of the list of targets associated with each SDG, the authors have distilled a company-level focus area for each SDG, as per Table 2.

Table 2.
Environment-related SDGs with derived company-level focus. Source: Authors.
Each SDG’s list of targets has further been distilled into five company-level actions or metrics that the company can be scored on to determine how well it supports the SDG. In this study, the score is between a minimum of 0 and maximum of 100. The average of the five metric scores per SDG is the company’s SDG score, and the average of the five SDG scores is the company’s E-Score. The last column in Table 2 gives an example of this, which are the results of applying (6) and (7) below to the case study in Section 4.
Note that whereas SDG13 is relevant to all companies, the relevance of the other four SDGs will depend on the nature and locations of the company’s operations. Non-relevant SDGs should be excluded from the average so as not to penalise a company for scoring poorly on an SDG that is irrelevant to that company. Also, in this study all SDGs are deemed equally important, but depending on the objective of the analysis, the modeller may want to apply weighted averages, both within each SDG and between SDG’s. Each SDG score () can, therefore, be written as:
where:
- = supportive company-level action score for ; and
- = weight applied to , with .
Using (6), the final E-Score is:
where:
- = the number of relevant SDGs; and
- = the weight applied to , with .
Once the E-Score has been determined, upper and lower bounds can be used to map the E-Score to different future states and NGFS Scenario sets. Table 3 sets out the mapping used in this study. Once the appropriate NGFS scenario set has been mapped, it may be used along with the appropriate NGFS variables to extract scenarios to be used for forecasting each of the variables in .

Table 3.
Micro-level (company) mapping. Source: Authors.
4. Results and Discussion
Using the above methodology, an Excel scenario analysis model was built to quantify the chosen metrics, and as described above in (3) and (4), for Exxaro Resources Limited, a mixed resources South African company. All information used is publicly available on Exxaro’s website in the form of their financial statements and their ESG report [31,32].
Whereas most of their current revenue comes from mining coal and selling it to Eskom, their long-term strategic plan is to transition to clean energy. Exxaro operate wind farms, selling electricity to Eskom, and are developing solar operations which are planned to go live in 2026. They have publicly committed to net-zero by 2050 and have a credible transition plan in place to achieve it. They disclose all three scopes of emissions in line with TCFD recommendations, and as expected, as a resource company, most of their emissions are Scope 3 emissions. Even so, they have further demonstrated their commitment to sustainability by building a state-of-the-art headquarters with a 6 Star Green Star rating from the Green Building Council of South Africa (GBCSA). They have been awarded numerous accolades for their ESG performance and reporting, including a 4/4 ranking from the Transition Pathway Initiative (TPI) and an ESG A rating from MSCI.
Exxaro impacts only three of the five environmental SDG listed in Table 2. They are SDGs 7, 13, and 15. Since mining operations are water resource intensive, and Exxaro has a water stewardship programme in place according to their ESG report, it is reasonable to also score Exxaro at SDG 6. The results below are the result of an E-Score based on four relevant SDGs: 6, 7, 13, and 15.
Unless otherwise stated, the results are based on a flat USDZAR FX rate and carbon tax being levied against Scope 1 emissions only. The impact of this is shown in Section 4.6.
4.1. Macro Scenario Mapping
South Africa supports the Paris Accord and has various initiatives in place to support its goals. As with all developing countries, South Africa’s success in achieving net-zero by 2050 will depend largely on the success of international efforts to facilitate the flow of funds from wealthy nations to poor and developing countries to finance the required changes, but also on local politics. A case could be made that South Africa has already fallen behind on the net-zero pathway, but the same could be said for most countries. Therefore, the base case position of this study is that South Africa is committed and aligned to the Paris Accord, and the macro scenarios will be selected from the NGFS Below 2 °C set.
4.2. E-Score and Micro Scenario Mapping
As shown in Table 4 and Table 5 and Figure 3, the results of the E-Score and NGFS scenario mapping exercise for Exxaro yielded an E-Score of 70 and the Delayed Transition NGFS scenario set. The biggest lagging factor in them achieving a Green E-Score status (>75) was SDG 7. Although Exxaro’s stated strategic imperative is to transition to renewables and achieve net-zero by 2050, renewables are currently a small part of their revenues and portfolio, and significant action and investment will be needed for them to achieve their goals. This is what is captured in the scenario analysis under the delayed transition scenario set, where action is slow or delayed until 2030, and then significantly ramped up to play catchup and still achieve net-zero by 2050.

Table 4.
Company E-Score summary. Source: Authors.

Table 5.
Company E-Score to NGFS scenario mapping. Source: Authors.
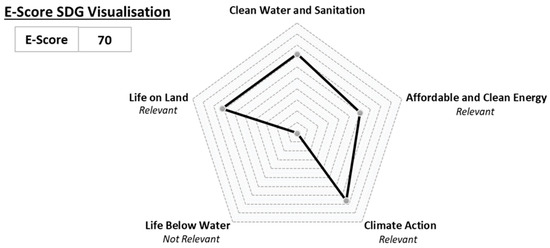
Figure 3.
E-score SDG Visualisation. Source: Authors.
This also demonstrates the benefit of using an E-Score instead of an ESG score. An ESG score can hide such lagging environmental impacts if the company also performs well on the Social and Governance aspects, as is the case with Exxaro. If, instead of the calculated E-Score, the MSCI ESG A grade rating is used in the mapping table, then it would map to a green NGFS Below 2 °C scenario set, which the authors believe to be inaccurate given Exxaro’s current share of renewables.
4.3. NGFS Scenario and Variable Selection
Table 6 presents NGFS scenarios and variables for categories required for base case scenario analysis:

Table 6.
Base case scenario builder. Source: Authors.
The sub-categories in the first column and scenario levels in the second column are linked to the required scenarios for each of the variables in variables in as follows:
- is the volume scenario at the micro-level, under the assumption that Exxaro can control its own output;
- is the price scenario at the macro level, assuming that prices are driven by market and policy-driven factors, outside the control of Exxaro;
- corresponds to the volume scenario at the micro-level, assuming that production costs, all other things being equal, is correlated with production volume;
- is the capex scenario at the micro-level, under the assumption that depreciation and amortisation, all other things being equal, is correlated to Exxaro’s capital expenditure required to achieve the goals of the scenario;
- is the emissions scenario at the micro-level and uses the Kyoto Gases set of NGFS variables to ensure that all types of emissions are captured in the total as CO2 equivalents;
- is the macro-level price of carbon scenarios because carbon tax levels are determined by government policy.
4.4. Base Case Scenario Analysis
The base case scenario results for target variables and are shown in Figure 4. It is important to note again what scope of emissions are included in each of the two metrics, since transition risk is driven by emissions. includes the narrowest scope, Scope 1, while includes the broadest scope, the total of Scopes 1, 2, and 3. This has important implications when interpreting the results of the scenario analysis.
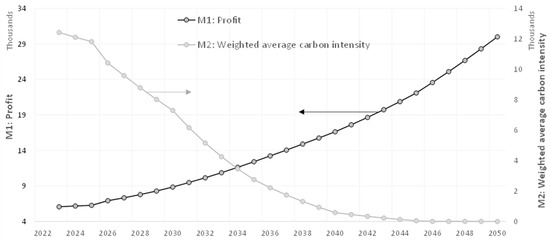
Figure 4.
Base case scenario results for and . Source: Authors.
as defined in (3) captures the impact of the drive toward net-zero through the scenarios used for all the terms of the formula, but the risk is mainly embodied in the last term, where total taxable emissions, in this case Scope 1 emissions, are multiplied by the cost of carbon, or in this case, carbon tax. Therefore, although different scenarios would have an impact on through its impact on changing volumes and prices, the transition risk is mainly either the extent to which the company is unable to achieve their planned reductions in Scope 1 emissions, or the extent to which future government policy changes in relation to the level and scope of carbon tax, or both.
The company has no direct control over government policy. Therefore, the real risk is sudden policy shifts like the removal of current tax relief measures, or an increase in the currently modest level of taxes, or even worse, the inclusion of Scopes 2 or 3 emissions in the tax calculation. The company can, however, control their own transition to a low-carbon state, which is their only viable hedge against transition risk. The extent and speed of that transition can be regarded as the effectiveness of their hedge against transition risk, and this is what is measured by which, as per (4), measures their total Scopes 1, 2, and 3 emissions for every ZARmn of .
Figure 5 puts this into context by showing alongside the ZAR price of carbon for the same period.
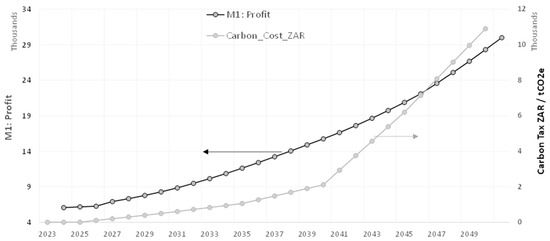
Figure 5.
profit and the price of carbon. Source: Authors.
Figure 5 shows that, even though carbon tax increases significantly over time, Exxaro is still steadily increasing its profit over time. There are several reasons for this, including their phase-out of carbon-intensive coal and increasing phase-in of renewables, which grows significantly in both demand and price in future periods. In other words, they are managing the risk on one hand (emissions) while pursuing profitable new opportunities on the other hand (renewable energy), which allows them to not only remain profitable in the face of massively increasing carbon tax, but to thrive.
Another reason for their increasing profitability is the fact that carbon tax is applied to Scope 1 emissions only, which in their case is initially a small portion of their overall emissions, which is predominantly concentrated in Scope 3. Therefore, depending on where along the timeline it happens, Exxaro’s tax burden would increase significantly if carbon tax policy were to change to include Scope 3 emissions. As shown in Figure 6, however, they are effectively hedging themselves against such an event by steeply reducing by 95% by 2040, which is the point where carbon tax levels start to increase steeply.
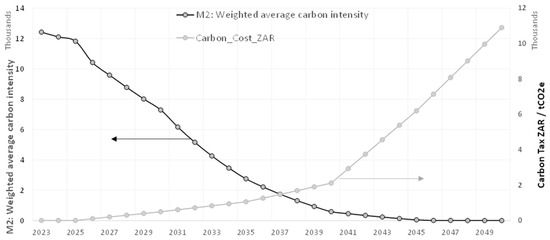
Figure 6.
weighted average carbon intensity and the price of carbon. Source: Authors.
4.5. Alternative Scenarios
The results given above are the expected results for the base case set of scenarios, as derived from the company’s E-Score. It is useful to get a sense of how these results compare to the range of possible outcomes for the scenarios under investigation. One way of doing this, is to run all possible combinations of micro and macro scenarios and to present the results in a matrix. Doing this provides a birds-eye view of the risk if the future reality diverges from the expected scenarios.
The results can be summarised in the matrix in several ways. For the purposes of this study, the results are presented as annual averages over the scenario horizon. Figure 7a and 7b show the results for both and .
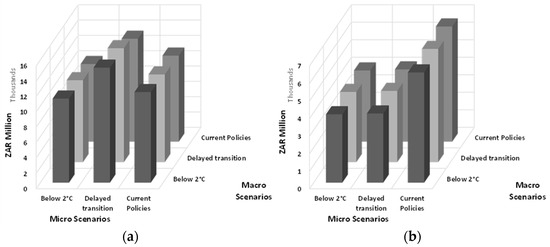
Figure 7.
(a): average annual all scenarios. (b): average annual all scenarios. Source: Authors.
Figure 7a shows that for all three macro scenarios (the part Exxaro cannot control), the Delayed Transition micro scenario (the part they can control) yields the highest average annual profitability. This makes sense because under the Delayed Transition micro scenario, Exxaro maximises their benefit from the short-term resilience of fossil fuels and the long-term growth in international demand and prices of renewables. Carbon tax on their limited Scope 1 emissions does not impact them materially under any of the macro scenarios.
Figure 7b shows that for all three macro scenarios, the Current Policies micro scenario yields the worst weighted average carbon intensity position, close to double the other two scenarios. This makes sense since they do not try to limit their emissions at all under this scenario. Since the level of represents the extent to which they are exposed to sudden policy shifts, as well as, it should be noted, reputational risk, the current policy scenario is the worst possible position for them to be in. The lowest average is achieved under the Below 2 °C micro scenario but is followed closely by the Delayed Transition micro scenario.
Combining the results from Figure 7a,b, Exxaro’s current base case expectation of a Delayed Transition micro scenario is the best possible position for them to be in from a risk and reward perspective.
4.6. Impact of Scope and Exchange Rates
In all the results shown thus far, carbon tax was only levied on Scope 1 emissions and the USD/ZAR FX rate was kept flat. The impact of changing FX rates and tax policy related to scope of emissions has been examined for three FX scenarios and three scope scenarios, all modelled under the base case expected future state scenarios. The FX scenarios are flat at the spot rate, weakening by 2.5% per annum throughout, and strengthening by 2.5% per annum. Figure 8 shows the FX scenarios used.
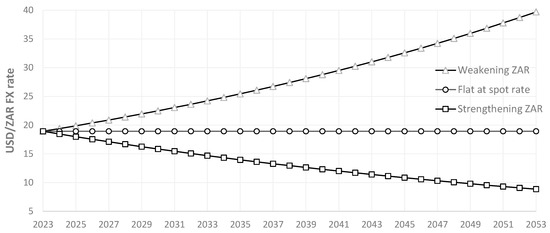
Figure 8.
USD/ZAR FX scenarios. Source: Authors.
The scope scenarios include carbon tax being applied to Scope 1 emissions only (base case); Scope 1 and 2 total emissions; and Scope 1, 2, and 3 total emissions. The latter is unlikely to become policy soon due to the considerable impact it will have on the economy, but it is an option available to policy-makers and, therefore, a risk to which companies with high levels of Scope 3 emissions are exposed.
Note that in contrast to the science-based NGFS scenarios used in the rest of the study, these scenarios are entirely theoretical and have only been included to demonstrate the possible impact that these changes could have. The results are summarised in a grid of all possible combinations of FX and scope scenarios. Since the impact of changes in FX rates and scope tax policy will mainly be felt via the carbon tax impact and, therefore, profit, is the most appropriate metric to use for the results, which are shown in Figure 9.
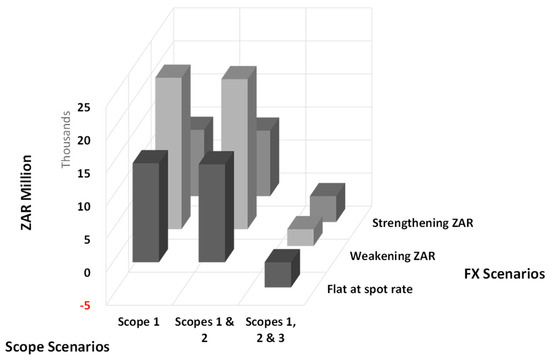
Figure 9.
Scope and FX scenarios, average annual . Source: Authors.
Unsurprisingly, the results show an average annual loss across all three FX scenarios when Scope 3 emissions are included in the tax calculation, since Exxaro’s total emissions are concentrated there. For both Scope 1 and total Scope 1 and 2 emission scenarios, however, where Exxaro’s emissions are small in comparison, there is significant variance in the results across the three FX scenarios. The question remains whether this FX rate-induced volatility should be captured in the analysis, since such long-dated FX forecasts are bound to be inaccurate. Given the long-dated nature of transition risk, it is potentially more useful to isolate the impact of climate risk by keeping the FX rate constant.
5. Conclusions and Recommendations
5.1. Conclusions
This study has demonstrated the effectiveness of combining E-scores with scenario analysis to evaluate the impact of transition risk on corporate client performance. The methodology developed in this study uses publicly available data and Excel to create in-house environmental scores and forecast the company’s financial position, including the cost of their greenhouse gas emissions.
It does so by mapping the government’s support for, and progress towards achieving, the Paris Accord goals to an NGFS future state macro scenario and the company’s E-Score to a set of NGFS scenarios to be used at the microeconomic company level. The company-level scenarios are run against the backdrop of the macro scenario, which determines the values of macro variables like price and carbon tax. The result is a time series of annual results over the scenario horizon that are used to calculate the impact of transition risk on the company being evaluated.
The methodology was demonstrated with a practical case study of Exxaro Resources Limited, which showed that the company is effectively managing transition risk by reducing their emissions and pursuing profitable new opportunities in renewable energy.
5.2. Recommendations
- Financial institutions should consider using E-scores and scenario analysis to evaluate the impact of transition risk on their corporate clients;
- Further research should be performed on refining and calibrating E-Score methodologies and scenario mapping;
- Companies should disclose their full emissions data and strategic adaptation and transition plans to increase transparency and credibility;
- Companies should actively manage their transition risk by both reducing their emissions and pursuing new and profitable opportunities;
- Regulators and governments should continue to support the transition to a low-carbon economy through appropriate policy and regulatory changes;
- Further research and development of methodologies for evaluating transition risk should be encouraged to improve the accuracy and effectiveness of risk management.
Author Contributions
R.v.d.W., G.v.V., J.L. and T.V.; methodology, R.v.d.W.; software, R.v.d.W. and J.L., validation, G.v.V. and T.V.; formal analysis, R.v.d.W.; investigation, R.v.d.W., G.v.V., J.L. and T.V.; resources, R.v.d.W.; data curation, R.v.d.W. and J.L.; writing—original draft preparation, R.v.d.W.; writing—review and editing, G.v.V., T.V. and J.L.; visualization, R.v.d.W.; supervision, G.v.V.; project administration, T.V., J.L. and H.R.; funding acquisition, none. All authors have read and agreed to the published version of the manuscript.
Funding
This work is based on the research supported wholly/in part by the National Research Foundation of South Africa (Grant Number 126885).
Data Availability Statement
All data are non-proprietary and are publicly available on relevant websites and databases indicated in the references.
Conflicts of Interest
The authors declare no conflicts of interest. The funders had no role in the design of the study; in the collection, analyses, or interpretation of data; in the writing of the manuscript; or in the decision to publish the results.
Correction Statement
This article has been republished with a minor correction to exchange the positions of Table 1 and Table 2 (the table captions remain unchanged). This change does not affect the scientific content of the article.
References
- Task Force on Climate-Related Financial Disclosures (TCFD). Recommendations of the Task Force on Climate-Related Financial Disclosures. 2017. Available online: https://assets.bbhub.io/company/sites/60/2021/10/FINAL-2017-TCFD-Report.pdf (accessed on 27 May 2024).
- Inter-Governmental Panel on Climate Change (IPCC). Climate Change 2023: AR6 Synthesis Report. Contribution of Working Groups I, II, and III to the Sixth Assessment Report of the Intergovernmental Panel on Climate Change. 2023. Available online: https://www.ipcc.ch/ar6-syr/ (accessed on 27 May 2024).
- United Nations Framework Convention on Climate Change. The Paris Agreement. 2015. Available online: https://unfccc.int/process-and-meetings/the-paris-agreement?gclid=Cj0KCQiAsvWrBhC0ARIsAO4E6f-I2W9OJ07wYSb1ZxMvLFYhpyQCFvQK0g_cHB3q_9icS4cyD_3sB5kaArteEALw_wcB (accessed on 27 May 2024).
- International Monetary Fund. Fiscal Policies for Paris Climate Strategies—From Principle to Practice. 2019. Available online: https://www.imf.org/en/Publications/Policy-Papers/Issues/2019/05/01/Fiscal-Policies-for-Paris-Climate-Strategies-from-Principle-to-Practice-46826 (accessed on 27 May 2024).
- World Economic Forum. The Global Risks Report 2023. 2023. Available online: https://www.weforum.org/publications/global-risks-report-2023/ (accessed on 27 May 2024).
- United Nations Environment Programme Finance Initiative (UNEP FI). Net-Zero Banking Alliance 2023 Progress Update. 2023. Available online: https://www.unepfi.org/wordpress/wp-content/uploads/2023/11/NZBA-Progress-Update-2023.pdf (accessed on 27 May 2024).
- United Nations Environment Programme Finance Initiative (UNEP FI). Developing Metrics for Transition Finance. 2023. Available online: https://www.unepfi.org/wordpress/wp-content/uploads/2023/12/Developing-Metrics-for-Transition-Finance.pdf (accessed on 27 May 2024).
- United Nations Environment Programme Finance Initiative (UNEP FI). Just Transition Finance: Pathways for Banking and Insurance. 2023. Available online: https://www.unepfi.org/wordpress/wp-content/uploads/2023/11/Just-transition-finance_Pathway-for-Banking-and-Insurance.pdf (accessed on 27 May 2024).
- International Monetary Fund. Global Financial Stability Report. 2023. Available online: https://www.imf.org/en/Publications/GFSR/Issues/2023/10/10/global-financial-stability-report-october-2023 (accessed on 27 May 2024).
- Dunz, N.; Naqvi, A.; Monasterolo, I. Climate sentiments, transition risk, and financial stability in a stock-flow consistent model. J. Financ. Stab. 2021, 54, 100872. [Google Scholar] [CrossRef]
- Battiston, S.; Mandel, A.; Monasterolo, I.; Schütze, F.; Visentin, G. A climate stress-test of the financial system. Nat. Clim. Change 2017, 7, 283–288. [Google Scholar] [CrossRef]
- Stolbova, V.; Monasterolo, I.; Battiston, S. A financial macro-network approach to climate policy evaluation. Ecol. Econ. 2018, 149, 239–253. [Google Scholar] [CrossRef]
- Carney, M. Breaking the Tragedy of the Horizon—Climate Change and Financial Stability. Speech at Lloyd’s of London. 2015. Available online: https://www.bankofengland.co.uk/speech/2015/breaking-the-tragedy-of-the-horizon-climate-change-and-financial-stability (accessed on 27 May 2024).
- University of Oxford. Prudential Supervision of Climate-Related Risks: What’s the State of Play? 2022. Available online: https://blogs.law.ox.ac.uk/business-law-blog/blog/2022/04/prudential-supervision-climate-related-risks-whats-state-play#:~:text=The%20UK%20Prudential%20Regulation%20Authority,climate%2Drelated%20financial%20in%202019 (accessed on 27 May 2024).
- Basel Committee on Banking Supervision. Climate-Related Financial Risks: A Survey on Current Initiatives. 2020. Available online: https://www.bis.org/bcbs/publ/d502.pdf (accessed on 27 May 2024).
- International Finance Corporation (IFC). Time to Turn Ambitions into Actions. 2023. Available online: https://www.ifc.org/en/insights-reports/2023/time-to-turn-ambitions-into-actions (accessed on 27 May 2024).
- Carbon Trust. DRAFT—June 2021 Sustainable Finance Handbook for South Africa. 2021. Available online: https://sustainablefinanceinitiative.org.za/wp-content/uploads/2021/08/DRAFT-Sustainable-Finance-Handbook_June2021_compressed.pdf (accessed on 27 May 2024).
- National Treasury Republic of South Africa. South African Green Finance Taxonomy 1st Edition. 2022. Available online: https://www.treasury.gov.za/comm_media/press/2022/SA%20Green%20Finance%20Taxonomy%20-%201st%20Edition.pdf (accessed on 27 May 2024).
- Task Force on Climate-Related Financial Disclosures (TCFD). Implementing the Recommendations of the Task Force on Climate-related Financial Disclosures. 2021. Available online: https://assets.bbhub.io/company/sites/60/2021/07/2021-TCFD-Implementing_Guidance.pdf (accessed on 27 May 2024).
- Task Force on Climate-Related Financial Disclosures (TCFD). Guidance on Metrics, Targets, and Transition Plan. 2021. Available online: https://assets.bbhub.io/company/sites/60/2021/07/2021-Metrics_Targets_Guidance-1.pdf (accessed on 27 May 2024).
- Colin, A.; Vailles, C.; Hubert, R. Understanding Transition Scenarios—Eight Steps for Reading and Interpreting These Scenarios. i4CE Institute for Climate Economics. 2019. Available online: https://www.i4ce.org/en/publication/understanding-transition-scenarios-eight-steps-for-reading-and-november-2019-interpreting-these-scenarios/ (accessed on 27 May 2024).
- Hilke, A.; Hubert, R.; Pauthier, A.; Raynaud, J. Taking Climate-Related Disclosure to the Next Level: Minimum Requirements for Financial Institutions. i4CE Institute for Climate Economics. 2021. Available online: https://www.i4ce.org/wp-content/uploads/I4CE-ILB_2021_Taking-climate-related-disclosure-to-the-next-level.pdf (accessed on 27 May 2024).
- Bingler, J.A.; Colesanti Senni, C.; Monnin, P. Climate Transition Risk Metrics: Understanding Convergence and Divergence across Firms and Providers. 2021. Available online: https://ssrn.com/abstract=3923330 (accessed on 27 May 2024).
- Hubert, R.; Paya, R.; Hilke, A.; Cardona, M. Scenario Analysis of Transition Risk in Finance. i4CE Institute for Climate Economics. 2022. Available online: https://www.i4ce.org/wp-content/uploads/I4CE_2022_Scenario-analysis-of-transition-risk-in-finance.pdf (accessed on 27 May 2024).
- Network for Greening the Financial System (NGFS). NGFS Phase 4 Scenario Explorer. 2023. Available online: https://data.ene.iiasa.ac.at/ngfs/#/workspaces (accessed on 27 May 2024).
- Network for Greening the Financial System (NGFS). Nature-Related Financial Risks: A Conceptual Framework to Guide Action by Central Banks and Supervisors. 2023. Available online: https://www.ngfs.net/sites/default/files/medias/documents/ngfs_conceptual-framework-on-nature-related-risks.pdf (accessed on 27 May 2024).
- Network for Greening the Financial System (NGFS). NGFS Survey on Climate Scenarios Key Findings. 2023. Available online: https://www.ngfs.net/sites/default/files/medias/documents/ngfs_survey_results.pdf (accessed on 27 May 2024).
- Network for Greening the Financial System (NGFS). Stocktake on Financial Institutions’ Transition Plans and their Relevance to Micro-Prudential Authorities. 2023. Available online: https://www.ngfs.net/sites/default/files/medias/documents/stocktake_on_financial_institutions_transition_plans.pdf (accessed on 27 May 2024).
- Task Force on Climate-Related Financial Disclosures (TCFD). 2023 Status Report. 2023. Available online: https://assets.bbhub.io/company/sites/60/2023/09/2023-Status-Report.pdf (accessed on 27 May 2024).
- Education, Pearson. GARP SCR E-Book: Sustainability and Climate Risk Exam. Available from: Bookshelf, Pearson Learning Solutions. 2022. Available online: https://www.garp.org/scr (accessed on 27 May 2024).
- Exxaro Limited. Climate Change Position Statement. 2020. Available online: https://www.exxaro.com/sustainability/ (accessed on 27 May 2024).
- Exxaro Limited. 2022 ESG Report. 2022. Available online: https://www.exxaro.com/sustainability/ (accessed on 27 May 2024).
Disclaimer/Publisher’s Note: The statements, opinions and data contained in all publications are solely those of the individual author(s) and contributor(s) and not of MDPI and/or the editor(s). MDPI and/or the editor(s) disclaim responsibility for any injury to people or property resulting from any ideas, methods, instructions or products referred to in the content. |
© 2024 by the authors. Licensee MDPI, Basel, Switzerland. This article is an open access article distributed under the terms and conditions of the Creative Commons Attribution (CC BY) license (https://creativecommons.org/licenses/by/4.0/).