Article

Investigating Road Ice Formation Mechanisms Using Road Weather Information System (RWIS) Observations

1
Earth System Science Interdisciplinary Center, University of Maryland, College Park, MD 20742, USA
2
Montana Department of Transportation, Helena, MT 59620-1706, USA
*
Author to whom correspondence should be addressed.
Climate 2024, 12(5), 63; https://doi.org/10.3390/cli12050063
Submission received: 31 January 2024 / Revised: 23 April 2024 / Accepted: 25 April 2024 / Published: 2 May 2024

Abstract

:
Ice formation on roads leads to a higher incidence of accidents and increases winter de-icing/anti-icing costs. This study analyzed 3 years (2019–2021) of Road Weather Information System (RWIS) sub-hourly measurements collected by the Montana Department of Transportation (MDT) to understand the first-order factors of road ice formation and its mechanisms. First, road ice is formed only when the road pavement surface temperature is equal to or below the freezing point (i.e., 32 °F (i.e., 0 °C)), while the corresponding 2 m air temperature could be above 32 °F. Nevertheless, when the road pavement was below 32 °F ice often did not form on the roads. Therefore, one challenge is to know under what conditions road ice forms. Second, the pavement surface temperature is critical for road ice formation. The clear road (i.e., with no ice or snow) surface pavement temperature is generally warmer than the air temperature during both day and night. This feature is different from a natural land surface, where the land skin temperature is lower than the air temperature on cloud-free nights due to radiative cooling. Third, subsurface temperature, measured using a RWIS subsurface sensor below a road surface, did not vary as much as the pavement temperature and, thus, may not be a good index for road ice formation. Fourth, urban heat island effects lead to black ice formation more frequently than roads located in other regions. Fifth, evaporative cooling from the water surface near a road segment further reduces the outlying air temperature, a mechanism that increases heat loss for bridges or lake-side roads in addition to radiative cooling. Additionally, mechanical lifting via mountains and hills is also an efficient mechanism that makes the air condense and, consequently, form ice on the roads. Forecasting road ice formation is in high demand for road safety. These observed features may help to develop a road ice physical model consisting of functions of hyper-local weather conditions, local domain knowledge, the road texture, and geographical environment.

1. Introduction

Ice or snow on the roads leads to low speeds, traffic congestion, and accidents [1,2]. The risk of vehicle crashes significantly increases in the presence of winter precipitation [3,4,5], with 18% occurring during snow or sleet, 13% on icy pavements, and 16% on snowy or slushy pavements among all weather-related car accidents (FHWA, https://ops.fhwa.dot.gov/weather/q1_roadimpact.htm (accessed on 24 April 2024)). Specifically, a U.S. federal highway administration report disclosed that, over a 10-year period (2002–2012), 540,000 car collisions—10% of collisions annually—were caused by winter weather, with 150,000 car-related injuries and 1900 car-related fatalities [6]. Furthermore, state Departments of Transportation (DOT) spent USD 2.3 billion each year for de-icing/anti-icing treatment operations on the roads. Anti-icing is the process of adding materials on the road before ice forms to prevent ice from bonding to the pavement and de-icing involves melting ice from the top down after ice forms [7]. Environmental Protection Agency (EPA) states that effective anti-icing treatment for icy road typically requires up to 75% less materials throughout the storm cycle compared to de-icing after weather events [8]. Consequently, using the anti-icing approach can save 30% to 90% of winter maintenance costs compared to using the de-icing approach. The “Winter Parking Lot and Sidewalk Maintenance Manual” used in Minnesota states that anti-icing treatments applied in advance of stormy weather often cost only one-tenth of the de-icing operation cost implemented after a storm (source: Sima.org). Therefore, knowing when and where road ice will occur is highly desired by state DOTs for both road safety enhancement and winter road maintenance cost reduction. Moreover, less de-icing chemical used on the road also reduces soil and water pollution [9]. For example, the health of trees is affected by de-icing pollution in soils [10]. Therefore, state DOTs seek icy road forecasts to perform road ice treatment with the highest efficiency and least impact.
Unfortunately, few studies have been conducted to understanding road ice formation mechanisms, partly because of the lack of observations. As a result, forecasting the occurrence of road ice is challenging since modeling requires a deep understanding of the ice formation processes and local weather conditions. Water and sub-freezing surface temperatures seem to be the two key parameters for ice forming on roads; however, wind is also an important parameter that reduces the surface temperature. Winter storms, which generally comprise all three of these parameters (temperature, water, and wind) as well as heavy snow and freezing rain, can lead to icy roads. Apart from the weather conditions, road texture and geographic conditions also affect ice formation. For example, bridges or road shoulders with even a slight slope can form ice more easily under optimal temperature and water conditions due to micro-scale turbulences near the ground [11]. Black ice formation on roads is a critical issue but has rarely been studied due to extreme limits of data availability. Dense vegetation nearby the road is reported to delay ice formation [12]. Black ice formation on roads is a critical issue but has rarely been studied due to extremely rare data availability. Black ice is a thin layer of transparent ice formed on the road surface. It is almost invisible to the human eye and, therefore, in particular dangerous for drivers. Toms et al. [13] suggested that hoarfrost may be one of the key mechanisms of black ice, since hoarfrost occurs when the water vapor pressure of the air is higher than the saturation vapor pressure at the given air temperature [14] and, thus, deposits onto the road surface. Furthermore, clouds affect road surface ice formation since, when low clouds are absent, downward longwave radiation from a minimal high- or mid-level clouds base occurs at a lower temperature compared to the cloud-base; consequently, surface radiative cooling is stronger than during a low-cloud-covered night—favorable for ice formation [15,16,17]. In addition, shading effects, due to trees, mountains, and buildings, on road surface conditions have been reported [18].
Three mechanisms have been hypothesized to be responsible for road ice formation without snowfall: (1) Freezing of pooled rainwater. Rain can be in liquid form during daytime hours but freezes overnight as temperatures decrease [19,20,21]. (2) Freezing of condensed water from the air onto the ground. Water vapor can condense onto rough road surfaces in sub-freezing temperatures. This process is called frost or hoarfrost [14,22]. (3) An alternative mechanism is that snow accumulating on roads melts and then refreezes when the temperature drops (e.g., snow melt that refreezes). Crevier and Delage [23], following a few others [18,24,25,26,27,28], developed a road physical model (METRo) from three parts: road surface energy balance, heat conduction in road materials, and water budget and energy change in phase change. Toms et al. [13] simulated road ice from three mechanisms: hoarfrost, freezing fog, and frozen precipitation [12,14,29,30,31]. Machine learning has recently been used as an independent forecasting model to predict road ice [32]. Nevertheless, due to limited availability of road weather observations, research on road ice formation mechanisms is still limited and, thus, analyzing the available observations seems to be the first step to better forecast road ice. Recently, drone technology was used as a new research approach to remotely detect road ice [33] at spectral wavelengths.
Human activities significantly affect the natural climate system, and these effects must be adequately included in a weather forecast model [34]. Road and traffic are human impacts that currently are not represented in the NOAA operational weather forecasting model (Shepherd, personal communication, 2022). To this end, the first step is to learn from the observations. Ground measurements from the Road Weather Information System (RWIS) have been analyzed to understand ice formation conditions [35,36]. Our research presented here analyzed 3-year winter RWIS measurements collected from Montana highways. Key findings of this study include the following: the road pavement skin was equal to or below the freezing point (i.e., 32 °F) for ice to form. Nevertheless, there were times when road ice did not occur, even when the road pavement was below 32 °F. In addition, evaporative cooling effects related to the river and bridge crossings contribute to road ice formation there. The relative importance of the radiative cooling and the evaporative cooling processes should be studied. Furthermore, the urban heat island effect may contribute to less rainfall/snowfall at the downwind roads, but black ice frequently occurred there. These new understandings would be useful to develop a physical model for road ice forecasting.
This study focuses on the pavement surface and 2 m air temperature relations to assess the impacts of different land covers (i.e., mountain, bridge, city, and rural), elevation, lakes, and precipitation variations on road ice formation. Section 2 discusses the research data and approach. Section 3 presents the results and scientific interpretation. Section 4 presents the final remarks and future research needs.

2. Research Approach

2.1. Terminology

Road Pavement Surface Temperature, 2 m Air Temperature, and Skin Temperature

There are two kinds of surface temperatures measured using the RWIS sensor and studied in this analysis. The first is the 2 m air temperature, traditionally measured using a thermometer at the Stevenson screen-shelter of the weather stations at 1.5 m to 2 m height from the ground. This variable is predicted using weather forecasting models and is the normal surface temperature weather forecasting channels report. The second is the road pavement surface temperature, which is a critical condition to determine whether snow will accumulate on a road surface. At a RWIS site, the pavement surface temperature is measured using a thermal conductivity sensor embedded in the road pavement.
Skin temperature—a radiometric temperature, by definition, measured via remote sensing from thermal infrared emission as a function of the ground temperature [37,38]. On a clear road, the road surface pavement temperature measured via RWIS is equivalent to the skin temperature in magnitude. On snow-covered or iced roads, the skin temperature is the one at the top of the snow layer/ice layer, while the road pavement temperature is the temperature underlying the snow-cover/ice layer. It is expected that on snow-covered/iced roads the skin temperature differs from the pavement surface temperature. Nevertheless, there is no research that has been conducted to identify the detailed relations between skin temperature and road pavement surface temperature on snow-covered/iced roads [39].
Skin temperature and 2 m air temperature are the variables simulated in the weather forecasting model in NOAA [40]. Nevertheless, only 2 m air temperature is accessible to the public. Skin and 2 m air temperatures have high correlation due to surface boundary-layer energy and momentum distribution processes [41,42]. It is desirable to study the pavement surface temperature, skin temperature, and 2 m air temperature in an icy road condition.
Black Ice is vaguely defined in the literature. It normally refers to an invisible layer of ice on the road. In this study, black ice is defined as a road ice occurrence when there is no precipitation for the previous 48 h. Therefore, the water source for black ice to form most likely comes from condensation of air moisture or old-snow melting and then refreezing. Consequently, the ice layer is thin and unexpected. Such a definition of black ice might be inaccurate and requires further research.
Refrozen Ice refers to the situation where snow accumulated at the road surface melts after absorbing solar radiation or heat fluxes via traffic and then refreezes when the air temperature is reduced.

2.2. Theory Background

The land surface skin temperature and air temperature are the two critical parameters determining surface–boundary layer energy exchanges [17]:
(1 − α)Sd + LWd − εσTskin4 + SH + LE + G = 0.
Equation (1) denotes the land-surface energy budget for bare surface, representing one of the governing equations for all land-surface models. The parameter α is the surface albedo; Sd is downward shortwave radiation; LWd is downward longwave radiation from the atmosphere to the land surface; ε is the surface emissivity; σ is the Stefan–Boltzmann constant; Tskin is the skin temperature; and SH, LE, and G are sensible heat flux, latent heat flux, and ground heat flux, respectively, which are all functions of Tskin. As described in the land-surface energy budget Equation (1), skin and air temperatures are both needed to calculate sensible and latent heat fluxes. The skin temperature also determines the surface upward longwave radiation. Consequently, the land-surface modelers must know how skin and air temperatures vary to be able to efficiently simulate land surface-soil-atmosphere interactions. Equation (1) does not include the thermodynamic processes related to road surface snow and ice heat storage, melting, and refreezing. Toms et. al. [13] recommended a simple road physical model to further consider the mass-change-induced hydrological and thermal budget [43]. Wang et al. [44] used a snow surface energy model that included snow- and precipitation-induced energy redistribution. They further simulated the interactions among the longwave radiation of clouds, turbulence, and snow surface temperature.
The road is a unique human-made surface. A two-lane road with shoulders (Figure 1b), as an example, shows a slight cross slope and shoulder slope to ensure that water does not accumulate on the road center. The roadway is covered by an asphalt or concrete layer (Figure 1a). The thickness of this layer varies between 4 and 12 inches (10–30 cm). In Montana, 10 percent of the highway system is paved with concrete and a report discloses that 60 percent of U.S. highway is concrete of 11 inches thick (28 cm, https://pubs.usgs.gov/fs/2006/3127/2006-3127.pdf (accessed on 24 April 2024)). Below this layer is an aggregate layer, composed of washed 3/8” minus washed aggregate. This layer ranges from 21 to 36 inches (53 to 91 cm). Under this layer is a compacted natural soil layer. The thickness of each layer depends on the type of roadway, the loads on the roadway, and whether the asphalt/concrete is applied over an aggregate base. Roadway friction changes over time due to surface degradation and many efforts are ongoing to forecast this variable [45,46]. With the age of road and traffic load, cracks occur and new asphalt/concrete may be placed. Consequently, the pavement surface albedo, emissivity, heat conductivity, and hydraulic conductivity, which are the parameters important for a road physical modeling, are changed. These variables, unfortunately, are not well recorded. Road segments and their underlying modified soil properties are not currently included in land modeling [47].
For the road pavement, all underlined terms in Equation (1) are modified and are, thus, different from a natural land surface. Specifically, the road pavement surface is essentially waterproofed (in fact, the road asphalt surface is not completely waterproof, but one might consider it as waterproof in the first order), and the latent heat flux can be ignored unless the road surface is covered by water, snow, or ice. Furthermore, the albedo, roughness, and heat capacity of a road surface are modified, resulting in a very different relationship between skin and air temperatures than on a natural land surface.
In addition to the natural physical process modified as underlined in Equation (1), a new process, anthropogenic heat flux, needs to be added into Equation (1) for roads. This term is a function of traffic load. Various studies have been conducted to collect or simulate traffic-induced heat [48].
The skin temperature in Equation (1) determines the upward longwave emission from the top thin layer of the surface, following the Stefan–Boltzmann law. Over a city, the skin temperature is significantly changed by human-made surfaces in terms of albedo (Jin et al. [42], leading to the urban heat island effect [38]. Roads, as part of the urban system, contribute to the UHI by reducing soil moisture and surface albedo. Roads in rural regions also have unique surface temperature features that differ from a natural land surface, as determined by the changed physical parameters (albedo, heat capacity, emissivity, waterproof, etc.) in Equation (1). In this study, the pavement surface temperature is employed when discussing the RWIS observations, although skin temperature is used in the energy budget Equation (1).

2.3. Study Area and RWIS Site Observations

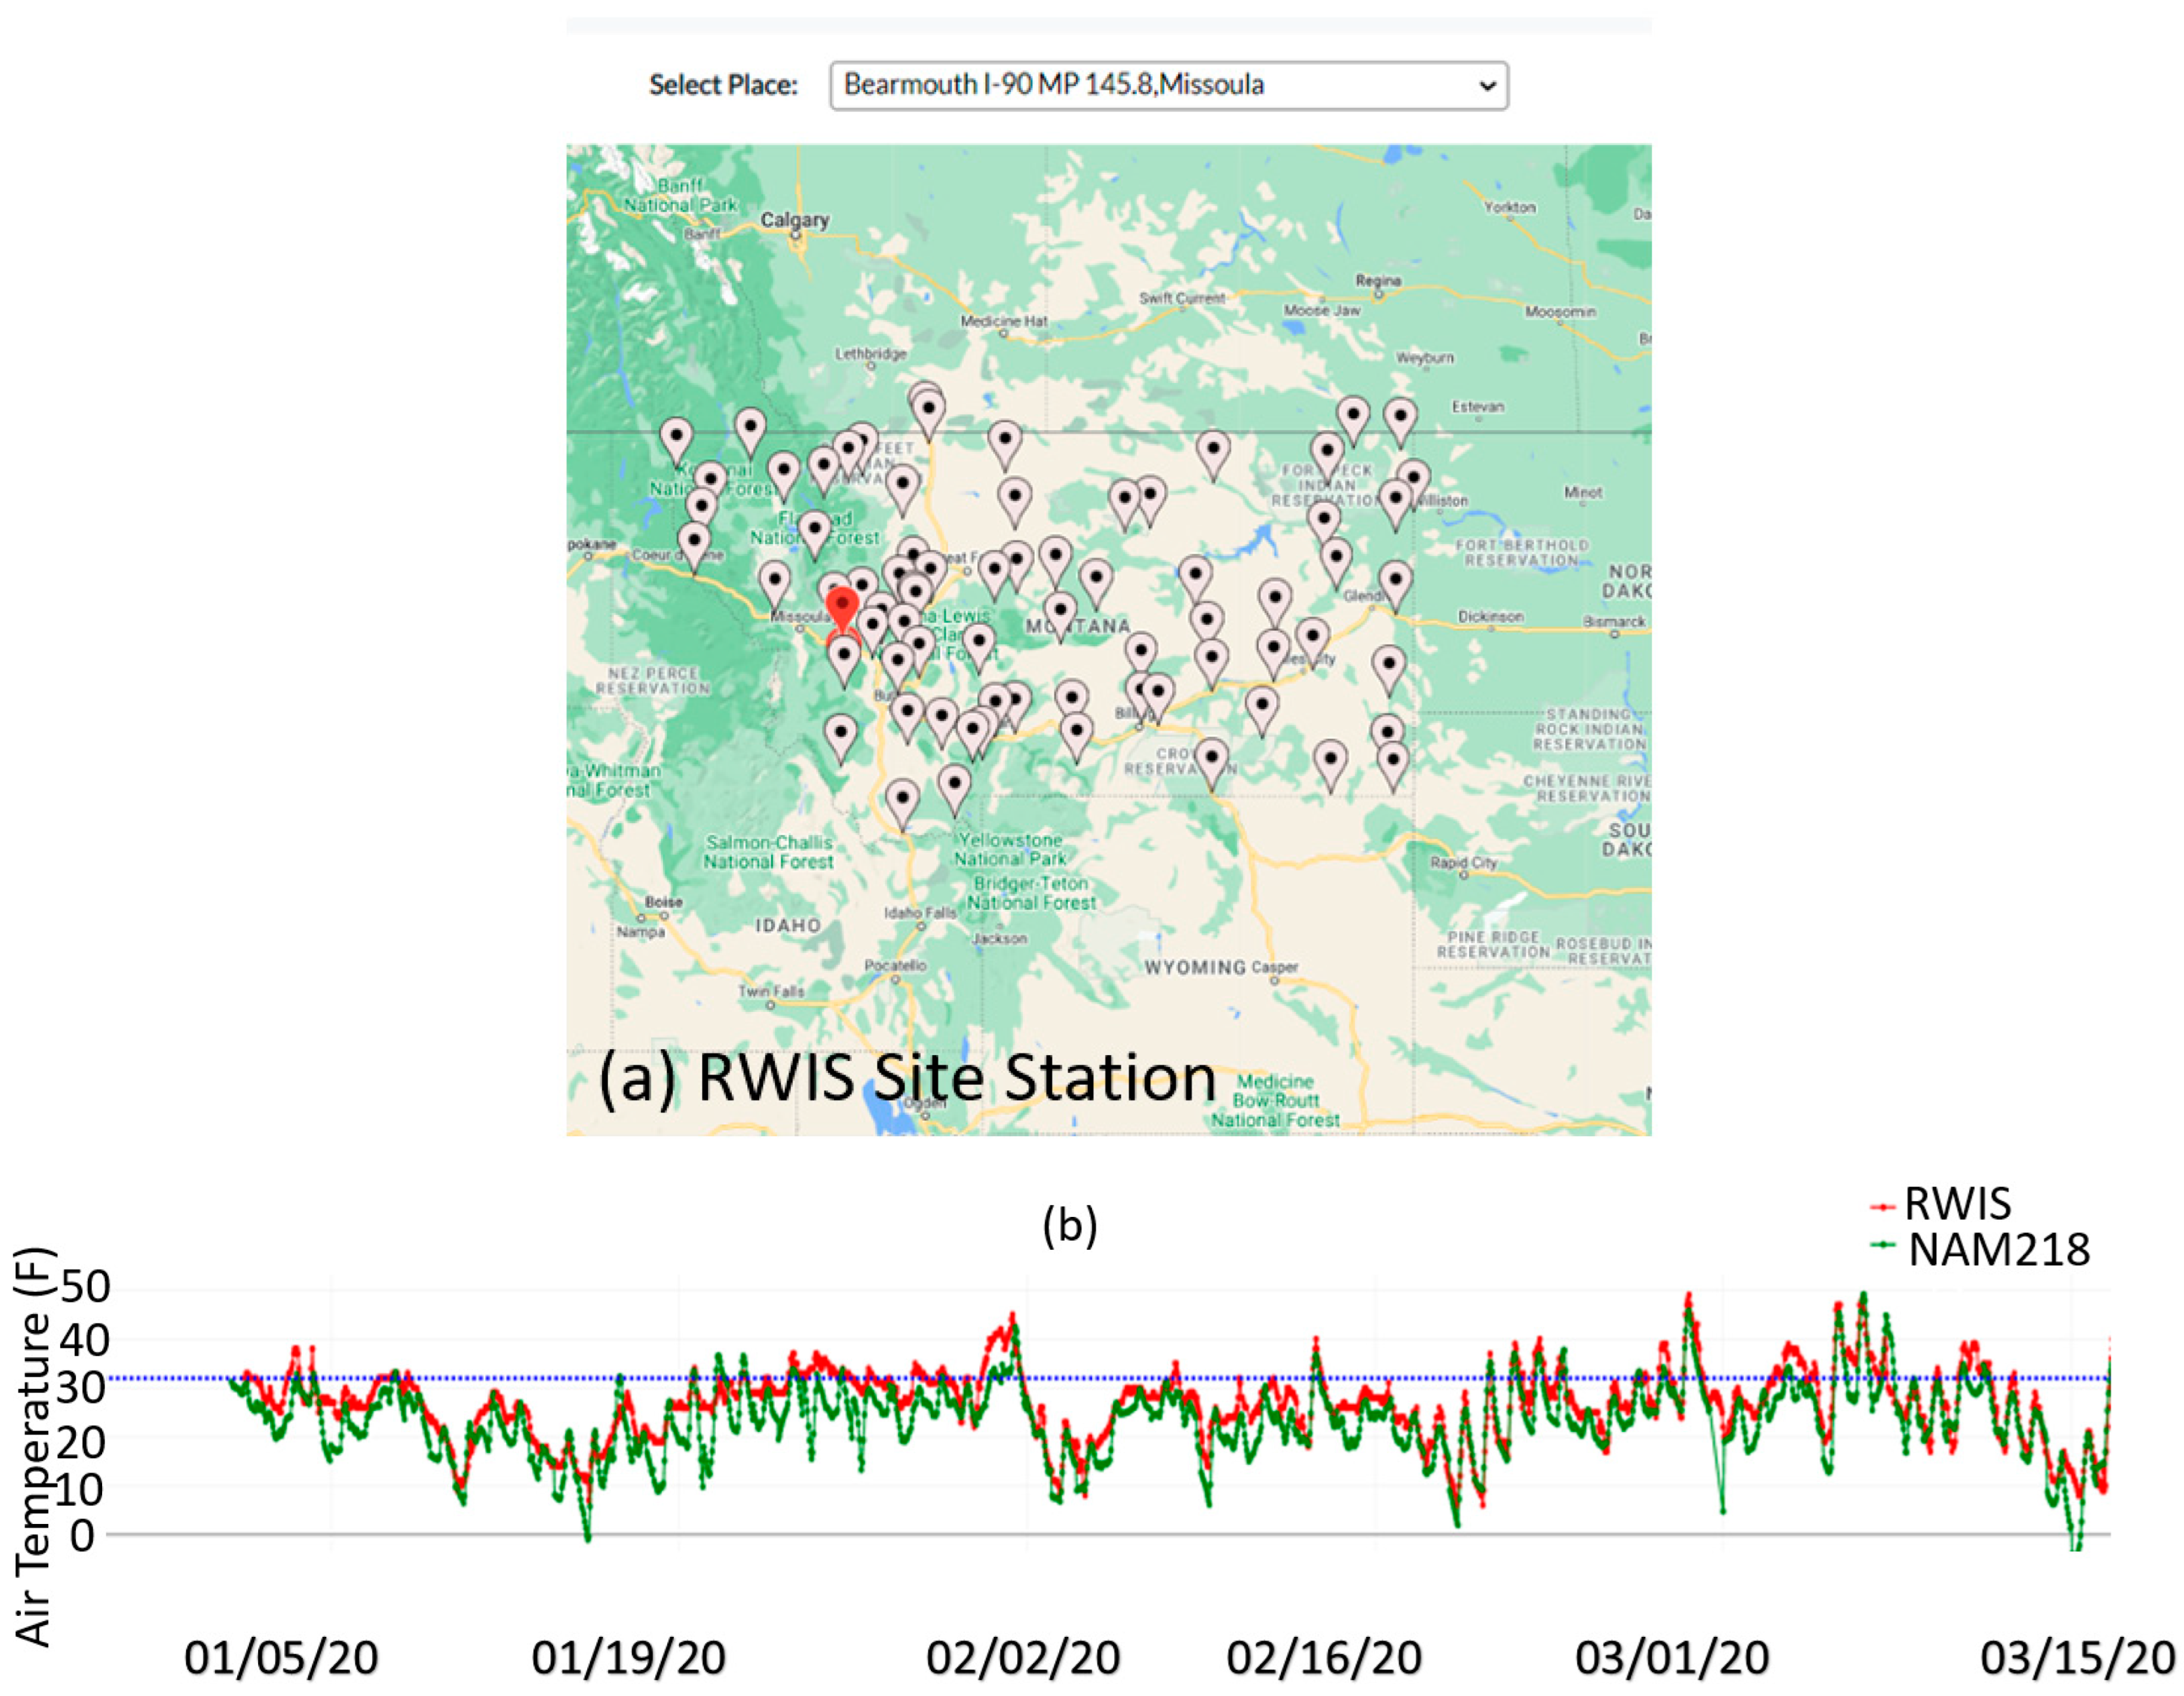
The study area is in the State of Montana, USA, which owns 73 RWIS sites (Figure 2a). The RWIS is a road-embedded, ground-based sensor network developed by Departments of Transportation to measure three different types of weather information: atmosphere information (including air temperature, wind speed and direction, precipitation amount and type, and visibility), ground pavement information (including road pavement temperature, pavement wet/snow/icy status, and pavement chemical concentration), and subsurface temperature. In the Montana RWIS network, the subsurface temperature is approximately 17 inches (43 cm) below the top of the pavement, measured using subsurface sensors placed to monitor frost depth. Each state may put their subsurface sensors at slightly different levels.
The Montana Department of Transportation (MDT) has 73 RWIS sites, but only data from 63 sites were collected due to sensor failures at some sites. These 63 RWIS active sites observe atmosphere and pavement conditions at an averaged 5 min interval. Definitions of RWIS variables are given at https://mdt.mt.gov/travinfo/atms-glossary.aspx (accessed on 20 April 2024). Sensor details can be found at Ewan and Al-Kaisy [35]. This study analyzed 3 years of data from 2019 to 2021, collected at 63 RWIS sites from rwis.mdt.mt.gov (accessed 30 April 2024). Observation data were quality controlled by removing errors or missing values. Data flagged as “chemical wet” were also removed, as this study focused on real road ice conditions without de-icing chemical material effects. Java script code was developed to collect data from RWIS sites and process these data automatically. The RWIS data were then saved in an online cloud-based database, enabling web-based automatic data analysis for all RWIS sites.

2.4. Modeled Air Temperature vs. RWIS Observations

Figure 2b compares RWIS hourly averaged measurements with a North American Mesoscale Forecast System (NAM) model forecast in order to show the limits of current model performance. Site Bearmouth I-90 MP Missoula is selected in red (Figure 2a), and hourly averaged 2 m air temperature and model simulations from NAM218 (NAM is the North American Model; NAM218 represents the 12 km resolution model outputs publicly available at https://www.nco.ncep.noaa.gov/pmb/products/nam/ (accessed 30 April 2024). In this paper, we only use NAM218 as an example to validate weather forecasting using RWIS observations. We do not further discuss how to improve NAM218 or other models that are beyond the scope of this paper. The 2 m air temperature was directly downloaded from the NOAA/NCAR model output publishing website. Therefore, no special separation on vegetation vs non-vegetation treatment was performed) for January–March 2020 are compared and visualized (Figure 2b). Evidently, the NAM218 model efficiently simulated diurnal variations in the air temperature using a Pearson’s correlation coefficient of 0.87. However, it underestimated the air temperature for most days by an average root mean square (RMS) of 2.2 °F. Such an underestimation may lead to poor forecasting on road ice formation. Furthermore, NAM model outputs were downloaded from the government website for public access. The 2 m air temperature is an averaged variable for both vegetated and non-vegetated sub-areas within a model grid. Therefore, the differences between RWIS and NAM air temperature may be induced, in part, by the vegetation coverage in the model. Consequently, it is inaccurate to directly use weather-model-forecasted 2 m air temperature to represent the road surface air temperature.

3. Results

Data used in this section are from sensor measurements collected at the RWIS sites in Montana from 2019 to 2021. The goal is to understand the important factors that contribute to road ice occurrence and, thus, understand the possible mechanisms of road ice formation. Due to the limits of observations, the factors disclosed below may only be part of the ice formation mechanisms and the relative importance of each factor cannot not be assessed.

3.1. Road Ice, Surface Air, and Pavement Surface Temperatures

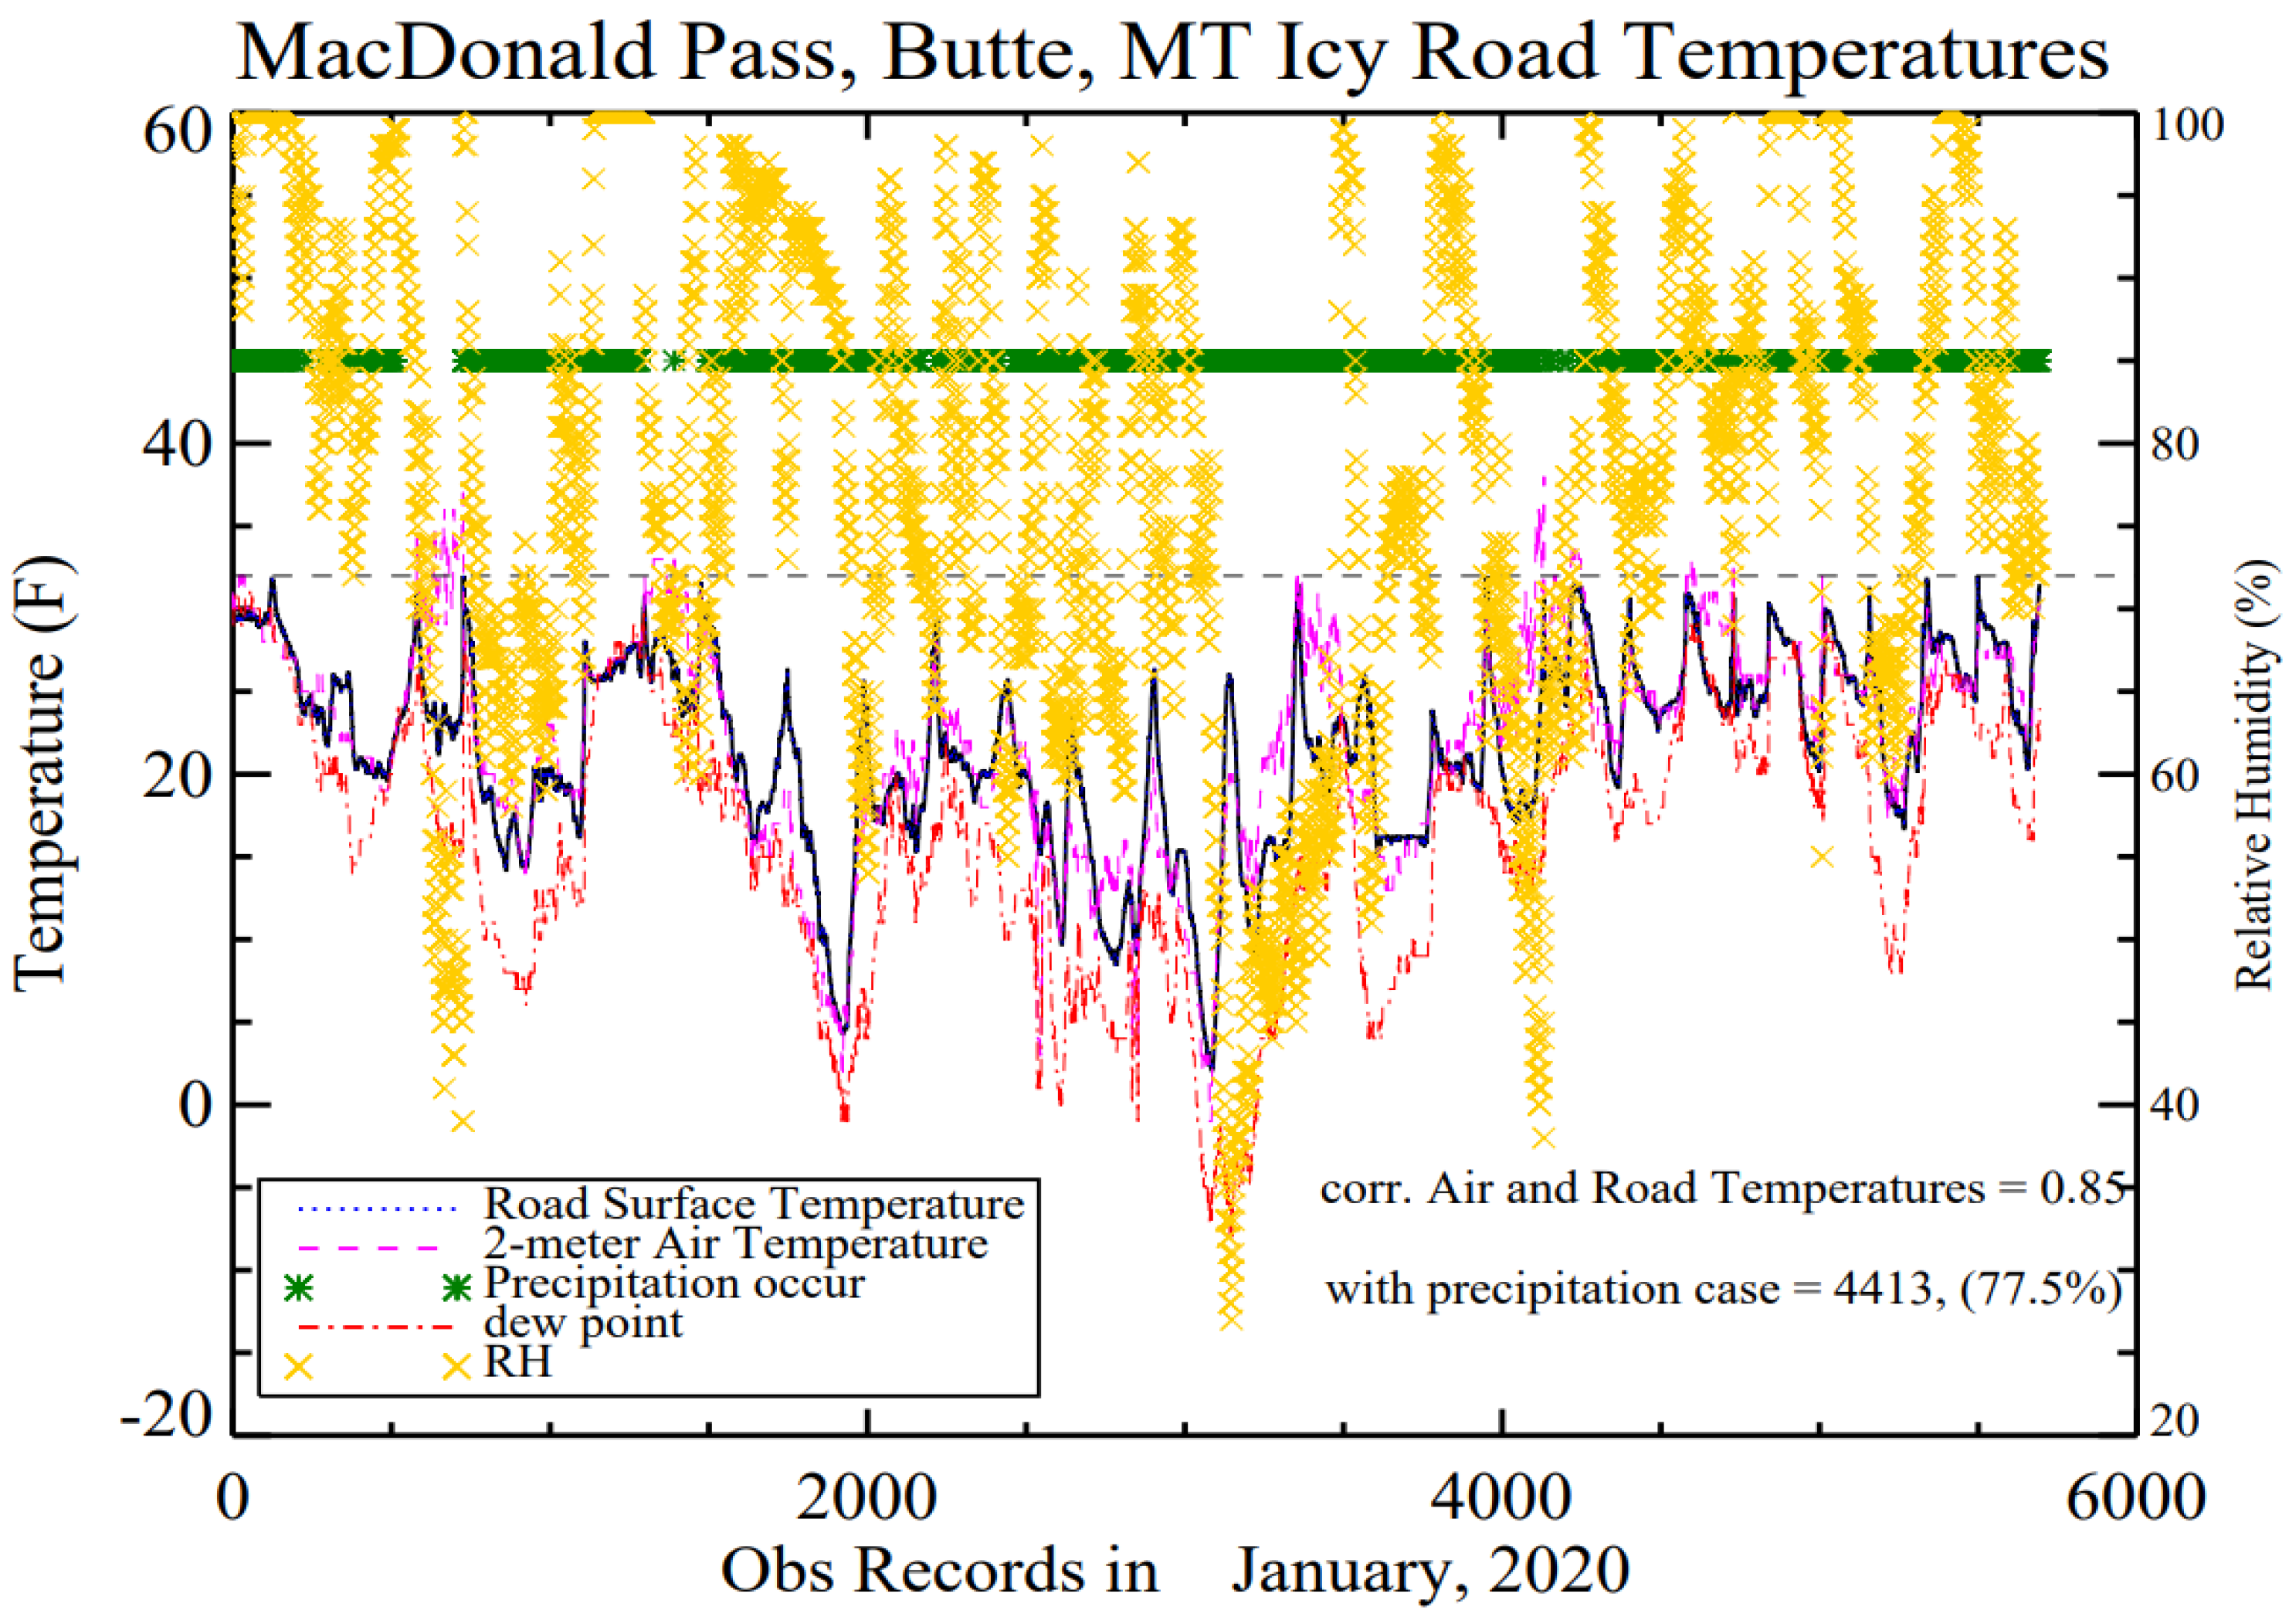
The MacDonald Pass site in Lewis and Clark County, Montana is located in a high-mountain region with an elevation above 6320 feet (1926 m). Ice on the road formed more than 90% of the days in January 2020 (Figure 3a). A total of 77.5% of the time, road ice occurred at the same time as snowfall, partly due to synoptic weather systems and partly due to local convection induced by the mountain lifting mechanism. Additionally, snow blowing from nearby regions onto the RWIS on-ground instrument was also another common feature. The Pearson’s correlation coefficient between the pavement surface and the 2 m air temperatures was 0.85. Nevertheless, the air temperatures changed more rapidly than the road pavement surface temperatures, suggesting that the approaching weather system more rapidly affected the air than the pavement. When ice occurred on this high-mountain site (as shown in Figure 3a), the air sometimes was colder but sometimes warmer than the pavement.
The Bozeman Pass, MT had black ice occurrences more frequently than other regions (Figure 3b). The elevation of the Bozeman Pass station is 5748 feet (1752 m), which is similar to the MacDonald Pass. Nevertheless, this site is located in a canyon about 10 miles east of Bozeman, a city in the southwest of Montana with a population of 49,631 in 2019. Given that the city affects downwind region precipitation [49], the urban heat island effect in the Bozeman city might be partly responsible for no rainfall/snowfall at this RWIS site during January and March 2020. Nevertheless, ice at road surfaces still occurred ~80% of the time (Figure 3b), due to strong radiative cooling at the surface, low surface temperatures, and abundant water vapor in the atmosphere. Furthermore, inter-annual variations on ice formation were evident, with snowfall in March 2019 for only 7 days but black ice occurring on about 24 days (Figure 3c). This finding suggests that, at this close-to-city site, road ice formation might be affected by the upwind urban regions. Moreover, road surfaces were generally warmer than the 2 m air by 1–20 °F (i.e., −17.2 °C to −6.7 °C) with evident diurnal variations, partly due to anthropogenic heat flux from traffic and partly due to the modified physical properties of the paved materials (e.g., albedo, thermal emittance, thermal conductivity, specific heat, and surface roughness). The road pavement being hotter than the air during the day and night was an important, unique feature and was in contrast with the well-established understanding that during a clear night the natural land surface is colder than the 2 m air temperature due to radiative cooling [22,24]. In addition, during March 2019, the correlation coefficient between the air and the pavement surface temperatures was 0.88. When road ice occurred, the precipitation in the last 3 h was 21.8%, in the last 6 h it was 34.4%, and in the last 24 h it was only 58.4%. Namely, about 40% of road ice occurred when there was no snowfall/rainfall during the past 24 h.
The road surface was very cold at the Gary Cooper bridge (Figure 3d), a site located above a river, with temperatures below 20 °F (i.e., −6.7 °C) in more than half of the month, with 6 days even falling below 0 °F (13–17 January 2020). Black ice also occurred during January 2020, for example, at the 800–1300 time-steps on the x-axis (Figure 3d). Most of these extremely low temperatures occurred after midnight and lasted to early morning before sunrise. This was partly due to no ground heat flux being transported from the underlying air layer to the bridge and partly due to the bridge deck losing longwave radiation to the two air layers above and below; consequently, the bridge surface lost heat more rapidly than other surfaces after sunset. Another cooling mechanism on the bridge was evaporative cooling, as the water surface of the river under the bridge absorbed energy from the outlying air layer leading to evaporation, which was an unique mechanism for bridges above water. The low temperature and abundant water vapor in the atmosphere above a water bridge were the two favorable factors for ice/black ice to occur on a bridge. Furthermore, the bridge road surface temperatures are sometimes lower than the 2 m air temperature, for example, around data record 1000 on the x-axis. On these days, air temperatures were above 32 °F (i.e., 0 °C), whereas bridge road surface temperatures were below 32 °F and, consequently, ice formed. This suggested that, even with the air temperature above the freezing point, the determining factor was the road pavement surface temperature, which was below 32 °F (i.e., 0 °C). More importantly, on the bridge, 79.5% of the ice formed when there was snowfall at the same time. The Pearson’s correlation between the air and pavement surface temperatures was as high as 0.97, indicating a close coupling.

3.2. Rural Land Effects

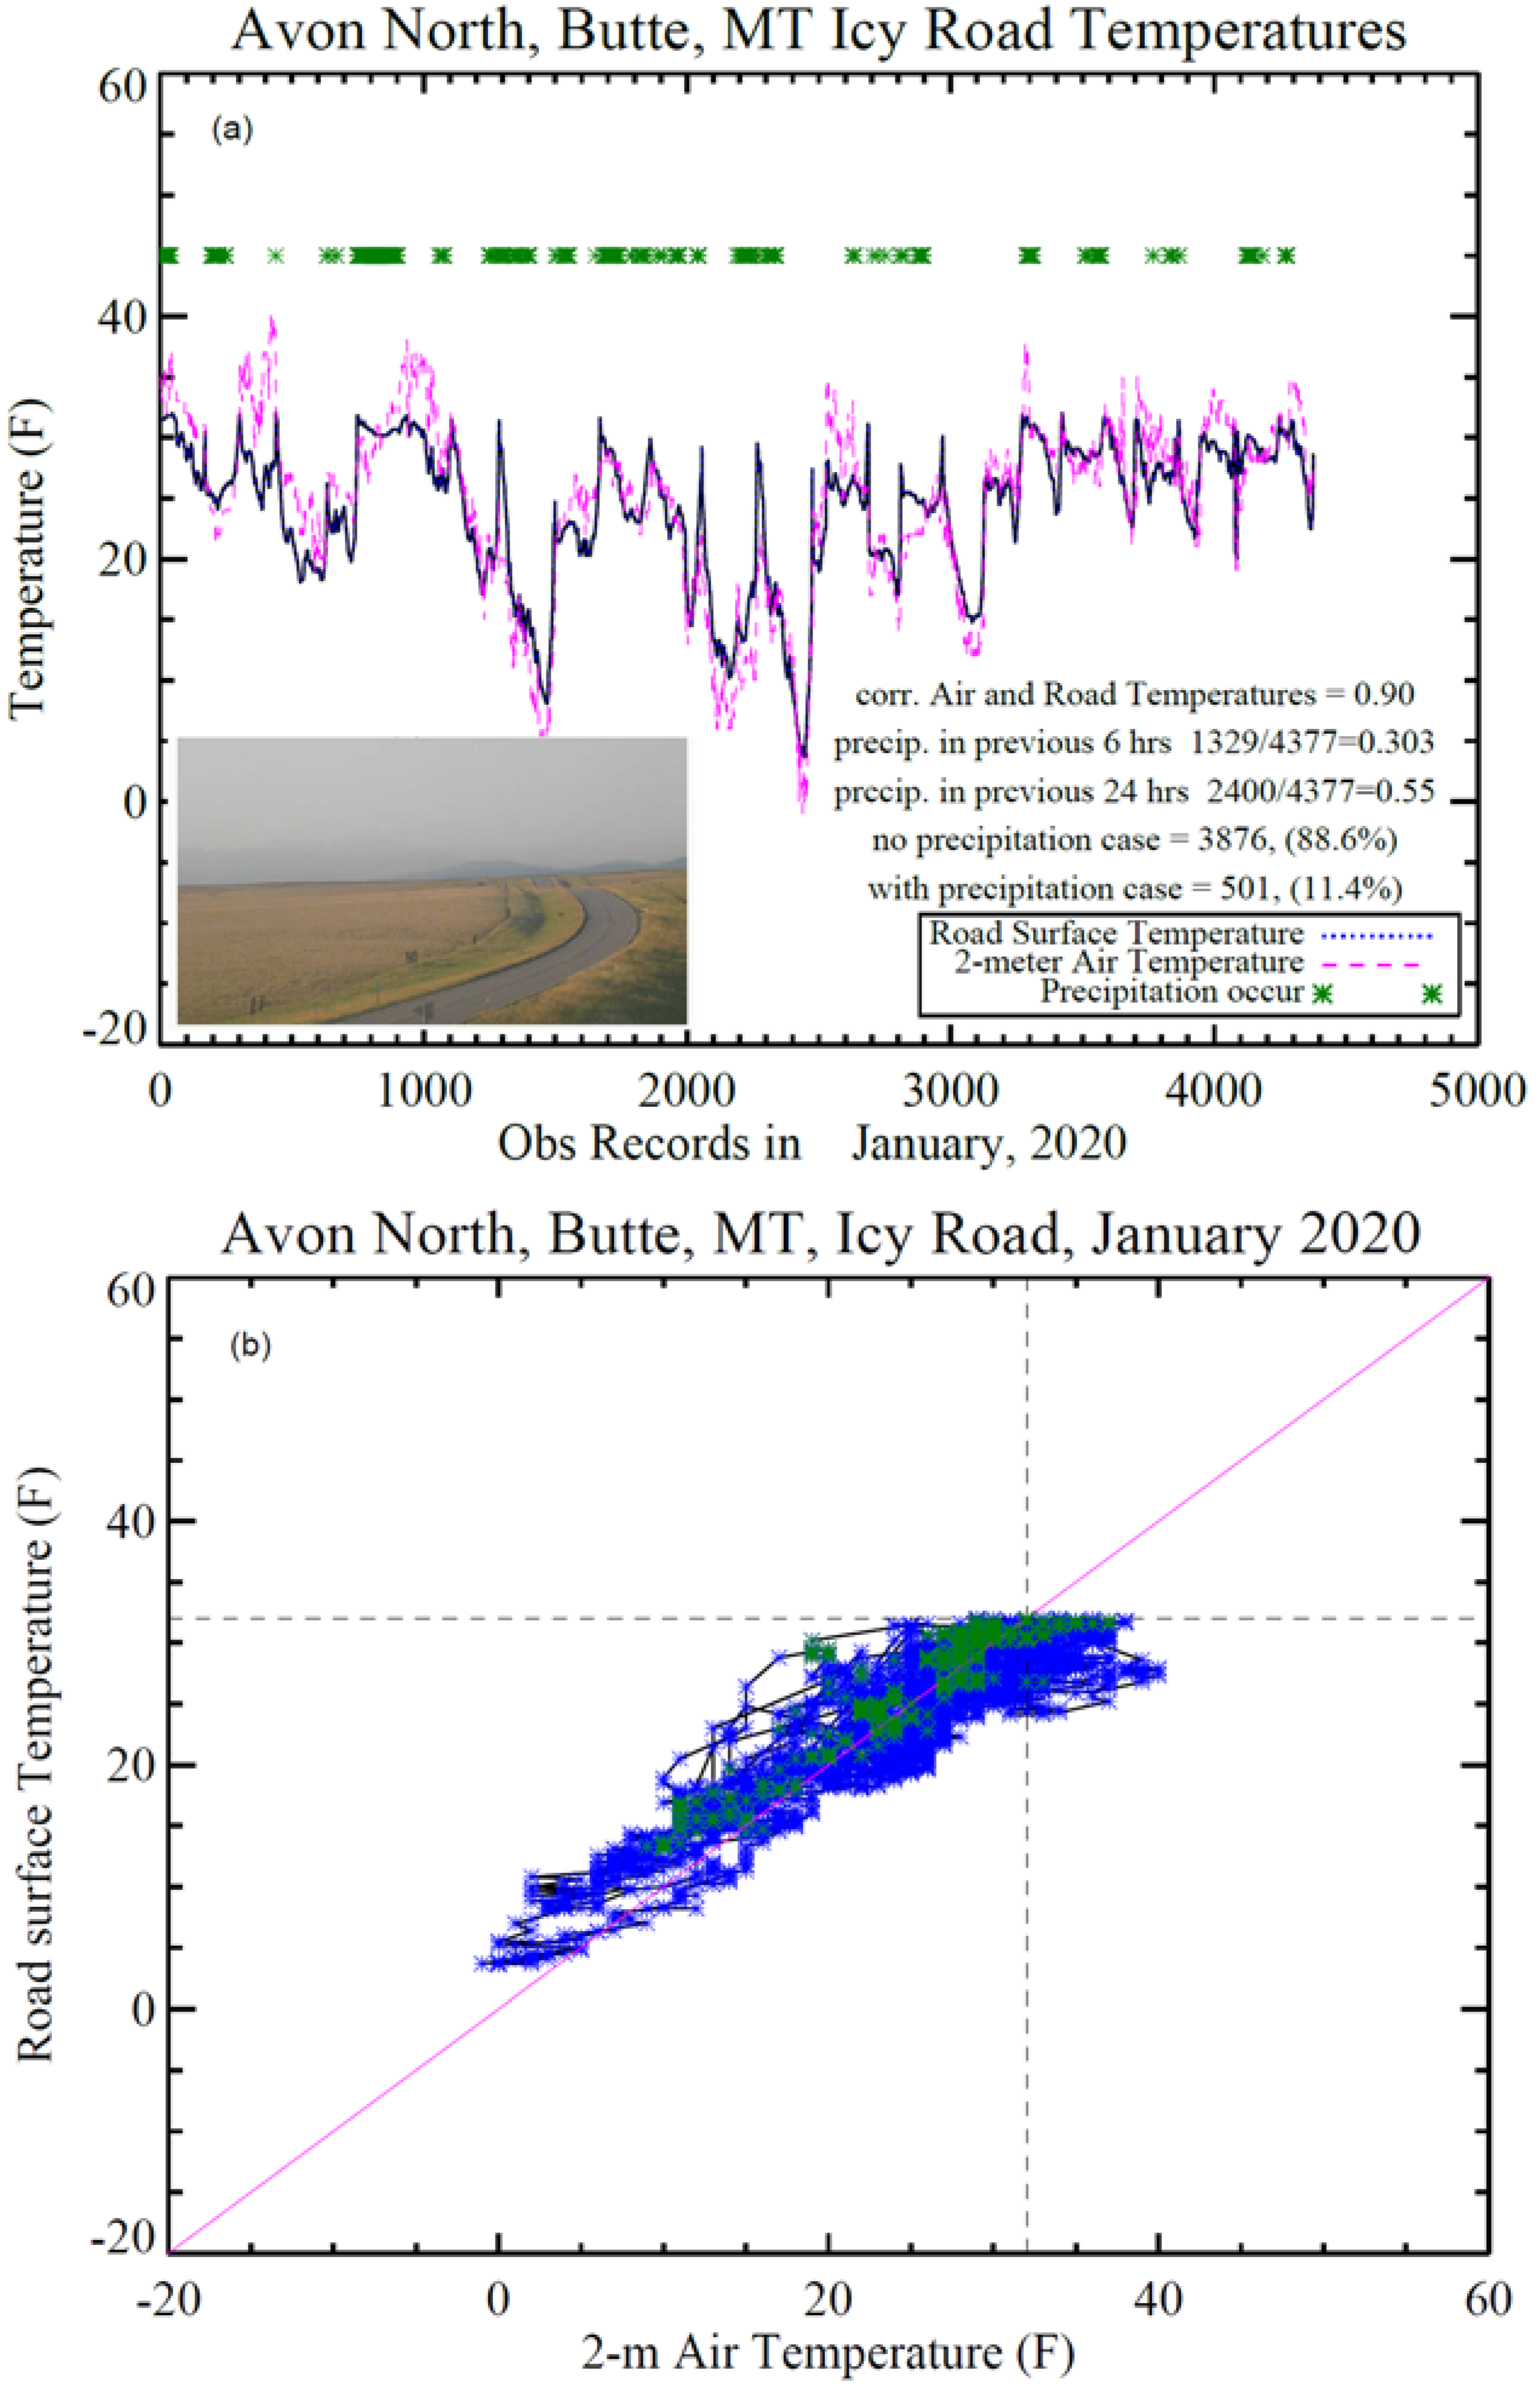
Avon North is a rural site at an elevation of 5805 feet (1550 m) in Montana with nearby land cover of cropland, as shown in the left lower corner of Figure 4a. In the same month of January 2020, while MacDonald Pass had a 0.85 correlation coefficient between the road pavement surface and air temperatures (Figure 3a) and Cary Cooper Bridge had a high correlation of 0.97 (Figure 3d), the Avon North site had a 0.90 correlation coefficient. For all road ice presenting times, 88.6% of road ice occurred when there was no precipitation at the same time. A total of 30.3% of the time, precipitation events occurred in the past 6 h and 55% of the time there were precipitation events in the last 24 h. Furthermore, the 2 m air and pavement surface temperatures both had similar diurnal variation patterns controlled by the surface energy budget (Equation (1)).
At the Avon North location, the road had ice when the road pavement temperature was equal to or below 32 °F (Figure 4b), regardless of snowfall/precipitation (i.e., the green markers). Nevertheless, the RWIS instrument reported road “ice” vs. “wet” as a function of the road surface temperature. Namely, based on the RWIS instrument manual, the road state is “ice warning” when the road temperature is below or equal to 32 °F (i.e., 0 °C). If the road is above 32 °F (i.e., 0 °C), the sensor reports “wet” for the road surface status. It seems that this 32 °F is a designed pre-set threshold in the RWIS engineering algorithm. This threshold, nevertheless, seems to be consistent with the physics because the ice-water mixing liquid has a temperature of 32 °F (i.e., 0 °C); when a road surface is next to ice-water mixing liquid, the road pavement reaches thermal equilibrium and has the same temperature of 32 °F (i.e., 0 °C). If the road surface is covered by un-melted snow, it may have an even lower temperature than 32 °F (i.e., 0 °C).
The air temperature could be above 32 °F (i.e., 0 °C; dashed vertical line in Figure 4b), even when road ice occurred. All other sites analyzed showed a similar pattern, suggesting that the road pavement temperature may be a better ice index than the air temperature: when the road pavement surface is warmer than 32 °F (i.e., 0 °C) the road cannot have ice. Nevertheless, whether this 32 °F threshold is induced by the RWIS sensor built-in reporting algorithm requires further research using independent instruments.
The pavement surface was normally warmer than the 2 m air (i.e., above the purple line in Figure 4b), but, from time to time, the former could be colder than the latter. However, upon snowfall (i.e., the green markers), the pavement was covered by ice/snow and mostly had the same temperature as the air. In addition, when the air was colder than 10 °F (i.e., −12.2 °C) or the pavement colder than 15 °F the road always had ice.

3.3. Urban Heat Island (UHI) Effects and Road Ice in Proximity to a City

At a site 10 miles eastward of I-90, namely, downwind of city Bozeman, the urban heat island effect (UHI) may affect this location in two ways: first, the road pavement was warmer than the air most of the times, since most of the observations fell on the left side of the purple line (Figure 5). The minimum pavement temperature was as low as 14 °F (i.e., −10.0 °C). This result is consistent with the previously observed feature in March 2019 (Figure 3c). Second, there was no precipitation at any time in March 2020, but the road still had ice. Cities alter the frequency and intensity of precipitation [43] and lead to black ice occurrence.
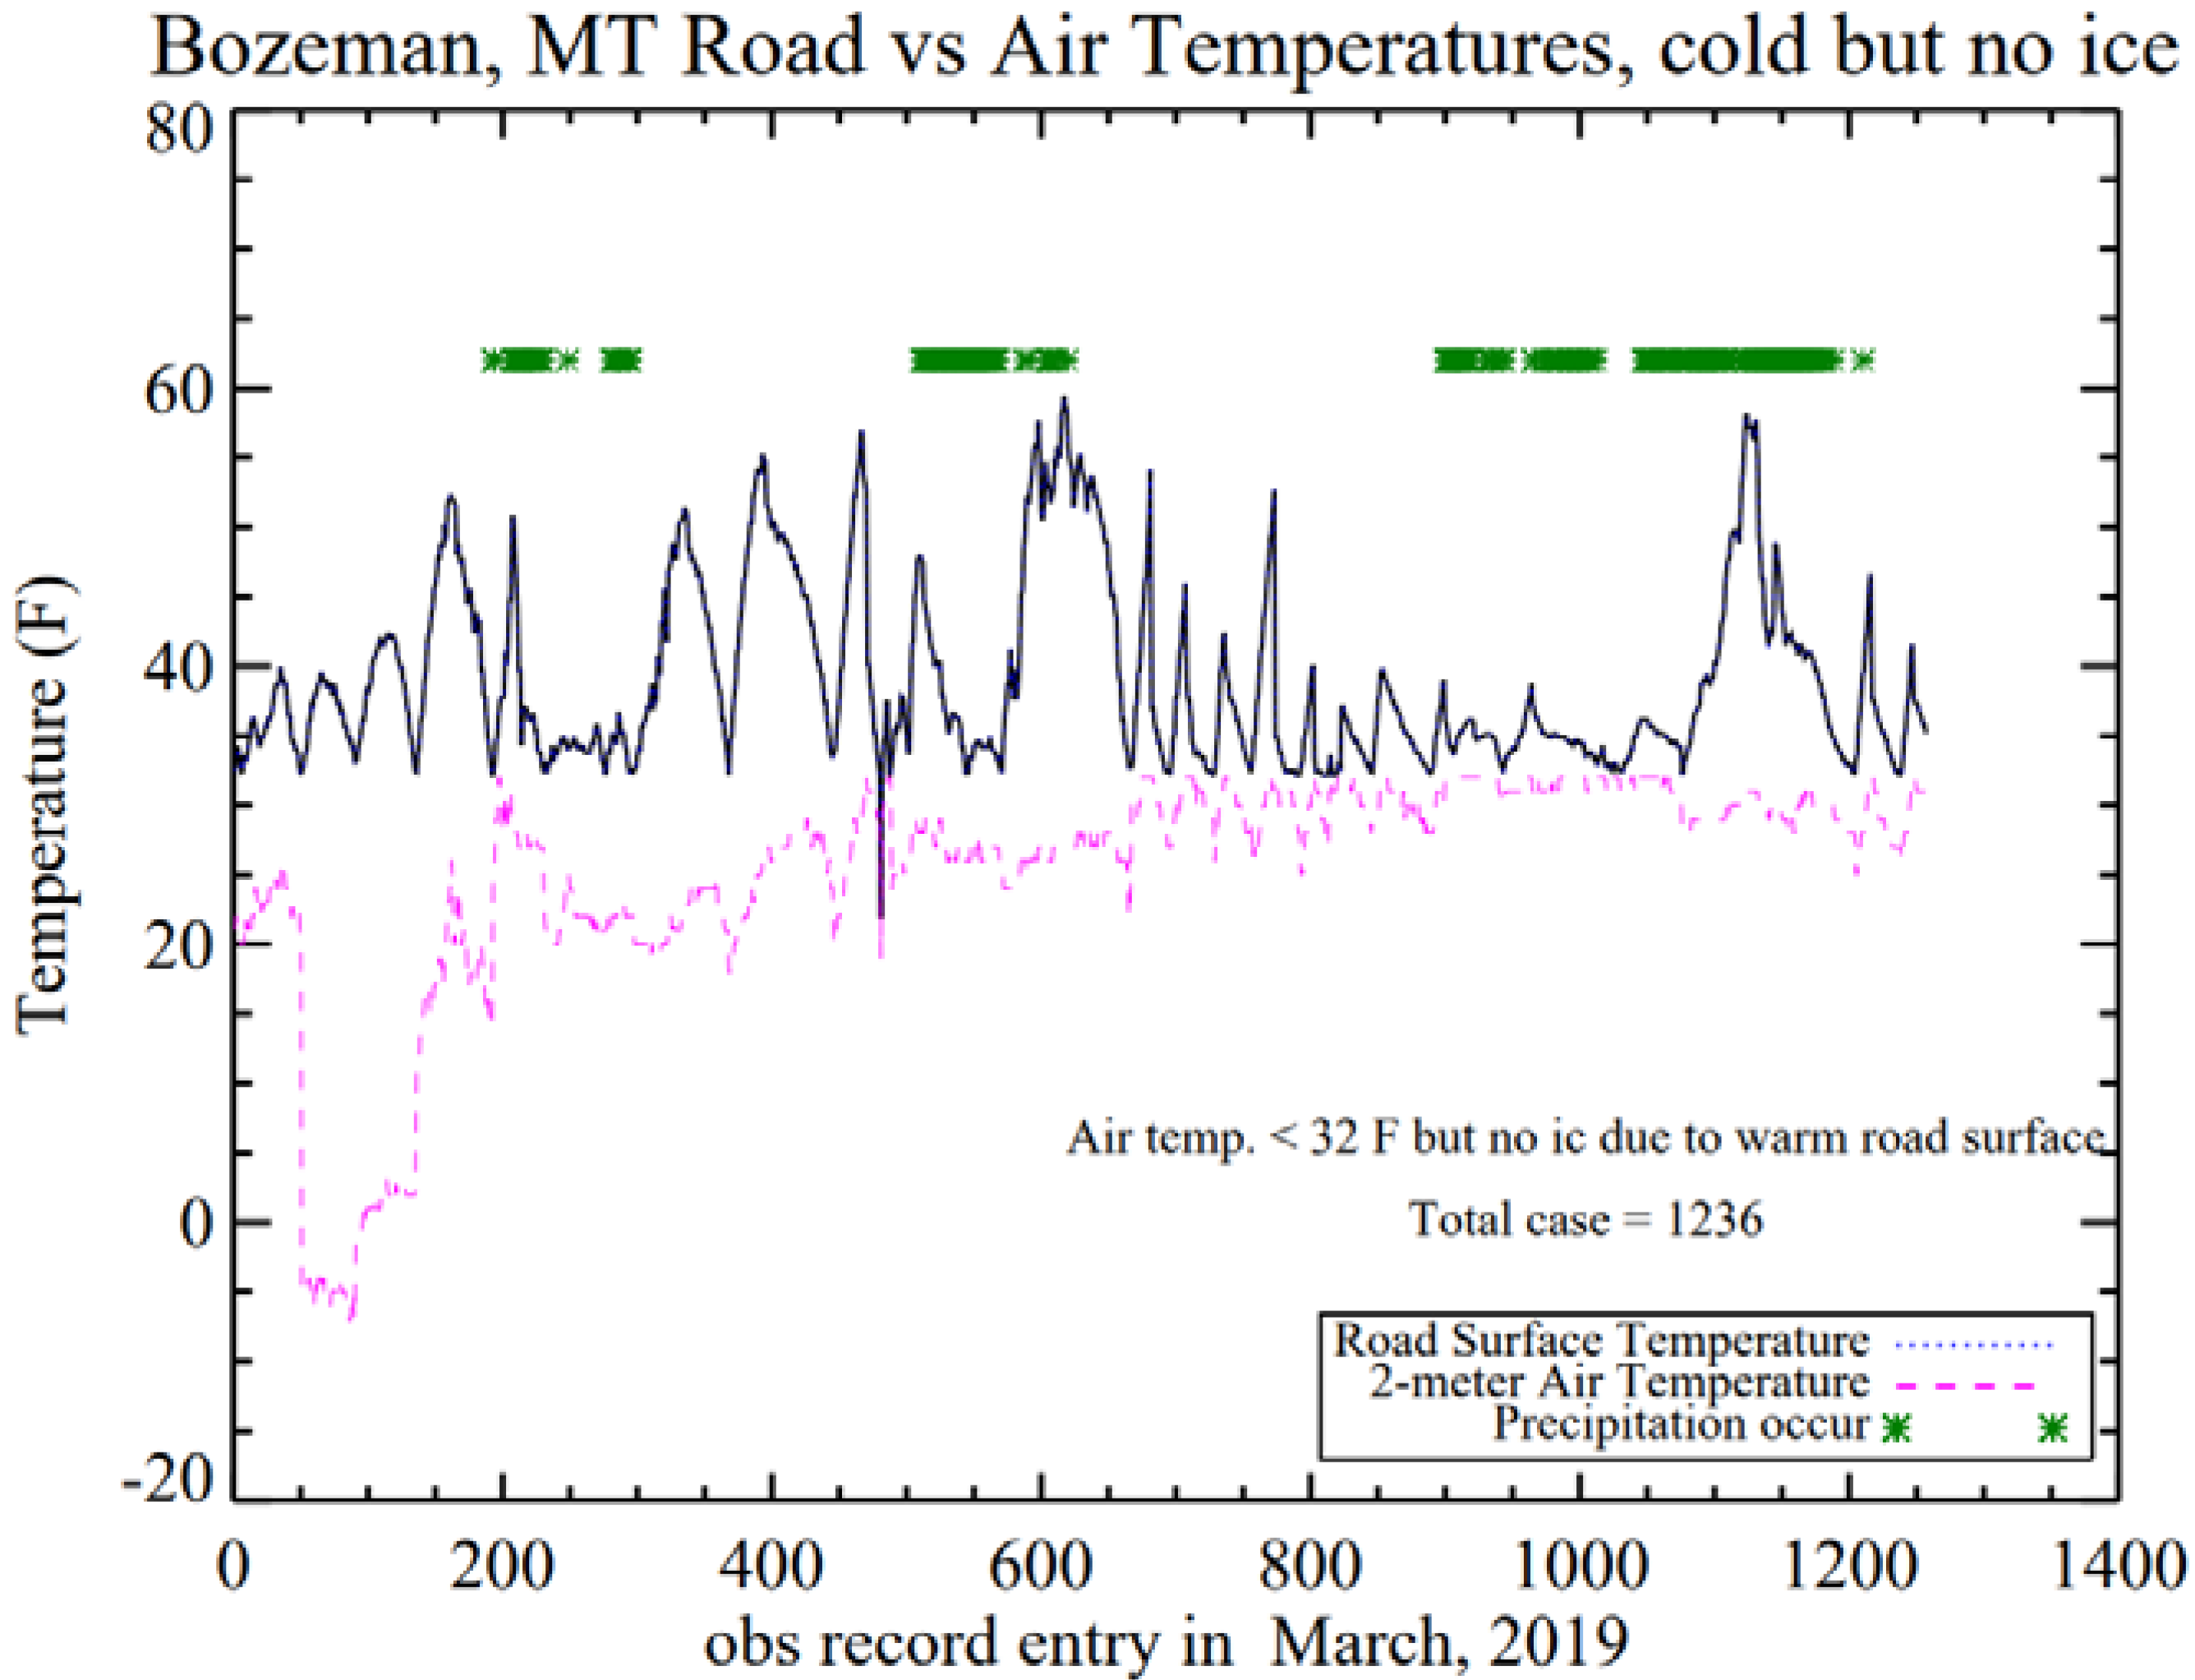
Cold surface air does not always guarantee road ice formation. On some days in March 2019, the air temperatures were below 20 °F (i.e., −9.4 °C) and still no ice formed at the Bozeman Pass site (Figure 6). During these times, the pavement temperatures were close to or above 32 °F (i.e., 0 °C). This suggests, again, that the pavement temperature may be the determining threshold for road ice to form. Furthermore, on these no ice but cold days, there was a clear decoupled phase between the 2 m air and the pavement temperature diurnal variations, compared to the icy days (Figure 3c) when the pavement and air temperatures had similar diurnal variations in terms of diurnal variation and diurnal range. More importantly, even when the pavement temperature was below 32 °F (i.e., 0 °C), the road did not form ice (for example, around the time point 470 on the x-axis of Figure 6, the pavement temperature was even around 20 °F (i.e., −6.7 °C) but no ice occurred). A decoupling of diurnal variations of the pavement and the air temperatures found for no ice roads, if confirmed by other sites, might be an important feature. Such a decoupling feature might be due to DOT anti-icing treatment. Therefore, it would be important to include anti-icing/de-icing impacts in the road ice forecast.

3.4. Icy Bridge Temperatures with Monthly Variations

The bridge pavement can be significantly colder than other non-bridge sites (Figure 3d). When precipitation occurred (i.e., green markers in Figure 7) the pavement surface was consistently warmer than outlying 2 m air temperatures but was always below 32 °F (i.e., 0 °C). Furthermore, the air temperature changed more than the pavement. For example, the air temperatures varied from 0 to 45 °F (i.e., 7.2 °C) in February and from 0 to 32 °F (i.e., 0 °C) in March, while the pavement temperature was always between 5 and 32 °F (i.e., −15.0 C to 0 °C) in March (Figure 7b). Such monthly variations in these two temperatures were evidently due partly to synoptic weather systems.

3.5. Subsurface Temperature Variations and Effects

The subsurface temperature varied by a significantly smaller magnitude than the pavement surface temperature and the 2 m air temperature, in both the diurnal range and on the monthly scale (Figure 8). This was due to the large heat capacity and hydro-conductivity of the top concrete/asphalt layer as well as the natural aggregate layer; thus, little heat energy transported to the subsurface layer. During January 2020, the subsurface temperature varied by about 25–30 °F (i.e., −3.9 °C to −1.1 °C) on the MacDonald Pass site (Figure 8a), with the similar range at the Bozeman Pass site (Figure 8b). Bozeman is a near-city site and had no precipitation during January 2020. MacDonald Pass is a mountain site where 77.5% of the time there was precipitation when road ice formed. This small change in the subsurface temperature seems to be consistent across RWIS sites and indicates that this variable cannot reflect the rapid changes in the road surface and, thus, should not be used as a good index to forecast road ice formation.

3.6. Relative Humidity (RH) and Road Ice Formation

The MacDonald Pass site, a mountain site with an elevation above 6000 feet, showed clear diurnal variations in pavement temperature, air temperature, and dew point as functions of solar radiation, precipitation, and cloud cover (Figure 9) upon the occurrence of ice at this site. The relative humidity (RH) varied from 23 to 100%, indicating that, on this road segment, ice formed on the road no matter whether the RH was high or low. Therefore, RH and the dew point were not strong indicators of road ice occurrence. Similar results for RH were also observed at other RWIS sites. In addition, when the road surface was covered by snow or ice the pavement was occasionally colder than the air. Nevertheless, this colder-than-air pavement temperature did not seem to be related to RH, subsurface temperature, or wind speed.

3.7. Lake Effect

The Georgetown Lake site (Site ID: 267009) is a next-to-lake RWIS site at Montana Highway 1 MP 25.4, with an elevation of 6339 feet (1932 m, Figure 10). This site has both the lake effect and high elevation effect. From 1 November 2020 to 31 March 2021, there were 6719 total data points collected using the RWIS, with 2675 for road ice cases and 4044 for no road ice cases. Among these data, the Pearson’s correlation coefficient between the 2 m air temperature and the pavement surface temperature for no ice cases was 0.86 and for ice cases it was 0.85. Further analyses with the road surface as ice vs. no ice, day vs. night, respectively, were conducted to disclose day and night differences. For ice cases, road pavement temperatures at Georgetown Lake site were, again, consistently equal to or below 32 °F (i.e., 0 °C, Figure 10), suggesting that no ice formed when the road pavement temperature was above 32 °F.
The least-square linear relationship between the road pavement temperature (Tsfs) and 2 m air temperature (Tair) was calculated (unit in °F):
Tsfs = 1.31 × Tair + 0.45,    for daytime;
Tsfs = 1.20 × Tair + 0.86,    for nighttime.
Equations (2) and (3) disclosed Tsfs and Tair relations for daytime vs. night, respectively. Once Tair dropped below 14 °F, road ice always formed on this lake site. Furthermore, when all ice and non-ice data were included, the pavement temperature changed faster than the 2 m air (1.31 × Tair for day time (Figure 11a) and 1.20 × Tair for nighttime, Figure 11b). Nevertheless, these were the only statistical relationships obtained using sub-hourly RWIS observations during November 2020–March 2021. Different sites have different equations due to local land cover types and micro-meteorological conditions for each site.
When analyzing only icy cases (i.e., the red dots in Figure 11), the least-square linear relationships are as follows (unit in °F):
Tsfs = 0.89 × Tair + 17.21,    for daytime icy cases;
Tsfc = 0.89 × Tair + 15.86,    for nighttime icy cases.
This suggests that during both daytime and night, with 1 °F (i.e., 0.55 °C) Tair reduction, Tsfc reduced by only 0.89 °F (i.e., 0.49 °C). Namely, when the road was covered by snow/ice the pavement got cold slower than the upper air layer. This relation suggests that around a lake the evaporative cooling effect, a process whereby water evaporates from lake to the outlying atmosphere, may reduce Tair further than a site in a non-lake area. This lake evaporative cooling effect might be important for accelerating road ice formation.

4. Final Remarks

The road pavement temperature can be used to forecast the road ice status. The difference between the pavement and air temperature is determined via net radiation, sensible and latent heat fluxes, and the ground heat flux, including anthropogenic flux due to traffic, as shown in Equation (1). A road physical model needs to re-produce the pavement—2 m air temperature relation and understand under what conditions the road ice can form. The key conclusions from this observation analysis study are listed as follows:
(a)
The pavement surface is warmer than the road air in daytime and nighttime during clear days and nights. During a sunny day in winter, the pavement temperature can be higher than the air by 20 °F (i.e., −6.7 °C). When the road pavement is covered by snow or ice, the pavement could be occasionally colder than the air. Nevertheless, this colder-than-air pavement temperature does not seem to be due to RH, subsurface temperature, or wind speed. The water evaporative cooling effect might contribute to this. More research is needed to understand under which conditions the road pavement is colder than the outlying air.
(b)
For a clear road (i.e., a road pavement that has no snow or ice), the pavement surface temperature is equivalent to the skin temperature in terms of magnitude, although these two variables are measured differently and have different physical meanings. When the road is covered by snow or ice, the pavement temperature differs from the skin temperature, since the pavement temperature is measured using a thermal conductivity sensor embedded in the pavement, while the skin temperature is measured from the top snow/ice layer.
(c)
While synoptic weather processes determine the overall precipitation, heat, and wind variations, local conditions such as the land cover type, geographic features, and river/lake distribution affect road ice formation. Consequently, the hyper-local scale model with local domain knowledge is essential to forecast the ice formation on a specific road segment.
(d)
Ice can form at various RHs from 20–100%. Therefore, RH seems not to be a critical index for ice formation.
(e)
The subsurface temperature varies less significantly than the pavement surface and air temperatures, suggesting that it is not a good indicator to determine whether road ice forms or not. The subsurface temperature, measured using MDT RWIS in highways, does not reflect the soil temperature since it is within the sub-layer of road construction. Note that different RWIS sites built by different U.S. states may bury the subsurface sensor at different depths from the road surface.
(f)
The road pavement surface temperature may be the key parameter for road ice to form. When the road is icy, the pavement temperatures are always below 32 °F (i.e., 0 °C), even when surface air temperature is above 32 °F (i.e., 0 °C). Therefore, a 32 °F (i.e., 0 °C) pavement temperature may be the most critical threshold for determining the absence of road ice (e.g., if the road pavement temperature is above 32 °F (i.e., 0 °C), no ice would form). However, the RWIS data might be designed to report “ice” when the pavement temperature is below or equal to 32 °F (i.e., 0 °C). If this is the case, then this 32 °F (i.e., 0 °C) threshold is pre-set in the RWIS sensor engineering algorithm. Independent observations must be collected to further confirm this road ice formation condition. Furthermore, it is equally urgent to study why sometimes ice did not occur even when the pavement temperatures were below 32 °F (i.e., 0 °C, Figure 5).
(g)
When there is precipitation, the pavement and air temperatures are close to each other. This is similar to a previous observed feature: in cloudy conditions, the skin and air temperatures are similar [50]; during sunny days, the skin temperature is higher than the air temperature.
(h)
Urban and nearby regions seem to have black ice more frequently than other regions. Bozeman Pass, MT, for example, is 10 miles east of the city. No rainfall/snowfall occurred in the city and surrounding region during January and March 2020, while road ice occurred ~80% of the time. In addition, this close-to-urban road surface (i.e., Bozeman Pass) was almost always warmer than the outlying 2 m air temperature by up to 30 °F (i.e., −1.1 °C) and had clear diurnal variations. However, the air temperature varied more rapidly than the pavement temperature, partially due to synoptic atmospheric advection.
Analyses on road weather variables are urgently needed. RWIS data are extremely valuable and should be investigated in depth. Each DOT has RWIS sites and observations are free to the public. Highways are built across large heterogeneous land surfaces. The surface-layer wind is highly heterogeneous. Pavement temperature also varies with surface-layer turbulence. In addition, more research is needed to understand wind effects on road ice formation. In addition, black ice is one critical challenge and, currently, the understanding of its formation is very limited due to little observations.
It is desirable to justify and describe the classification of ice on the roads according to the leading natural factor—for example, daily, seasonal, and weather anomalies. We need to analyze multiple-year observations to obtain the averaged status of ice conditions. In addition, we may need to simulate roads for different surrounding settings, for example, Jacobs and Raatz [28] developed a road surface energy budget model for unobstructed roads with regular traffic and little traffic, respectively, shaded roads, bridges, and roads in urban systems. It would be logical to eventually create a schematic model of ice after clear research on the importance of factors for ice formation on roads.
In a national weather service forecasting model (NWS), the pavement surface temperature is not simulated since roads beyond the cities are not part of the scheme. Nevertheless, the land-surface skin and air temperature are simulated, although the skin temperature is not output for the public to access. Forecasting the surface skin and air temperatures still has larger uncertainties in all models. The NOAA Global Forecast Model, for example, shows a 0.5–2 °C bias on the 2 m air temperature and even larger error in skin temperature [40]. Even if the skin temperature is well simulated, how to derive the pavement surface temperature from skin, air, and other weather variables remains a challenge to be studied.
The pavement and air temperature statistical relations presented in this study (i.e., Equations (2)–(5)) were only based on RWIS observations for 1 January–31 March 2021. Multiple-year data are necessary to build a more robust statistical model.
Forecasting road ice formation would have broad societal impacts [14]. If the DOT has accurate ice formation predictions in advance, they can use less de-icing material and keep the roadway wet rather than icy, which is safer for the traveling public. Individual drivers could also be rapidly alerted, if the road ice forecast is accurate.

Author Contributions

Methodology, M.J.; Software, M.J.; Validation, M.J.; Formal analysis, M.J.; Resources, D.G.M.; Writing—original draft, M.J.; Writing—review & editing, M.J. and D.G.M.; Project administration, M.J.; Funding acquisition, D.G.M. All authors have read and agreed to the published version of the manuscript.

Funding

This research was funded by NSF Small Business Innovation Research (Award number: 1931673) and a Montana Department of Transportation Research Grant during 2020–2022.

Data Availability Statement

All Road Weather Information System (RWIS) data used during this study are openly available from the Montana Department of Transportation.

Acknowledgments

The authors thank the two anonymous reviewers for their constructive comments. The author Menglin Jin is also affiliated with SpringGem Weather Information, LLC.

Conflicts of Interest

Author Menglin Jin was employed by SpringGem Weather Information, LLC. The remaining author declare that the research was conducted in the absence of any commercial or financial relationships that could be construed as a potential conflict of interest.

References

  1. Koetse, M.J.; Rietveld, P. The impact of climate change and weather on transport: An overview of empirical findings. Transp. Res. Part D Transp. Environ. 2009, 14, 205–221. [Google Scholar] [CrossRef]
  2. Kashfi, S.A.; Bunker, J.M.; Yigitcanlar, T. Understanding the effects of complex seasonality on suburban daily transit ridership. J. Transp. Geogr. 2015, 46, 67–80. [Google Scholar] [CrossRef]
  3. Black, A.W.; Mote, T.L. Characteristics of Winter-Precipitation-Related Transportation Fatalities in the United States. Weather Clim. Soc. 2015, 7, 133–145. [Google Scholar]
  4. Yu, H.; Li, Z.; Zhang, G.; Liu, P. A latent class approach for driver injury severity analysis in highway single vehicle crash considering unobserved heterogeneity and temporal influence. Anal. Methods Accid. Res. 2019, 24, 100110. [Google Scholar] [CrossRef]
  5. Tobin, D.M.; Reeves, H.D.; Gibson, M.N.; Rosenow, A.A. Weather Conditions and Messaging Associated with Fatal Winter-Weather-Related Motor-Vehicle Crashes. Weather Clim. Soc. 2022, 14, 835–848. [Google Scholar] [CrossRef]
  6. Harris, K. An Analysis of Atlanta Road Surface Temperature for Improving Urban Transit. Master’s Thesis, University of Georgia, Athens, GA, USA, 2018. [Google Scholar]
  7. Du, S.; Akin, M.; Bergner, D.; Xu, G.; Shi, X. Synthesis of Material Application Methodologies for Winter Operations. In Final Report for the Clear Roads Pooled Fund and Minnesota Department of Transportation; Minnesota Department of Transportation (MnDOT): Saint Paul, MN, USA, 2019. [Google Scholar]
  8. FHWA. Manual of Practice for an Effective Anti-Icing Program; FHWA-RD-95-202; Federal Highway Administration Publication: Washington, DC, USA, 1996.
  9. Dai, H.L.; Zhang, K.L.; Xu, X.L.; Yu, H.Y. Evaluation on the Effects of Deicing Chemicals on Soil and Water Environment. Procedia Environ. Sci. 2012, 13, 2122–2130. [Google Scholar] [CrossRef]
  10. Ordóñez-Barona, C.; Sabetski, V.; Millward, A.A.; Steenberg, J. De-icing salt contamination reduces urban tree performance in structural soil cells. Environ. Pollut. 2018, 234, 562–571. [Google Scholar] [CrossRef]
  11. Takle, E. Bridge and roadway frost: Occurrence and prediction by use of an expert system. J. Appl. Meteor. 1990, 29, 727–735. [Google Scholar]
  12. Gustavsson, T. Analyses of local climatological factors controlling risk of road slipperiness during warm-air advections. Int. J. Climatol. 1991, 11, 315–330. [Google Scholar] [CrossRef]
  13. Toms, B.A.; Basara, J.B.; Hong, Y. Usage of existing meteorological data networks for parameterized road ice formation modeling. J. Appl. Meteorol. Climatol. 2017, 56, 1959–1976. [Google Scholar] [CrossRef]
  14. Hewson, T.D.; Gait, N.J. Hoar frost deposition on roads. Meteor. Mag. 1992, 121, 1–21. [Google Scholar]
  15. Scherm, H.; Bruggen, V. Sensitivity of simulated dew duration to meteorological variations in different climatic regions of California. Agric. For. Meteor. 1993, 66, 229–245. [Google Scholar] [CrossRef]
  16. Bogren, J.; Gustavsson, T.; Karlsson, M. Temperature differences in the air layer close to a road surface. Meteor. Appl. 2001, 8, 385–395. [Google Scholar] [CrossRef]
  17. Jin, M.; Dickinson, R.E. A generalized algorithm for retrieving cloudy sky skin temperature from satellite thermal infrared radiances. J. Geophys. Res. 2000, 105, 27037–27047. [Google Scholar] [CrossRef]
  18. Shao, J.; Lister, P.J.; Fairmaner, W.D. Numerical simulations of shading effect and road-surface state. Meteorol. Appl. 1994, 1, 209–213. [Google Scholar] [CrossRef]
  19. Chapman, L.; Thornes, J.E.; Huang, Y.; Cai, X.; Sanderson, V.L.; White, S.P. Modeling of rail surface temperatures: A preliminary study. Theor. Appl. Climatol. 2008, 92, 121–131. [Google Scholar] [CrossRef]
  20. Call, D.A. Changes in ice storm impacts over time: 1886–2000. Weather Clim. Soc. 2010, 2, 23–35. [Google Scholar]
  21. Bouilloud, L.; Martin, E.; Habets, F.; Boone, A.; Le Moigne, P.; Livet, J.; Marchetti, M.; Foidart, A.; Franchistéguy, L.; Morel, S.; et al. Road surface condition forecasting in France. J. Appl. Meteorol. Climatol. 2009, 48, 2513–2527. [Google Scholar] [CrossRef]
  22. Riehm, M.; Gustavsson, T.; Bogren, J.; Jansson, P.-E. Ice formation detection on road surfaces using infrared thermometry. Cold Reg. Sci. Technol. 2012, 83, 71–76. [Google Scholar]
  23. Crevier, L.-P.; Delage, Y. METRo: A New Model for Road-Condition Forecasting in Canada. J. Appl. Meteorol. Climatol. 2001, 40, 2026–2037. [Google Scholar]
  24. Rayer, P. The Meteorological Office forecast road surface temperature model. Meteor. Mag. 1987, 116, 180–191. [Google Scholar]
  25. Sass, B. A numerical model for prediction of road temperature and ice. J. Appl. Meteor. 1992, 31, 1499–1506. [Google Scholar]
  26. Sass, B. A numerical forecasting system for the prediction of slippery roads. J. Appl. Meteor. 1997, 36, 801–817. [Google Scholar]
  27. Shao, J.; Thornes, J.E.; Lister, P.J. Description and verification of a road ice prediction model. In Transportation Research Record, Proceeding of the Third International Symposium on Snow Removal and Ice Control Technology, Minneapolis, MN, USA, 14–18 September 1992; National Academy of Sciences: Washington, DC, USA, 1993; Volume 1387. [Google Scholar]
  28. Jacobs, W.; Raatz, W.E. Forecasting road-surface temperatures for different site characteristics. Meteorol. Appl. 1996, 3, 243–256. [Google Scholar] [CrossRef]
  29. Eriksson, M. Regional influence on road slipperiness during winter precipitation events. Meteor. Appl. 2001, 8, 449–460. [Google Scholar] [CrossRef]
  30. Gustavsson, T. A study of air and road-surface temperature variations during clear windy nights. Int. J. Climatol. 1995, 15, 919–932. [Google Scholar] [CrossRef]
  31. Hu, Y.; Ou, T.; Huang, J.; Gustavsson, T.; Bogren, J. Winter hoar frost conditions on Swedish roads in a warming climate. Int. J. Climatol. 2018, 38, 4345–4354. [Google Scholar] [CrossRef]
  32. Handler, S.L.; Reeves, H.D.; McGovern, A. Development of a Probabilistic Subfreezing Road Temperature Nowcast and Forecast Using Machine Learning. Weather Clim. 2020, 35, 1845–1863. [Google Scholar] [CrossRef]
  33. Fowler, J.W.; Jin, M.S.; Bauer, B.A.; Naylor, J.R. Icy Road Forecast and Alert (IcyRoad): Validation and Refinement Using MDT RWIS Data. Final Report, Montana Department of Transportation Research Project (FHWA/MT-22-001/9891-785). 2022. Available online: https://www.mdt.mt.gov/other/webdata/external/research/docs/research_proj/ICYROAD-RWIS/Final-Report.pdf (accessed on 24 April 2024).
  34. Jin, M.; Shepherd, J.M. On including urban landscape in land surface model—How can satellite data help? Bull. Amer. Meteor. Soc. 2005, 86, 681–689. [Google Scholar] [CrossRef]
  35. Ewan, L.; Al-Kaisy, A. Assessment of Montana Road Weather Information System (RWIS). A Report to MDT. 2017. Available online: https://westerntransportationinstitute.org/wp-content/uploads/2018/02/4W5278_RWIS_Assessment_MDT_final_report.pdf (accessed on 24 April 2024).
  36. Johnson, B.; Shepherd, M. An analysis of Atlanta road surface temperature for improving urban transit. Urban Clim. 2018, 24, 205–220. [Google Scholar] [CrossRef]
  37. Jin, M.; Dickinson, R.E. Interpolation of surface radiation temperature measured from polar orbiting satellites to a diurnal cycle. Part 1: Without Clouds. J. Geophys. Res. 1999, 104, 2105–2116. [Google Scholar] [CrossRef]
  38. Jin, M. Interpolation of surface radiation temperature measured from polar orbiting satellites to a diurnal cycle. Part 2: Cloudy-pixel Treatment. J. Geophys. Res. 2000, 105, 4061–4076. [Google Scholar] [CrossRef]
  39. Mote, T.L. On the association between air temperatures and snow depth. J. Appl. Meteor. Climatol. 2008, 47, 2008–2022. [Google Scholar] [CrossRef]
  40. Zheng, W.; Ek, M.; Mitchell, K.; Wei, H.; Meng, J. Improving the stable surface layer in the NCEP Global Forecast System. Mon. Wea. Rev. 2017, 45, 3969–3987. [Google Scholar] [CrossRef]
  41. Jin, M. Developing an Index to Measure Urban Heat Island Effect Using Satellite Land Skin Temperature and Land Cover Observations. J. Clim. 2012, 25, 6193–6201. [Google Scholar] [CrossRef]
  42. Jin, M.; Dickinson, R.E.; Zhang, D.L. The footprint of urban areas on global climate as characterized by MODIS. J. Clim. 2005, 18, 1551–1565. [Google Scholar] [CrossRef]
  43. Straka, J. Cloud and Precipitation Microphysics; Cambridge University Press: Cambridge, UK, 2009; p. 408. [Google Scholar]
  44. Wang, S.; Wang, Q.; Jordan, R.E.; Perssons, P.O.G. Interactions among longwave radiation of clouds, turbulence, and snow surface temperature in the Arctic: A model sensitivity study. J. Geophys. Res. 2001, 106, 15323–15333. [Google Scholar] [CrossRef]
  45. Panahandeh, G.; Ek, E.; Mohammadiha, N. Road friction estimation for connected vehicles using supervised machine learning. In Proceedings of the 2017 IEEE Intelligent Vehicles Symposium (IV), Los Angeles, CA, USA, 11–14 June 2017; pp. 1262–1267. [Google Scholar] [CrossRef]
  46. Roychowdhury, S.; Zhao, M.; Wallin, A.; Ohlsson, N.; Jonasson, M. Machine Learning Models for Road Surface and Friction Estimation using Front-Camera Images. In Proceedings of the 2018 International Joint Conference on Neural Networks (IJCNN), Rio de Janeiro, Brazil, 8–13 July 2018; pp. 1–8. [Google Scholar] [CrossRef]
  47. Dai, Y.; Shangguan, W.; Wei, N.; Xin, Q.; Yuan, H.; Zhang, S.; Liu, S.; Lu, X.; Wang, D.; Yan, F. A review of the global soil property maps for Earth system models. Soil 2019, 5, 137–158. [Google Scholar] [CrossRef]
  48. Chang, H.; Ren, R.; Yang, S.; Wang, Y. Monitoring and analysis of the temperature field of a cold-region highway tunnel considering the traffic-induced thermal effect. Case Stud. Therm. Eng. 2022, 40, 10248. [Google Scholar] [CrossRef]
  49. Shepherd, J.; Pierce, H.; Negri, A. Rainfall modification by major urban areas: Observations from space-borne rain radar on the TRMM satellite. J. Appl. Meteor. Climatol. 2002, 41, 689–701. [Google Scholar]
  50. Jin, M.; Dickinson, R.E.; Vogelmann, A.M. A Comparison of CCM2/BATS Skin Temperature and Surface-Air Temperature with Satellite and Surface Observations. J. Clim. 1997, 10, 1505–1524. [Google Scholar] [CrossRef]
Figure 1. (a). Concept profile of cross section of highway. (Modified after https://pubs.usgs.gov/fs/2006/3127/2006-3127.pdf (accessed on 24 April 2024)). (b). A typical section or roadway for two-lane road with shoulders (Source: https://www.mdt.mt.gov/business/contracting/detailed-drawings.aspx (accessed on 24 April 2024)).
Climate 12 00063 g001
Figure 2. (a) Shows the locations of the 73 RWIS sites with the selected site shown in red. (b) Presents the observed air temperature (in red) measured using the RWIS sensor and the North American Mesoscale Forecast System (NAM) model forecasted surface 2 m air temperature (in green). Selecting different RWIS sites from the window, (a) displays corresponding observations measured at the selected site and corresponding NAM model forecast. (a) was built based using Google Maps. The blue dashed line in (b) is 32 °F (i.e., 0 °C).
Climate 12 00063 g002
Figure 3. RWIS observations on (a) MacDonald Pass, a mountain site, January 2020; the dashed black line is 32 °F (i.e., 0 °C). (b) Bozeman Pass, MT, a site at canyon 10 miles east of city Bozeman for March 2020; (c) is the same as (b) Bozeman Pass, MT, except occurring in March 2019; and (d) is Gray Cooper Bridge, near the city of Great Falls for January 2020. The x-axis gives the temperature data entries; the y-axis is the 2 m air temperature (unit in °F). The green star marks precipitation. Only data when the road status was reposted as “ice warning/ice watch” were analyzed here. RWIS data have intervals of about 5–10 min. The data are available at https://rwis.mdt.mt.gov (URL accessible on 30 April 2024).
Climate 12 00063 g003
Figure 4. RWIS observations at Avon North site of Montana. (a) Time series for all ice reported times with the road pavement surface temperature, 2 m air temperature, and precipitation time for January 2020. The green star denotes when precipitation occurred. (b) The road pavement surface temperature vs. the 2 m air temperature, with blue representing all road ice without precipitation occurrence and green for road ice with precipitation. The vertical and horizontal dashed lines mark 32 °F (i.e., 0 °C) on both axes.
Climate 12 00063 g004
Figure 5. The road pavement surface temperature and the 2 m air temperature relations in March 2020 for icy roads on Bozeman Pass site, Montana. The sub-hourly measurements from the RWIS site road-embedded sensor are analyzed. Dashed line marks 32 °F (i.e., 0 °C).
Climate 12 00063 g005
Figure 6. The road pavement surface temperature (blue line), 2 m air temperature (purple dash line), and precipitation (green marker) for no ice road during March 2019 for Bozeman Pass, MT. The data are RWIS sub-hourly observations. Only no ice times are sampled and analyzed.
Climate 12 00063 g006
Figure 7. Gary Cooper Bridge for ice-occurrence cases in (a) February 2020 and (b) March 2020. Data are from RWIS site Gary Cooper Bridge, Montana. Only icy road cases were analyzed. The green markers depict precipitation-occurring times and blue markers depict no precipitation occurring at the same time.
Climate 12 00063 g007
Figure 8. Subsurface temperature, pavement surface temperature, air temperature, and precipitation for (a) MacDonald Pass, MT in January 2020 and (b) Bozeman Pass, MT in January 2020. Observations were from RWIS sites for only road-ice-occurring times.
Climate 12 00063 g008
Figure 9. Ice cases for MacDonald Pass site, MT, in January 2020. The road pavement surface temperature, 2 m air temperature, dew point, RH, and precipitation presence are shown. Dashed black line depicts 32 °F (i.e., 0 °C). This figure is similar to Figure 2a, except that RH and dew point data are displayed.
Climate 12 00063 g009
Figure 10. Georgetown Lake RWIS site (Site ID: 267009) at Montana Highway 1 MP 25.4 and Highway 1. (a) No ice: the lake is clear at the right side of the road. (b) 15 April 2020: the lake is covered by ice and snow.
Climate 12 00063 g010
Figure 11. The 2 m air temperature and road pavement surface temperature relationships for 1 November 2020 to 31 March 2021, for Georgetown Lake (263000). The blue dots represent no ice and the red dot represents ice. The green line represents the least-square regression for all ice and no ice cases (1.31 × Tair for day time (a) and 1.20 × Tair for nighttime, (b)).
Climate 12 00063 g011
Disclaimer/Publisher’s Note: The statements, opinions and data contained in all publications are solely those of the individual author(s) and contributor(s) and not of MDPI and/or the editor(s). MDPI and/or the editor(s) disclaim responsibility for any injury to people or property resulting from any ideas, methods, instructions or products referred to in the content.