Article

Space–Time Characterization of Extreme Precipitation Indices for the Semiarid Region of Brazil

by
Ana Letícia Melo dos Santos
1,*,
Weber Andrade Gonçalves
1,
Lara de Melo Barbosa Andrade
1,
Daniele Tôrres Rodrigues
1,2,
Flávia Ferreira Batista
1,
Gizelly Cardoso Lima
1 and
Cláudio Moisés Santos e Silva
1
1
Department of Atmospheric and Climate Sciences, Federal University of Rio Grande do Norte, Av. Senador Salgado Filho 3000, Lagoa Nova, Natal 59078-970, Brazil
2
Department of Statistics, Federal University of Piauí, Teresina 64049-550, Brazil
*
Author to whom correspondence should be addressed.
Climate 2024, 12(3), 43; https://doi.org/10.3390/cli12030043
Submission received: 10 January 2024 / Revised: 22 February 2024 / Accepted: 27 February 2024 / Published: 13 March 2024

Abstract

:
Various indices of climate variability and extremes are extensively employed to characterize potential effects of climate change. Particularly, the semiarid region of Brazil is influenced by adverse effects of these changes, especially in terms of precipitation. In this context, the main objective of the present study was to characterize the regional trends of extreme precipitation indices in the semiarid region of Brazil (SAB), using daily precipitation data from the IMERG V06 product, spanning the period from 1 January 2001 to 31 December 2020. Twelve extreme precipitation indices were considered, which were estimated annually, and their spatial and temporal trends were subsequently analyzed using the nonparametric Mann–Kendall test and Sen’s slope. The analysis revealed that the peripheral areas of the SAB, especially in the northwest and extreme south regions, exhibited higher intensity and frequency of extreme precipitation events compared to the central portion of the area. However, a negative trend in event intensity was noted in the north, while positive trends were identified in the south. The frequency of extreme events showed a predominance of negative trends across most of the region, with an increase in consecutive dry days particularly throughout the western SAB. The average total precipitation index was above 1000 mm in the north of the SAB, whereas in the central region, the precipitation averages were predominantly below 600 mm, with rainfall intensity values ranging between 6 and 10 mm/day. Over the span of 20 years, the region underwent an average of 40 consecutive dry days in certain localities. A negative trend was observed in most of the indices, indicating a reduction in precipitation intensity in future decades, with variations in some indices. The dry years observed towards the end of the analyzed period likely contributed to the observed negative trends in the majority of extreme precipitation indices. Such trends directly impact the intensity and frequency of extreme weather events in the SAB. The study is important for highlighting and considering the impacts of changes in precipitation extremes in the semiarid region of Brazil. Based on the obtained results, we advocate the implementation of public policies to address future challenges, such as incorporating adaptations in water resource management, sustainable agricultural practices, and planning for urban and rural areas.

1. Introduction

In the context of climate change, extreme events have become more intense and frequent in the Brazilian semiarid (SAB) region [1,2]. Consequently, scientific investigations are necessary to comprehend the variability of these extreme events within the region. However, there are difficulties in acquiring environmental data due to Brazil’s insufficient monitoring network. As an alternative, numerous researchers have chosen to use data from remote sensing products in their studies [3,4,5,6].
The semiarid region of Brazil has a high interannual variability of rainfall, with an alternation of rainy and dry years, mainly due to the effects of the El Niño Southern Oscillation (ENSO) and the inter-hemispheric gradient of the North Atlantic [7,8]. In the context of climate change, extreme weather events have become increasingly frequent and intense [9,10], which can generate socioeconomic implications for the population, especially in the SAB region [11,12].
Research has demonstrated that extreme weather events in the Brazilian semiarid region are associated with the region’s climatic characteristics and the variability of the Atlantic, Pacific and Indian oceans, specifically after El Niño and La Niña events [10,13,14]. Studies like those by [12,15,16] showed that in Brazil’s northeast region, which covers a large part of the country’s semiarid region, there is an expected increase in extreme precipitation events during the rainy season, a pattern also observed during periods of rainfall deficit. These results are related to the findings of [17] when analyzing model results for the SAB region. The authors stated that both brief intense rainfall events and prolonged water shortages can be expected.
Among the indicators of climate extremes are those developed by the Expert Team on Climate Change Detection and Indices (ETCCDIs), of which 12 are calculated from rainfall information. A study [18] suggested the existence of a strong association between the values of extreme precipitation indices, the occurrence of ENSO and the values of sea surface temperature (SST) in the Atlantic. In the São Francisco River basin, much of which is located in the SAB region, there is a variation in extreme precipitation rates, with increases in some areas and decreases in others [19,20].
The analysis of extreme precipitation indices plays a fundamental role in the SAB region. Through these investigations, it is possible to develop effective water resource management policies in the area, aiming to mitigate the adverse impacts of heavy rainfall or droughts. In this context, several studies indicated possible changes in the values of extreme precipitation and temperature indices over time in specific areas of the SAB region [2,8,21,22,23]. However, conducting in-depth studies on this subject requires precipitation datasets with high temporal and spatial resolution. Indices such as R95pToT and R99pToT may be associated with the occurrence of natural disasters due to high values of extreme precipitation and are related to landslides, flash floods, and regular floods [18,24].
In Brazil, there is a deficiency in the spatial coverage of rain gauges, which is lower than recommended by the World Meteorological Organization [25]. Additionally, observations made by precipitation gauges contain a high percentage of missing data over time [26]. As an alternative source, satellite databases have become widely used in meteorological research and climate studies, mainly due to their high spatial and temporal resolution [6,24,27,28,29]. Among these, the Integrated Multi-Satellite Retrievals for Global Precipitation Measurement (IMERG) product version 06 stands out among the existing products in estimating precipitation for its precise precipitation estimates [30,31,32,33]. Launched in early 2015, IMERG [34], amalgamating data from the National Aeronautics and Space Administration (NASA) and the satellite mission called The Tropical Rainfall Measuring Mission (TRMM) [34], proved to be highly efficient in estimating precipitation in tropical regions. This effort also included contributions from the Japanese Aerospace Exploration Agency (JAXA) and the Global Precipitation Measurement (GPM) satellite, launched in 2014, showcasing a successful collaboration in advancing precipitation measurement technologies.
Building on these advancements, IMERG represents an advancement compared to TRMM in various aspects: it combines data from multiple satellites, boasts higher spatial and temporal resolution, incorporates advanced techniques that enhance precision and facilitates a more effective visualization of meteorological data. According to [35], which assessed the progression of IMERG versions, it is possible to discern enhancements with each iteration. Quality indices indicate improvements in the product, including better calibration. In the SAB region, there are areas situated between regions with measurement networks considered good to excellent, while in other areas, there is a bias adjustment consistent with surface observation data. Nevertheless, these regions still require further enhancements, which will be implemented with subsequent versions released over time.
Recently, [36] evaluated the iteration of IMERG along with those of five additional remote sensing products, with IMERG showing superior performance. Other studies conducted globally and in Brazil assessed and validated the IMERG latest database, highlighting its provision of accurate precipitation estimates and robust statistical results showing good performance compared to other versions of IMERG [24,37,38,39,40,41] including for the SAB region [39], where precipitation extremes were evaluated using IMERG V6 data.
With results similar to, and more recent than, those of [42], where the estimation capacity of data from the IMERG version 6 product was evaluated over a river basin predominantly located in the SAB, using IMERG Early, Late, and Final products for extreme precipitation, it was also found that the final IMERG estimates, used herein, exhibited better agreement with in situ data on a daily scale, as previously demonstrated [43]. In this evaluation, areas with underestimated or overestimated precipitation were observed according to the indices, with certain areas potentially influenced by the predominant cloud type in the region, a result supported by research described in [39]. These two studies, particularly, underscored the limited efficacy of IMERG products as per the simple precipitation intensity index (SDII). Although there is potential for error, the analyses remain important as they align with the majority of those conducted using the other 11 extreme precipitation indices, which yielded positive outcomes.
In a study conducted [43], the authors observed satisfactory precipitation estimates using the IMERG product across the SAB region. They compared extreme precipitation indices derived from the IMERG database with rain gauge data from the National Institute of Meteorology (INMET) regarding the SAB, using robust statistical analyses. However, their analysis did not show the trends or spatio-temporal characteristics of these indices within the study domain. We believe that using IMERG precipitation estimates can provide a comprehensive analysis of extreme precipitation indices, focusing on regional assessments of climate change in the SAB region.
In the SAB study area, there is a region of economic significance for Brazil, notably encompassed by three of the four states that make up the region known as MATOPIBA (Maranhão, Tocantins, Piauí and Bahia). Thus, the scope of this study included a significant portion of MATOPIBA, which has a humid tropical climate with a dry austral winter and exhibits positive and negative trends indicating alterations in local precipitation patterns [44]. This territory is recognized as an area of increasing interest for investments in Brazilian agribusiness, as documented by various sources [45,46,47].
However, beyond the economic aspect of the region, there are other fundamental reasons that justify conducting this research in the SAB. Considering it as a region vulnerable to meteorological phenomena due to its tropical nature [48], it is crucial to obtain results aimed at practical solutions. These findings should contribute to the formulation of public policies and scientific analyses that enhance the understanding of how climatic adversities, such as extreme precipitation, can impact the health of the local population, for instance. Prolonged exposure to such conditions can result in lasting modifications to people’s health status [49,50,51]. Another significant outcome will arise from the continuous improvements in product performance, which refine the parameterizations of meteorological models in successive iterations. These enhancements enable more efficient precipitation measurements across virtually all spatial and temporal scales [52,53].
The objective of the present study was to analyze the averages and linear trends of extreme precipitation indices in the SAB region over a period of 20 years, obtained from precipitation estimates from IMERG Final Run, Version 06.

2. Materials and Methods
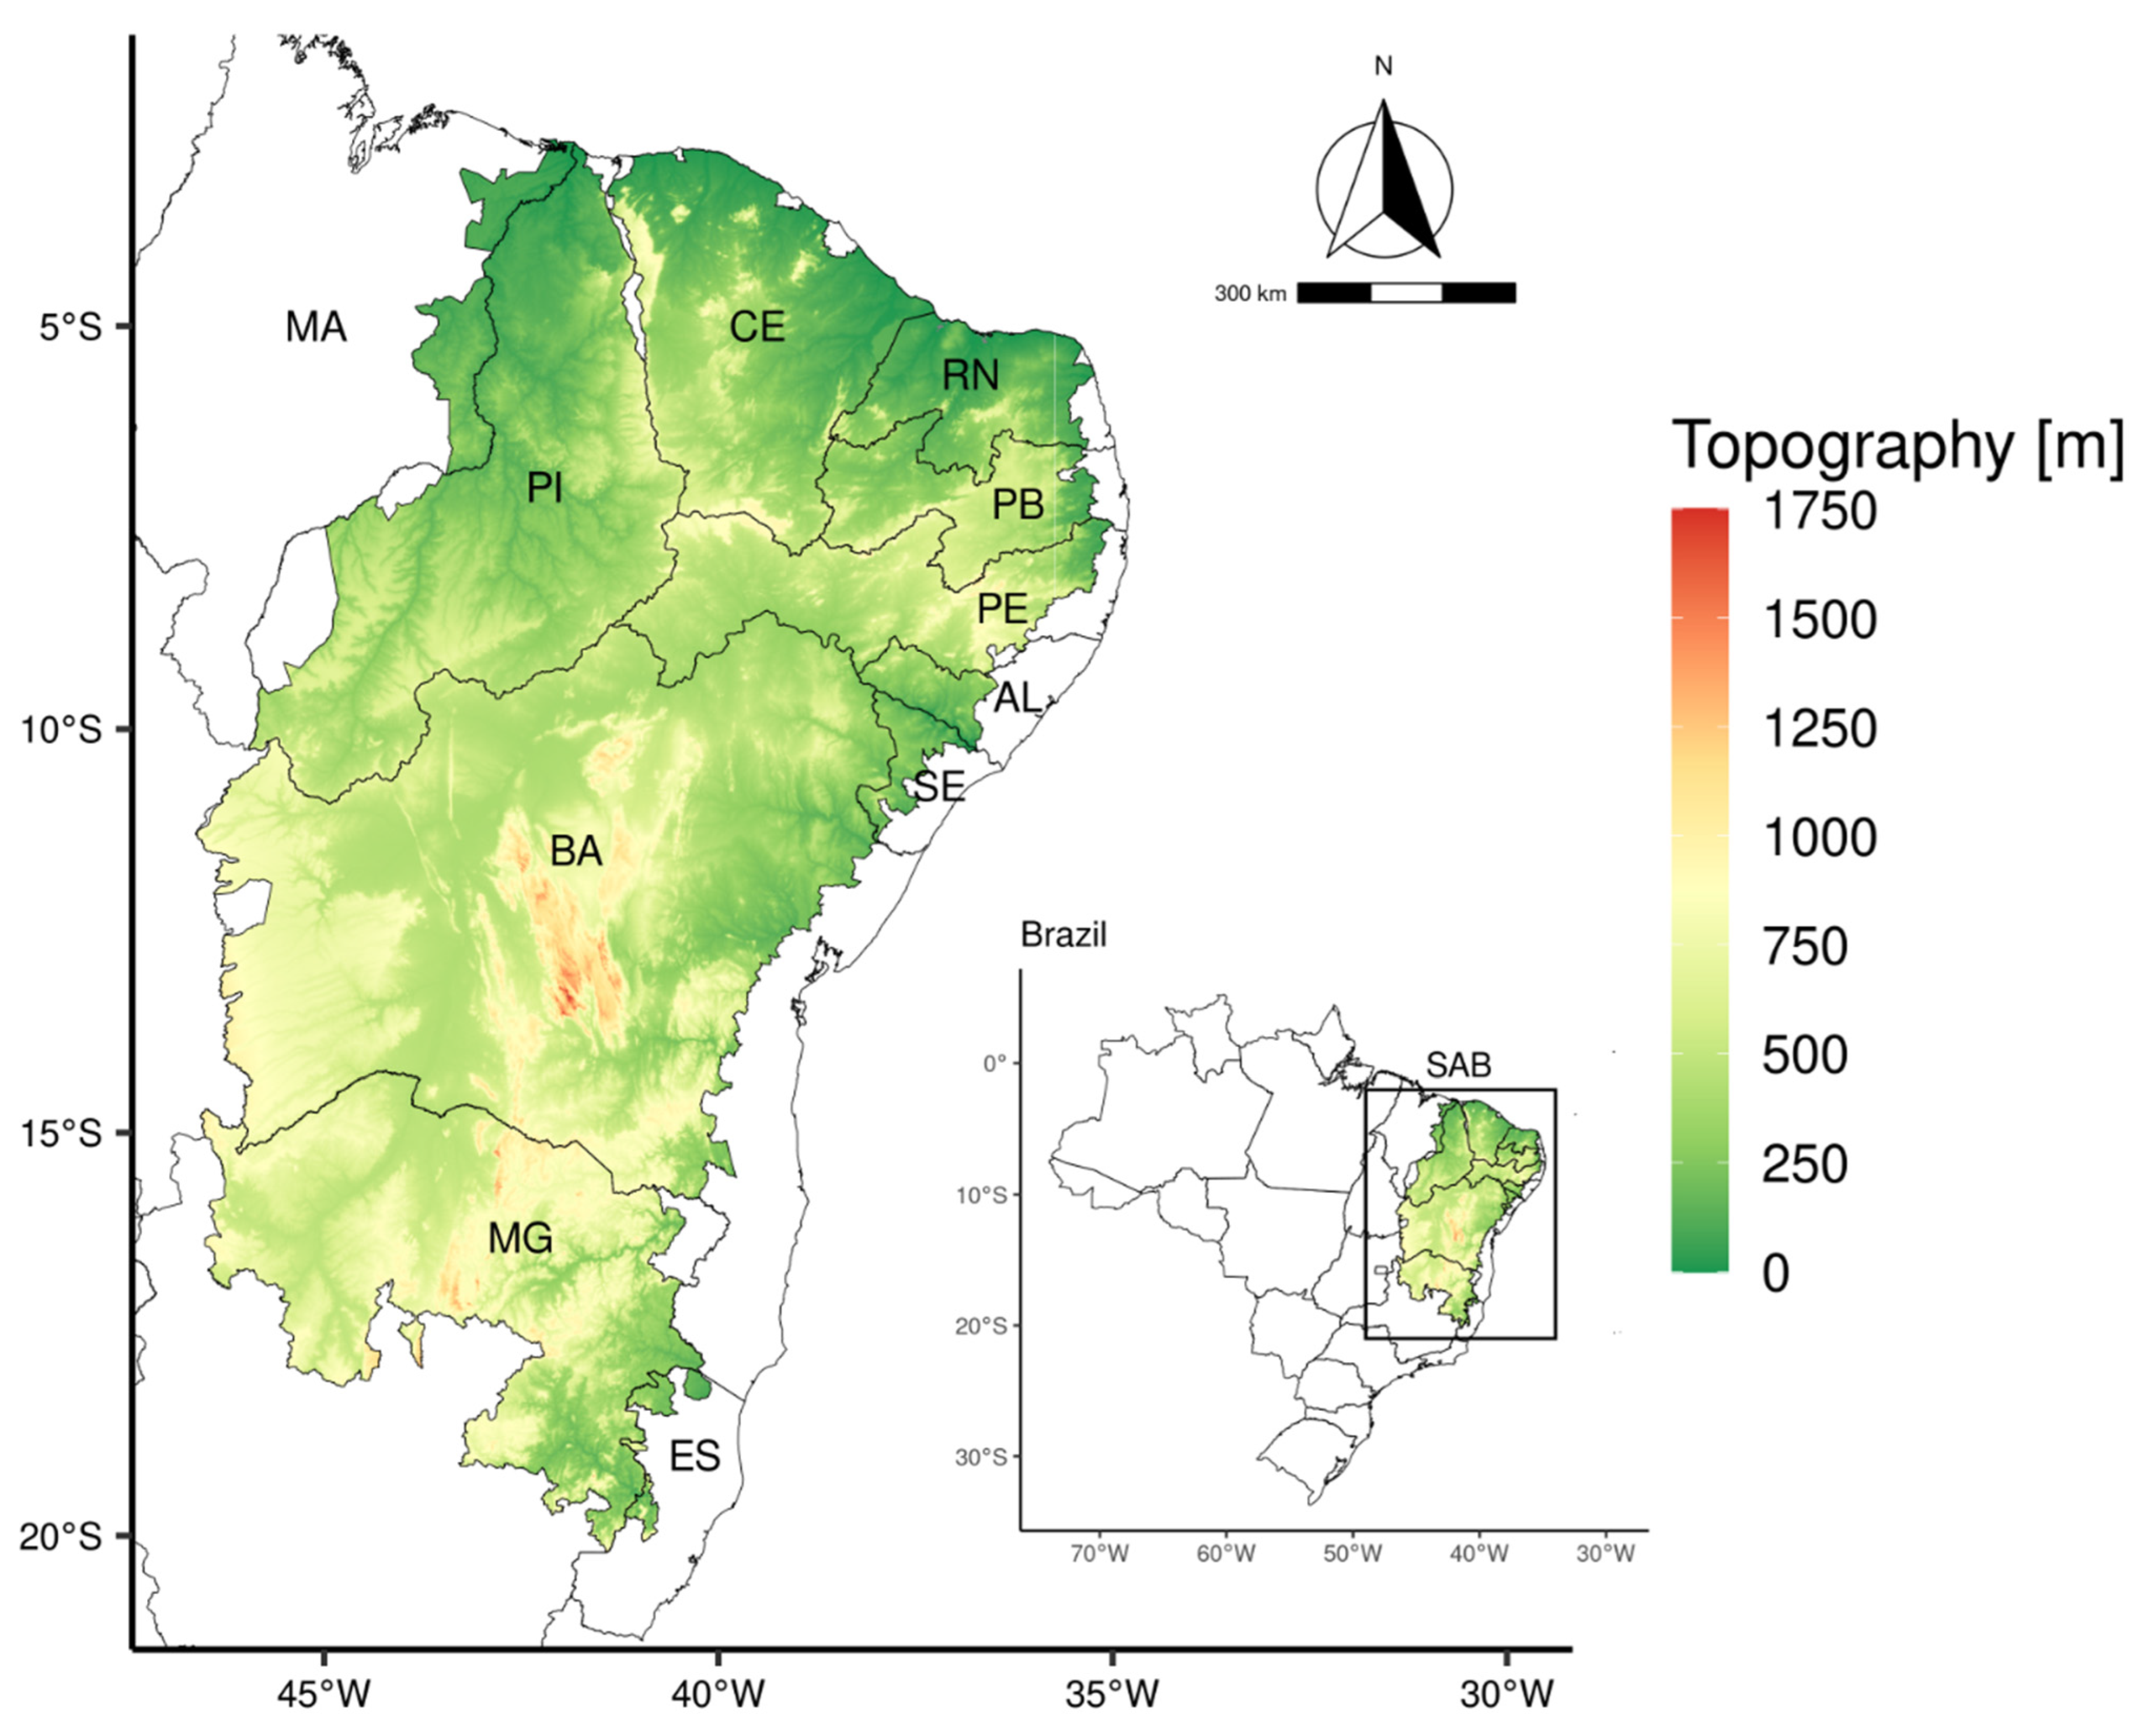
2.1. Study Region

The SAB region, Figure 1, encompasses a total area of 1,182,697 km2, covering nearly 12% of the Brazilian territory. It comprises 1427 municipalities in the northeast region of Brazil, including in the states of Maranhão (MA), Piauí (PI), Ceará (CE), Rio Grande do Norte (RN), Paraíba (PB), Pernambuco (PE), Alagoas (AL), Sergipe (SE) and Bahia (BA). The SAB region also includes 132 municipalities in the southeast region of Brazil, situated in the states of Minas Gerais (MG) and Espírito Santo (ES) [43]. The study area is one of the most populous semiarid regions in the world, with approximately 28 million people, according to [54]. The region is characterized by a high population density, with 30 inhabitants/km2, making it one of the most densely populated areas globally [55,56].
The SAB region is characterized by the occurrence of periodic droughts, while at the same time, episodes of excessive precipitation are observed, impacting the living conditions of the residents of this region [57,58]. It is known for its strong insolation, high temperatures, and a rainfall pattern marked by scarcity, irregularity and concentration in short periods, making it the semiarid zone with the highest rainfall in the world [59]. The rainy season in this region typically runs from February to May [15,60]. The main meteorological systems responsible for precipitation in the region are the intertropical convergence zone (ITCZ) [61,62] and the upper tropospheric cyclonic vortex (UTCV) [63,64,65]. The altitude of the SAB region ranges from 0 to 1750 m and, among other factors, is associated with the spatial distribution of rainfall [66,67].

2.2. Data

2.2.1. Daily Precipitation

We employed daily precipitation estimate data generated by the Integrated Multi-satellite Retrievals for GPM (IMERG) algorithm from the Global Precipitation Measurement (GPM) mission. This mission launched the GPM Core Observatory satellite in February 2014 to ensure continuity with the successful TRMM mission. The IMERG combines data from various sources, including visible/infrared microwave and passive sensors from different satellites, as well as the Dual-Frequency Precipitation Radar (DPR) sensor aboard the GPM. Version 6 of the IMERG algorithm, the most recent, has also been applied retroactively to data retrieved from the TRMM, covering the period from June 2000 to the GPM era. Among the types of products offered by IMERG with different latencies, we chose the Final Run data (IMERG-F) with approximately a 3.5-month latency after observation, as this product is integrated and calibrated against a network of precipitation gauges from the Global Precipitation Climatology Center (GPCC), making it suitable for scientific research [35]. The IMERG V06 product has global coverage, extending from 90° S to 90° N latitude, with spatial resolution of 0.1° (approximately 10 × 10 km).
Although IMERG has been used in numerous studies over the years, demonstrating its quality in estimating precipitation [20,26,29,32,36,39], the product IMERG V06 still needs some improvements. The authors of [39] suggested a tendency towards underestimation along the coasts of northeastern Brazil (NEB), corroborating a previous study [29], which reported the overestimation of delivery intensities by the IMERG product, especially for more intense events. This underestimate is related to the difficulty in estimating the occurrence of warm clouds [16]. On the other hand, [68] identified cases of overestimation by IMERG V06 when compared with a previous version of the satellite’s daily and monthly product, indicating the need for ongoing improvements. In this regard, a comprehensive literature review [53] sheds light on IMERG’s variable performance across different climatic and geographical conditions. Analyses indicated that IMERG tends to be more accurate in humid regions, while facing challenges in semi-arid and arid areas, as well as in complex terrains and mountainous regions. Temporal aggregation significantly enhances IMERG’s precision, suggesting superior performance in monthly and annual analyses. Notably, Ref. [53] emphasized IMERG’s capability to capture the patterns and variability of extreme precipitation, despite certain limitations in accurately estimating high-intensity events. This aspect is crucial for the analysis of temporal trends in extreme precipitation indices, with its continuous development and improvements in each new version reinforcing its role in understanding extreme precipitation events, making substantial contributions to climatology and hydrology.
For the analysis of the Brazilian semiarid region, we utilized the IMERG grid resolution of 10 × 10 km, resulting in the mapping of 10,880 pixel points. The daily precipitation estimates from IMERG, covering the period from 1 January 2001 to 31 December 2020, were acquired through the Giovanni platform (https://giovanni.gsfc.nasa.gov/giovanni/) accessed on 10 October 2022. These data are provided by the Goddard Earth Sciences Data and Information Services Center (GES DISC), an entity affiliated with the National Aeronautics and Space Administration (NASA). The IMERG V6 database is highly recommended for research purposes, particularly regarding the SAB region, given its minimal occurrence of statistical errors, as presented by [43]. This aspect is especially crucial, as it could lead to reduced climate-related risks for agriculture, urban planning and water resource management.

2.2.2. Organization and Manipulation of the Data

In this study, we addressed the variability and trends of extreme precipitation events in the Brazilian semiarid region, employing a robust methodology grounded in satellite data. Our initial step involved acquiring daily precipitation estimates from the Integrated Multi-Satellite Retrievals for GPM (IMERG) product, spanning a 20-year period. The download and structuring of the database were facilitated by the use of the Climate Data Operators (CDO) and R software version 4.3, the latter being utilized for all subsequent analyses.
With a well-structured dataset, we proceeded to calculate 12 annual extreme climate indices for each of the 10,880 pixel points mapped within the study region. This phase enabled the creation of detailed maps, providing a clear view of the spatial distribution of extreme precipitation events. Subsequently, we calculated the average value of each index over the analyzed period for each pixel point, creating a robust database that underpinned the subsequent temporal analysis.
To explore trends in the precipitation extremes indices, we applied the Mann–Kendall test, a non-parametric approach renowned for its efficacy in detecting trends in time series. Additionally, we employed Sen’s slope to quantify the magnitude of these trends over time. This combination of statistical techniques afforded a deep understanding of the increasing or decreasing trends at each point in the SAB.
Armed with the results from the statistical analyses, we conducted a further spatial analysis, generating maps that illustrate the trends of extreme precipitation. These maps are crucial for visualizing areas that have undergone significant changes in precipitation, aiding in the identification of regions particularly vulnerable to climate change.
It is important to emphasize that, although the study period of 20 years does not meet the conventional 30-year criterion for climatological analyses, it was sufficient to unveil significant trends in the indices of extreme precipitation in the semiarid region analyzed. The use of IMERG data, a satellite product widely recognized and recommended for meteorological and climatic studies, ensured the reliability of our analyses.

2.3. Extreme Precipitation Indices

The precipitation indices for this study, as defined by [69,70], were divided into two categories (Table 1): (i) intensity indices, which describe, for example, maximum precipitation rates, as well as percentile-based thresholds (95 or 99); (ii) frequency indices, which reflect the duration of dry and wet periods or represent counts of days within the annual interval.

2.4. Statistical Analysis

Spatial Distribution of Trends

With the annual time series of extreme precipitation indices, statistical tests were applied to analyze signs and characteristics of trends (increasing or decreasing) for each grid point of the SAB region. In this study, we considered a statistical significance level of 10% and we conducted the analyses using the R language, version 4.0.3 [71].
  • Mann–Kendall test
The Mann–Kendall test is a nonparametric test [72,73] that analyzes the trend in a time series. This test is recommended by the World Meteorological Organization (WMO) to test for positive, negative, or null trends in environmental series. The test statistic of Mann–Kendall is represented by Equation (1)
S = i = 1 n 1 j = i = 1 n s i n g X j X i
where S is the result of the sum of the counts of (Xj − Xi); Xj is the first value after xi of the extreme precipitation index; and n is the number of time series data elements. A positive value of S indicates an increasing trend, while a negative value indicates a decreasing trend. The values assigned to each data pair are indicated in Equation (2)
S i n g X j X i = 1 i f   X j X i < 0 0       i f   X j X i = 0 + 1 i f   X j X i > 0
The Mann–Kendall test statistic is based on the value of the ZMK variable, calculated according to Equation (3):
Z M K = S 1 V a r S   i f   S > 0 0 i f S = 0 S + 1 V a r S i f   S < 0
The variance is given by Equation (4), where tp is the number of data elements with equal values in a certain group, and q is the number of groups containing equal values in the data series in group p
V A R S = 1 18 n n 1 2 n + 5 p = 1 q t p t p 1 2 t p + 5
  • Sen’s slope
Sen’s slope, also known as Sen’s estimator or Sen’s method [74], is a nonparametric statistical test used to calculate the magnitude of trends or changes in data over time after applying the Mann–Kendall test. It is particularly valuable when dealing with time series data that do not follow a specific distribution or when one wants to examine data with ordinal or non-normal characteristics. Sen’s slope is widely used in various fields, including environmental science, hydrology, climatology, and economics. It calculates this magnitude using Equation (5)
m i j = Y j Y i j 1
where yj and yi are the values of the extreme precipitation index at the instants j and i, respectively, for j > i. The average intensity of the trend was obtained by the median of the N values of Sen’s slope (mij), that is, the increase or the decrease as a function of time.

3. Results and Discussion

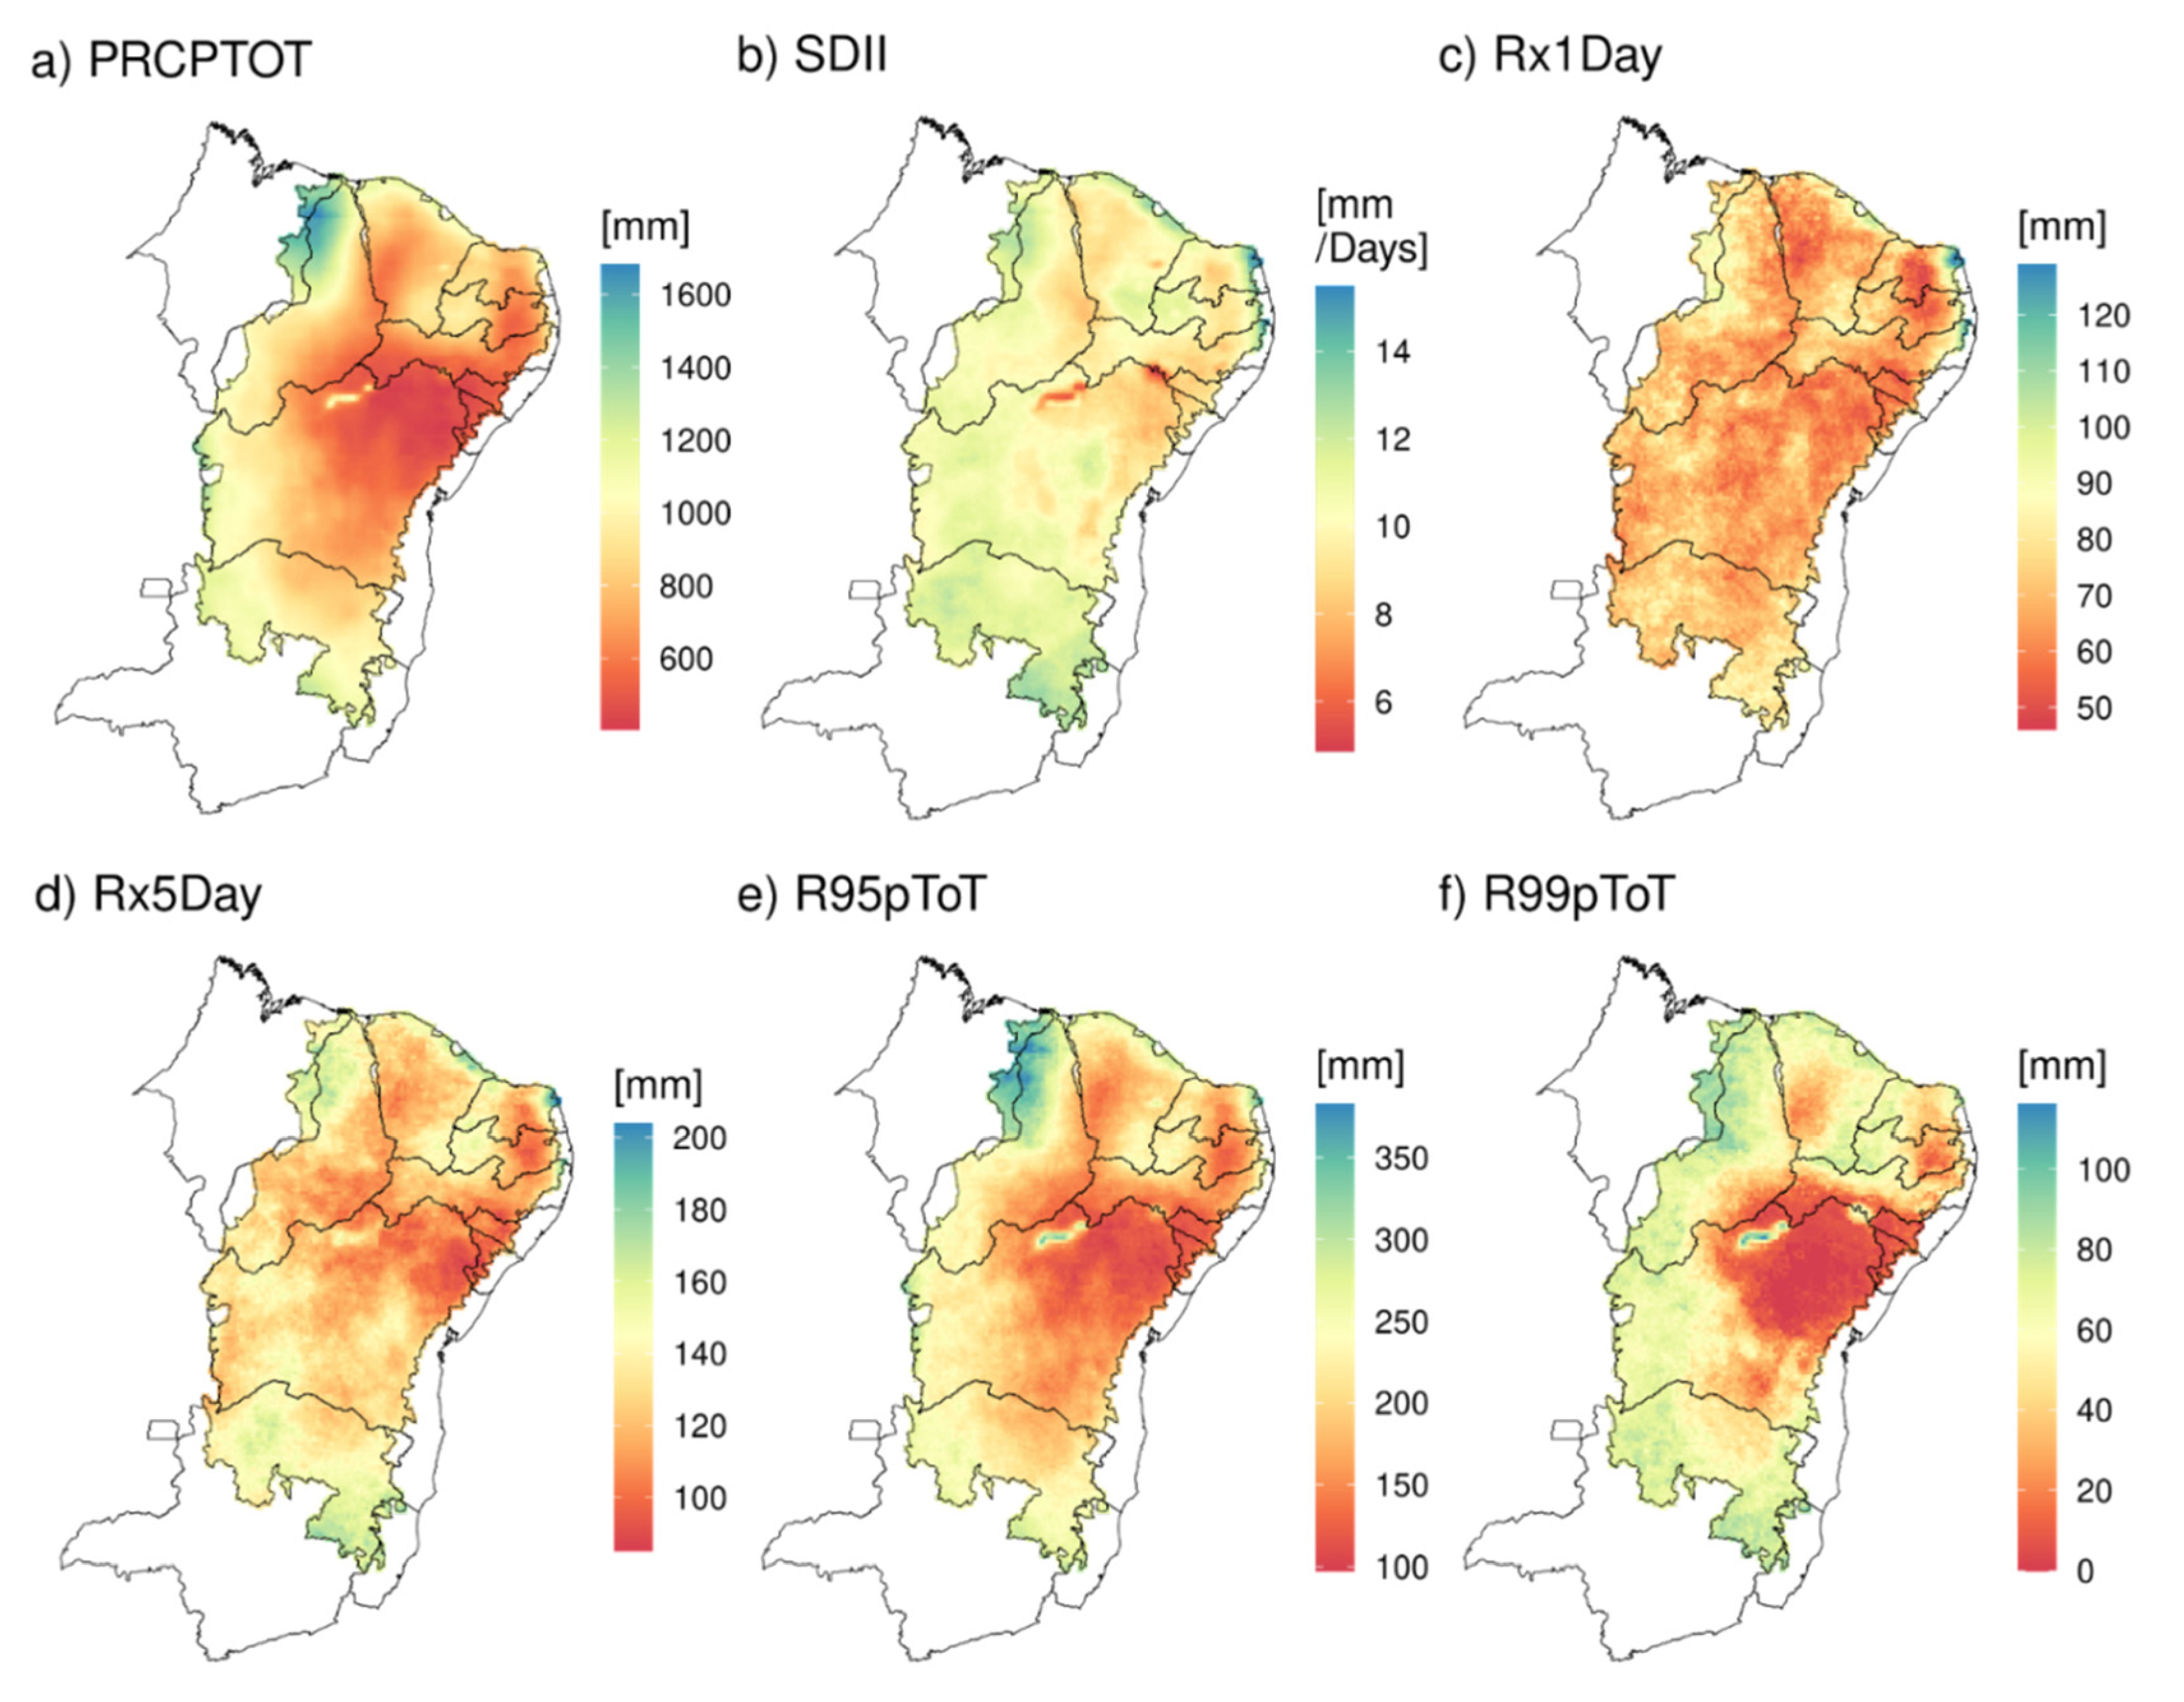
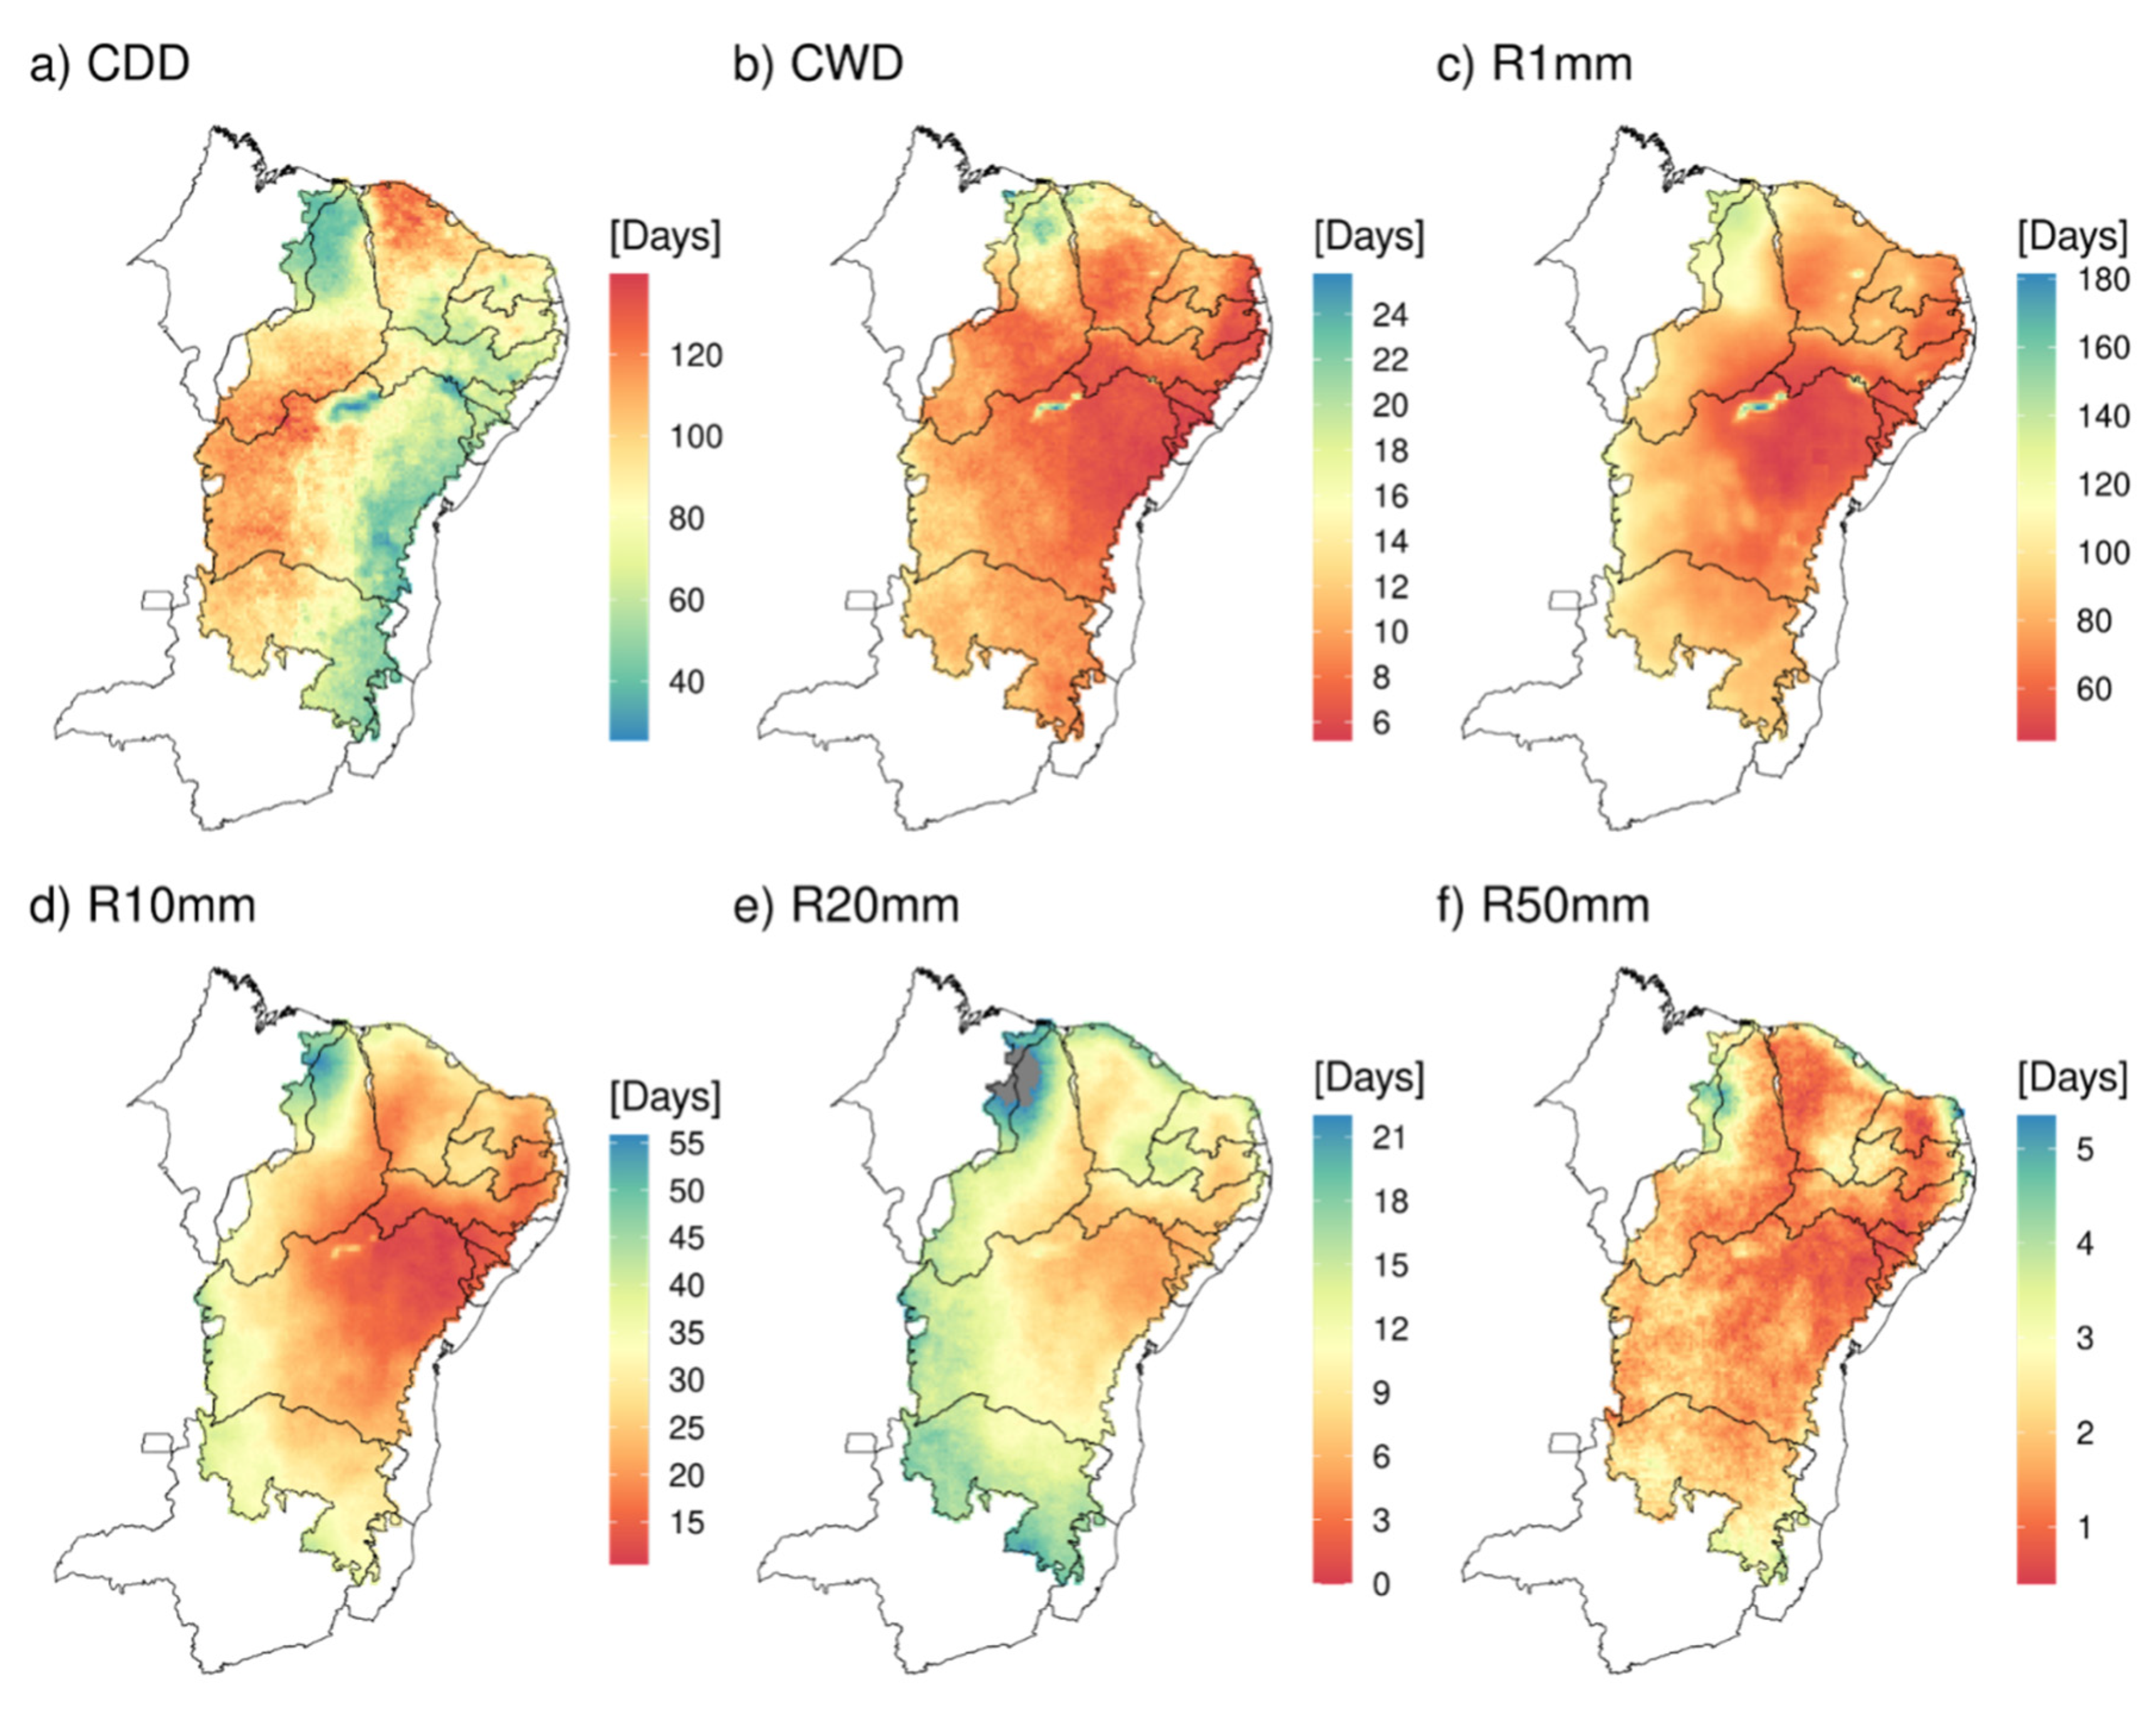
3.1. Mean Precipitation Intensity Index

Figure 2 presents the spatial distribution of the mean total precipitation (PRCPTOT). The map reveals that the highest rainfall amounts were located in the northwestern portion of the SAB, with values above 1600 mm. This region is influenced by the hydrometeorology of the Amazon basin, being affected by meteorological systems that trigger heavy precipitation, such as the intertropical convergence zone and coastal instability fronts [61,62,75]. The extreme southern portion of the SAB region also exhibits more significant rainfall volumes and is strongly influenced by the South Atlantic convergence zone (SACZ) [6,76].
The spatial distribution of the mean simple precipitation intensity index (SDII), as presented in Figure 2b, indicated that the highest values of rainfall intensity were located in the easternmost areas of the SAB region. However, previous studies [43,76] using remote sensing data (IMERG) to estimate rainfall intensity concluded that the SDII values obtained appeared to be overestimated in this area. Also, as shown in Figure 2b, high rainfall intensity values were observed in the extreme southern portion of the SAB region, specifically in the area bordering the southeastern states, primarily Minas Gerais. In the central portion of the SAB, the rainfall intensity values were lower, ranging from 6 to 10 mm/day, while they could reach 15 mm/day in the border regions, values that are consistent with those reported in [43]. In another study [16], covering the period from 2000 to 2015, the authors also reported that the central region of the semiarid northeast of Brazil exhibited the lowest SDII values, ranging from 4.8 to 11.5 (mm/day).
Figure 2c,d display the spatial pattern of the maximum 1-day accumulated precipitation index (Rx1Day) and the maximum 5-day accumulated precipitation index (Rx5Day), respectively. The map indicates that for Rx1Day, the highest precipitation values were located along the eastern edge of the region, mainly influenced by mesoscale convective systems, which are generally manifested by eastward wave disturbances [77,78] and by upper tropospheric cyclonic vortexes [63,64,65]. It was estimated that the value of Rx1Day did not exceed approximately 80 mm in most of the area considered in the study. This result is corroborated by a previous study [17], which stated that among Brazil’s regions, the semiarid region experiences the lowest Rx1Day values, up to approximately 70 mm. Regarding the spatial distribution of Rx5day, the map shows that areas marked by lower values of maximum accumulated 5-day precipitation are located in the central portion of the SAB, while in the extreme south of the region, the index values were higher, as well as in the western area of the SAB, possibly influenced by the presence of the SACZ and frontal systems [78]. It is worth noting that the values of this index for the entire SAB region ranged from 85.15 to 203.95 mm. Similar values were obtained previously [17].
R95pToT (Figure 2e) and R99pToT (Figure 2f) represent the annual total precipitation on days when rainfall exceeded the 95th and 99th percentiles, respectively. The spatial pattern analysis of these indices revealed that the highest rainfall amounts were concentrated in the northwest and in the extreme south of the SAB. The results obtained for the R95pToT and R99pToT indices are consistent with the spatial patterns found for the PRCPTOT, SDII, Rx1day and Rx5day indices, confirming the gradient according to which the precipitation values were higher in the outermost portion of the region, especially in the northwest and extreme south of the SAB. However, lower rainfall values were obtained in the central portion of the region. Of particular note, there were specific areas located further inland in the SAB where the precipitation values were higher, particularly in areas where large lakes/reservoirs are situated, such as the Sobradinho region in Bahia, or due to specific topography, which are important and determining factors for different precipitation patterns. Higher values in relation to R95pToT and R99pToT may be associated with the occurrence of natural disasters, such as landslides, flash floods, inundation and flooding [19,20].
In the maps of Figure 2 and Figure 3, the Sobradinho reservoir in Petrolina, in the northern part of the state of Bahia, had an evident effect on most of the indices. The region has experienced hydrological changes, as observed in this study and in [79], which was conducted using other indicators. According to the PRCPTOT index (Figure 2a), the average precipitation was above 1000 mm in the center of the SAB, while the averages in other areas were below approximately 600 mm. Considering SDII (Figure 2b), it is possible to see that the average precipitation during the analyzed period was not intense, as it did not exceed 8 mm/day in the Sobradinho region.
The microclimate in the Sobradinho region and adjacent cities is significantly influenced by the presence of the reservoir created by the Sobradinho dam. This reservoir alters the local microclimate, impacting temperatures, air humidity and wind patterns. The occupation of this area has also caused impacts on land cover and land use, affecting various patterns such as wind circulation due to the local topography, leading to differences in precipitation observed in the region due to high evaporation rates [80,81]. Regions with large bodies of water, such as Sobradinho, have a considerable capacity to retain solar radiation, which makes these areas more suitable for data capture due to the occurrence of optical processes relevant to remote sensing [82]. This renders such data highly reliable for estimations regarding water bodies, such as hydrographic basins [83,84]. Throughout the period represented by the CDD (Figure 3a), precipitation occurred in a well-distributed manner. Consecutive dry days occurred for approximately 40 days per year in the reservoir region, likely due to the increasing air temperature trend, which contributed to more hot days and nights, greater diurnal temperature amplitude, and an increasing number of consecutive dry days, as analyzed in [81,83] in the Sobradinho reservoir region.

3.2. Mean Precipitation Frequency Index
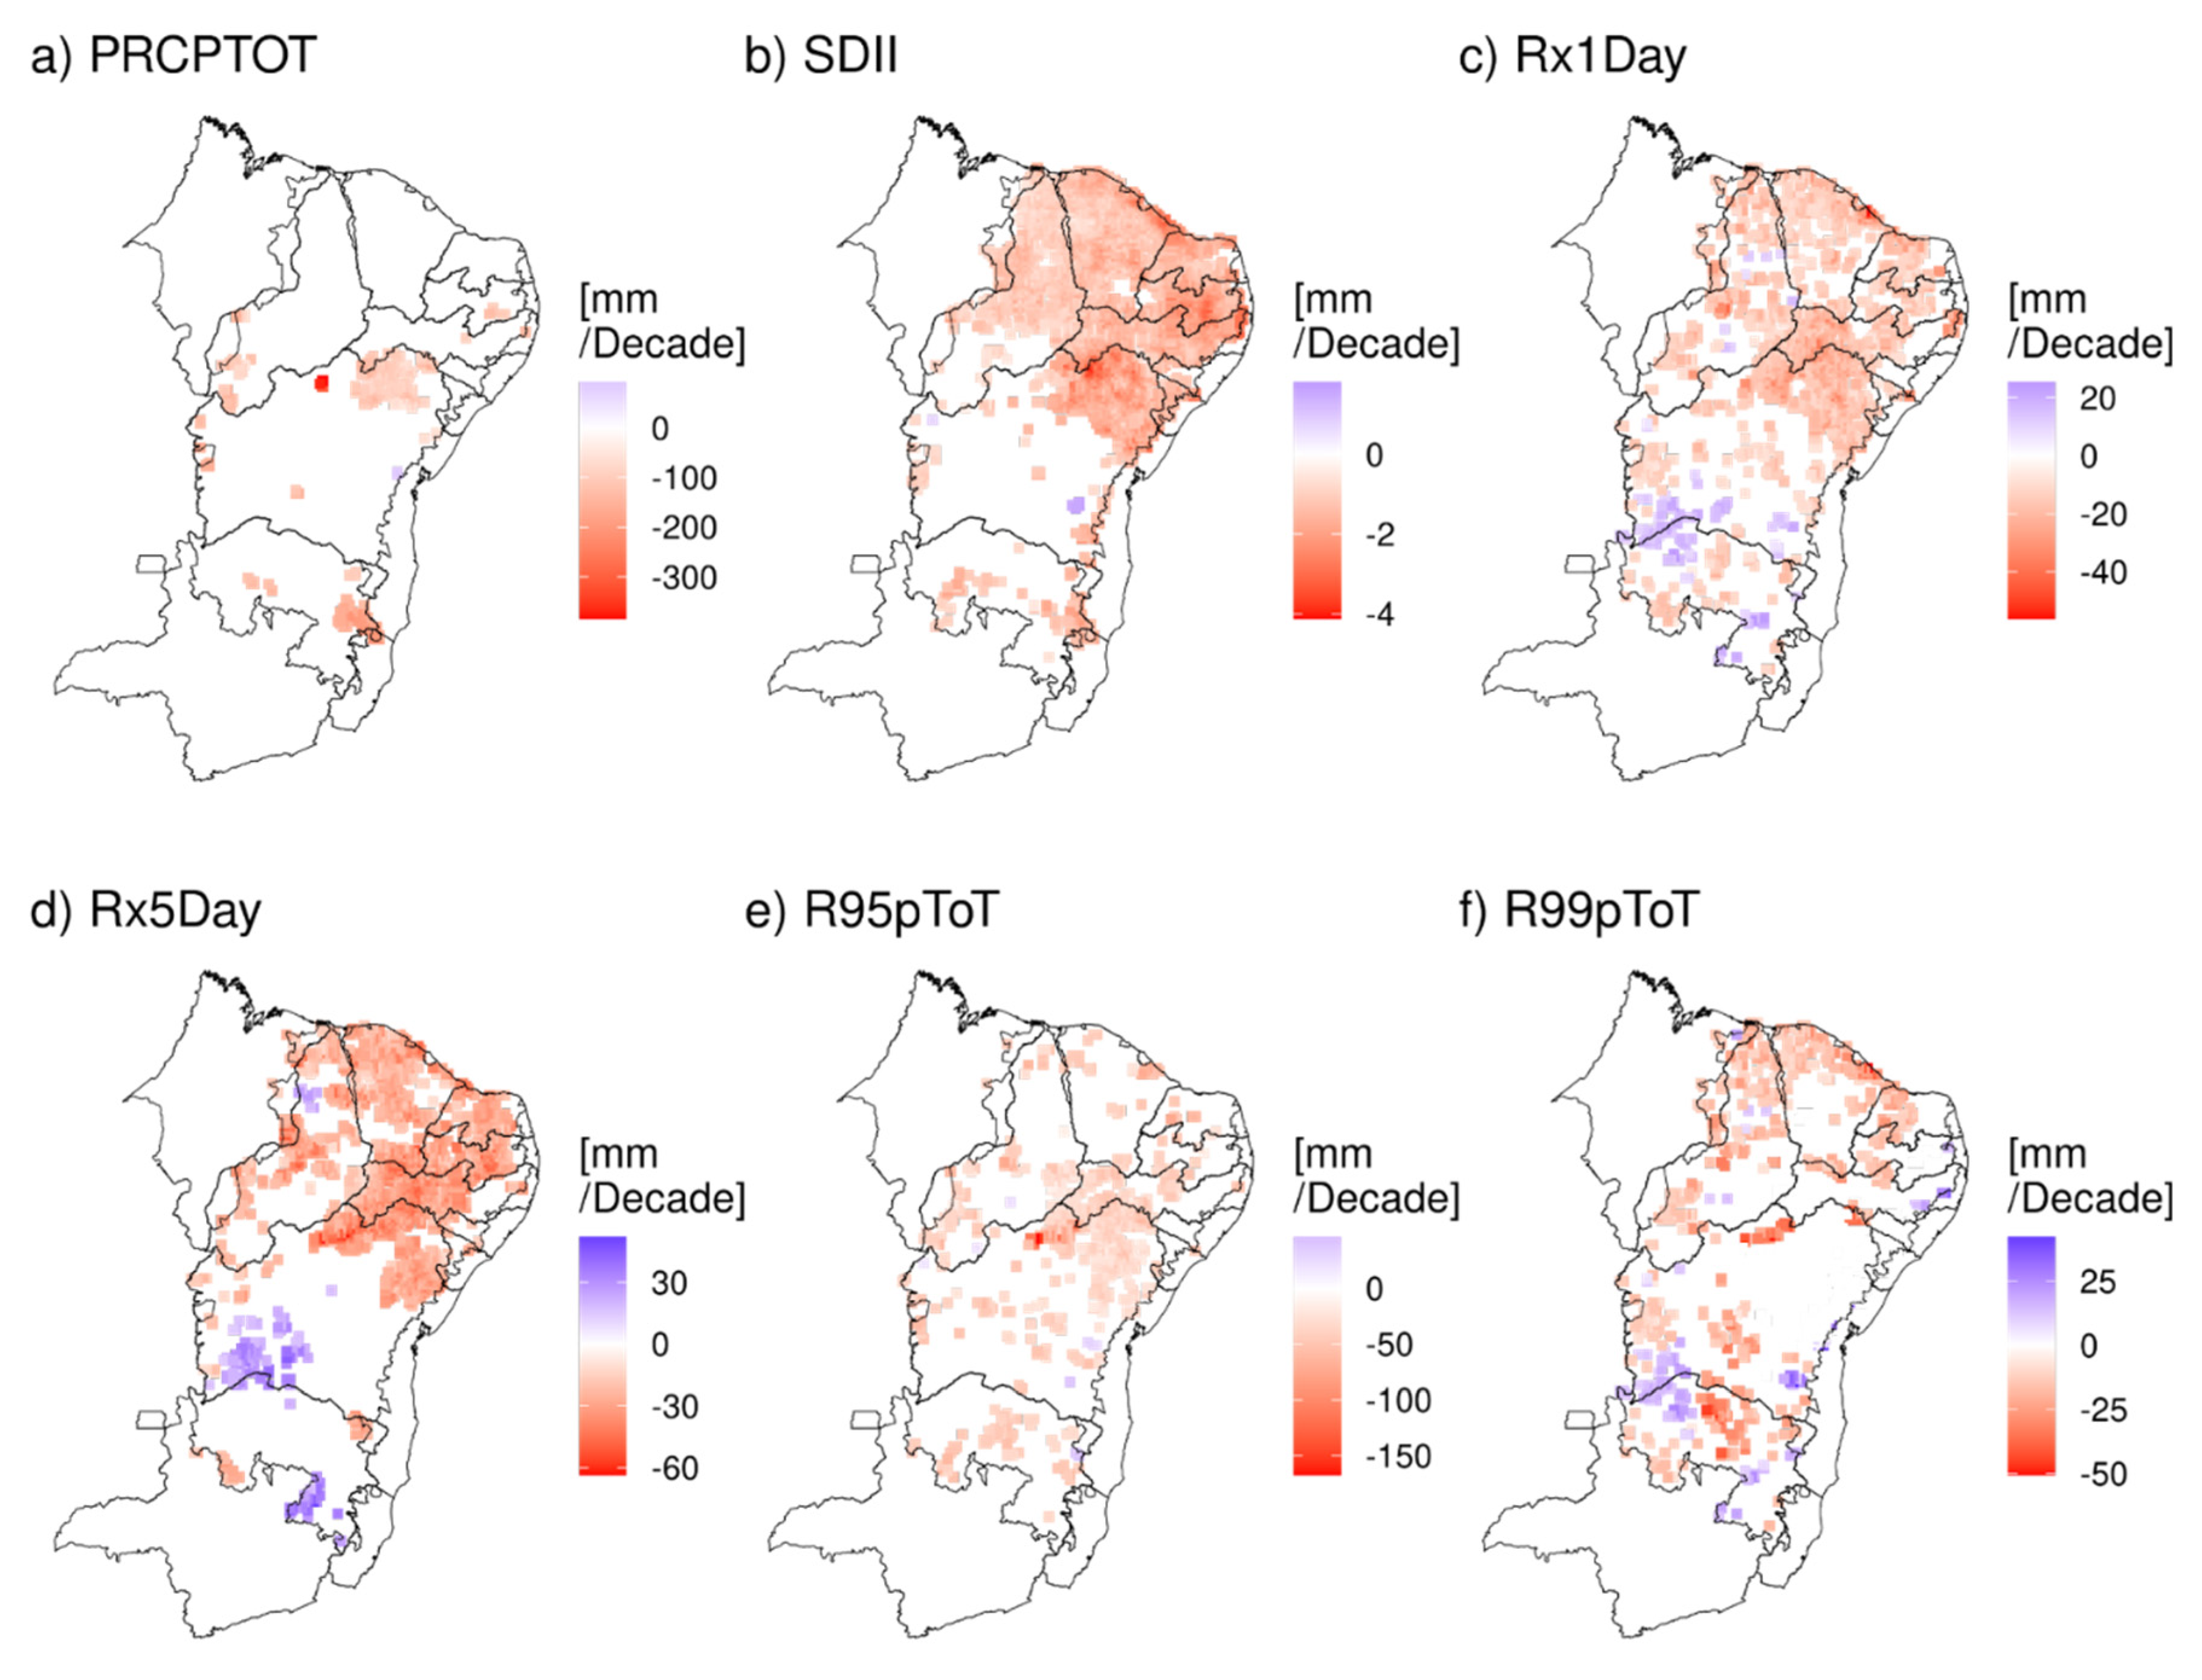
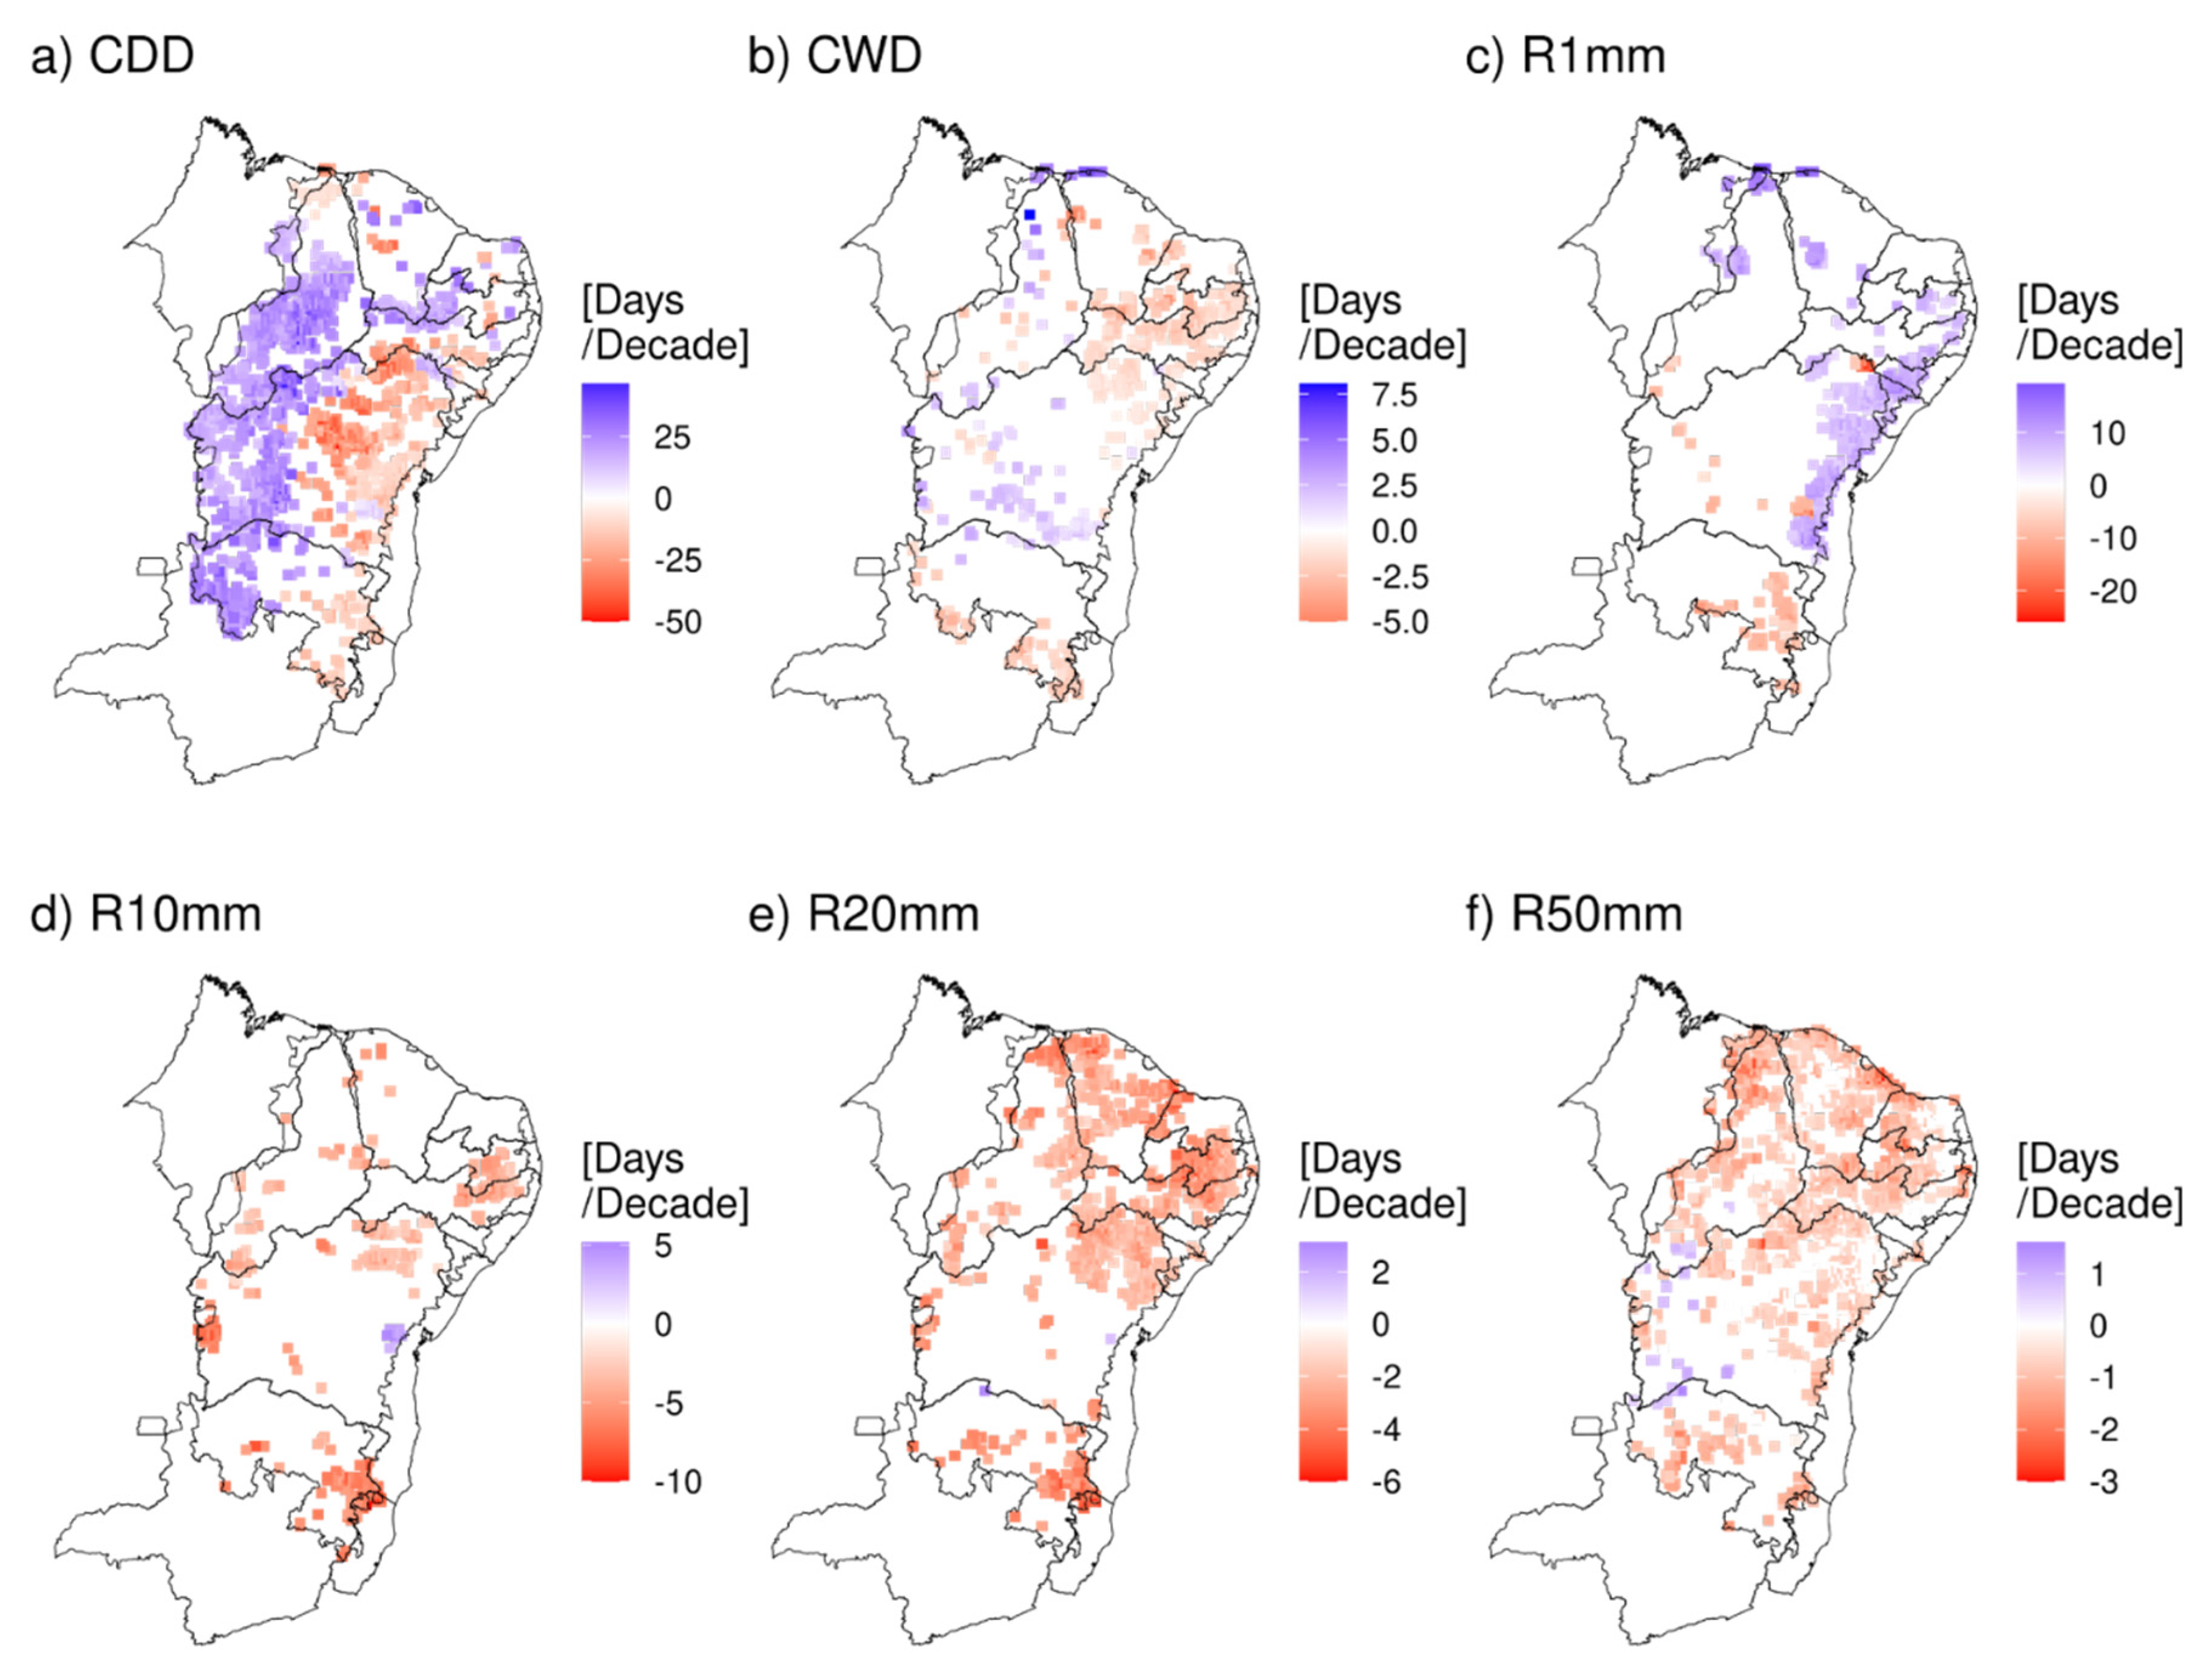
The spatial distribution of the mean precipitation frequency indices (CDD, CWD, R1 mm, R10 mm, R20 mm, and R50 mm) is presented in Figure 3. The analysis of the spatial pattern of the number of consecutive dry days (CDDs), which is associated with consecutive days without precipitation (Figure 3a), showed high CDD values, exceeding 100 days, in two specific regions of the area. The first area identified with a high number of consecutive dry days is located in the westernmost part of the SAB, from the southern state of Piauí to the northern state of Minas Gerais. This characteristic may result from the fact that this area is associated with hot and dry events in the Central Plateau of Brazil, which can be caused by atmospheric blocking systems [81]. The second area that also exhibited high CDD values is concentrated in the northern portion of the state of Ceará, south of the state of Rio Grande do Norte. The most likely explanation for this pattern is the migration of the ITCZ to the northern hemisphere during the dry months [75].
Regarding the spatial distribution of the consecutive wet days index (CWD), as shown in Figure 3b, in general, there were few areas with high CWD values. In most of the region, values below 16 days were observed, except in the northernmost part of the SAB, where the average number of consecutive wet days was 25.
Considering the spatial pattern of indices with defined thresholds, such as R1 mm (Figure 3c), R10 mm (Figure 3d), R20 mm (Figure 3e) and R50 mm (Figure 3f), the most intense rainfall (R50 mm) was frequent in only two regions, namely, the northeastern part of the states of Ceará and Rio Grande do Norte and the western border of Piauí with Maranhão. For the other thresholds, a precipitation gradient was observed, with higher values in the border regions, and lower values centered north of Bahia and south of Pernambuco. These findings are consistent with those of studies based on observational data from precipitation gauges, which conducted validations using statistical analyses and trend tests, resulting in satisfactory outcomes. These studies identified areas with a higher frequency of extreme events, consequently indicating their increased vulnerability to climate change within the region [12,39,43].

3.3. Trend Analyses

In general, in a large part of the semiarid region, the trends were statistically significant (p-values < 0.1) for all the indices under study (Figure 4a–f and Figure 5a–f). Most areas exhibited a negative trend, as also observed in [12], indicating a reduction in rainfall intensity, particularly in the northern part of the SAB, where the state of Piauí is situated. An exception was the total precipitation index (Figure 4a), which showed trends in few areas, a result corroborated by the findings in [44], which identified positive and negative trends in the MATOPIBA region, which encompasses a significant territory within the SAB. When considering SDII, Rx1Day, Rx5Day (Figure 4b–d), the results showed that most points had a decreasing trend, especially in the northern part of the semiarid region (p-values < 0.1). Increasing trends were less common and occurred mainly in the western and southern SAB, indicating an increase in maximum precipitation for 1 and 5 consecutive days, corroborating the research results in [83]. The results observed for the R95pToT and R99pToT indices, represented in Figure 4e,f, are similar to those observed in [19], which analyzed changes in precipitation extremes in the São Francisco River basin, which is mostly located within the SAB, and identified a decreasing trend.
The results of the spatial pattern of the CDD, represented in Figure 5a, are noteworthy, since there was a pronounced and intense spatial division between positive values in the westernmost area of the region and negative values in the easternmost part of the SAB region, with an increase of more than 25 days/decade and a decrease of 50 days/decade. These results are similar to those in [17], which observed that an increase in the number of dry days may occur throughout the northeast Brazil (NEB). The number of CDDs can indicate regions more vulnerable to drought [85].
Figure 5b shows the spatial distribution of the consecutive wet days index and reveals an increasing trend of the CWD index in the western and northern parts of the SAB, similar to what was observed for CDD (Figure 5a) and in a study [85] conducted in the state of Ceará, located in the northern part of the SAB region. These trends are also similar to those observed in a study [18] of extreme climate precipitation indices, assessing the relationship of these trends with Pacific and Atlantic Ocean anomalies over the states of Sergipe and Bahia, and to those reported in [86], which analyzed the trends of CDD and CWD using remote sensing data in the upper São Francisco River basin, employing an eighteen-year time series. Trends indicating increases in CWD and decreases in CDD were identified in the region.
More notably, the R1 mm index (Figure 5c) showed a spatial pattern with positive trends in the easternmost area of the SAB, with a trend exceeding 10 days per decade. The R20 mm index (Figure 5e) and R50 mm index (Figure 5f) followed a pattern similar to the intensity indices (Figure 4a–f), with negative trends, as revealed in [17,19]. And there were few areas where positive trends in these indices were observed in the region (Figure 5e–f), as also found in [87] when analyzing trends in the northeast region of Brazil using precipitation gauge data.

4. Conclusions

The main objective of this study was to characterize changes in precipitation patterns in the semiarid region of Brazil, using 12 extreme precipitation indices estimated from daily precipitation data (mm) from the IMERG Estimate Final Run Version 06 for the period from 1 January 2001 to 31 December 2020.
Although not climatological in nature, in general, the results revealed similar spatial patterns for most of the indices considered in the study, with the lowest precipitation values occurring in the central region of the SAB, characterizing this area as the driest. A spatial distribution analysis of annual mean precipitation intensity (PRCPTOT, SDII, Rx1Day, Rx5Day, R95pTOT, R99pTOT) demonstrated that the precipitation values showed decreases in the bordering areas towards the interior/center of the SAB. This result is particularly evident when looking at the maps relating to PRCPTOT and R99pTOT.
Considering the configuration of the spatial patterns for the average annual precipitation frequency values (CDD, CWD, R1 mm, R10 mm, R20 mm and R50 mm), in general, we can state that the highest precipitation values occurred in the far northwest and extreme south of the SAB region, rather than in the central and eastern portions of the SAB.
This study identified trends of changes in precipitation extremes, predominantly negative for most of the considered indices with statistical significance. Therefore, the precipitation extremes decreased over the time series. An exception was observed for the PRCPTOT index, for which no statistically significant changes were detected.
Changes in precipitation extremes, notably in indices like CDD, reveal intense variations. The results of the observed trends for this index exhibited a spatial distribution with strongly marked positive and negative values. Therefore, the trends indicated that the region with the highest number of consecutive dry days was the western part of the SAB region, where positive trends for the number of consecutive dry days were observed during the analyzed period. At the same time, the eastern part of the region experienced a contrasting scenario, with negative trends.
Even though remote sensing products have yielded good results and undergone numerous validations with data available on websites in various research endeavors worldwide, they still exhibit limitations that are gradually being addressed through improvements, such as calibrations, aimed at enhancing their performance over time. After all, recent studies highlighted the complexity and limitations of remote sensing precipitation estimation. The search for more accurate and reliable methods continues to be a priority, especially given the growing challenges related to climate change and water resource management. That is, an accurate assessment of the use of applications is crucial. It is noteworthy that we are currently using the IMERG product in its sixth version and are transitioning towards a more recent version, IMERG 07, launched in December 2023. Therefore, the importance of this work is highlighted, so that it will be possible to make a comparison between the results obtained using versions 6 and 7 for the study area, tracking the evolution of IMERG.
These results have significant implications for both society and resource management in the region. Areas more susceptible to extreme precipitation require the implementation of adaptive strategies to address challenges related to floods, droughts, and other weather- and climate-dependent consequences. In such conditions, understanding climate trends plays a crucial role in the development of policies aimed at mitigation and adaptation, contributing to the reduction of risks associated with climate change in the Brazilian semiarid region.

Author Contributions

Conceptualization, A.L.M.d.S. and W.A.G.; methodology, D.T.R.; software, A.L.M.d.S. and D.T.R.; validation, L.d.M.B.A., C.M.S.e.S. and W.A.G.; formal analysis, A.L.M.d.S., F.F.B., G.C.L. and D.T.R.; investigation, A.L.M.d.S., F.F.B. and G.C.L.; data curation, D.T.R.; writing—original draft preparation, A.L.M.d.S. and W.A.G.; writing—review and editing, A.L.M.d.S., W.A.G., D.T.R., L.d.M.B.A. and C.M.S.e.S.; supervision, W.A.G. All authors have read and agreed to the published version of the manuscript.

Funding

This study was financed by the Coordenação de Aperfeiçoamento de Pessoal de Nivel Superior, Brazil (CAPES)—Finance Code 001—and the Fundação de Amparo e Pesquisa do Rio Grande do Norte (FAPERN), process number 10910019.000263/2021-43.

Data Availability Statement

The data used in the manuscript are available by writing to the corresponding authors.

Acknowledgments

This study was financed by the Coordenação de Aperfeiçoamento de Pessoal de Nivel Superior, Brazil (CAPES) and the Fundação de Amparo e Pesquisa do Rio Grande do Norte (FAPERN).

Conflicts of Interest

The authors declare no conflicts of interest. The funders had no role in the design of the study; in the collection, analyses, or interpretation of data; in the writing of the manuscript; or in the decision to publish the results.

References

  1. Marengo, J.A.; Galdos, M.V.; Challinor, A.; Cunha, A.P.; Marin, F.R.; Vianna, M.d.S.; Alvala, R.C.S.; Alves, L.M.; Moraes, O.L.; Bender, F. Drought in Northeast Brazil: A review of agricultural and policy adaptation options for food security. Clim. Resil. Sustain. 2022, 1, e17. [Google Scholar] [CrossRef]
  2. Silva, J.D.S.; Júnior, J.B.C.; Rodrigues, D.T.; Silva, F.D.D.S. Climatology and significant trends in air temperature in Alagoas, Northeast Brazil. Theor. Appl. Climatol. 2023, 151, 1805–1824. [Google Scholar] [CrossRef]
  3. Zambrano, F.; Wardlow, B.; Tadesse, T.; Lillo-Saavedra, M.; Lagos, O. Evaluating satellite-derived long-term historical precipitation datasets for drought monitoring in Chile. Atmos. Res. 2017, 186, 26–42. [Google Scholar] [CrossRef]
  4. Caloiero, T.; Caroletti, G.N.; Coscarelli, R. IMERG-Based Meteorological Drought Analysis over Italy. Climate 2021, 9, 65. [Google Scholar] [CrossRef]
  5. Perera, H.; Senaratne, N.; Gunathilake, M.B.; Mutill, N.; Rathnayake, U. Appraisal of Satellite Rainfall Products for Malwathu, Deduru, and Kalu River Basins, Sri Lanka. Climate 2022, 10, 156. [Google Scholar] [CrossRef]
  6. Palharini, R.; Vila, D.; Rodrigues, D.; Palharini, R.; Mattos, E.; Undurraga, E. Analysis of Extreme Rainfall and Natural Disasters Events Using Satellite Precipitation Products in Different Regions of Brazil. Atmosphere 2022, 13, 1680. [Google Scholar] [CrossRef]
  7. de Medeiros, F.J.; de Oliveira, C.P. Dynamical Aspects of the Recent Strong El Niño Events and Its Climate Impacts in Northeast Brazil. Pure Appl. Geophys. 2021, 178, 2315–2332. [Google Scholar] [CrossRef]
  8. Morales, F.E.C.; Rodrigues, D.T.; Marques, T.V.; Amorim, A.C.B.; de Oliveira, P.T.; e Silva, C.M.S.; Gonçalves, W.A.; Lucio, P.S. Spatiotemporal Analysis of Extreme Rainfall Frequency in the Northeast Region of Brazil. Atmosphere 2023, 14, 531. [Google Scholar] [CrossRef]
  9. Lyra, G.B.; Oliveira-Júnior, J.F.; Gois, G.; Cunha-Zeri, G.; Zeri, M. Rainfall variability over Alagoas under the influences of SST anomalies. Meteorol. Atmos. Phys. 2017, 129, 157–171. [Google Scholar] [CrossRef]
  10. Timmermann, A.; An, S.-I.; Kug, J.-S.; Jin, F.-F.; Cai, W.; Capotondi, A.; Cobb, K.M.; Lengaigne, M.; McPhaden, M.J.; Stuecker, M.F.; et al. El Niño–Southern Oscillation complexity. Nature 2018, 559, 535–545. [Google Scholar] [CrossRef] [PubMed]
  11. André, I.R.N. Algumas Considerações Sobre Mudanças Climáticas e Eventos Atmosféricos Severos Recentes No Brasil. Climatologia e Estudos da Paisagem 2006, 1, 1–9. [Google Scholar]
  12. Silva, C.M.S.E.; Lima, K.C. Climatology and trend analysis of extreme precipitation in subregions of Northeast Brazil. Theor. Appl. Climatol. 2017, 130, 77–90. [Google Scholar] [CrossRef]
  13. da Silva, A.S.A.; Barreto, I.D.d.C.; Cunha-Filho, M.; Menezes, R.S.C.; Stosic, B.; Stosic, T. Spatial and Temporal Variability of Precipitation Complexity in Northeast Brazil. Sustainability 2022, 14, 13467. [Google Scholar] [CrossRef]
  14. Mutti, P.R.; Dubreuil, V.; Bezerra, B.G.; Arvor, D.; Funatsu, B.M.; Silva, C.M.S.E. Long-term meteorological drought characterization in the São Francisco watershed, Brazil: A climatic water balance approach. Int. J. Climatol. 2022, 42, 8162–8183. [Google Scholar] [CrossRef]
  15. Silva, P.E.; Silva, C.M.S.; Spyrides, M.H.C.; Andrade, L.M.B. Analysis of Climate Extreme Indices in the Northeast Brazil and the Brazilian Amazon in the Period from 1980 to 2013. Anuário Do Inst. Geociências-UFRJ 2019, 42, 137–148. [Google Scholar] [CrossRef]
  16. Rodrigues, D.T.; Gonçalves, W.A.; Spyrides, M.H.C.; Silva, C.M.S.E. Spatial and temporal assessment of the extreme and daily precipitation of the Tropical Rainfall Measuring Mission satellite in Northeast Brazil. Int. J. Remote Sens. 2020, 41, 549–572. [Google Scholar] [CrossRef]
  17. de Medeiros, F.J.; de Oliveira, C.P.; Avila-Diaz, A. Evaluation of extreme precipitation climate indices and their projected changes for Brazil: From CMIP3 to CMIP6. Weather Clim. Extrem. 2022, 38, 100511. [Google Scholar] [CrossRef]
  18. Araújo, W.D.S.; de Brito, J.I.B. Indices of trends of climatic changes for the states of the Bahia and Sergipe by means of daily precipitacion indices and its relation with SST’S of the Pacific and Atlantic. Rev. Bras. Meteorol. 2011, 26, 541–554. [Google Scholar] [CrossRef]
  19. Bezerra, B.G.; Silva, L.L.; Silva, C.M.S.E.; de Carvalho, G.G. Changes of precipitation extremes indices in São Francisco River Basin, Brazil from 1947 to 2012. Theor. Appl. Climatol. 2019, 135, 565–576. [Google Scholar] [CrossRef]
  20. Ren, Y.; Zhang, F.; Zhao, C.; Wang, D.; Li, J.; Zhang, J.; Cheng, Z. Spatiotemporal changes of extreme climate indices and their influence and response factors in a typical cold river basin in Northeast China. Theor. Appl. Climatol. 2023, 152, 1285–1309. [Google Scholar] [CrossRef]
  21. Hastenrath, S.; Greischar, L. Further work on the prediction of northeast Brazil rainfall anomalies. J. Clim. 1993, 6, 743–758. [Google Scholar] [CrossRef]
  22. Marengo, J.A.; Tomasella, J.; Uvo, C.R. Trends in streamflow and rainfall in tropical South America: Amazonia, eastern Brazil, and northwestern Peru. J. Geophys. Res. Atmos. 1998, 103, 1775–1783. [Google Scholar] [CrossRef]
  23. Haylock, M.R.; Peterson, T.C.; Alves, L.M.; Ambrizzi, T.; Anunciação, Y.M.T.; Baez, J.; Barros, V.R.; Berlato, M.A.; Bidegain, M.; Coronel, G.; et al. Trends in Total and Extreme South American Rainfall in 1960–2000 and Links with Sea Surface Temperature. J. Clim. 2006, 19, 1490–1512. [Google Scholar] [CrossRef]
  24. Talchabhadel, R.; Shah, S.; Aryal, B. Evaluation of the Spatiotemporal Distribution of Precipitation Using 28 Precipitation Indices and 4 IMERG Datasets over Nepal. Remote Sens. 2022, 14, 5954. [Google Scholar] [CrossRef]
  25. Du, H.; Alexander, L.V.; Donat, M.G.; Lippmann, T.; Srivastava, A.; Salinger, J.; Kruger, A.; Choi, G.; He, H.S.; Fujibe, F.; et al. Precipitation From Persistent Extremes is Increasing in Most Regions and Globally. Geophys. Res. Lett. 2019, 46, 6041–6049. [Google Scholar] [CrossRef]
  26. Li, X.; Chen, Y.; Wang, H.; Zhang, Y. Assessment of GPM IMERG and radar quantitative precipitation estimation (QPE) products using dense rain gauge observations in the Guangdong-Hong Kong-Macao Greater Bay Area, China. Atmos. Res. 2020, 236, 104834. [Google Scholar] [CrossRef]
  27. Navarro, A.; García-Ortega, E.; Merino, A.; Sánchez, J.L.; Tapiador, F.J. Orographic biases in IMERG precipitation estimates in the Ebro River basin (Spain): The effects of rain gauge density and altitude. Atmos. Res. 2020, 244, 105068. [Google Scholar] [CrossRef]
  28. Arshad, M.; Ma, X.; Yin, J.; Ullah, W.; Ali, G.; Ullah, S.; Liu, M.; Shahzaman, M.; Ullah, I. Evaluation of GPM-IMERG and TRMM-3B42 precipitation products over Pakistan. Atmos. Res. 2021, 249, 105341. [Google Scholar] [CrossRef]
  29. Moazami, S.; Najafi, M.R. A comprehensive evaluation of GPM-IMERG V06 and MRMS with hourly ground-based precipitation observations across Canada. J. Hydrol. 2021, 594, 125929. [Google Scholar] [CrossRef]
  30. Fang, J.; Yang, W.; Luan, Y.; Du, J.; Lin, A.; Zhao, L. Evaluation of the TRMM 3B42 and GPM IMERG products for extreme precipitation analysis over China. Atmos. Res. 2019, 223, 24–38. [Google Scholar] [CrossRef]
  31. Hordofa, A.T.; Leta, O.T.; Alamirew, T.; Kawo, N.S.; Chukalla, A.D. Performance Evaluation and Comparison of Satellite-Derived Rainfall Datasets over the Ziway Lake Basin, Ethiopia. Climate 2021, 9, 113. [Google Scholar] [CrossRef]
  32. Weng, P.; Tian, Y.; Jiang, Y.; Chen, D.; Kang, J. Assessment of GPM IMERG and GSMaP daily precipitation products and their utility in droughts and floods monitoring across Xijiang River Basin. Atmos. Res. 2023, 286, 106673. [Google Scholar] [CrossRef]
  33. Li, Z.; Tang, G.; Kirstetter, P.; Gao, S.; Li, J.-L.; Wen, Y.; Hong, Y. Evaluation of GPM IMERG and its constellations in extreme events over the conterminous united states. J. Hydrol. 2022, 606, 127357. [Google Scholar] [CrossRef]
  34. Huffman, G.J.; Bolvin, D.T.; Braithwaite, D.; Hsu, K.; Joyce, R.; Xie, P.; Yoo, S.H. NASA Global Precipitation Measurement (GPM) Integrated Multi-satellitE Retrievals for GPM (IMERG). In Algorithm Theoretical Basis Document (ATBD) Version 6.0; NASA: Washington, DC, USA, 2019. [Google Scholar]
  35. Huffman, G.J.; Bolvin, D.T.; Nelkin, E.J.; Tan, J. IMERG Technical Documentation; NASA: Washington, DC, USA, 2020. [Google Scholar]
  36. Zhang, W.; Di, Z.; Liu, J.; Zhang, S.; Liu, Z.; Wang, X.; Sun, H. Evaluation of Five Satellite-Based Precipitation Products for Extreme Rainfall Estimations over the Qinghai-Tibet Plateau. Remote Sens. 2023, 15, 5379. [Google Scholar] [CrossRef]
  37. Freitas, E.d.S.; Coelho, V.H.R.; Xuan, Y.; Melo, D.d.C.; Gadelha, A.N.; Santos, E.A.; Galvão, C.d.O.; Filho, G.M.R.; Barbosa, L.R.; Huffman, G.J.; et al. The performance of the IMERG satellite-based product in identifying sub-daily rainfall events and their properties. J. Hydrol. 2020, 589, 125128. [Google Scholar] [CrossRef]
  38. Nascimento, J.G.; Althoff, D.; Bazame, H.C.; Neale, C.M.U.; Duarte, S.N.; Ruhoff, A.L.; Gonçalves, I.Z. Evaluating the Latest IMERG Products in a Subtropical Climate: The Case of Paraná State, Brazil. Remote Sens. 2021, 13, 906. [Google Scholar] [CrossRef]
  39. Rodrigues, D.T.; e Silva, C.M.S.; dos Reis, J.S.; Palharini, R.S.A.; Júnior, J.B.C.; da Silva, H.J.F.; Mutti, P.R.; Bezerra, B.G.; Gonçalves, W.A. Evaluation of the Integrated Multi-SatellitE Retrievals for the Global Precipitation Measurement (IMERG) Product in the São Francisco Basin (Brazil). Water 2021, 13, 2714. [Google Scholar] [CrossRef]
  40. de Moraes, R.B.F.; Gonçalves, F.V. Comparison of the performance of estimated precipitation data via remote sensing in the Midwest Region of Brazil. Theor. Appl. Climatol. 2023, 153, 1105–1116. [Google Scholar] [CrossRef]
  41. Su, J.; Lü, H.; Zhu, Y.; Cui, Y.; Wang, X. Evaluating the hydrological utility of latest IMERG products over the Upper Huaihe River Basin, China. Atmos. Res. 2019, 225, 17–29. [Google Scholar] [CrossRef]
  42. Batista, F.F.; Rodrigues, D.T.; Silva, C.M.S.E. Analysis of climatic extremes in the Parnaíba River Basin, Northeast Brazil, using GPM IMERG-V6 products. Weather Clim. Extrem. 2024, 43, 100646. [Google Scholar] [CrossRef]
  43. dos Santos, A.L.M.; Gonçalves, W.A.; Rodrigues, D.T.; Andrade, L.d.M.B.; e Silva, C.M.S. Evaluation of Extreme Precipitation Indices in Brazil’s Semiarid Region from Satellite Data. Atmosphere 2022, 13, 1598. [Google Scholar] [CrossRef]
  44. Reis, L.C.D.; Silva, C.M.S.E.; Bezerra, B.G.; Mutti, P.R.; Spyrides, M.H.C.; da Silva, P.E. Analysis of Climate Extreme Indices in the MATOPIBA Region, Brazil. Pure Appl. Geophys. 2020, 177, 4457–4478. [Google Scholar] [CrossRef]
  45. Spera, S.A.; Galford, G.L.; Coe, M.T.; Macedo, M.N.; Mustard, J.F. Land-use change affects water recycling in Brazil’s last agricultural frontier. Glob. Chang. Biol. 2016, 22, 3405–3413. [Google Scholar] [CrossRef] [PubMed]
  46. Anderson, M.C.; Zolin, C.A.; Sentelhas, P.C.; Hain, C.R.; Semmens, K.; Yilmaz, M.T.; Gao, F.; Otkin, J.A.; Tetrault, R. The Evaporative Stress Index as an indicator of agricultural drought in Brazil: An assessment based on crop yield impacts. Remote Sens. Environ. 2016, 174, 82–99. [Google Scholar] [CrossRef]
  47. de Araújo, M.L.S.; Sano, E.E.; Bolfe, É.L.; Santos, J.R.N.; Santos, J.S.D.; Silva, F.B. Spatiotemporal dynamics of soybean crop in the Matopiba region, Brazil (1990–2015). Land Use Policy 2019, 80, 57–67. [Google Scholar] [CrossRef]
  48. Marengo, J.A.; Espinoza, J.C. Extreme seasonal droughts and floods in Amazonia: Causes, trends and impacts. Int. J. Climatol. 2016, 36, 1033–1050. [Google Scholar] [CrossRef]
  49. Confalonier, U.E.C. Variabilidade climática, vulnerabilidade social e saúde no Brasil. Terra Livre 2003, 19, 193–204. [Google Scholar]
  50. Gomes, A.C.D.S.; Santos, T.S.D.; Coutinho, M.D.L.; Silva, A.R. Clima e Doenças: Análise dos Elementos Meteorológicos e Infecções Respiratórias Agudas nas Capitais do Nordeste Brasileiro (Climate and Diseases: Analysis of Elements Meteorological and Respiratory Infections Acute in the Capitals of Northeast of Brazil). Rev. Bras. Geogr. Física 2013, 6, 1069–1081. [Google Scholar] [CrossRef]
  51. de Moraes, S.L.; Almendra, R.; Santana, P.; Galvani, E. Variáveis meteorológicas e poluição do ar e sua associação com internações respiratórias em crianças: Estudo de caso em São Paulo, Brasil. Cad. Saúde Pública 2019, 35, e00101418. [Google Scholar] [CrossRef]
  52. Tapiador, F.J.; Turk, F.J.; Petersen, W.; Hou, A.Y.; García-Ortega, E.; Machado, L.A.T.; Angelis, C.F.; Salio, P.; Kidd, C.; Huffman, G.J.; et al. Global precipitation measurement: Methods, datasets and applications. Atmos. Res. 2012, 104–105, 70–97. [Google Scholar] [CrossRef]
  53. Pradhan, R.K.; Markonis, Y.; Godoy, M.R.V.; Villalba-Pradas, A.; Andreadis, K.M.; Nikolopoulos, E.I.; Papalexiou, S.M.; Rahim, A.; Tapiador, F.J.; Hanel, M. Review of GPM IMERG performance: A global perspective. Remote Sens. Environ. 2022, 268, 112754. [Google Scholar] [CrossRef]
  54. Ledru, M.-P.; Jeske-Pieruschka, V.; Bremond, L.; Develle, A.-L.; Sabatier, P.; Martins, E.S.P.R.; Filho, M.R.d.F.; Fontenele, D.P.; Arnaud, F.; Favier, C.; et al. When archives are missing, deciphering the effects of public policies and climate variability on the Brazilian semi-arid region using sediment core studies. Sci. Total Environ. 2020, 723, 137989. [Google Scholar] [CrossRef]
  55. IBGE. Síntese de Indicadores Sociais: Uma Análise das Condições de vida da População Brasileira: 2022; IBGE: Rio de Janeiro, Brazil, 2022; Volume 49. [Google Scholar]
  56. INSA. O Semiárido Brasileiro. Available online: https://www.gov.br/insa/pt-br/semiarido-brasileiro (accessed on 17 September 2023).
  57. de Moura, M.S.B.; Sá, I.I.S.; da Silva, T.G.F.; Galvíncio, D.; Ribeiro, J.G. Variação Espacial da Precipitação e Temperatura do Ar no Submédio São Francisco. In Proceedings of the Congresso Brasileiro de Meteorologia, Florianópolis, Brazil, 27 November–1 December 2006; SBMET: Florianópolis, Brazil, 2006; Volume 14. 1 CD-ROM. [Google Scholar]
  58. Marengo, J.A.; Alves, L.M.; Beserra, E.A.; Lacerda, F.F. Recursos Hídricos em Regiões Áridas e Semiáridas; Instituto Nacional do Semiárido: Campina Grande-PB, Brazil, 2011.
  59. Suassuna, J. Semi-Árido: Proposta de convivência com a seca. In Cadernos De Estudos Sociais; Fundação Joaquim Nabuco: Recife, Brazil, 2011; Volume 23. [Google Scholar]
  60. Rodrigues, D.T.; Gonçalves, W.A.; Silva, C.M.S.E.; Spyrides, M.H.C.; Lúcio, P.S. Imputation of precipitation data in northeast Brazil. Anais Acad. Bras. Ciências 2023, 95, e20210737. [Google Scholar] [CrossRef] [PubMed]
  61. Uvo, C.R.B. A Zona de Convergência Intertropical (ZCIT) e a precipitação no norte do Nordeste do Brasil. Diss. Mestr. INPE 1989, 4, 81. [Google Scholar]
  62. Utida, G.; Cruz, F.W.; Etourneau, J.; Bouloubassi, I.; Schefuß, E.; Vuille, M.; Novello, V.F.; Prado, L.F.; Sifeddine, A.; Klein, V.; et al. Tropical South Atlantic influence on Northeastern Brazil precipitation and ITCZ displacement during the past 2300 years. Sci. Rep. 2019, 9, 1698. [Google Scholar] [CrossRef] [PubMed]
  63. Kousky, V.E.; Gan, M.A. Upper tropospheric cyclonic vortices in the tropical South Atlantic. Tellus 1981, 33, 538–551. [Google Scholar] [CrossRef]
  64. Reboita, M.S.; Campos, B.; Santos, T.; Gan, M.A.; Carvalho, V. Análise sinótica e numérica de um VCAN no Nordeste do Brasil. Rev. Bras. Geogr. Física 2017, 10, 41–59. [Google Scholar]
  65. Lyra, M.J.A.; Arraut, J.M. Análise Termodinâmica de um Vórtice Ciclônico de Altos Níveis sobre o Nordeste do Brasil. Anuário Inst. Geociências 2020, 43, 302–309. [Google Scholar] [CrossRef]
  66. Rodrigues, R.R.; Haarsma, R.J.; Campos, E.J.D.; Ambrizzi, T. The Impacts of Inter–El Niño Variability on the Tropical Atlantic and Northeast Brazil Climate. J. Clim. 2011, 24, 3402–3422. [Google Scholar] [CrossRef]
  67. da Rocha Júnior, R.L.; Silva, F.D.D.S.; Costa, R.L.; Gomes, H.B.; Pinto, D.D.C.; Herdies, D.L. Bivariate Assessment of Drought Return Periods and Frequency in Brazilian Northeast Using Joint Distribution by Copula Method. Geosciences 2020, 10, 135. [Google Scholar] [CrossRef]
  68. Gan, F.; Gao, Y.; Xiao, L. Comprehensive validation of the latest IMERG V06 precipitation estimates over a basin coupled with coastal locations, tropical climate and hill-karst combined landform. Atmos. Res. 2021, 249, 105293. [Google Scholar] [CrossRef]
  69. Karl, T.R.; Nicholls, N.; Ghazi, A. Clivar/GCOS/WMO Workshop on Indices and Indicators for Climate Extremes Workshop Summary. Clim. Chang. 1999, 42, 3–7. [Google Scholar] [CrossRef]
  70. Peterson, T.C.; Folland, C.; Gruza, G.; Hogg, W.; Mokssit, A.; Plummer, N. Report on the Activities of the Working Group on Climate Change Detection and Related Rapporteurs; World Meteorological Organization: Geneva, Switzerland, 2001. [Google Scholar]
  71. R Core Team. R: A Language and Environment for Statistical Computing. R Foundation for Statistical Computing. Available online: https://www.r-project.org/ (accessed on 17 January 2023).
  72. Mann, H.B. Nonparametric Tests Against Trend. Econometrica 1945, 13, 245. [Google Scholar] [CrossRef]
  73. Kendall, M.G. Rank Correlation Methods, 4th ed.; Charles Griffin: San Francisco, CA, USA, 1975. [Google Scholar]
  74. Sen, P.K. Estimates of the Regression Coefficient Based on Kendall’s Tau. J. Am. Stat. Assoc. 1968, 63, 1379–1389. [Google Scholar] [CrossRef]
  75. Coelho-Zanotti, M.D.S.; Gan, M.A.; Conforte, J.C. Estudo da variabilidade da posição e da nebulosidade associada à ZCIT do Atlântico, durante a estação chuvosa de 1998 e 1999 no Nordeste do Brasil. Rev. Brasileira Meteorol. 2004, 19, 23–34. [Google Scholar]
  76. Yu, L.; Leng, G.; Python, A. A comprehensive validation for GPM IMERG precipitation products to detect extremes and drought over mainland China. Weather Clim. Extrem. 2022, 36, 100458. [Google Scholar] [CrossRef]
  77. Gomes, H.B.; Ambrizzi, T.; da Silva, B.F.P.; Hodges, K.; Dias, P.L.S.; Herdies, D.L.; Silva, M.C.L.; Gomes, H.B. Climatology of easterly wave disturbances over the tropical South Atlantic. Clim. Dyn. 2019, 53, 1393–1411. [Google Scholar] [CrossRef]
  78. Silva, J.P.R.; Reboita, M.S.; Escobar, G.C.J. Caracterização da Zona de Convergência do Atlântico Sul em campos atmosféricos recentes. Rev. Bras. Climatol. 2019, 25, 2019. [Google Scholar] [CrossRef]
  79. de Azevedo, S.C.; Cardim, G.P.; Puga, F.; Singh, R.P.; da Silva, E.A. Analysis of the 2012-2016 drought in the northeast Brazil and its impacts on the Sobradinho water reservoir. Remote Sens. Lett. 2018, 9, 438–446. [Google Scholar] [CrossRef]
  80. Correia, M.F.; da Silva Dias, M.A.F.; da Silva Aragão, M.R. Soil occupation and atmospheric variations over Sobradinho Lake area. Part one: An observational analysis. Meteorol. Atmos. Phys. 2006, 94, 103–113. [Google Scholar] [CrossRef]
  81. Mendes, M.C.D.; Aragão, M.R.d.S.; Mendes, D.; Mesquita, M.D.S.; Correia, M.d.F.; Cavalcanti, E.P. Synoptic–dynamic indicators associated with blocking events over the Southeastern Pacific and South Atlantic oceans. Clim. Dyn. 2023, 60, 2285–2301. [Google Scholar] [CrossRef]
  82. Meneses, P.R.; Almeida, T.D.E. Introdução ao Processamento de Imagens de Sensoriamento Remoto; CNPq/UnB: Brasília, Brazil, 2012; p. 266. [Google Scholar]
  83. Xiao, S.; Xia, J.; Zou, L. Evaluation of Multi-Satellite Precipitation Products and Their Ability in Capturing the Characteristics of Extreme Climate Events over the Yangtze River Basin, China. Water 2020, 12, 1179. [Google Scholar] [CrossRef]
  84. Gao, Z.; Tang, G.; Jing, W.; Hou, Z.; Yang, J.; Sun, J. Evaluation of Multiple Satellite, Reanalysis, and Merged Precipitation Products for Hydrological Modeling in the Data-Scarce Tributaries of the Pearl River Basin, China. Remote Sens. 2023, 15, 5349. [Google Scholar] [CrossRef]
  85. Santos, C.A.G.; Neto, R.M.B.; da Silva, R.M.; Passos, J.S.d.A. Integrated spatiotemporal trends using TRMM 3B42 data for the Upper São Francisco River basin, Brazil. Environ. Monit. Assess. 2018, 190, 175. [Google Scholar] [CrossRef]
  86. Melo, M.M.M.S.; Santos, C.A.C.D.; de Olinda, R.A.; Silva, M.T.; Abrahão, R.; Ruiz-Alvarez, O. Trends in Temperature and Rainfall Extremes near the Artificial Sobradinho Lake, Brazil. Rev. Bras. Meteorol. 2018, 33, 426–440. [Google Scholar] [CrossRef]
  87. Costa, R.L.; de Mello Baptista, G.M.; Gomes, H.B.; dos Santos Silva, F.D.; da Rocha Júnior, R.L.; de Araújo Salvador, M.; Herdies, D.L. Analysis of climate extremes indices over northeast Brazil from 1961 to 2014. Weather Clim. Extrem. 2020, 28, 100254. [Google Scholar] [CrossRef]
Figure 1. Limits of the Brazilian semiarid (SAB) region and topography of the states it includes: Maranhão (MA), Piauí (PI), Ceará (CE), Rio Grande do Norte (RN), Paraíba (PB), Pernambuco (PE), Alagoas (AL), Sergipe (SE), Bahia (BA), Minas Gerais (MG) and Espírito Santo (ES).
Climate 12 00043 g001
Figure 2. Spatial distribution of the annual mean precipitation intensity values (mm) for 10,880 grid points over 20 years (2001–2020). (a) PRCPTOT, (b) SDII, (c) Rx1Day, (d) Rx5Day, (e) R95pTOT and (f) R99pTOT.
Climate 12 00043 g002
Figure 3. Spatial distribution of the annual mean values of precipitation frequency (mm) for the 10.880 grid points over 20 years (2001–2020). (a) CDD, (b) CWD, (c) R1 mm, (d) R10 mm, (e) R20 mm and (f) R50 mm.
Climate 12 00043 g003
Figure 4. Spatial distribution, by decade, of precipitation index trends. (a) PRCPTOT, (b) SDII, (c) Rx1day, (d) Rx5Day, (e) R95pToT and (f) R99pToT for the period from 2001 to 2020, with a significance level of 10% per decade. Positive values are represented in blue, and negative values in red.
Climate 12 00043 g004
Figure 5. Spatial distribution, by decade, of trends in precipitation indices. (a) CDD, (b) CWD, (c) R1 mm, (d) R10 mm, (e) R20 mm and (f) R50 mm for the period from 2001 to 2020, with a significance level of 10%. Positive values are represented in blue, and negative values in red.
Climate 12 00043 g005
Table 1. Indices of climatic extremes calculated in the present study.
IndicesDefinitionsUnits
PRCPTOTAnnual total precipitation on wet daysmm
SDIISimple precipitation intensity indexmm/day
RX1dayMonthly maximum 1-day precipitationmm
RX5dayMonthly maximum 5-day precipitationmm
R95pToTAnnual total PRCP when RR > 95pmm
R99pToTAnnual total PRCP when RR > 99pmm
CDDMaximum length of dry spell, maximum number of consecutive days with RR < 1 mmdays
CWDMaximum length of wet spell, maximum number of consecutive days with RR ≥ 1 mmdays
R1 mmAnnual count of days when PRCP ≥ 1 mmdays
R10 mmAnnual count of days when PRCP ≥ 10 mmdays
R20 mmAnnual count of days when PRCP ≥ 20 mmdays
R50 mmAnnual count of days when PRCP ≥ 50 mmdays
Disclaimer/Publisher’s Note: The statements, opinions and data contained in all publications are solely those of the individual author(s) and contributor(s) and not of MDPI and/or the editor(s). MDPI and/or the editor(s) disclaim responsibility for any injury to people or property resulting from any ideas, methods, instructions or products referred to in the content.

