Article

Accounting for Climate and Inherent Soil Quality in United Nations (UN) Land Degradation Analysis: A Case Study of the State of Arizona (USA)

1
Department of Forestry and Environmental Conservation, Clemson University, Clemson, SC 29634, USA
2
College of Forestry, Agriculture, and Natural Resources, University of Arkansas at Monticello, Monticello, AR 71656, USA
3
The Libyan Center for Palm Tree Research, Libyan Authority for Scientific Research, Tripoli 00218, Libya
4
Department of Biological Science and Biotechnology, Minnan Normal University, Zhangzhou 363000, China
5
Department of Electronic Information, Zhangzhou Institute of Technology, Zhangzhou 363000, China
6
Department of Environmental Engineering and Earth Sciences, Clemson University, Anderson, SC 29625, USA
7
Clemson Center for Geospatial Technologies, Clemson University, Anderson, SC 29625, USA
8
School of Law, Emory University, Atlanta, GA 30322, USA
*
Author to whom correspondence should be addressed.
Climate 2024, 12(12), 194; https://doi.org/10.3390/cli12120194
Submission received: 19 October 2024 / Revised: 12 November 2024 / Accepted: 19 November 2024 / Published: 21 November 2024

Abstract

:
Climate change and land degradation (LD) are some of the most critical challenges for humanity. Land degradation (LD) is the focus of the United Nations (UN) Convention to Combat Desertification (UNCCD) and the UN Sustainable Development Goal (SDG 15: Life on Land). Land degradation is composed of inherent and anthropogenic LD, which are both impacted by inherent soil quality (SQ) and climate. Conventional LD analysis does not take into account inherent SQ because it is not the result of land use/land cover change (LULC), which can be tracked using remote sensing platforms. Furthermore, traditional LD analysis does not link anthropogenic LD to climate change through greenhouse gas (GHG) emissions. This study uses one of the indicators for LD for SDG 15 (15.3.1: Proportion of land that is degraded over the total land area) to demonstrate how to account for inherent SQ in anthropogenic LD with corresponding GHG emissions over time using the state of Arizona (AZ) as a case study. The inherent SQ of AZ is skewed towards low-SQ soils (Entisols: 29.3%, Aridisols: 49.4%), which, when combined with climate, define the inherent LD status. Currently, 8.6% of land in AZ has experienced anthropogenic LD primarily because of developments (urbanization) (42.8%) and agriculture (32.2%). All six soil orders have experienced varying degrees of anthropogenic LD. All land developments in AZ can be linked to damages from LD, with 4862.6 km2 developed, resulting in midpoint losses of 8.7 × 10¹⁰ kg of total soil carbon (TSC) and a midpoint social cost of carbon dioxide emissions (SC-CO2) of $14.7B (where B = billion = 109, USD). Arizona was not land degradation neutral (LDN) based on an increase (+9.6%) in the anthropogenic LD overall and an increase in developments (+29.5%) between 2001 and 2021. Considering ongoing climate change impacts in AZ, this increase in urbanization represents reverse climate change adaptation (RCCA) because of the increased population. The state of AZ has 82.0% of the total state area for nature-based solutions (NBS). However, this area is dominated by soils with inherently low SQ (e.g., Entisols, Aridisols, etc.), which complicates efforts for climate change adaptation.

1. Introduction

Climate change and land degradation (LD) are some of the most critical challenges for humanity; therefore, many United Nations (UN) initiatives are focused on land degradation (LD). However, the importance of inherent soil quality (SQ) in LD analysis using satellite-based land use/land cover change (LULC) data is often overlooked. Currently, LD is described as “reduction or loss, in arid, semi-arid and dry sub-humid areas, of the biological or economic productivity and complexity of rainfed cropland, irrigated cropland, or range, pasture, forest and woodlands resulting from land uses or from a process or combination of processes, including processes arising from human activities and habitation patterns, such as: soil erosion caused by wind and/or water; deterioration of the physical, chemical and biological or economic properties of soil; and long-term loss of natural vegetation” [1]. Additionally, the concept of land degradation neutrality (LDN) was put forward at the 12th Conference of the Parties (COP12) of the United Nations Convention to Combat Desertification (UNCCD) in October 2015, which defined LDN as “a state whereby the amount and quality of land resources, necessary to support ecosystem functions and services and enhance food security, remains stable or increases within specified temporal and spatial scales and ecosystems”(https://www.unccd.int/sites/default/files/sessions/docments/ICCD_COP12_4/4eng.pdf (accessed on 14 August 2024)) [2].
Both concepts, LD and LDN, are also used as part of the UN Sustainable Development Goal (SDG) 15: Life on Land [3] and its Indicator 15.3.1 (Proportion of land that is degraded over total land area) as noted in the UN “Good Practice Guidance” document [4]. This SDG 15 indicator does not specify the type of LD even though the official LD definition most likely implies anthropogenic LD based on the words used to describe it (e.g., human activities, etc.). The process of LD status determination often uses three distinct sub-indicators, including “(1) land cover trends, (2) land productivity trends, and (3) below and above-ground soil organic carbon (SOC) stock trends” [4]. The overall LD status is determined using the one-out-all-out (1OAO) methodology, where degradation seen in any one of the sub-indicators causes a determination of degraded LD status [4].
According to the statement from the UN SDG initiative, each target should be “disaggregated, where relevant, by income, sex, age, race, ethnicity, migratory status, disability and geographic location, or other characteristics, in accordance with the Fundamental Principles of Official Statistics, United Nations (UN) Resolution 68/261” [5], which gives an opportunity for experts to make practical recommendations on how to make such disaggregation. For example, Mikhailova et al. (2024) [6] suggested disaggregating LD and LDN by soil type and various kinds of anthropogenic LD (barren land, agriculture, and developed area) (Figure 1) at various administrative levels (e.g., state, country). The importance of soil types in LD is not only limited to “arid, semi-arid and dry sub-humid areas” as specified in the LD definition; these are important for other environments as well. Anthropogenic LD is directly linked to inherent SQ (soil suitability) (Figure 1) [7,8].
Figure 1. Anthropogenic land degradation (LD) can be defined as the total of the individual amounts of barren, developed, and agricultural land covers, which are directly linked to inherent soil quality (SQ) and impacted by climate (adapted from Mikhailova et al. 2024 [7]).
Climate 12 00194 g001
Arizona was chosen as the location for a case study for this research because it is in an arid area where inherent SQ is an important aspect of LD. The inherent SQ in AZ is skewed towards inherently low-fertility soil orders that include slightly (Entisols, 29.3%; Inceptisols, 1.0%), and moderately weathered (Aridisols, 49.4%) soils (Figure 2; Table S1). The remaining soil types found in AZ are moderately weathered soils (Vertisols, Alfisols, and Mollisols) (Figure 2). Arizona soils have various C contents which have been impacted both by more recent and historical LD. By 2021, the total estimated storage values for TSC were 2.4 × 10¹² kg C and the mid-point monetary value of SC-CO2 was $411.2B (i.e., $411.2B billion U.S. dollars, where B = billion = 109) in AZ (Table 1). As part of these estimated totals, SOC represents 37% of the SC-CO2 value, and SIC represents 63% of the total value (Table 1). As reported previously, the state of AZ is ranked 34th for SOC [9], 6th for SIC [10], and 16th for TSC [11] for the SC-CO2 values within the United States 48 contiguous states. The LD found in AZ, as well as its related environmental impacts, are well documented by past research. Mikhailova et al. (2024) [6] reported that AZ land saw 8.4% anthropogenic LD, but overall LD may be much higher because the state is dominated by soils with inherently low SQ with high soil inorganic (SIC) content.
Figure 2. Arizona (AZ) (USA) soil map (31°20′ N to 37° N; 109°03′ W to 114°49′ W) acquired from the SSURGO soils spatial database [12]. The inherent soil quality (soil suitability) of AZ is dominated by slightly weathered Entisols (29.3%) and moderately weathered Aridisols (49.4%).
Climate 12 00194 g002
Historically, the state of AZ has experienced tremendous LD as described in various archived documents [13]. Several recent studies documented accelerated soil erosion from urban developments in arid lands of the Sonoran Desert (USA) [14,15]. Land degradation in the Sonoran Desert was linked to an increase in temperature and evaporation because of the loss of soil moisture [16]. Unprecedented population growth fueled rapid urbanization and LD of Ambos Nogales between 1985 and 2004 [17]. Oerter et al. (2018) [18] examined GHG production and transport in desert soils, including the state of AZ, and concluded that climate change will accelerate the loss of SOC. Agricultural activities that use acidifiers can increase GHG emissions from calcareous soils in semi-arid areas, but these losses are often overlooked in the accounting efforts [19,20].
Prior research on AZ’s LD failed to evaluate the overall LDN status and the role of soils in LD. This study hypothesizes that the conventional LD analysis may underestimate the true LD status in areas with inherent low SQ because LULC change analysis does not include this information. This study proposes to account for inherent SQ as part of LD analysis to be able to better compare areas with different inherent SQ. Also, areas with low SQ can contain significant amounts of SIC, which need to be accounted for in LD and LDN analyses, because SIC can be a source of GHG emissions upon disturbance.
Table 1. Inherent soil quality (soil suitability) distribution as well as one of the land degradation sub-indicators (soil organic carbon, C), and carbon-regulating ecosystem services by soil order in the state of Arizona (AZ) (USA) (photos courtesy of USDA/NRCS [21]) in 2021.
Inherent Soil Quality in the State of Arizona (AZ) (USA)
Lower  Climate 12 00194 i007   Higher
Degree of Soil Development and Weathering
Slight (30.3%)Moderate (69.7%)
EntisolsInceptisolsAridisolsVertisolsAlfisolsMollisols
29.3%1.0%49.4%2.3%5.1%12.9%
Climate 12 00194 i001Climate 12 00194 i002Climate 12 00194 i003Climate 12 00194 i004Climate 12 00194 i005Climate 12 00194 i006
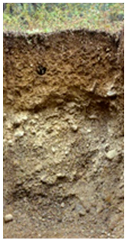
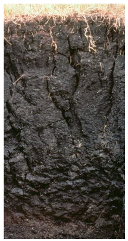
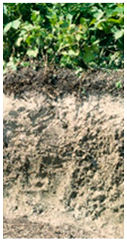
Midpoint storage and social cost of soil organic carbon (SOC): 9.1× 10¹¹ kg C,$152.9B
3.1 × 10¹¹ kg 1.1 × 10¹⁰ kg 2.6 × 10¹¹ kg 4.5 × 10¹⁰ kg 5.0 × 10¹⁰ kg 2.3 × 10¹¹ kg
$52.3B$1.9B$43.7B$7.6B$8.5B$38.9B
34.2%1.2%28.65.0%5.6%25.4%
Midpoint storage and social cost of soil inorganic carbon (SIC): 1.5× 10¹² kg C,$257.6B
1.9 × 10¹¹ kg6.4 × 109 kg1.0 × 1012 kg7.1 × 1010 kg2.9 × 1010 kg2.0 × 1011 kg
$31.8B$1.1B$174.9B$12.0B$4.8B$32.9B
12.3%0.4%67.9%4.7%1.9%12.8%
Midpoint storage and social cost of total soil carbon (TSC): 2.4× 10¹² kg C,$411.2B
5.0 × 10¹¹ kg1.8 × 1010 kg1.3 × 1012 kg1.2 × 1011 kg7.9 × 1010 kg4.3 × 1011 kg
$84.1B$2.9B$219.3B$19.7B$13.4B$71.7B
20.5%0.7%53.3%4.8%3.3%17.4%
Sensitivity to climate change
LowLowLowHighHighHigh
SOC and SIC sequestration (recarbonization) potential
LowLowLowLowLowLow
Note: Entisols, Inceptisols, Aridisols, Vertisols, Alfisols, and Mollisols are mineral soils. M = million = 106; B = billion = 109; $ = United States dollar (USD). See Supplemental Table S4 for minimum and maximum values.
The main objective of this study was to quantify the contribution of LD to climate change. Specific objectives were to: (1) evaluate and identify limitations of the current UN SDG 15 Indicator 15.3.1 for the state of AZ at various administrative levels (e.g., county) and disaggregate results by type of LD, and soil type, using spatial soil data from the State Soil Geographic Database (STATSGO) [22] and the more detailed Soil Survey Geographic Database (SSURGO) [12]; (2) examine the role of inherent SQ in LD, LDN, and NBS analyses; (3) consider including soil inorganic carbon (SIC) and total soil carbon (TSC) in LD and LDN analyses; and (4) identify different LD damages using LULC change analysis with classified satellite land cover data to track land conversions between 2001 and 2021, and value these damages (e.g., C loss from the soil) using the social costs of C (SC-CO2) concept [23].

2. Materials and Methods

This study utilized both an accounting (Table S2) and organizational framework (Table 2) to evaluate SDG 15: Life on Land, Target 15.3, and Indicator 15.3.1 by determining inherent SQ and disaggregating anthropogenically derived LD and LDN by related land cover types (barren land, developed land, and agriculture) and its changes within AZ. This disaggregation by LD type uses the existing geospatial Indicator 15.3.1, which was detailed in “The SDGs Geospatial Roadmap” [24]. This demonstration comprises two parts, shown in Table 2, Part 1 comprises the determination of inherent SQ and evaluating LD and LDN by soil type, land cover type and administrative unit (Figure 3). Different types of LD were recognized using available data from classified land cover (30-m) satellite remote sensing datasets from 2001 and 2021 from the Multi-Resolution Land Characteristics Consortium (MRLC) [25] (Figure 3). Land cover data were translated from raster to vector format and then unioned with vector soil spatial data (SSURGO) [12] using ArcGIS Pro 2.6 [26] to identify associations between soil orders and land covers (Figure 3).
Part 2 shows the method that was used to estimate both soil C stocks and C losses from land conversions and assign monetary damages. Soil C contents of SOC, SIC and TSC (kg m−2) were determined by combining spatial soils datasets (Figure 2) and values taken from Guo et al. (2006) [27] by soil order and by administrative spatial unit (e.g., county) (Table S3). The EPA-calculated SC-CO2 of $46 per metric ton of CO2 [23] (Table S3) was used to convert C losses to monetary damages. These SC-CO2 values are fixed and are likely an underestimation of the true market costs of climate change damages. Monetary values ($ m−2) were calculated for each area with equation (1), while totals were calculated by summing within polygon boundaries (with SC = soil carbon and a metric tonne equal to 1 megagram (Mg) or 1000 kilograms (kg)):
$   U S D m 2 = S C   C o n t e n t ,   k g m 2 × 1   M g 10 3   k g × 44   M g   C O 2 12   M g   S C × $ 46   U S D M g   C O 2  
For the Aridisols soil order, as an example, Guo et al. (2006) [27] provided a midpoint estimate of 4.0 kg m−2 for SOC content (2-m soil depth; Table S3). This soil content can be utilized in Equation (1), to calculate an area-normalized SOC value of $0.67 m−2. The SOC content with its area-normalized value for that area is subsequently multiplied by the area of Aridisols within AZ (65,262.2 km2) to give a midpoint SOC stock estimate of 2.6 × 10¹¹ kg with a $152.9B monetary value.
Table 2. The organizational framework for including inherent soil quality (SQ), disaggregating land degradation and its indicators for the United Nations (UN) Sustainable Development Goal (SDG) 15 and Target 15.3 (adapted from Hák et al. (2016) [28]; Assembly, U.G. (2017) [29]).
United Nations (UN) Sustainable Development Goal (SDG), Target, and Indicator 1
United Nations Sustainable Development Goal 15. Protect, restore and promote sustainable use of terrestrial ecosystems, sustainably manage forests, combat desertification, and halt and reverse land degradation and halt biodiversity loss.
Target 15.3 By 2030, combat desertification, restore degraded land and soil, including land affected by desertification, drought and floods, and strive to achieve a land degradation neutral world.
Current Indicator 15.3.1: Proportion of land that is degraded over total land area.
This study—Demonstration of the importance of including inherent soil quality (SQ) for LD and LDN analyses:
1. Determination of inherent soil quality (SQ) and degraded land, which is disaggregated by different types of LD (barren land, developed, agriculture), soil types, administrative units, and trends over time to determine land degradation neutrality (LDN) (Metric: area, %; Scale: local, regional, national, global; Measurement frequency: annual).
2. Damages associated with LD within the administrative unit and trends over time (Metric: loss of C sequestration potential, soil carbon (C) loss (differentiated by type: SOC, SIC, and TSC), social costs of soil carbon (C) (SC-CO2) [23]; Scale: local, regional, national, global; Measurement frequency: annual).
1 Sustainable Development Goal indicators should be disaggregated, where relevant, by income, sex, age, race, ethnicity, migratory status, disability and geographic location, or other characteristics, in accordance with the Fundamental Principles of Official Statistics, United Nations (UN) Resolution 68/261 [5].
Figure 3. Flowchart of geospatial analysis used in this study. Analysis was completed using ArcGIS Pro 2.6 software. Land cover change analysis used the raster calculator to compute differences between satellite remote sensing datasets from 2001 and 2021 (Multi-Resolution Land Characteristics Consortium (MRLC) [25]). The resulting change raster was converted to vector format using the raster to polygon tool and then unioned with the vector soil spatial data (SSURGO) [12] using the union tool. The land cover change/soils dataset was combined with the vector administrative units using the intersect tool, which were subsequently tabulated for soil and land cover change areas.
Climate 12 00194 g003

3. Results

3.1. Limitations of Indicator 15.3.1 for UN SDG 15: Life on Land

Current indicator and its limitations: Indicator 15.3.1: Proportion of land that is degraded over total land area, which belongs to “SDG 15: Life on Land. Protect, Restore, and Promote Sustainable Use of Terrestrial Ecosystems, Sustainably Manage Forests, Combat Desertification, Halt and Reverse Land Degradation and Biodiversity Loss (Target 15.3 By 2030, Combat Desertification, Restore Degraded Land and Soil, including Land Affected by Desertification, Drought and Floods, and Strive to Achieve a Land Degradation Neutral World)” [29]. This indicator does not differentiate between inherent and anthropogenic LD. Current LD definition [1] implies that anthropogenic LD (identified through satellite remote sensing LULC analysis (Figure 4)) can estimate the indicator by identifying land cover and the changes in land cover areas over time used to represent LD. Anthropogenic LD identification is possible using the assumption that human-impacted land cover is represented by the following land cover types: developed areas (developed, low intensity; developed, medium intensity; developed, high intensity; developed, open space), agricultural (cultivated crops and hay/pasture), along with barren lands (Figure S1). Almost 8.6% of the AZ land area could be regarded as anthropogenically degraded land in 2021 (Table 3), however, this is an aggregated value over the whole state, and it is important to disaggregate indicator 15.3.1 by smaller units using expert knowledge (e.g., soil science, etc.) to understand the LD patterns [6]. Disaggregating anthropogenic LD data for the state of AZ reveals spatial variation among 15 counties of AZ (Figure 5 and Figure S2; Table S5). Analysis at the county level shows that LD proportion spans from as high as 44% (La Paz and Yuma counties) to the lowest level of 1.4% (Gila County) (Table S5). Just considering anthropogenic LD, all soil orders in AZ were subject to LD: Entisols (12%), Inceptisols (2%), Aridisols (9%), Vertisols (1%), Alfisols (1%), and Mollisols (4%). Using this proportion of anthropogenic LD, there appears to be a low overall LD status in AZ, while almost 80% of the soils have low inherent soil quality (Table 3) and are degraded.
Figure 4. Land cover map of the state of Arizona (AZ) (USA) for 2021 (31°20′ N to 37° N; 109°03′ W to 114°49′ W) (based on data from MRLC [25]).
Climate 12 00194 g004
Table 3. The soil quality continuum was represented by the state of Arizona (AZ) (USA) land use/land covers (LULC) and soil order areas in 2021.
Soil Quality Continuum
NLCD Land Cover Classes
(LULC),
Dynamic Soil Quality
(Soil Health Continuum)
2021 Total
Area by LULC
(km2, %)
Inherent Soil Quality (Soil Suitability)
Lower  Climate 12 00194 i007   Higher
Degree of Weathering and Soil Development
SlightModerate
EntisolsInceptisolsAridisolsVertisolsAlfisolsMollisols
2021 Area by Soil Order (km2)
Woody wetlandsHigher541.9 (0.4)429.90.685.10.20.425.8
Shrub/ScrubClimate 12 00194 i00891,875.1 (69.5)26,932.7743.750,809.22267.62479.88642.2
Mixed forest9.6 (0.0)2.20.40.10.00.56.4
Deciduous forest35.5 (0.0)14.50.00.50.00.420.0
Herbaceous13,696.0 (10.4)3573.842.47836.3171.2281.01791.4
Evergreen forest14,484.3 (11.0)3227.7439.2471.5612.43898.85834.8
Emergent herbaceous wetlands141.8 (0.1)100.30.116.30.31.123.8
Hay/Pasture69.3 (0.1)41.00.217.40.00.310.4
Cultivated crops3582.2 (2.7)1670.90.01598.20.00.8312.3
Developed, open space1731.3 (1.3)493.714.11013.612.742.8154.4
Developed, low intensity1310.9 (1.0)444.89.5769.49.16.871.4
Developed, medium intensity1390.0 (1.1)490.24.9811.44.44.574.5
Developed, high intensity430.4 (0.3)156.90.7235.80.71.534.7
Barren landLower2840.5 (2.1)1198.00.81597.60.34.739.3
Totals 132,138.9 (100%)38,776.61256.665,262.23078.86723.417,041.3
Note: Entisols, Inceptisols, Aridisols, Vertisols, Alfisols, and Mollisols are mineral soils.
Figure 5. Anthropogenically degraded land proportion (%) by county for the state of Arizona (AZ) (USA) in 2021. The amount of anthropogenically degraded land was calculated as the total of degraded land from agriculture (cultivated crops and hay/pasture), from development (developed, high intensity; developed, medium intensity; developed, low intensity; developed, open space), and barren land. This figure shows the status of anthropogenic land degradation in 2021, but it is unlikely to include historical anthropogenic land degradation along with the bulk of the inherent land degradation.
Climate 12 00194 g005

3.2. Considerations for Enhancing LD and LDN Analyses

3.2.1. Importance of Including Inherent Soil Quality (SQ) for LD and LDN Analyses: State of Arizona (AZ) (USA) as a Case Study

Demonstration of the importance of including inherent SQ for LD and LDN analyses: Anthropogenically degraded land is disaggregated by soil types and various types of anthropogenic LD (barren land, developed, agriculture), and administrative units, along with these trends over time to evaluate the overall LDN. Inherently degraded land is determined by considering the inherent SQ, which varies by soil type and should be included alongside anthropogenic LD in indicator 15.3.1. Double counting should be avoided by subtracting the area of anthropogenic LD that occurred on low-SQ soils. (Metric: area, %; Scale: local, regional, national, global; Measurement frequency: annual).
Justification and example applications include land degradation evaluation and analysis based on LULC, which can be monitored using satellite-based LULC classification over time. This type of LD analysis does not take into account the fact that some types of soils have inherently low SQ. This can cause an underestimation of total LD (inherent LD + anthropogenic LD) while overestimating the potential for NBS because areas with low SQ are often not suitable for NBS. This study demonstrates these potential limitations in LD and LDN analysis using data for AZ:
-Underestimation of total LD (inherent LD + anthropogenic LD). The state of AZ has a large proportion of Entisols (29.3%) and Aridisols (49.4%) (Table 1; Figure 2), which have low inherent SQ and can be considered as degraded land areas regardless of the type of land cover. The total area of LD when anthropogenic LD is combined with low inherent SQ areas increases from the original 8.5% to 88.2% for AZ (Table 4 and Table 5).
-The potential for overestimating NBS. When considering only land cover types (herbaceous, shrub/scrub, and barren land), 82% of AZ land area is potentially available for NBS (Figure 6, Figure S3), but 97.1% of this area is composed of low-SQ soils (Entisols, Inceptisols, and Aridisols) that are likely not suitable for NBS despite their wide occurrence in AZ. Also, availability for NBS in AZ is limited by private land ownership, which is 43.2% [30].
Table 4. Anthropogenic land degradation (LD) level and the amount of possible land for nature-based solutions (NBS) organized by soil order for the state of Arizona (AZ) in the United States of America (USA) in 2021. Percent area changes from 2001 to 2021 are shown in parentheses. Reported values have been rounded; therefore, calculated percentages and sums may exhibit minor discrepancies.
Soil OrderTotal AreaAnthropogenically Degraded LandTypes of Anthropogenic Land DegradationPotential Land for Nature-Based Solutions
BarrenDevelopedAgriculture
(km2)(%)(km2)(km2)(km2)(km2)(km2)
Slightly Weathered Soils
40,056.630.34525.7 (+6.2)1198.8 (−1.7)1614.9 (+33.6)1712.1 (−6.6)32,491.4 (+0.7)
Entisols38,800.029.34495.5 (+6.1)1198.0 (−1.7)1585.6 (+34.0)1711.9 (−6.6)31,704.6 (+0.7)
Inceptisols1256.61.030.2 (+12.1)0.8 (−43.0)29.2 (+14.5)0.2 (0.0)786.9 (0.0)
Moderately Weathered Soils
92,135.369.76829.0 (+12.0)1641.7 (−3.4)3247.8 (+27.6)1939.5 (+4.7)75,920.3 (−0.3)
Aridisols65,286.149.46043.4 (+10.9)1597.6 (−3.7)2830.2 (+28.5)1615.6 (+1.8)60,243.0 (−1.1)
Vertisols3080.32.327.2 (+30.6)0.3 (−5.3)26.9 (+31.6)0.0 (−97.7)2439.0 (−0.1)
Alfisols6723.75.161.4 (+10.1)4.7 (+4.5)55.7 (+8.5)1.1 (+2351.0)2765.4 (+12.0)
Mollisols17,045.112.9697.0 (+22.0)39.3 (+9.0)335.0 (+23.9)322.7 (+21.7)10,472.8 (+1.3)
Total132,191.9100.011,354.7 (+9.6)2840.5 (−2.7)4862.6 (+29.5)3651.5 (−1.0)108,411.7 (0.0)
Note: Entisols, Inceptisols, Aridisols, Vertisols, Alfisols, and Mollisols are mineral soils. Anthropogenically degraded land was calculated as a sum of degraded land from agriculture, developed, and barren land. Developed land includes categories: developed, open space; developed, medium intensity; developed, low intensity; developed, high intensity. Agriculture includes categories: cultivated crops; hay/pasture. Potential land for nature-based solutions (NBS) is limited to the land cover classes of shrub/scrub, barren land, and herbaceous to provide potential areas for NBS without changing current land uses. Change in the area was calculated using the following equation: ((2021 Area–2001 Area)/2001 Area) × 100%.
Table 5. Land use/land cover (LULC) changes between 2001 and 2021 by soil order for the state of Arizona (AZ) (USA).
Soil Quality Continuum
NLCD Land Cover Classes
(LULC),
Dynamic Soil Quality
(Soil Health Continuum)
Change in Area,
2001–2021
(%)
Inherent Soil Quality (Soil Suitability)
Lower  Climate 12 00194 i007  Higher
Degree of Weathering and Soil Development
SlightModerate
EntisolsInceptisolsAridisolsVertisolsAlfisolsMollisols
Change in Area, 2001–2021 (%)
Woody wetlandsHigher4.33.2−1.48.822.461.06.6
Shrub/ScrubClimate 12 00194 i008−0.60.8−1.5−1.60.49.5−2.1
Mixed forest−13.4−23.8−50.6−11.50.0−24.8−2.6
Deciduous forest1.718.10.0408.30.0−1.5−9.2
Herbaceous5.31.140.23.3−5.841.221.9
Evergreen forest−7.1−14.0−0.7−2.8−0.9−7.2−4.2
Emergent herbaceous wetlands6.45.5−11.114.713.52.14.9
Hay/Pasture−28.5−21.30.0−25.90.04675.0−51.1
Cultivated crops−0.2−6.20.02.2−97.71918.628.1
Developed, open space3.11.3−1.13.6−2.7−0.27.6
Developed, low intensity11.417.012.98.646.714.55.4
Developed, medium intensity88.591.187.788.4288.3136.467.0
Developed, high intensity169.6166.2189.4176.51271.7172.0138.7
Barren landLower−2.7−1.7−43.0−3.7−5.34.59.0
Note: Entisols, Inceptisols, Aridisols, Vertisols, Alfisols, and Mollisols are mineral soils. Change in the area was calculated using the following method: ((2021 Area–2001 Area)/2001 Area) × 100%.
Figure 6. Proportion of land (%) that could potentially be used for nature-based solutions (NBS) by county in the state of Arizona (AZ) (USA) in 2021. Potential land available for NBS is defined by barren land, shrub/scrub, and herbaceous land cover classes to provide potential land areas without impacting other land uses. Almost 85% of the NBS total area is composed of soils with low soil quality (SQ) (Entisols and Aridisols) that are likely not suitable for NBS despite their wide occurrence in AZ. Land availability for NBS in AZ is further limited by private land ownership.
Climate 12 00194 g006

3.2.2. Considerations for Including Soil Inorganic Carbon (SIC) and Total Soil Carbon (TSC) in Land Degradation (LD) and Land Degradation Neutrality (LDN) Analyses

In addition to SDG 15, Indicator 15.3.1: Proportion of land that is degraded over total land area, three sub-indicators are typically evaluated, including “(1) land cover trends, (2) land productivity trends, and 3) below and above-ground soil organic carbon (SOC) stock trends” [4]. The overall LD status is determined using the one-out-all-out (1OAO) methodology, where degradation in any of the three sub-indicators causes a determination of overall degraded LD status [4]. Currently, only SOC is included in the LD analysis, which can underestimate actual damages (e.g., GHG emissions) from LD. This study demonstrates this case of underestimation of damages using AZ, where the most dominant soil type (Aridisols) has more SIC than SOC (Table 1). Research on SIC shows that it is a potential source of GHG emissions [19,20] when it is disturbed, which indicates the need to use SOC, SIC, and total soil carbon (TSC = SOC + SIC) as an improved sub-indicator for LD analysis (Figure 7). This sub-indicator can also be improved by adding the monetary value of damages (e.g., SC-CO2). For example, in the state of AZ, TSC losses prior to and through 2021 caused an estimated midpoint total of 8.7 × 10¹⁰ kg of C losses ($14.7B). The highest midpoint losses of soil C were seen in Maricopa (3.8 × 10¹⁰ kg C, $6.4B), Pima (1.3 × 10¹⁰ kg C, $2.2B), and Pinal (6.6 × 10⁹ kg C, $1.1B) counties (Table S6, Figure S4). All these counties are located adjacent to the urban center of Phoenix. New development activity between 2001 and 2021 caused a total of 1.9 × 10¹⁰ kg in C losses ($3.3B). The highest losses in soil C were found in Maricopa (1.0 × 10¹⁰ kg C, $1.8B), Pima (2.3 × 10⁹ kg C, $394.5M), and Pinal (1.8 × 10⁹ kg C, $311.1M) counties (Figure 7, Table S7). These counties are all located adjacent to the urban center of Phoenix.
Figure 7. Damages from land degradation from recent land developments between 2001 and 2021 in Arizona (AZ) (USA): (a) soil organic carbon (SOC) loss (kg of C), (b) soil inorganic carbon (SIC) loss (kg of C), (c) total soil carbon (TSC) loss (kg of C), and (d) related emissions from TSC loss with midpoint “realized” social costs of soil carbon (C) (SC-CO2) based on an Environmental Protection Agency (EPA)-calculated SC-CO2 of $46 per metric ton of CO2 [23]. Note: M = million = 106, B = billion = 109, $ = United States dollar (USD).
Climate 12 00194 g007

3.2.3. Considerations for Quantifying the Damages of Land Cover Change from Developments in Land Degradation (LD) and Land Degradation Neutrality (LDN) Analyses

Another sub-indicator is “land cover trends” [4], which can be analyzed and interpreted in various ways. This sub-indicator needs to be interpreted in a specific context, for example, comparing land cover trends to the overall land cover status. Urbanization is one of the worst cases of LD because, unlike other LULC changes, it has long-term impacts that are consequential for C release and sequestration that are difficult to reverse. Changes in LULC can be evaluated on a percentage basis (Table 5) for the whole state of AZ, and can also be disaggregated by land cover and soil type as well as by using smaller administrative units (e.g., counties). The same information can be presented on an area basis which highlights the change in relation to the total area of AZ. This sub-indicator can be improved by using area-based quantifications of LULC change, which allow the estimation of actual damages from LD because the land is lost for potential future soil carbon (C) sequestration. Arizona, as an example, lost 4862.6 km2 of land area that was changed from other land covers to developments before and up through 2021 (Table S6, Figure 8). The largest area losses from development were found in Maricopa (2201.1 km2), Pima (691.0 km2), and Pinal (364.5 km2) counties (Figure 7). New developments resulted in 1108.8 km2 of land conversions between 2001 and 2021 (Table S7, Figure 8), which represents 20% of all historical developments. The area losses were highly variable, ranging from as low as 1.5 km2 (La Paz) to the largest losses in the area from development in Maricopa (607.7 km2), Pima (128.7 km2), and Pinal (107.1 km2) counties (Figure 8). All these counties with high development activity are near the urban center of Phoenix. Compensation for damages from land developments requires land potentially being available for NBS, which is limited in AZ to lands with low-SQ soils (85% of NBS lands in AZ have Entisols and Aridisols) and private land ownership (43.2%) [30].
Figure 8. Damages from land degradation from the loss of potential land for soil carbon (C) sequestration from (a) past land developments that occurred before and up through 2021, and (b) recent developments between 2001 and 2021 for Arizona (AZ) (USA).
Climate 12 00194 g008

4. Discussion

4.1. Accounting for Inherent Land Degradation and Damages from Land Degradation in United Nations (UN) Land Degradation Analysis

Land degradation is composed of inherent and anthropogenic LD (Figure 8). Inherent LD is commonly associated with low-SQ soils formed in natural environments. Anthropogenic LD is a result of human activities (e.g., development, agriculture, etc.). To account for total LD, both inherent and anthropogenic LD should be evaluated because this distinguishes LD associated with human activity from inherently degraded land. The current indicator UN SDG 15.3.1 is focused on degraded land, without differentiation between these LD types, which can mask human impact on LD. In some semi-arid and arid areas, such as AZ, low-SQ soils are predominant, which contributes to inherent LD. This research proposes including inherent SQ as part of LD analysis by disaggregating LD analysis by soil type integrated with LULC change analysis (Table 6, Figure 9). Application of these methods using data from AZ showed that actual LD increased almost tenfold when inherent SQ was accounted for in the analysis. Not accounting for inherent SQ led to overestimation of potential area for NBS, because low SQ areas are likely not suitable for NBS. The state of AZ can serve as an example of the role of low-SQ soils in LD for areas with similar environments. This study also revealed that SIC and TSC should be included when calculating the potential damages from LD (e.g., land developments, etc.) (Table 6). Typically, only SOC is included in the LD analysis, which can underestimate actual damages (e.g., GHG emissions) from LD. This study demonstrates this case of underestimation of damages using AZ, where Aridisols, as a dominant soil type, have more SIC than SOC. When disturbed, SIC can also be a GHG emissions source, which indicates the need to use SOC, SIC, and TSC as improved sub-indicators for LD analysis (Table 6). This sub-indicator can also be improved by adding the monetary value of damages (e.g., SC-CO2) (Table 6). Our study proposes to enhance the method to derive the indicator for SDG 15.3.1 from its sub-indicators by incorporating soil information, SIC, TSC, and the SC-CO2 (Table 6). These proposals could be the basis of future indicator refinements by the scientific community. With large portions of AZ expected to be developed in the future [31], research should leverage new high-resolution satellite platforms to track development on an ongoing basis to help understand development impacts and provide feedback to policymakers. It is also crucial to highlight that low-quality soils are not confined to arid environments and occur in humid climates with highly weathered soils such as Ultisols and Oxisols, so future analysis could examine how to account for low-SQ soils in relation to LD in these environments.
Figure 9. Total land degradation (LD), as newly proposed, is the total of the individual amounts of inherent (“natural”) LD and anthropogenic LD (barren, developed, and agricultural land covers), which are directly linked to inherent soil quality (SQ) and impacted by climate and climate change (adapted from Mikhailova et al. 2024 [7]). Anthropogenic LD generates costs associated with damages.
Climate 12 00194 g009
Table 6. Proposed new enhancements based on this study (indicated in red color) to the United Nations (UN) Sustainable Development Goal (SDG) Indicator 15.3.1: Proportion of land that is degraded over total land area (adapted from Sims et al. (2021) Ref. [4] and Ref. [32]).
Sub-indicatorMetricBaseline Status (t0)
Sub-Indicator
Reporting Period (t1)
Sub-Indicator
Total Quantity of
Sub-Indicator (t1)
Enhancement of
Indicator 15.3.1
Land and soil cover (results reported by land cover and soil type)AreaND or DN,P,SArea of inherently DL Total area of IDL (t1)
(IDL) (t1)Total land area
AreaND or DN,P,SArea of anthropogenically Total area of ADL (t1)
DL (ADL) (t1)Total land area
AreaND or DN,P,STotal area of Total area of DL (t1)
DL = IDL + ADL (t1)Total land area
Land productivityNPPND or DN,P,SNPP lossNPP loss
Carbon stock (results reported by land cover and soil type)SOCND or DN,P,SSOC loss/total SOC Damages
SICND or DN,P,SSIC loss/total SICDamages
TSC = SOC + SICND or DN,P,STSC loss/total TSCDamages
SC-CO2Monetary valueN,P,SSC-CO2 loss/total SC-CO2Damages
Note: DL = degraded land, ADL = anthropogenically degraded land, IDL = inherently degraded land, NPP = net primary productivity, SOC = soil organic carbon, SIC = soil inorganic carbon, TSC = total soil carbon, SC-CO2 = social costs of carbon (C) [23], ND = not degraded, D = degraded, P = positive, S = stable, N = negative, t = time.
To help understand the interplay of inherent LD (often associated with low-SQ soils), anthropogenic LD, and total LD, it is instructive to compare states with low SQ and states with high-SQ soils (Table 7). Low SQ states (e.g., New Mexico, Nevada), like the case study of AZ in this study, have high amounts of inherently degraded land and lower amounts of anthropogenically degraded land. In contrast, states with inherently high SQ (Iowa, Illinois, Indiana) have low inherent LD and high levels of anthropogenic LD, primarily due to long-term agriculture use and development. Clearly, it is most important for the UN indicator to focus on LD associated with human activity because that is the LD that can be limited and mitigated through better management and can be tracked using remote sensing. Understanding inherent LD (and separating it from anthropogenic LD) allows the evaluation of the potential for land productivity and NBS to mitigate anthropogenic LD. As our study has noted, it is important to disaggregate LD analysis into smaller administrative units (e.g., states, counties, etc.) so that changes in LD can be spatially tracked over time. It is also critical to disaggregate LD by inherent (low-SQ soils) and anthropogenic LD because, without this distinction, the inherent LD can mask changes in the critical indicator to track human-caused LD.
Table 7. Examples demonstrating the importance of disaggregating data by administrative unit (e.g., state) and types of land degradation (LD) based on 2021 data from this study for selected states in the United States of America (USA). Reported values have been rounded; therefore, calculated percentages may exhibit minor discrepancies.
State Inherently
Degraded Land
Anthropogenically
Degraded Land
Types of Anthropogenic Land DegradationPotential Land for Nature-Based Solutions
Total AreaBarrenDevelopedAgriculture
(km2)(%)(%)(%)(%)(%)(%)
Arizona132,138.971.78.62.13.72.882.0
New Mexico254,232.563.94.00.41.52.185.1
Nevada230,370.069.44.32.01.31.187.5
Iowa142,833.92.188.70.16.482.22.0
Illinois124,142.24.682.20.111.370.70.6
Indiana82,796.810.073.30.111.162.11.0
Note: Inherently degraded land was considered as areas of Entisols, Inceptisols, Ultisols, and Aridisols (when present) adjusted for land originally identified as anthropogenically degraded. Anthropogenically degraded land was calculated as a sum of degraded land from agriculture, developed, and barren land. Developed land includes categories: developed, open space; developed, medium intensity; developed, low intensity; developed, high intensity. Agriculture includes categories: cultivated crops; hay/pasture. Potential land for nature-based solutions (NBS) is limited to the land cover classes of shrub/scrub, barren land, and herbaceous to provide potential areas for NBS without changing current land uses.

4.1.1. Significance of the Results for Arizona’s Climate Change

The state of AZ lacks any completed state-led plan for climate change preparation and adaptation (https://www.georgetownclimate.org/adaptation/plans.html (accessed on 8 August 2024) [33]. Arizona is facing climate change with consequences including rising atmospheric temperatures, increasing heat waves, droughts, diminishing of the snowpack with water for the Colorado River Basin, and an increase in wildfires [34]. Zhang et al. (2012) [35] examined the impact of climate-change-related altercations in rainfall patterns for portions of Southern AZ under multiple scenarios and found large potential increases in soil erosion. Even though most of the climate scenarios were found similar to slightly less predicted rainfall, extreme weather events could increase runoff intensity, which would cause much higher levels of soil erosion which may lead to transitions from grasslands to degraded shrubland (e.g., 127% to 157% increase in erosion) [35]. This study found a continual increase in developments in AZ, which causes soil disturbance, and LD, which will likely be exacerbated by these extreme weather events. Rapid population growth in AZ’s “Sun Corridor”, a megapolitan region that encompasses multiple cities (e.g., Prescott, Phoenix, Casa Grande, Tucson, Sierra Vista, Nogales) from the Mexico border to northern AZ causes large increases in temperature (urban heat island effect) which will add to climate change temperature increases [31]. Our research also shows increases in urbanization in this area, which demonstrates reverse climate change adaptation because it exposes greater numbers of people to heat risk [36]. Our study demonstrates methods to evaluate and monitor GHG emissions associated with land development in AZ, which contributes to climate change and associated loss and damage (L&D), which may require the development of state, national, and international compensation mechanisms that may need to be coordinated with the Warsaw International Mechanism (WIM) [37,38,39,40].
Arizona’s government has made halting steps toward addressing climate change. The state has long noted its vulnerability to climate change, and how its failure to address the causes has worsened the harm [41]. Arizona’s leaders have noted that as the state’s population has grown, two sources of GHGs noted below have also increased quickly. First, because the state’s cities tend to be organized in suburban sprawl, the new population needs to drive long distances, increasing GHGs from automobile emissions [41,42]. Second, because AZ’s climate is hot, the growing population requires increasing amounts of electricity for air conditioning [41]. Much of the electric power comes from coal-powered power plants, although a higher-than-average amount comes from other sources [41].
Arizona is especially vulnerable to climate change and global warming because its climate was so hot to begin with [41]. Moreover, because AZ is arid (in 2005-2006, it went 143 days without rain), a warmer climate will have large harmful effects on the state’s water supply, increasing evaporation from reservoirs and water supplies and decreasing the snowpack [41]. In addition, global warming and lack of rain will increase pollution, because high temperatures and aridity increase levels of particulate matter [41]. Focused efforts to implement NBS in Phoenix could potentially mitigate some of the temperature-related climate change impacts [42] but are unlikely to have an overall impact on LDN status for the state of AZ.
Starting in 2005, AZ’s governor took the first steps to address climate change [41]. An advisory group was established that produced 49 policy options that ranged from changing building practices to encouraging renewable energy and clean vehicles to establishing a GHG cap and trade program [41]. In 2006, AZ’s governor at that time issued an executive order with ambitious goals but established only modest means for achieving them—for example, requiring state agencies to purchase clean vehicles [41]. The governor also created the Western Climate Initiative with four other Western states [41]. As with the other efforts, this initiative was long on aspirations but short on concrete means for achieving them [41]. None of the suggestions for reducing GHGs included reducing land disturbance.
Two decades later, environmental impacts have continued to worsen, and interest groups have clamored for action, but the state has done little. A 2023 statement by scores of nongovernmental organizations pointed out that Phoenix was now the country’s hottest city, with more than 50 dangerous heat days in 2022 and 22 days where temperatures exceeded 110 degrees [43]. The groups pleaded for action: for clean energy, transportation electrification, and requirements for building efficiency [43]. The groups also pleaded for measures to address water shortages; the state was in its 27th straight year of long-term drought [43]. The groups sought to protect consumers by reducing water allocations for agriculture, which uses 72% of the state’s water mainly for growing alfalfa for livestock [43]. The group pointed out that the harms of climate change fell disproportionately on AZ’s poor [43]. Again, the state did little to fix these problems. As before, none of the suggestions for reducing GHGs included reducing land disturbance [43].
Arizona’s environmental stalemate (where action or progress seems impossible) can be understood by recognizing AZ’s being a political swing state, which means that liberal and conservative interests are balanced. For every environmentalist’s demand, there is a conservative counter-demand to reject environmentalism. For example, in 2024, AZ conservatives offered Senate Bill 1195, which would prohibit any government measures to address climate change [44,45]. Describing such efforts as Marxist, the bill would ban funding measures to reduce motor vehicle use or reduce GHG, or even the tracking or monitoring of emissions [44]. Furthermore, the bill bans the use of public funds to create or adopt a “climate action plan” or to “limit the increase of the average global temperature” [44].
Because of AZ’s stalemate politics, little progress on climate change can be expected from the state’s governor or legislature. An alternative possibility to explore would be to use the courts. A recent article argues that countries have a legal obligation to control GHGs to protect other vulnerable nations [46]. The argument is based first on international law’s “no-harm rule”, which requires a country not to allow its pollution to harm another country [46]. In addition, the argument finds support in the “due diligence” duty that requires a country to take diligent means to protect other countries from environmental harm [46]. Testing these theories, the International Court of Justice (ICJ) is now being asked to impose liability on large countries for causing global warming that is devastating some small low-lying countries [46]. Even if the ICJ accepts this new legal theory, it will not immediately be a complete solution or a solution at all. This is because the ICJ lacks effective authority to enforce the judgment against a country [46]. Any judgment from the ICJ would provide only moral support for the low-lying countries, but not a binding judgment [46].

4.1.2. Relevance of Arizona’s Results to the United Nations (UN) Sustainable Development Goals (SDGs) and Other UN Initiatives

This study pertains to multiple UN initiatives, which include the Sustainable Development Goals (SDGs), adopted in 2015 [3], as well as other key UN initiatives (e.g., UN Convention to Combat Desertification [1,2]; UN Convention on Biological Diversity [47]; UN Kunming–-Montreal Global Biodiversity Framework [48]). Given that AZ is a state within the contiguous U.S., the UN promotes disaggregating indicators by using smaller administrative units to analyze the relationship between land use and soil in connection to the SDGs. This is because national-level analysis can overlook important regional and state-level variations, a deeper understanding of which can help direct efforts more effectively toward achieving the SDGs [6,7]. The results of this study are particularly relevant to the advancement of UN goals and initiatives for these reasons:
  • From 2001 to 2021, AZ had an overall area reduction of hay/pasture, affecting nearly all soil types (Table 5). This has likely caused a reduction in land available for agricultural uses, leading to a decline in food production throughout these regions. (Relevant to UN SDG 2: Zero Hunger);
  • Within AZ, all of the soil orders were subject to development, which includes soils critical for agricultural and food production (e.g., Alfisols, Mollisols) (Table 5). (Relevant to UN SDG 12: Responsible Consumption and Production);
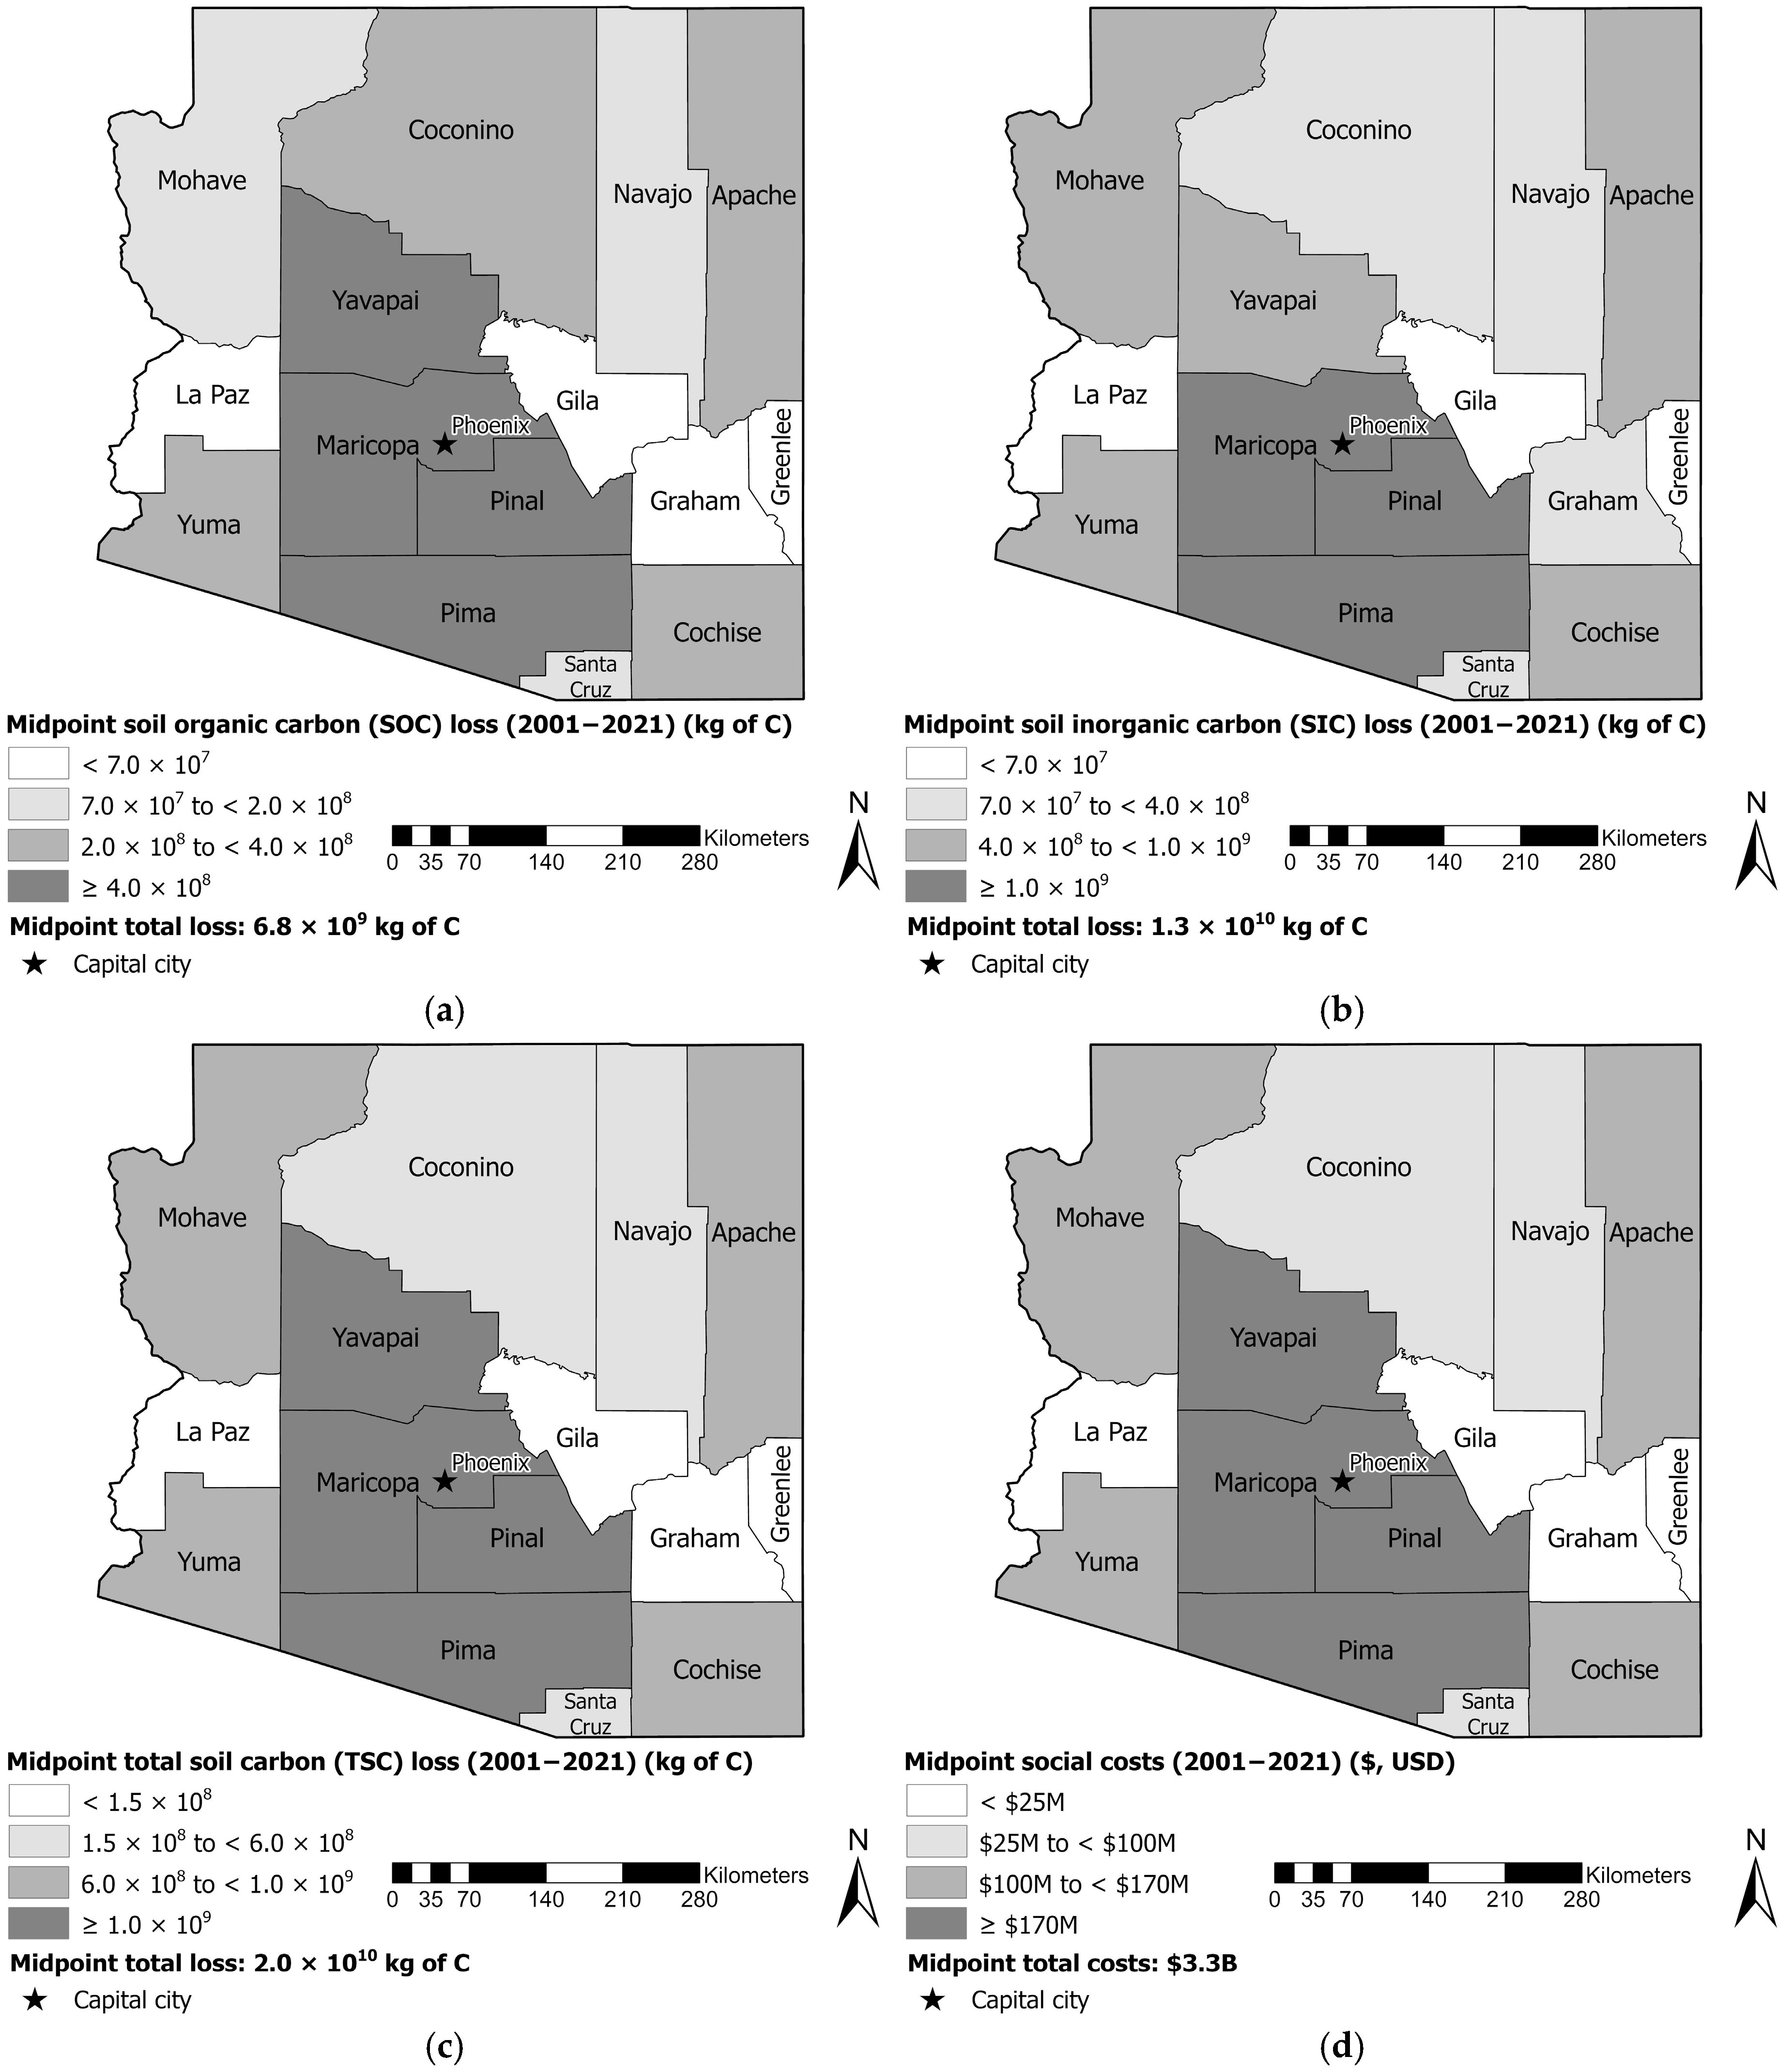
  • Land degradation in AZ resulted in harm to dynamic SQ (soil health) and had worldwide climate change impacts because of soil C loss and the resulting carbon dioxide (CO2) emissions, yet no climate change plans have been completed to support adaptation and preparation for AZ (https://www.georgetownclimate.org/adaptation/plans.html (accessed on 8 August 2024) [33]. Arizona developments can be considered to be responsible for LD damages, with 4862.6 km2 of the state of AZ developed, causing midpoint losses of 8.7 × 10¹⁰ kg of total soil carbon (TSC) with the related midpoint social cost of carbon dioxide emissions (SC-CO2) of $14.7B (where B = billion = 109, $ = U.S. dollars (USD)). There was an increase (+29.5%) in the total developed area (1108.8 km2), which represents a consumptive land conversion that likely led to the midpoint loss of 1.9 × 10¹⁰ kg of TSC and a linked midpoint of $3.3B in SC-CO2. Increases in development may indicate reverse climate adaptation because the state of AZ has seen a two-degree (F) increase in temperature, along with reduced water availability related to climate change [34]. Potential land (82.0% of the total state land area) for NBS is most likely not suitable for NBS to sequester additional soil C to compensate for LD, because most of this land has inherently low-SQ soils such as Aridisols and Entisols (Table 4). This land also may not be available because 43.2% of all land in AZ is private, and the remaining is public. It is important to highlight that monetary damage estimates in this study are derived from fixed (non-market) and theoretical SC-CO2 values, which are not directly collected as damages or fines from the responsible parties. (Addressing UN SDG 13: Climate Action);
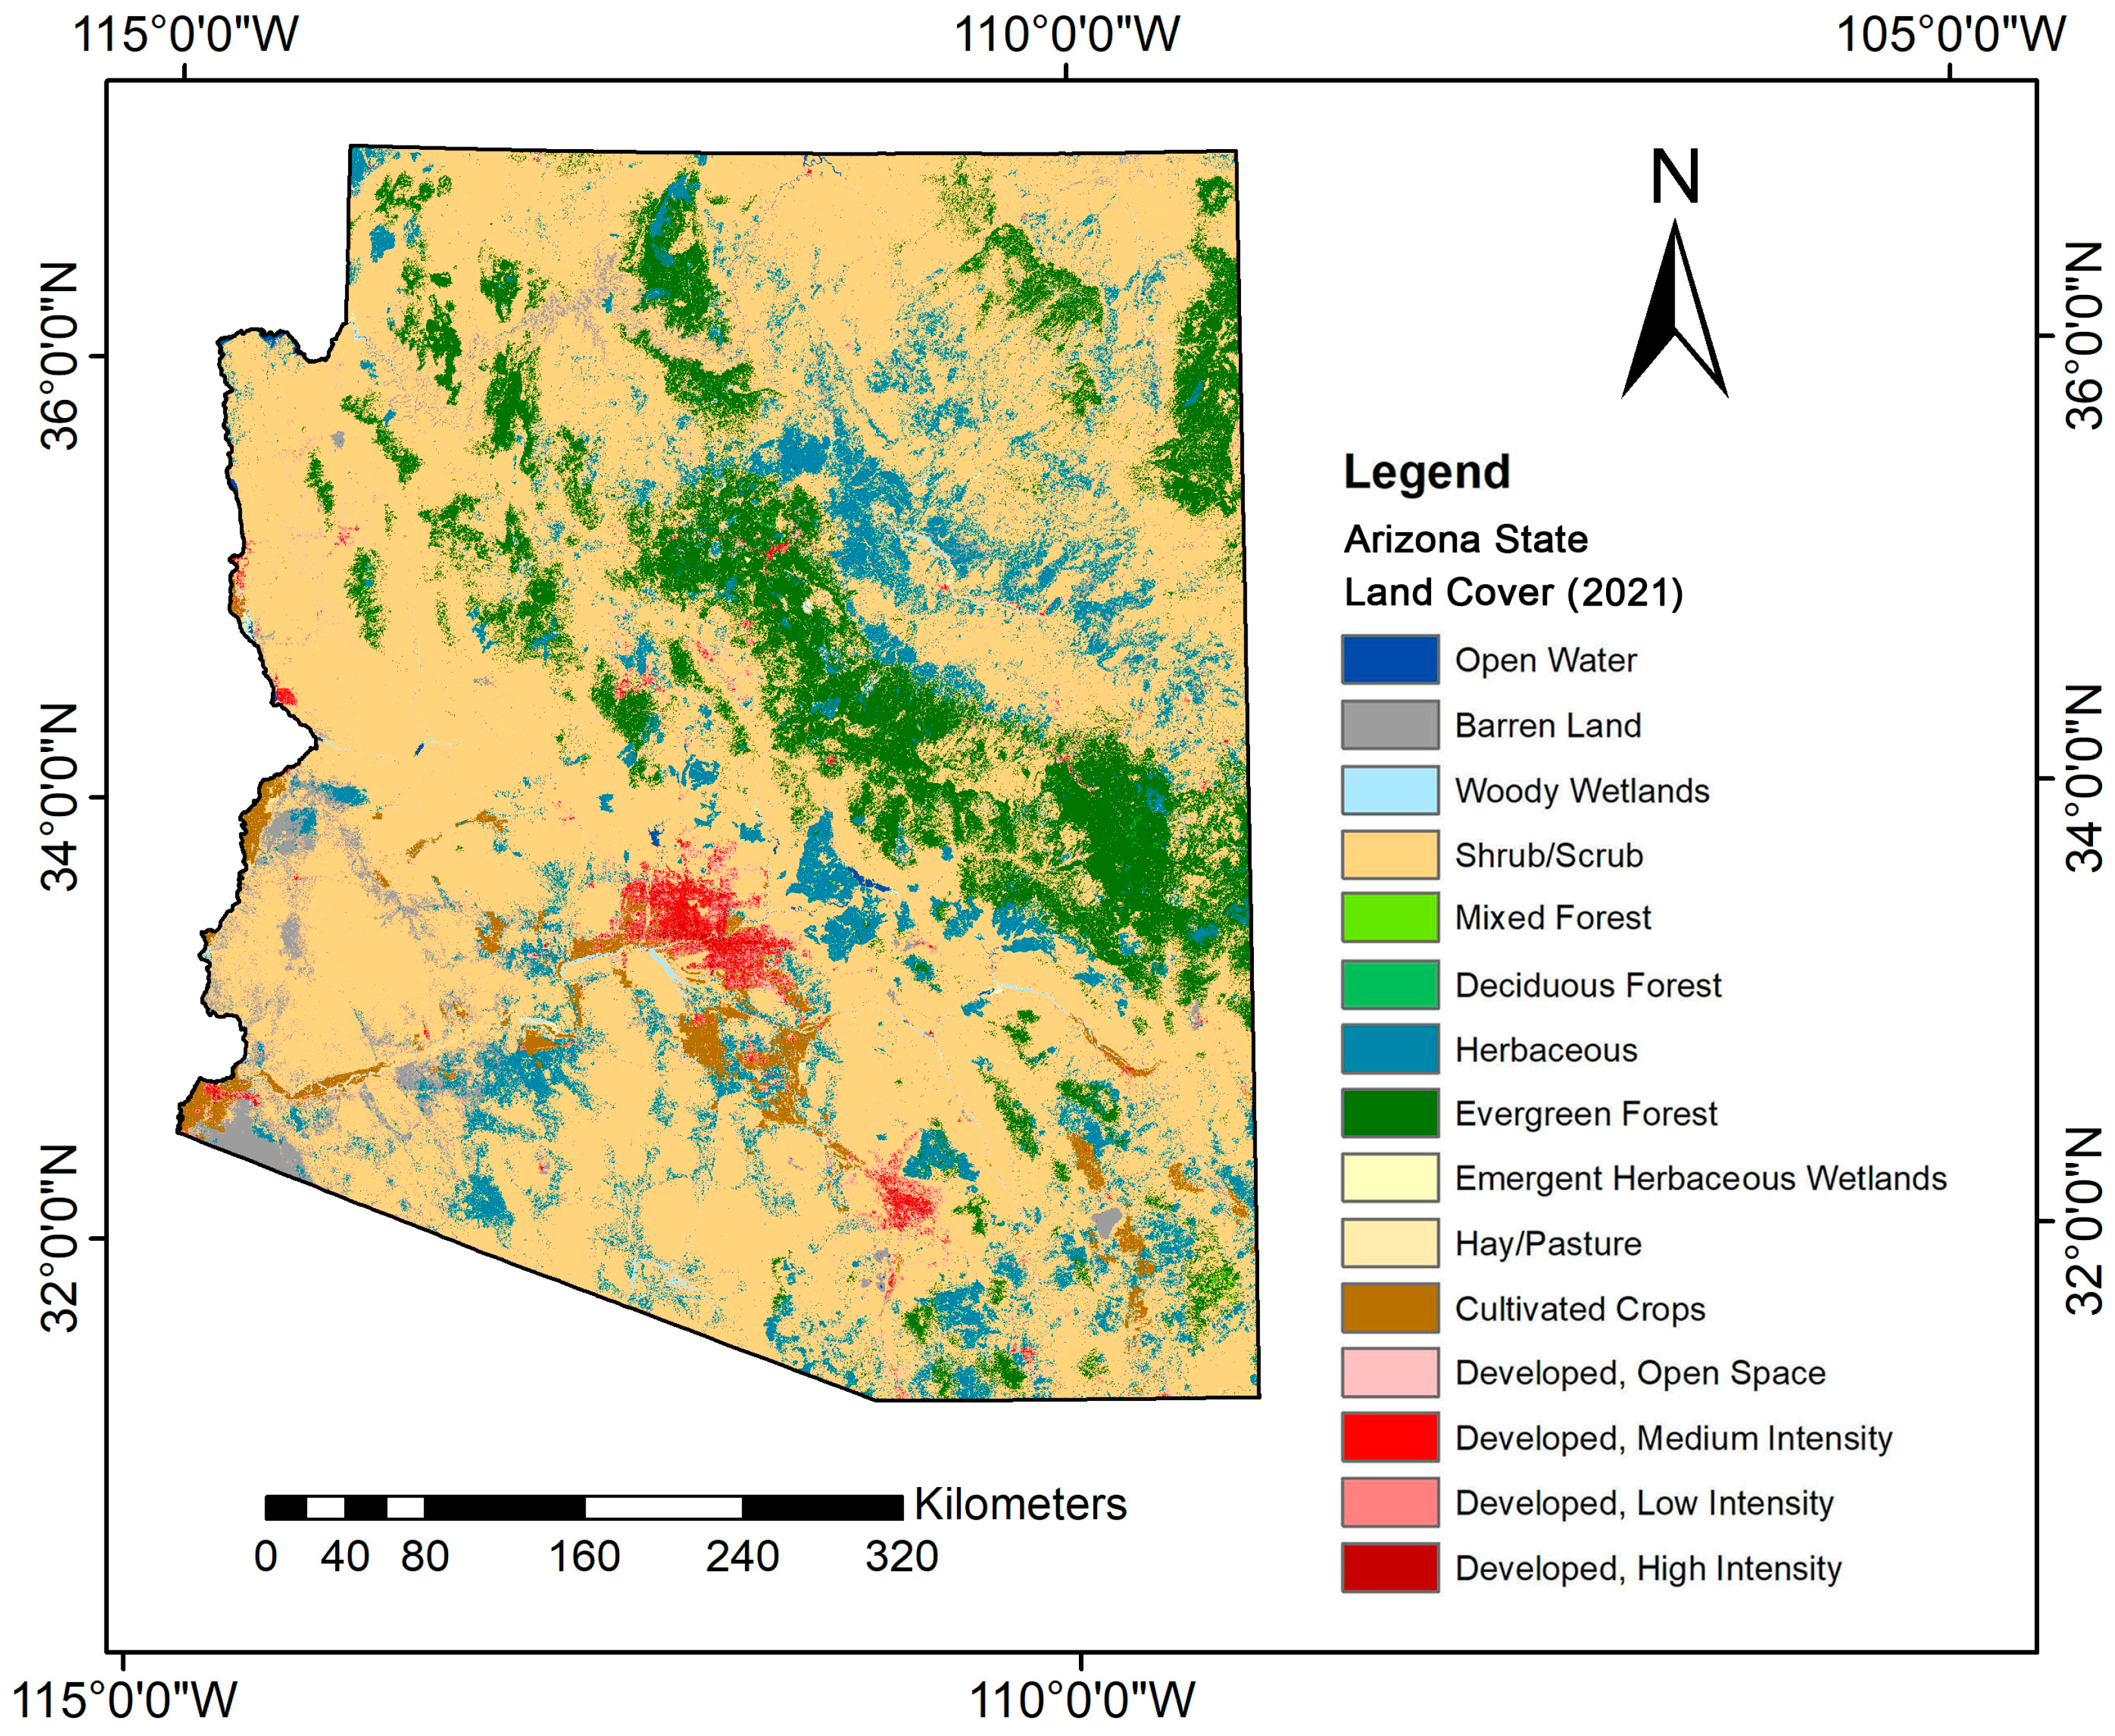
  • Anthropogenic LD impacted 8.6% of land in AZ primarily due to developments (urbanization) (42.8%) and agriculture (32.2%). The state of AZ has a large proportion of Entisols (29.3%) and Aridisols (49.4%) (Table 1; Figure 2), which have low inherent SQ and can be considered as degraded land areas regardless of the type of land cover. The overall area of LD when anthropogenic LD is combined with low-inherent-SQ areas increases from the original 8.5% to 80.2% for AZ (Table 4). All six soil orders were subject to different degrees of anthropogenic LD: Entisols (11.6%), Aridisols (9.3%), Mollisols (4.1%), Inceptisols (2.4%), Alfisols (0.9%), and Vertisols (0.9%). Developments that occurred recently (2001-2021) saw a rise in the cumulative anthropogenic LD (+9.6%), and an increase of +29.5% in the developed type of LD in the state. Although there is 82.0% potential NBS land in AZ, it is often not suitable (e.g., inherently low-quality soil types: Entisols and Aridisols) and/or not available (e.g., the state is 43.2% private land) [30] (Table 4). Development reduced the overall availability of soil resources due to land cover changes between 2001 and 2021 across all 15 counties and six soil orders in AZ (Table 3 and Table S5). There were declines in the total areas of mixed forests (−13.4%), evergreen forests (−7.1%), and hay/pasture (−28.5%) land covers needed for atmospheric pollution reduction as well as C sequestration (Table 3). (Related to the UN Convention to Combat Desertification; UN Convention on Biological Diversity; UN Kunming-Montreal Global Biodiversity Framework; and UN SDG 15: Life on Land);
  • Increasingly sustaining ecosystem resilience and integrity is a focus of global effort, which can be negatively impacted by LD. A key related agreement, the UN Kunming-Montreal Global Biodiversity Framework [48] was adopted at the UN’s fifteenth meeting of the Conference of the Parties (COP 15). An important goal of this framework (Goal A) was focused on maintaining, enhancing, and restoring ecosystem resilience, connectivity, and integrity and included a target (Target 11) to restore, maintain and enhance ecosystem functions and services (e.g., climate regulation, water, air, and soil health). Overall, the state of AZ potentially has 82% NBS land, which has not been impacted by development. However, this land is dominated by desert-like conditions and inherently low-SQ soils. Also, the AZ soil diversity is skewed towards Aridisols (49.4%) and Entisols (29.3%), which are inherently low-SQ soils. Our study shows that all soil orders in AZ experienced LD and were not LDN, with large increases in developments, which indicates a reduction in soil health status. This study’s methods and data analysis techniques could be leveraged to support Target 21 to improve the management of biodiversity by providing spatial data to better understand the impact of land cover change on biodiversity to improve resource governance. (Pertinent to UN Kunming–-Montreal Global Biodiversity Framework);
  • The Revised World Soil Charter, endorsed by member states of the Food and Agriculture Organization (FAO), emphasizes the need to limit soil degradation in order to preserve soil ecosystem services and promote the achievement of LDN. This charter outlines guidelines to ensure that “soils are managed sustainably and that degraded soils are rehabilitated or restored” [49]. This current study reveals that AZ has experienced a rise in soil degradation and LD, as shown in Table 4, with a +9.6% rise in LD from 2001 to 2021. Land and soil degradation affected all soil types during the study period, primarily driven by an increase in development activities. This study showed that the state of AZ was not LDN, as shown by the information in Table 4. (Relevant to the Revised World Soil Charter).

5. Conclusions

Climate and LD are intricately interconnected and require careful attention when crafting indicators and measures used by the UN. The current UN indicator for LD (15.3.1 Proportion of land that is degraded over the total land area) includes sub-indicators for land cover trends and trends in above-ground NPP, and SOC stock trends. This study evaluated and identified limitations of the current UN SDG 15 Indicator 15.3.1 using the state of AZ as an example. Results found that the state was not LDN between 2001 and 2021 based on LD in all 15 counties. Development across AZ caused various damages, including the removal of land for future C sequestration and GHG emissions from land disturbance. Land degradation based solely on land cover type greatly underestimates the area subject to LD in AZ because of the prevalence of low-SQ soils that are inherently degraded. Many of the soils in AZ have low SOC. However, almost half of the area contains soil with potentially high SIC levels. This is important because land disturbance associated with developments may cause the release of CO2 from SIC in addition to SOC. Therefore, this study used SOC, SIC, and TSC to account for this potential impact. While large areas of AZ appear to be available for NBS (82%) based solely on land cover, much of this area has low-SQ soils, which likely limit any potential for NBS in these areas. This study has significant implications when evaluating LD in areas dominated by low-SQ soils and/or soils with high levels of SIC.
The innovation of this study is that it proposes ways to enhance the method used to derive the indicator for UN SDG 15.3.1 from its sub-indicators by incorporating soil type information, SIC, TSC, and SC-CO2. It also separates inherent LD from anthropogenic LD. Inherent LD is not caused by human activity in contrast to anthropogenic LD, which is caused by human activity and can be identified using remote sensing analysis. For LDN analysis, it is important to focus on anthropogenic LD because it can be tracked using remote sensing platforms. Limitations of this study include potential uncertainty in the C stock estimates. Also, our study only depicts the status of human development evident in 2021 and may not capture all the anthropogenic LD that occurred before the advent of remote-sensing technologies. This study also did not attempt to quantify the impact of other GHGs because there is no reliable way to estimate these at a similar resolution to soil C-linked GHGs over the last decades. Future high-resolution remote sensing technologies will likely be able to better track and evaluate the impact of development on LD to give a more accurate and nuanced view of LD over time. This will likely include the ability to track actual emissions of GHGs such as methane and nitrous oxide and associate these releases with specific types of human activity.
Responsibility for anthropogenic LD can be assigned, and damages collected (e.g., social costs, etc.) for this intentional LD. Very often, LD has a societal cost, but no individual cost. Addressing these issues would require AZ’s government to take action. As a political swing state, it is difficult in AZ to enact substantial measures to protect the environment from GHGs and climate change. Although a sound policy would include controls on land disturbance, the prospects for progress are small.

Supplementary Materials

The following supporting information can be downloaded at: https://www.mdpi.com/article/10.3390/cli12120194/s1, Table S1: Soil diversity (pedodiversity) is expressed as taxonomic diversity at the level of soil order in the state of Arizona (AZ) (USA). Table S2: An overview of the accounting framework used by this study (adapted from Groshans et al. (2019) [10]) for the state of Arizona (AZ) (USA). Table S3: Area-normalized content (kg m−2) and monetary values ($ m−2) of soil organic carbon (SOC), soil inorganic carbon (SIC), and total soil carbon (TSC = SOC + SIC) by soil order using data developed by Guo et al. (2006) [27] for the upper 2-m of soil and an avoided social cost of carbon (SC-CO2) of $46 per metric ton of CO2, applicable for 2025 (2007 U.S. dollars with an average discount rate of 3% [23]). Table S4: Distribution of soil carbon regulating ecosystem services in the state of Arizona (AZ) (USA) by soil order in 2021. Table S5: Anthropogenic land degradation status and potential land for nature-based solutions in the state of Arizona (AZ) in the contiguous United States of America (USA) in 2021. Percent changes in area from 2001 to 2021 are shown in parentheses. Reported values have been rounded; therefore, calculated sums and percentages may exhibit minor discrepancies. This table shows the anthropogenic land degradation status in 2021 but most likely does not account for historical anthropogenic land degradation as well as most of the inherent land degradation. Table S6: Developed land and potential for realized social costs of carbon (C) due to complete loss of total soil carbon (TSC) of developed land by soil order in the state of Arizona (AZ) (USA) prior to and through 2021. Table S7: Increases in developed land and potential for realized social costs of carbon (C) due to complete loss of total soil carbon (TSC) of developed land by soil order in the state of Arizona (AZ) (USA) from 2001 to 2021. Figure S1: High-resolution aerial photos showing examples of land classes (LULC) which were used to determine anthropogenically degraded land (LD) in the state of Arizona (AZ) (USA) by assuming that degraded lands are represented by the land classes (LULC) for agriculture (hay/pasture, and cultivated crops), development (developed, open space; developed, low intensity; developed, medium intensity; developed, high intensity) and barren lands. Representative examples were located using a land cover map of the contiguous United States of America (USA) (based on data from the Multi-Resolution Land Characteristics Consortium (MRLC) with detailed descriptions of the land classes [25]). Figure S2: (a) Anthropogenically degraded land area (km2) in 2021, and (b) change in anthropogenic land degradation (2001-2021) (km2) in the state of Arizona (AZ), United States of America (USA). Figure S3: (a) Potential land area (km2) for nature-based solutions in 2021, and (b) change in potential land area for nature-based solutions (2001-2021) (km2) in the state of Arizona (AZ), United States of America (USA). Figure S4: Damages from land degradation before and up through 2021: (a) soil carbon, (C) loss with associated emissions, and (b) midpoint “realized” social costs of soil carbon (C) (SC-CO2) based on an Environmental Protection Agency (EPA)-calculated SC-CO2 of $46 per metric ton of CO2 [18] from more recent land developments in Arizona (AZ) (USA). Note: M = million = 106, B = billion = 109, USD = United States dollar.

Author Contributions

Conceptualization, E.A.M.; methodology, E.A.M., M.A.S. and H.A.Z.; formal analysis, E.A.M. and G.C.P.; writing—original draft preparation, E.A.M.; writing—review and editing, E.A.M., C.J.P., M.A.S., and G.B.S.; visualization, H.A.Z., L.L. and Z.H. All authors have read and agreed to the published version of the manuscript.

Funding

This research received no external funding.

Data Availability Statement

Data are contained within the article and Supplementary Materials.

Acknowledgments

We would like to thank the reviewers for their constructive comments and suggestions.

Conflicts of Interest

The authors declare no conflict of interest.

Glossary

AZArizona
BBillion
BSBase saturation
CO2Carbon dioxide
EPAEnvironmental Protection Agency
GHGGreenhouse gases
ICJInternational Court of Justice
LDLand degradation
LDNLand degradation neutrality
LULCLand use/land cover
MMillion
MRLCMulti-Resolution Land Characteristics Consortium
NNorth
NBSNature-based solutions
NLCDNational Land Cover Database
NOAANational Oceanic and Atmospheric Administration
NRCSNatural Resources Conservation Service
SC-CO2Social cost of carbon emissions
SDGsSustainable Development Goals
SICSoil inorganic carbon
SOCSoil organic carbon
SQSoil quality
SSURGOSoil Survey Geographic Database
STATSGOState Soil Geographic Database
TSCTotal soil carbon
UNUnited Nations
UNCCDUnited Nations Convention to Combat Desertification
USDUnited States dollar
USDAUnited States Department of Agriculture
WWest

References

  1. United Nations Convention to Combat Desertification. Available online: https://www.unccd.int/convention/overview (accessed on 14 August 2024).
  2. United Nations (UN) Convention to Combat Desertification. Decision 3/COP.12 (COP 12, Ankara, 2015). Integration of the Sustainable Development Goals and Target into the Implementation of the United Nations Convention to Combat Desertification and the Intergovernmental Working Group Report on Land Degradation Neutrality. Available online: https://www.unccd.int/sites/default/files/sessions/documents/ICCD_COP12_4/4eng.pdf (accessed on 14 August 2024).
  3. United Nations (UN). Transforming Our World: The 2030 Agenda for Sustainable Development; The Resolution Adopted by the General Assembly on 25 September 2015; United Nations: New York, NY, USA, 2015; 35p. [Google Scholar]
  4. Sims, N.C.; Newnham, G.J.; England, J.R.; Guerschman, J.; Cox, S.J.D.; Roxburgh, S.H.; Viscarra Rossel, R.A.; Fritz, S.; Wheeler, I. Good Practice Guidance. SDG Indicator 15.3.1, Proportion of Land That Is Degraded Over Total Land Area; Version 2.0; United Nations Convention to Combat Desertification: Bonn, Germany, 2021; ISBN 978-92-95118-35-5. [Google Scholar]
  5. United Nations (UN) General Assembly. Resolution 68/261. Fundamental Principles of Official Statistics. Resolution Adopted by the General Assembly on 29 January 2014. Available online: https://unstats.un.org/unsd/dnss/gp/fp-new-e.pdf (accessed on 14 August 2024).
  6. Mikhailova, E.A.; Zurqani, H.A.; Lin, L.; Hao, Z.; Post, C.J.; Schlautman, M.A.; Shepherd, G.B. Possible integration of soil information into land degradation analysis for the United Nations (UN) land degradation neutrality (LDN) concept: A case study of the contiguous United States of America (USA). Soil Systems 2024, 8, 27. [Google Scholar] [CrossRef]
  7. Mikhailova, E.A.; Zurqani, H.A.; Lin, L.; Hao, Z.; Post, C.J.; Schlautman, M.A.; Brown, C.E. Disaggregating land degradation types for United Nations (UN) land degradation neutrality (LDN) analysis using the state of Ohio (USA) as an example. Earth 2024, 5, 255–273. [Google Scholar] [CrossRef]
  8. Mikhailova, E.A.; Zurqani, H.A.; Lin, L.; Hao, Z.; Post, C.J.; Schlautman, M.A.; Post, G.C. Spatiotemporal analysis of soil quality degradation and emissions in the state of Iowa (USA). Land 2024, 13, 547. [Google Scholar] [CrossRef]
  9. Mikhailova, E.A.; Groshans, G.R.; Post, C.J.; Schlautman, M.A.; Post, G.C. Valuation of soil organic carbon stocks in the contiguous United States based on the avoided social cost of carbon emissions. Resources 2019, 8, 153. [Google Scholar] [CrossRef]
  10. Groshans, G.R.; Mikhailova, E.A.; Post, C.J.; Schlautman, M.A.; Zhang, L. Determining the value of soil inorganic carbon stocks in the contiguous United States based on the avoided social cost of carbon emissions. Resources 2019, 8, 119. [Google Scholar] [CrossRef]
  11. Mikhailova, E.A.; Groshans, G.R.; Post, C.J.; Schlautman, M.A.; Post, G.C. Valuation of total soil carbon stocks in the contiguous United States based on the avoided social cost of carbon emissions. Resources 2019, 8, 157. [Google Scholar] [CrossRef]
  12. Soil Survey Staff, Natural Resources Conservation Service, United States Department of Agriculture. n.d.a. Soil Survey Geographic (SSURGO) Database. Available online: https://www.nrcs.usda.gov/resources/data-and-reports/soil-survey-geographic-database-ssurgo (accessed on 14 August 2024).
  13. Thor West, C.; Vásquez-León, M. Misreading the Arizona landscape: Reframing analyses of environmental degradation in southeastern Arizona. Hum. Organ. 2008, 67, 373–383. [Google Scholar] [CrossRef]
  14. Jeong, A.; Dorn, R.I.; Seong, Y.B.; Yu, B.Y. Acceleration of soil erosion by different land uses in arid lands above 10Be natural background rates: Case study in the Sonoran Desert, USA. Land 2021, 10, 834. [Google Scholar] [CrossRef]
  15. Jeong, A.; Dorn, R.I. Soil erosion from urbanization processes in the Sonoran Desert, Arizona, USA. Land Degrad. Dev. 2019, 30, 226–238. [Google Scholar] [CrossRef]
  16. Balling Jr, R.C.; Klopatek, J.M.; Hildebrandt, M.L.; Moritz, C.K.; Watts, C.J. Impacts of land degradation on historical temperature records from the Sonoran Desert. Clim. Change 1998, 40, 669–681. [Google Scholar] [CrossRef]
  17. Myint, S.W.; Jain, J.; Guhathakurta, S. Patterns and rates of land use land cover change: A case study of Ambos Nogales (Arizona and Sonora), 1985-2004. J. Lat. Am. Geogr. 2010, 9, 245–274. [Google Scholar] [CrossRef]
  18. Oerter, E.; Mills, J.V.; Maurer, G.E.; Lammers, L.N.; Amundson, R. Greenhouse gas production and transport in desert soils of the southwestern United States. Global Biogeochem. Cycles 2018, 32, 1703–1717. [Google Scholar] [CrossRef]
  19. Derafshi, M.; Asgari Lajayer, B.; Hassani, A.; Dell, B. Effects of acidifiers on soil greenhouse gas emissions in calcareous soils in a semi-arid area. Sci. Rep. 2023, 13, 5113. [Google Scholar] [CrossRef] [PubMed]
  20. Zamanian, K.; Zhou, J.; Kuzyakov, Y. Soil carbonates: The unaccounted, irrecoverable carbon source. Geoderma 2021, 384, 114817. [Google Scholar] [CrossRef]
  21. Soil Survey Staff, Natural Resources Conservation Service, United States Department of Agriculture. Photos of Soil Orders. Available online: https://www.nrcs.usda.gov/resources/education-and-teaching-materials/the-twelve-orders-of-soil-taxonomy (accessed on 14 August 2024).
  22. Soil Survey Staff, Natural Resources Conservation Service, United States Department of Agriculture. U.S. General Soil Map (STATSGO2). Available online: https://sdmdataaccess.sc.egov.usda.gov (accessed on 14 August 2024).
  23. EPA—United States Environmental Protection Agency, The Social Cost of Carbon. EPA Fact Sheet. 2016. Available online: https://19january2017snapshot.epa.gov/climatechange/social-cost-carbon_.html (accessed on 14 August 2024).
  24. United Nations Committee of Experts on Global Geospatial Information Management (UN-GGIM). The SDGs Geospatial Roadmap. Prepared by the Inter-Agency and Expert Group on the Sustainable Development Goals Indicators. Statistical Commission. Fifty-Third Session, 1–4 March 2022. Item 3(a) of the Provisional Agenda Items for Discussion and Decision: Data and Indicators for the 2030 Agenda for Sustainable Development. Available online: https://unstats.un.org/unsd/statcom/53rd-session/documents/BG-3a-SDGs-Geospatial-Roadmap-E.pdf (accessed on 14 August 2024).
  25. Multi-Resolution Land Characteristics Consortium—MRLC. Available online: https://www.mrlc.gov/ (accessed on 14 August 2024).
  26. ESRI (Environmental Systems Research Institute). ArcGIS Pro 2.6. Available online: https://pro.arcgis.com/en/pro-app/2.6/get-started/whats-new-in-arcgis-pro.htm (accessed on 14 August 2024).
  27. Guo, Y.; Amundson, R.; Gong, P.; Yu, Q. Quantity and spatial variability of soil carbon in the conterminous United States. Soil Sci. Soc. Am. J. 2006, 70, 590–600. [Google Scholar] [CrossRef]
  28. Hák, T.; Janoušková, S.; Moldan, B. Sustainable Development Goals: A need for relevant indicators. Ecol. Indic. 2016, 60, 565–573. [Google Scholar] [CrossRef]
  29. United Nations (UN) General Assembly. Global Indicator Framework for the Sustainable Development Goals and Targets of the 2030 Agenda for Sustainable Development; United Nations Statistics Division: New York, NY, USA, 2017; Available online: https://unstats.un.org/sdgs/indicators/indicators-list/ (accessed on 30 August 2024).
  30. U.S. Bureau of the Census. Statistical Abstract of the United States: 1991; U.S. Bureau of the Census: Washington, DC, USA, 1991; p. 201.
  31. Georgescu, M.; Moustaoui, M.; Mahalov, A.; Dudhia, J. Summer-time climate impacts of projected megapolitan expansion in Arizona. Nat. Clim. Change 2013, 3, 37–41. [Google Scholar] [CrossRef]
  32. UN-Habitat, U.N.S.D. SDG Indicator Metadata. 2021. Available online: https://unstats.un.org/sdgs/metadata/files/Metadata-15-03-01.pdf (accessed on 14 October 2024).
  33. Georgetown Law. Georgetown Climate Center. State Adaptation Progress Tracker. Available online: https://www.georgetownclimate.org/adaptation/plans.html (accessed on 10 August 2024).
  34. EPA—United States Environmental Protection Agency. What climate change means for Arizona. EPA 430-F-16-005. August 2016. Available online: https://19january2017snapshot.epa.gov/sites/production/files/2016-09/documents/climate-change-az.pdf (accessed on 10 August 2024).
  35. Zhang, Y.; Hernandez, M.; Anson, E.; Nearing, M.A.; Wei, H.; Stone, J.J.; Heilman, P. Modeling climate change effects on runoff and soil erosion in southeastern Arizona rangelands and implications for mitigation with conservation practices. J. Soil Water Conserv. 2012, 67, 390–405. [Google Scholar] [CrossRef]
  36. Ebi, K.L.; Vanos, J.; Baldwin, J.W.; Bell, J.E.; Hondula, D.M.; Errett, N.A.; Hayes, K.; Reid, C.E.; Saha, S.; Spector, J.; et al. Extreme weather and climate change: Population health and health system implications. Annu. Rev. Public Health 2021, 42, 293–315. [Google Scholar] [CrossRef]
  37. Vanhala, L.; Hestbaek, C. Framing climate change loss and damage in UNFCCC negotiations. Glob. Environ. Polit. 2016, 16, 111–129. [Google Scholar] [CrossRef]
  38. United Nations. Paris Agreement. 2015. Available online: https://unfccc.int/sites/default/files/english_paris_agreement.pdf (accessed on 5 April 2024).
  39. UN Climate Press Release. COP27 Reaches Breakthrough Agreement on New “Loss and Damage” Fund for Vulnerable Countries. 20 November 2022. Available online: https://unfccc.int/news/cop27-reaches-breakthrough-agreement-on-new-loss-anddamage-fund-for-vulnerable-countries (accessed on 5 April 2024).
  40. Bhandari, P.; Warszawski, N.; Cogan, D.; Gerholdt, R. What is “Loss and Damage” from Climate Change? 6 Key Questions, Answered. World Resources Institute. 2022. Available online: https://www.wri.org/insights/loss-damage-climate-change (accessed on 5 April 2024).
  41. Owens, S. Climate change action in Arizona. UCLA J. Environ. Law Policy 2009, 27, 317. [Google Scholar] [CrossRef]
  42. Olgun, R.; Cheng, C.; Coseo, P. Nature-based solutions scenario planning for climate change adaptation in arid and semi-arid regions. Land 2024, 13, 1464. [Google Scholar] [CrossRef]
  43. Sierra Club and other NGOs, 2023 Environmental Priorities for the Arizona Legislature and Governor. Available online: https://www.sierraclub.org/sites/www.sierraclub.org/files/2023-01/20230102b_Environmental_Priorities_for_Arizona_in_2023.pdf (accessed on 14 October 2024).
  44. Arizona Senate Bill 1195, State of Arizona Senate, 56th Legislature, Second Regular Session. 2024. Available online: https://www.azleg.gov/legtext/56leg/2R/bills/SB1195S.pdf (accessed on 14 October 2024).
  45. Evans, H. Arizona Lawmaker Calls Climate Research ‘Anti-God’, Pushes to Ban it at State Universities, Arizona Republic, 13 March 2024. Available online: https://www.azcentral.com/story/news/local/arizona-environment/2024/03/13/arizona-lawmakers-consider-bill-that-would-ban-climate-research-plans/72898105007/ (accessed on 14 October 2024).
  46. Reese, B. State obligations to protect the climate system. Ariz. J. Environ. Law Policy 2023, 14, 1. [Google Scholar]
  47. UN Convention on Biological Diversity. Treaty Collection. 1992. Available online: https://www.cbd.int/doc/legal/cbd-en.pdf (accessed on 10 April 2024).
  48. UN Convention on Biological Diversity. Kunming-Montreal Global Biodiversity Framework. 2022. Available online: https://www.cbd.int/article/cop15-final-text-kunming-montreal-gbf-221222 (accessed on 10 April 2024).
  49. Food and Agriculture Organization (FAO). Revised World Soil Charter. Available online: https://www.fao.org/fileadmin/user_upload/GSP/docs/ITPS_Pillars/annexVII_WSC.pdf (accessed on 16 August 2024).
Disclaimer/Publisher’s Note: The statements, opinions and data contained in all publications are solely those of the individual author(s) and contributor(s) and not of MDPI and/or the editor(s). MDPI and/or the editor(s) disclaim responsibility for any injury to people or property resulting from any ideas, methods, instructions or products referred to in the content.

