1. Introduction
The first confirmed meteorological observations in Portugal were made by Diogo Nunes Ribeiro in Lisbon between 1 November 1724 and 11 January 1725. Despite the short time span of this series, it was used to analyze the unusual tropical storm of November 1724 that caused important damage on the island of Madeira and made landfall later in continental Portugal [
1]. It should be noted that many initiatives have been carried out to recover early meteorological data in Portugal, as well as in the Portuguese colony of Rio de Janeiro in Brazil. For example, Alcoforado et al. [
2] retrieved meteorological measurements from continental Portugal, Madeira Island and Rio de Janeiro (Brazil) for the period 1749–1802. Moreover, Farrona et al. [
3] recovered daily meteorological observations in Rio de Janeiro for the period 1781–1788, and Vaquero et al. [
4] retrieved more than 480,000 meteorological observations in Campo Maior for the period 1860–1939. Montero-Martín et al. [
5] recovered the earliest series known of sunshine duration in Coimbra and cloud cover records for the period 1894–1950.
Additionally, meteorological observations from past centuries were also used to reconstruct the climate of Portugal: Alcoforado et al. [
6] reconstructed the temperature and precipitation during the Maunder Minimum (AD 1675–1715), and Fragoso et al. [
7] used weather and climate information to reconstruct climate conditions in Portugal during the 18th century.
Furthermore, climate extremes have also been recovered in Portugal: Fragoso et al. [
8] used different documentary sources to study droughts in Portugal in the 18th century, and Alcoforado et al. [
9] used different documentary sources to analyze and extend the knowledge of the floods that occurred in the Douro River in Porto for the period 1727–1799.
It is interesting to note that in Spain, the other Iberian country, and in other parts of the world, the medical community was one of the pioneers in carrying out early meteorological observations, often in association with communities related to agriculture and the maritime sector (see, for example, the monograph by Anduaga Egaña [
10]). Physicians were interested in the influence of weather and climate factors on human health, and some began very early to make their own weather observations [
11]. Thus, it is not surprising that this set of early meteorological observations made in Almada were performed by medical doctors. The main aim of this work is to recover the early meteorological observations measured in Almada (Portugal) for the period 1788–1813. Moreover, quality control is carried out, and the data are analyzed and compared with modern and reanalyzed datasets. The structure of the paper is as follows:
Section 2 describes the data and the instruments used; the method used for quality control is presented in
Section 3; the main results of the analysis are presented in
Section 4; and finally, the conclusions of this work are presented in
Section 5.
2. Data
A set of documents entitled
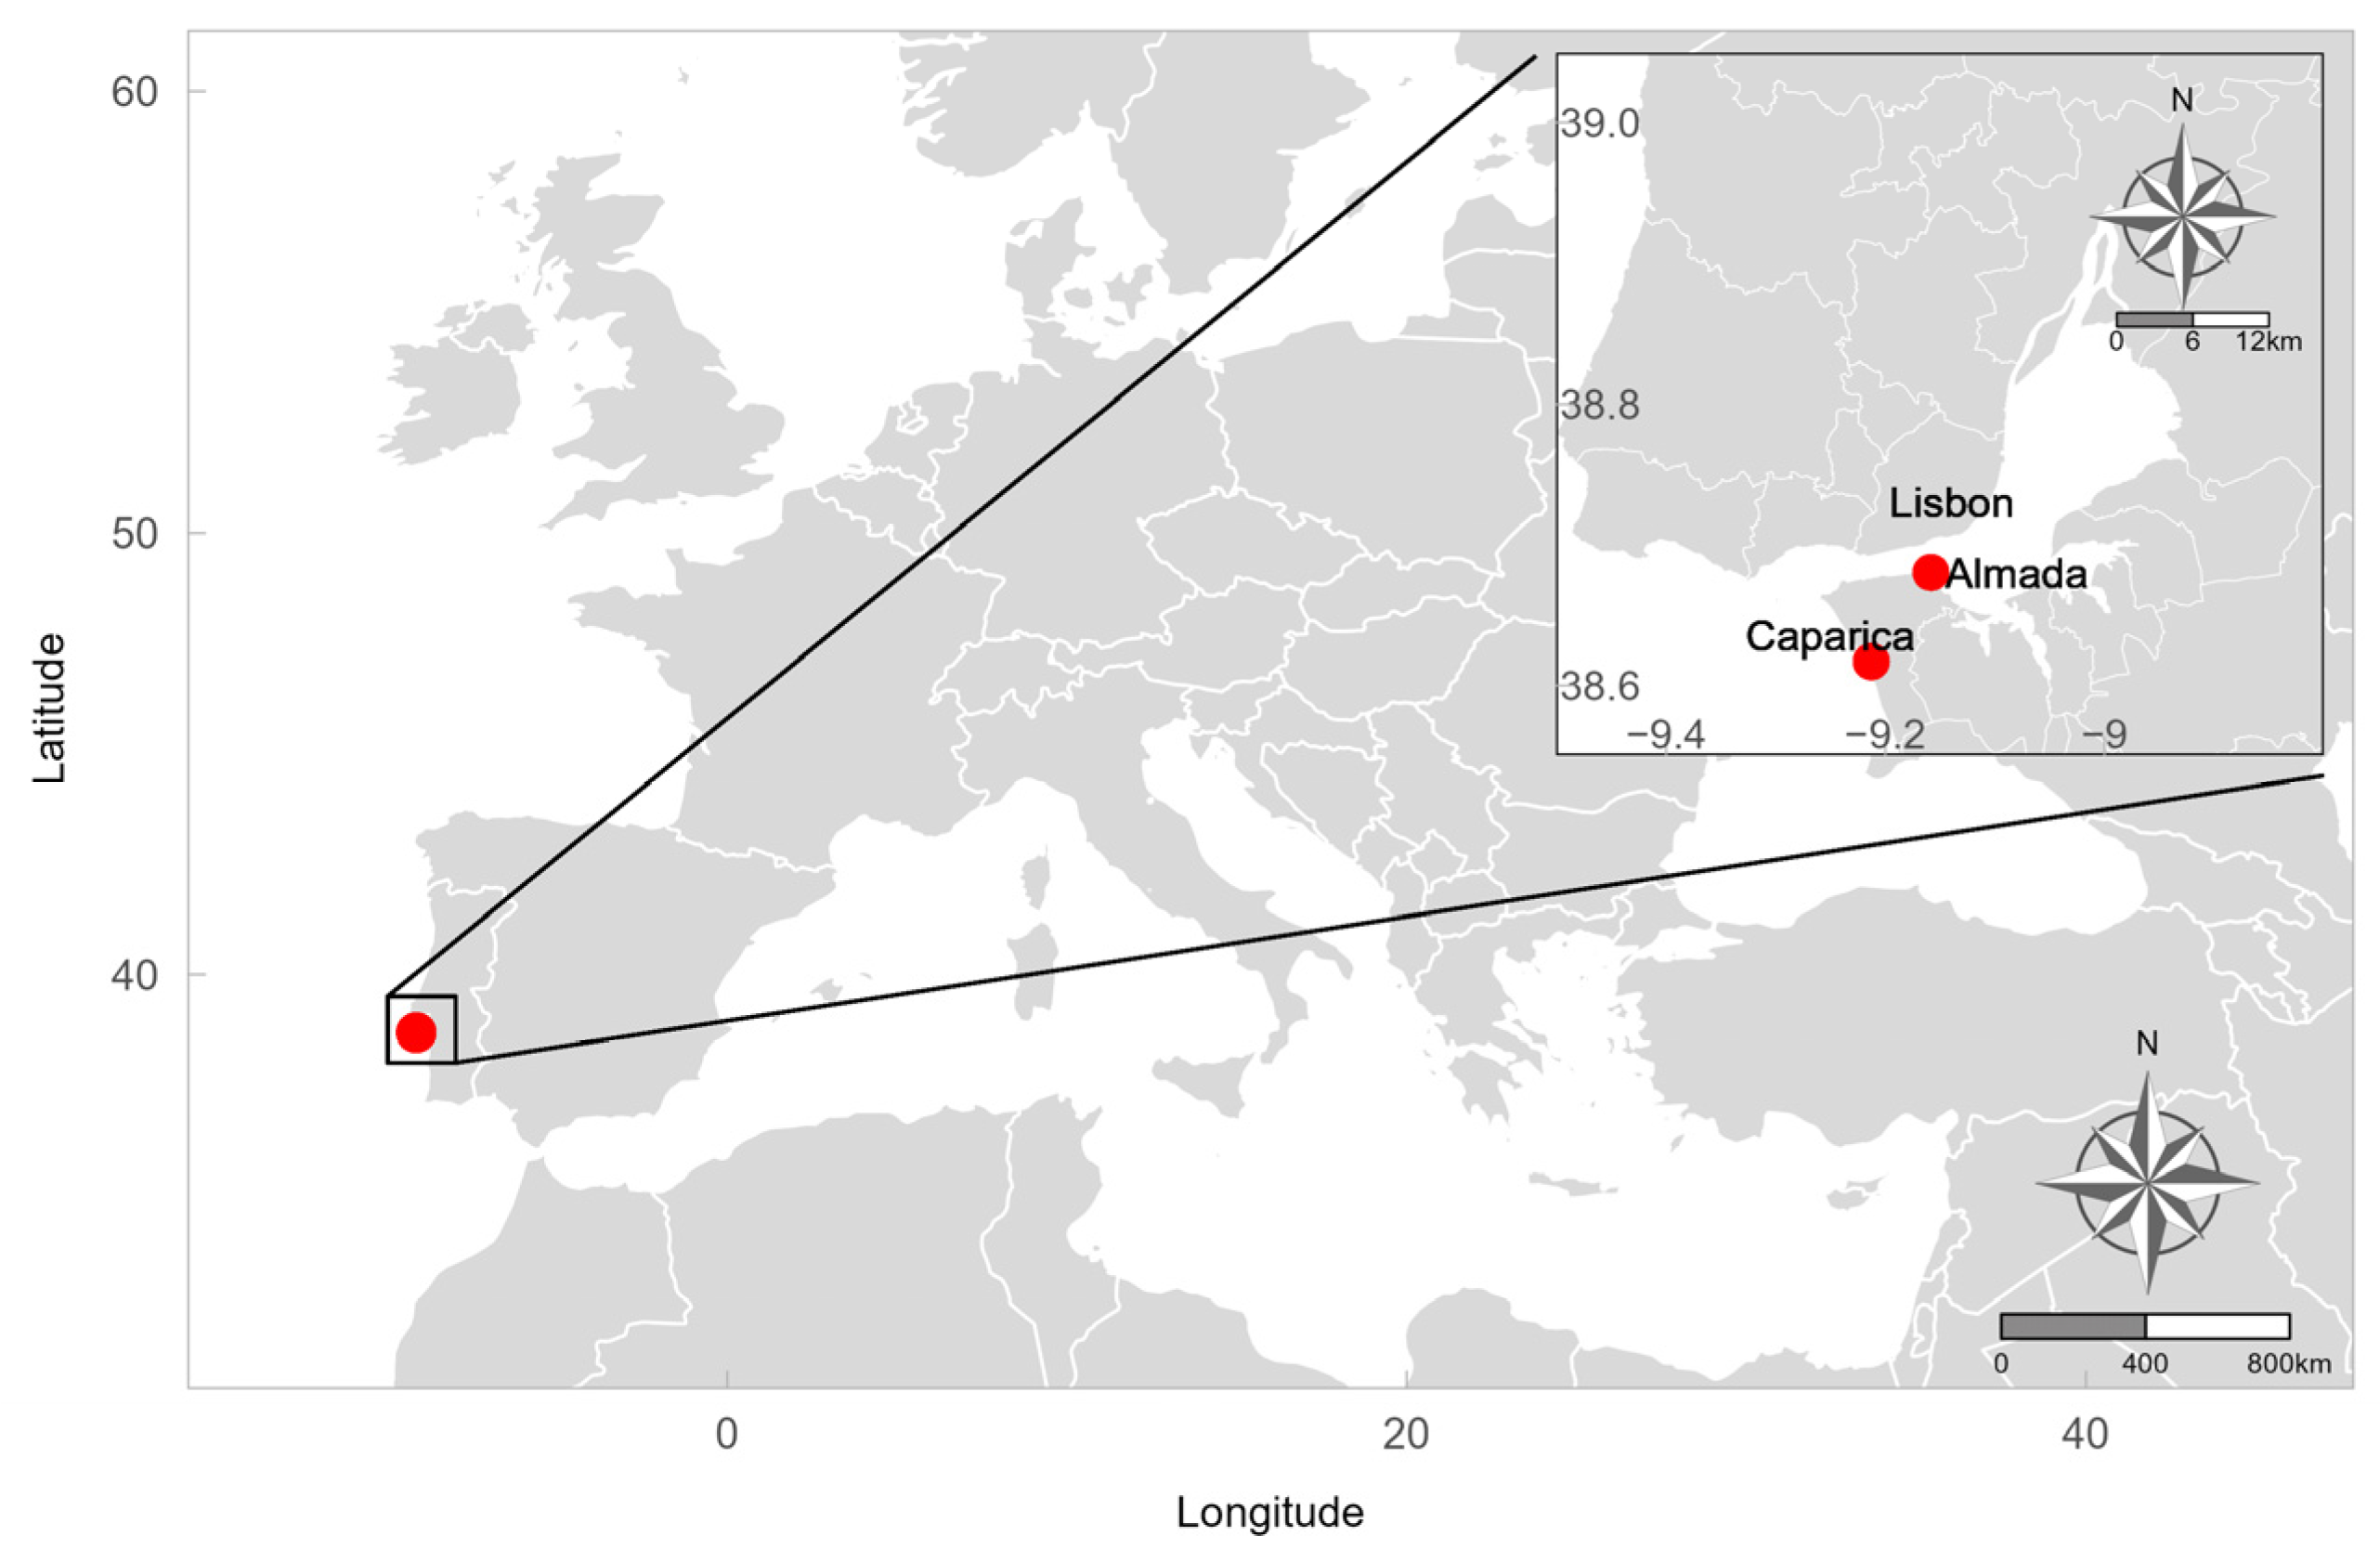
Livros de observações médicas e meteorológicas is preserved in the Arquivo Histórico Municipal de Almada for the period 1785–1813 with identification numbers from 3014 to 3029. Meteorological observations are found in these documents for the period 1788–1813. The observations were registered by the different doctors who practiced in Almada over the years. Almada is located south of Lisbon (38°40′49″ N, 9°9′30″ W, approximately 58 m.a.s.l.) across the river Tagus. The red point in
Figure 1 shows the location of Almada in the Iberian Peninsula (IP).
Figure 1 (corner) shows the situation of the Almada in the Lisbon metropolitan area, close to the mouth of the Tagus River.
In total, 5883 meteorological observations from the Almada dataset were retrieved for the period 1788–1813. The dataset is composed of daily and monthly data. In particular, 4372 observations correspond to daily observations and were registered during the period 1788–1789. The meteorological variables registered during this period were temperature in the morning and afternoon, atmospheric pressure, wind direction, and the state of the sky. There are 1511 monthly values corresponding to the years 1792, 1796, 1813 and the period 1798–1807. The meteorological variables registered in monthly data were the absolute maximum, mean and absolute minimum temperature; the absolute maximum, mean and absolute minimum inches of pressure; wind direction and the state of the sky. There is no information in the metadata about the time of observation, the units or the instruments used.
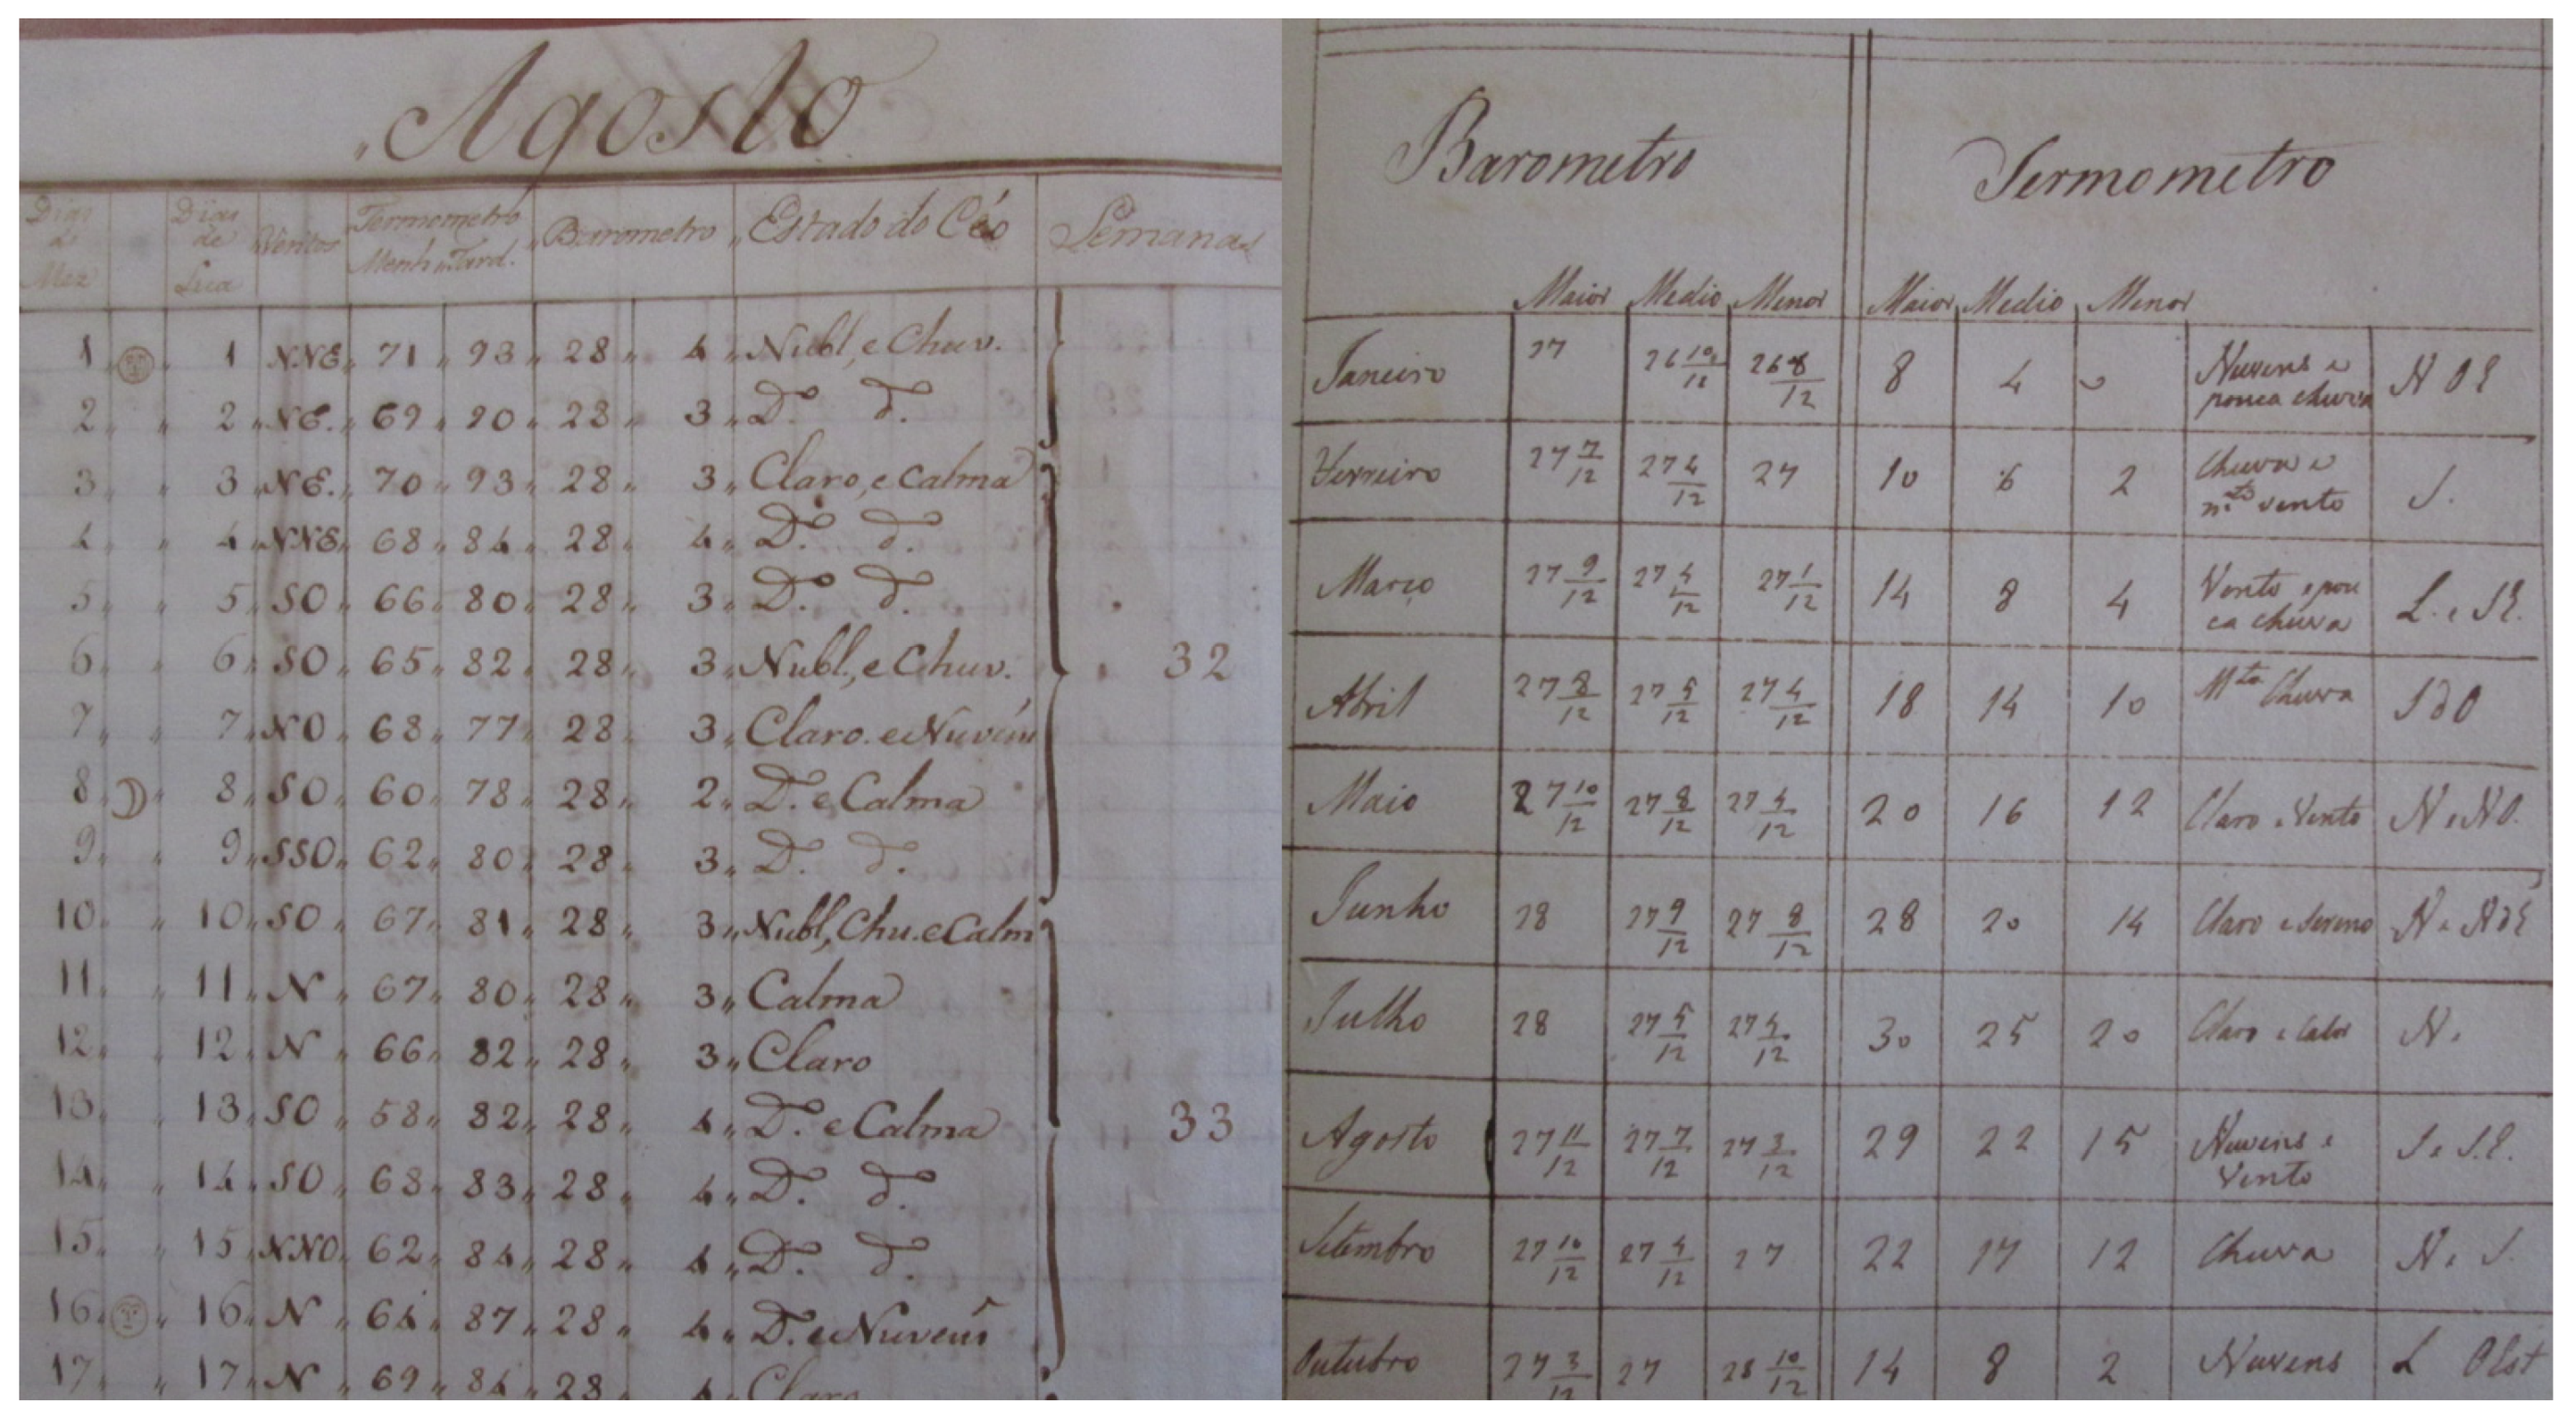
Figure 2 shows an example of the original records. The left panel shows the daily observations for August 1788. The right panel shows the monthly observations for the year 1807. As can be seen in both panels, the state of the sky is described in a few words (for example, “clear”, “calm”, “clouds”, etc.).
It can be seen that there are different periods of observations; a possible explanation could be related to the three different doctors who worked in Almada during the full 1788–1813 period. Gaspar Lopes Henriques was the doctor during the period 1785–1792, José Joaquim Alvares was the doctor in the period 1796–1807 and José António Morão in 1813.
Figure 3 shows a diagram of the observation periods of the meteorological variables (daily observations in pink and monthly observations in green) and the periods in which each doctor worked in Almada (blue).
Other datasets are used to make comparisons with the historical data recovered. One dataset covers the period 1864–2018 for pressure observations and 1855–2018 for temperature observations for Lisbon (this dataset can be found at
https://www.ipma.pt/en/index.html, accessed on 15 June 2023). Another dataset is a monthly global paleo-reanalysis (EKF400v2) generated over the 1600–2005 time period by Valler et al. [
12]. Finally, wind direction data from the meteorological station located in Caparica (38°37′1.14″ N; 9°12′46.32″ W; approximately 7 km west of Almada) are used. The station recorded data every ten minutes during the period 2002–2017.
4. Results and Discussion
In total, 2911 daily values were analyzed by the quality control procedure. Only eight pressure values were corrected, representing 0.27% of the total data analyzed (0.18% of the total dataset). Three values were errors in the digitization process, and the remaining were original errors. The percentage of missing values for wind direction data is 3.83% for Caparica and 0.14% for Almada.
Daily pressure observations for the short period 1788–1789 can be observed in
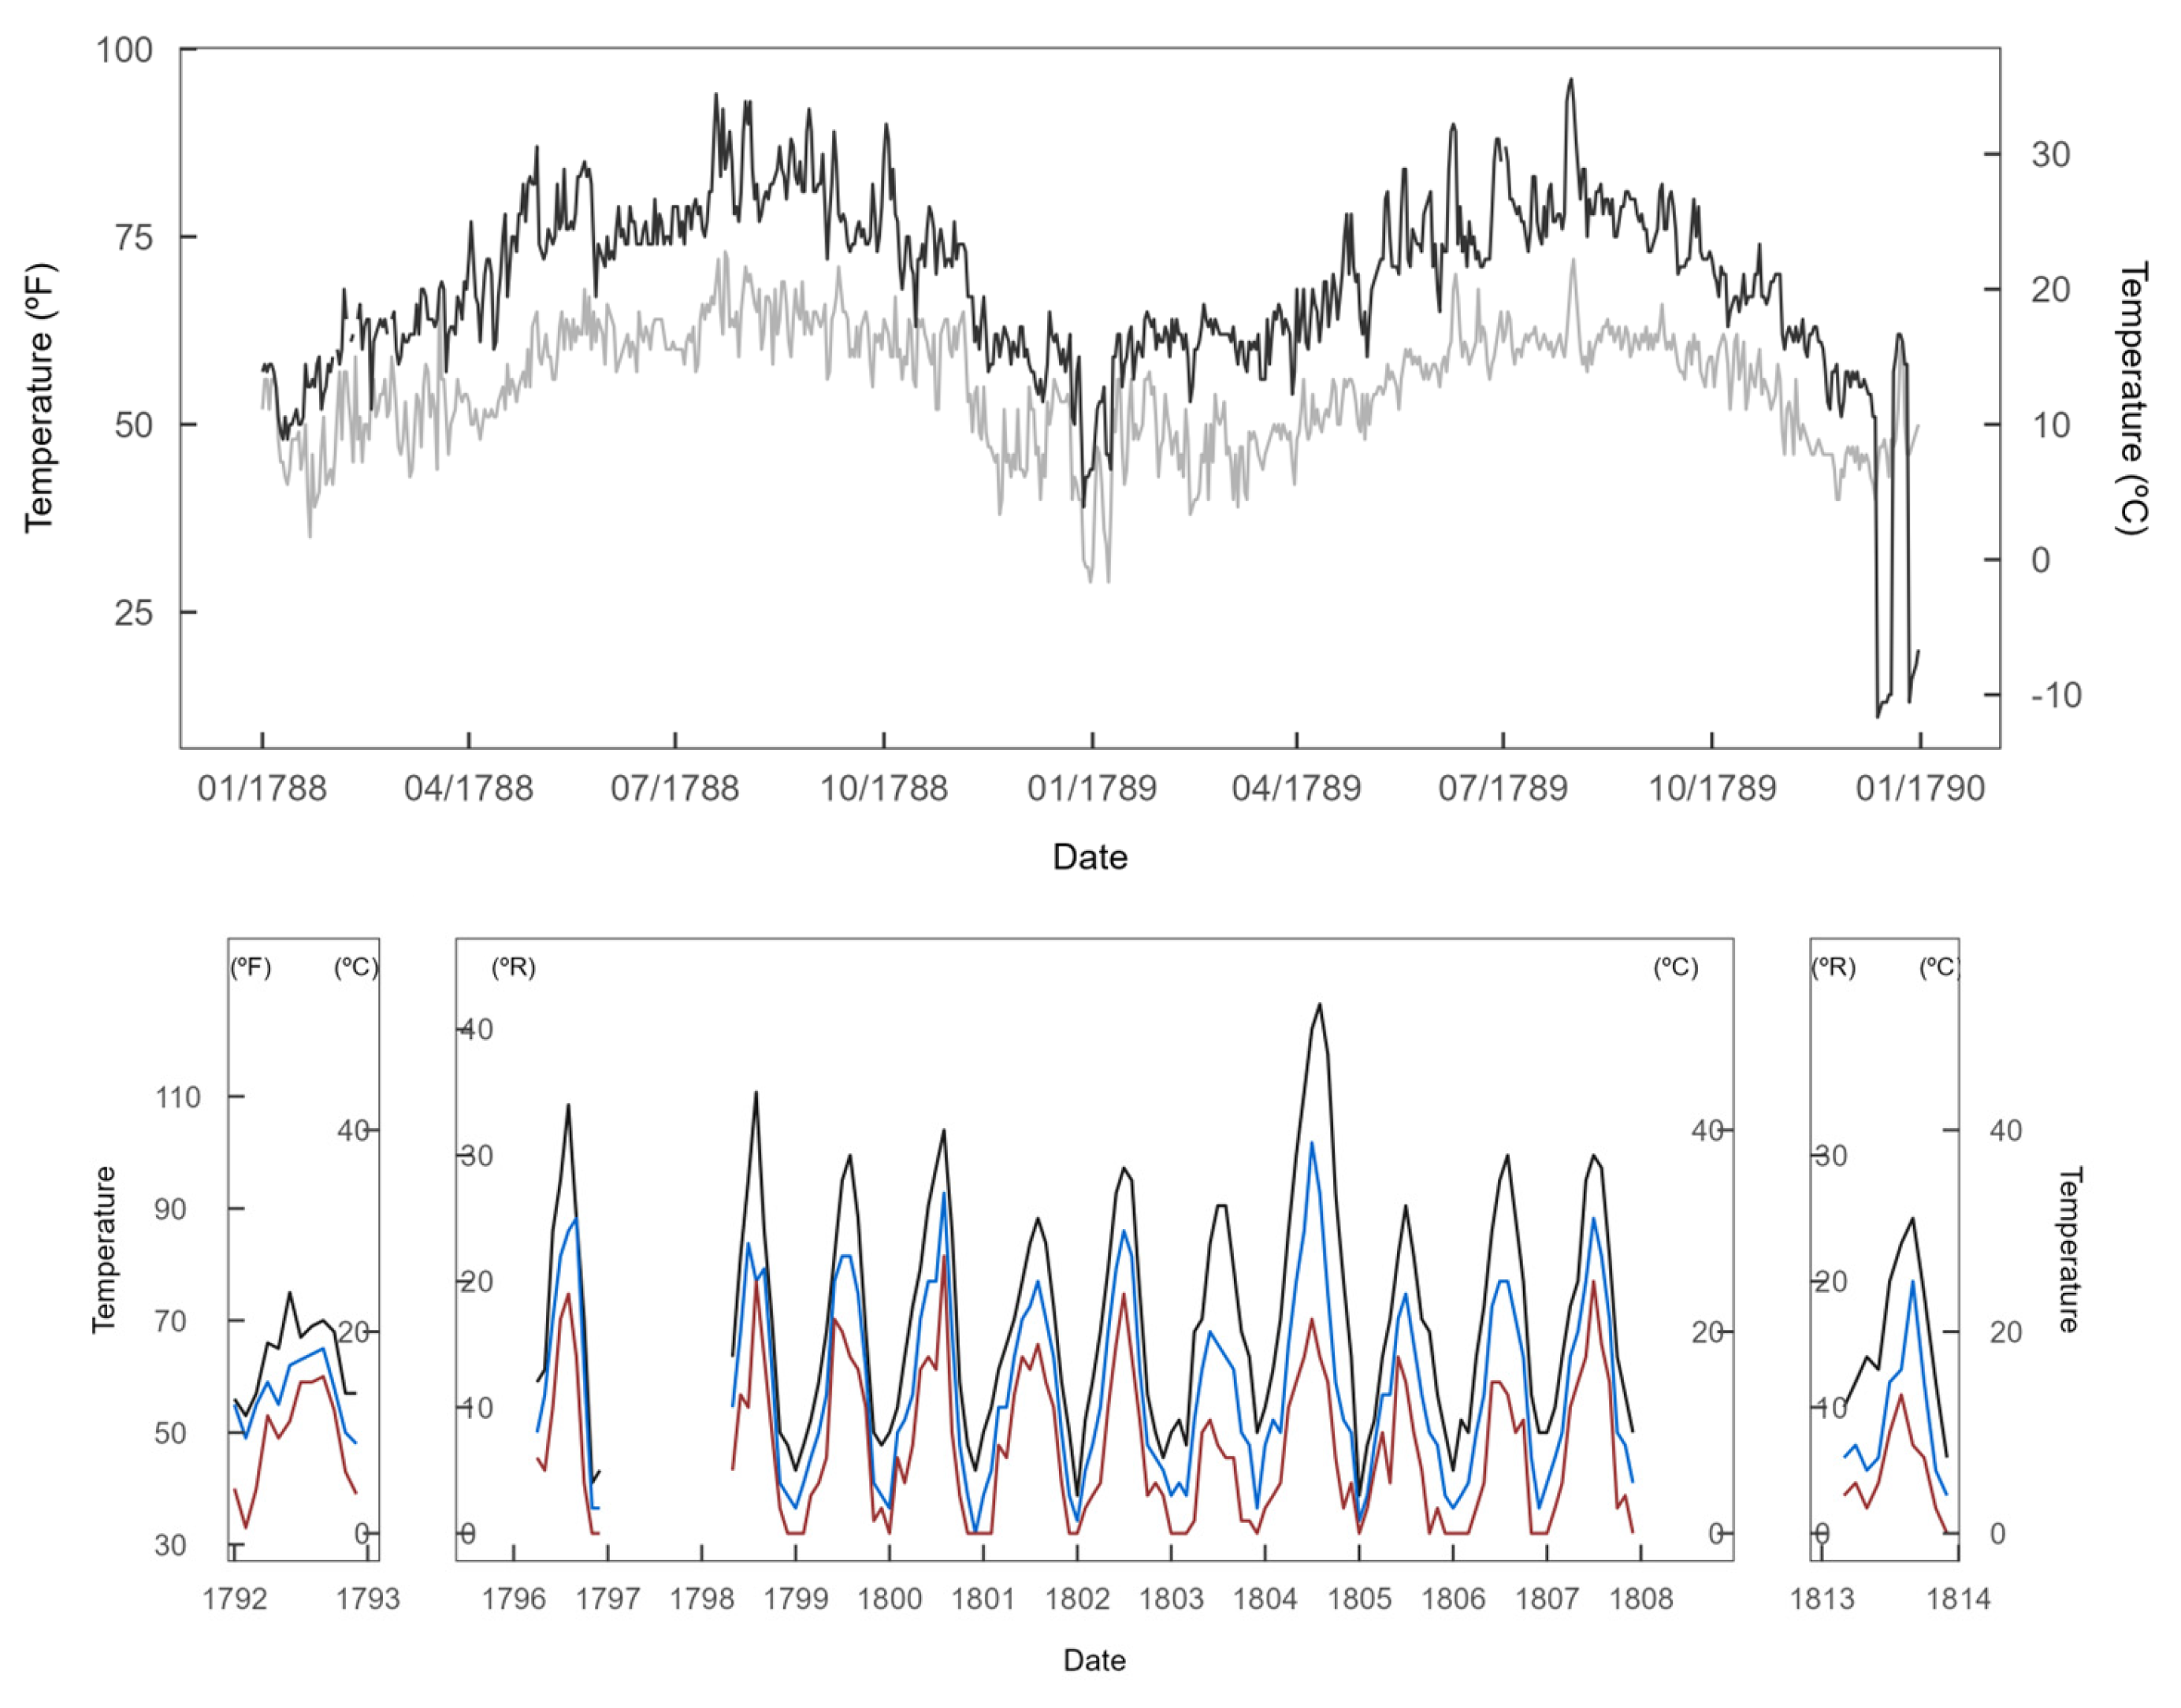
Figure 4 (top panel), while the corresponding monthly values available for the longer period (1792–1813) are shown in the lower panel. The red, blue and black lines in the lower panel correspond to the absolute minimum, mean and absolute maximum values, respectively. Unfortunately, there is no available information about the units used. However, looking at the scale, it has been assumed that the unit of pressure used was the French inch. Therefore, pressure values were converted to hectopascals (1 inch = 27.07 mm = 36.08 hPa). As can be seen in
Figure 4 (in particular, in the lower panel), monthly pressure values are very low and should be considered “dubious” values. It was not possible to make corrections to the pressure data due to the lack of information. In particular, we do not know the installation altitude of this instrument. As can be seen in the monthly data (lower panel of
Figure 4), the minimum values are higher than the mean and maximum values in some cases. Therefore, it is possible that the minimum and maximum values are actually the highest and lowest values, respectively, for each month. Additionally, the last months of the year 1792 present much lower values than the remaining series. This could be an error by the observer.
Temperature data are shown in
Figure 5: daily temperatures in the morning (light gray) and in the afternoon (dark gray) for the period 1788–1789 are shown in the upper panel; monthly observations of absolute minimum (red), mean (blue) and absolute maximum (black) temperatures for the period 1792–1813 are shown in the lower panel. As can be seen in
Figure 5, the few last days of the year 1789 present considerably lower values. Similar to the very unusual pressure values observed at the end of 1792 (and mentioned above), this could be an error by the observer. Again, there is no information about the temperature units in the metadata. However, considering the range of daily temperature values and the monthly temperature values for the year 1792, it is likely that the temperature scale for these years is Fahrenheit degrees. For the period 1796–1813, it is more likely that the temperature scale is Reaumur. In any case, additional axes in the Centigrade scale were added to
Figure 5. Similar to pressure observations, it is possible that the minimum and maximum values are actually the highest and lowest values, respectively, for each month. This could explain, in part, the very high values of maximum temperatures (lower panel of
Figure 5). Additionally, it is possible that the thermometer was placed outdoors and exposed to the sun.
The winter of 1788/1789 was one of the coldest in the last 300 years in Central Europe [
13,
14]. Papert et al. [
15] analyzed temperature and pressure data for the winter of 1788/1789 in Europe. Interestingly, the authors of this study used only three datasets from the IP in this study. The three datasets correspond to the cities of Cádiz, Madrid and Barcelona. Thus, the Almada dataset could extend knowledge about the winter of 1788/1789 in the western half of the IP. Not considering the possible outliers of late 1789, the minimum temperature values were registered in late 1788 and early 1789 (
Figure 5, upper panel). The minimum temperature value in the morning is 29 degrees (units do not appear in the metadata as mentioned in
Section 2) and was registered on 21 December 1788 and January 8th, 1789. The minimum temperature value in the afternoon was 39 degrees and was registered on December 28th, 1788. Assuming that the temperature unit for the period 1788–1789 was Fahrenheit degrees, the minimum temperature values in the morning and in the afternoon in Celsius degrees are −1.67 °C and 3.89 °C, respectively. The mean monthly temperature for January and December in Lisbon is 11.5 °C and 12.3 °C, respectively, for the period 1981–2010 (data can be downloaded at
https://www.ipma/en/index.html, accessed on 15 June 2023). The mean minimum temperature for January and December in Lisbon for the same period is 8.2 °C and 9.4 °C, respectively. The temperature difference between days 22 and 23 of December 1788 is approximately 7 °C. Low-temperature values were recorded from 23 December 1788 to 9 January 1789. Pressure values of late 1788 and early 1789 registered more than 28 inches. The maximum value recorded during the period 23 December 1788–9 January 1789, was 28.58 inches of pressure (
Figure 4, top panel). Considering again that the pressure unit for the period 1788–1789 was the French inch, the 28 and 28.58 inches of pressure in hectopascals are approximately 1010.24 hPa and 1031.17 hPa, respectively. There is no information about the height of the barometer, its position or other characteristics. Moreover, the state of the sky for most days of the period 23 December 1788–9 January 1789, was clear. Therefore, considering the range of temperature and pressure values observed for this period and the state of the sky, an anticyclone was likely the main cause of the low temperatures registered. Pappert et al. [
15] show in their Figure 7 a persistent blocking in Europe for the period 21 December 1788–5 January 1789. Thus, the analysis of Almada data would be in agreement with this previous finding [
15].
The frequency of wind direction for daily data (period 1788–1789) is shown in
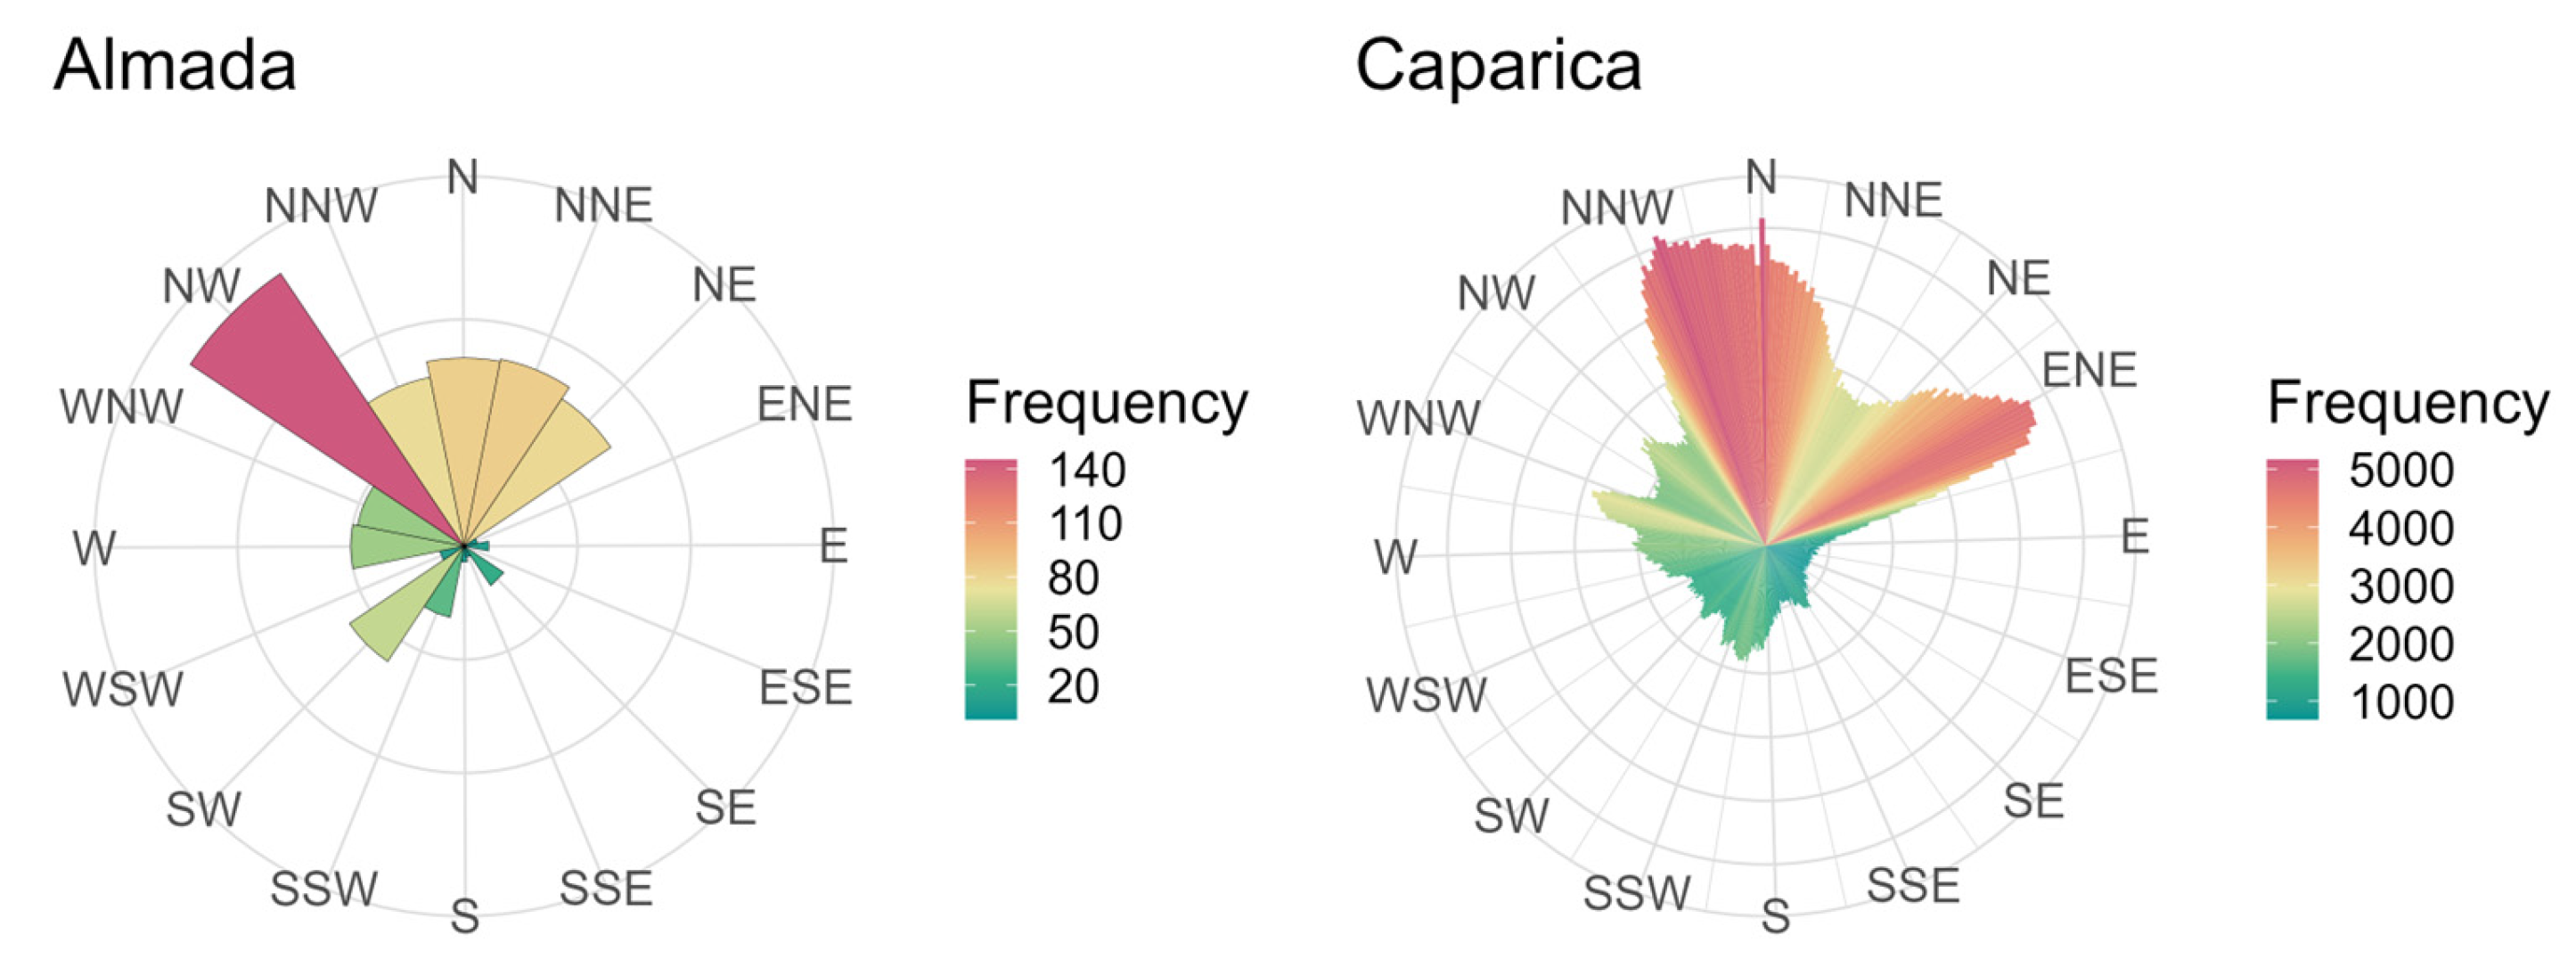
Figure 6 (upper panel). However, it must be stressed that only one wind direction was registered for daily data, while monthly data present numerous wind directions. Thus, only daily data is represented. As can be seen in
Figure 6, the prevailing wind direction was NW for the period 1788–1789. Additionally, the predominant wind directions are NNW, N, NNE and NE. SW, W and WNW wind directions are also important, but to a lesser extent. For the coldest episode of Almada (the winter of 1788/1789), there was a greater frequency of North/East winds.
A comparison between historical and modern wind direction data can be made, despite the obvious differences in instrumentation and location. The frequency of the subdaily wind direction data from a meteorological station located near Almada (Caparica) has been plotted.
Figure 6 shows the frequency of wind direction data for Almada (left panel) and Caparica (right panel). Qualitatively, the distribution of the wind directions in the historical and modern datasets is similar. The prevailing wind direction is NW for Almada and NNW for Caparica. Several reasons, such as local effects in the position of the instruments or the difference in recording times, could be the basis of the difference in the frequency of the wind direction datasets.
Figure 7 shows the monthly observations of z-score pressure (upper panel) and temperature (lower panel) for the period 1798–1808. The orange lines in both plots represent the minimum (thin line), mean (thick line) and maximum (thin line) values of the Almada dataset, respectively. The blue and green lines are the data for EKF400v2 and the climatological modern values for Lisbon, respectively. The series of EKF400v2 corresponds to the closest grid point to Lisbon. The behavior of the Almada series of mean values (thick orange line in
Figure 7) will be compared with the EKF400v2 and Lisbon series. The temporal evolution of EKF400v2 and the Lisbon series is (as expected) very similar and juxtaposed to a large extent in both panels. However, the behavior of the historical data for Almada shows significant differences with both the EKF400v2 and the modern Lisbon series. In general, we can point out important inconsistencies in the monthly data for Almada. As can be seen in
Figure 7 (upper panel), when the values related to the pressure of the Almada dataset are positive (negative), the values of the Lisbon and EKF400v2 datasets are negative (positive), implying that the annual cycle for Almada is inverted for this meteorological variable. Therefore, it is possible that the pressure observations in the Almada dataset were not well measured, although the lack of metadata does not allow us to accurately assess the problem. Regarding temperature monthly values (
Figure 7, lower panel), we once again found problems in the Almada data when compared with the other series. In this case, the annual cycle is not reversed, but the amplitude of the temperature oscillations is highly variable and does not seem to reproduce natural variability. In particular, while the first part of the Almada temperature series appears to match relatively well the observed historical EKF400v2 dataset and the climatological modern values for Lisbon, after 1803 it reveals a much less robust match with EKF400v2, particularly for the years 1803 and 1804. Therefore, pressure and temperature observations from the Almada dataset must be used with caution.
5. Conclusions
In total, 5883 meteorological observations from the Almada dataset were retrieved for the period 1788–1813. The dataset is composed of both daily and monthly data. A subset of 4372 observations corresponds to daily observations and was registered during the subperiod 1788–1789. The meteorological variables registered during this shorter period were temperature in the morning and afternoon, inches of pressure, wind direction and the state of the sky. The 1511 monthly values correspond to the years 1792, 1796, 1813 and the period 1798–1807.
Meteorological observations were found in a set of documents entitled Livros de observações médicas e meteorológicas preserved in the Arquivo Histórico Municipal de Almada for the period 1785–1813. In total, 5883 meteorological observations were retrieved for the period 1788–1813. Daily values were registered for the period 1788–1789 and monthly values for the period 1792–1813. The dataset is composed of different meteorological variables: temperature, pressure, wind direction and the state of the sky. A small number of values were detected as errors in the quality control. The percentage corresponds to 0.27% of the total data analyzed and 0.18% of the total dataset.
Regarding the reliability of the recovered meteorological series, we have found many problems in the monthly series of both variables. In particular, the annual cycle of atmospheric pressure appears to be inverted and the amplitudes of the annual cycle of temperature are very unequal, although the problems with this variable appear to be less dramatic than those mentioned for atmospheric pressure. The lack of metadata prevents us from advancing in the correction of these problems. Therefore, we recommend extreme caution if monthly data is used in any study. Fortunately, the daily series does not show these problems.
Finally, taking into account that the winter of 1788/1789 was one of the coldest in the last 300 years in Central Europe, the daily data from Almada provided a better knowledge of the meteorological conditions of the winter of 1788/1789 in southwest Europe.


