Article

Climate Change Impact Assessment on Ski Tourism in Greece: Case Study of the Parnassos Ski Resort

by
Dimitra Tsilogianni
1,
Constantinos Cartalis
2 and
Kostas Philippopoulos
2,*
1
School of Science and Technology, Hellenic Open University, GR-26335 Patras, Greece
2
Department of Environmental Physics, National and Kapodistrian University of Athens, GR-15784 Athens, Greece
*
Author to whom correspondence should be addressed.
Climate 2023, 11(7), 140; https://doi.org/10.3390/cli11070140
Submission received: 19 May 2023 / Revised: 23 June 2023 / Accepted: 28 June 2023 / Published: 30 June 2023

Abstract

:
The sustainability of ski tourism is directly related to the prevailing climatic conditions. This study investigates the impact of climate change on the sector of ski tourism in Greece. For this purpose, the current situation is assessed and the changes in underlying climatic parameters (temperature, snow cover, snow depth) are examined on the basis of a selected climatic scenario (RCP 4.5) for ski tourism in Greece in general, but also for the specific case of the Parnassos ski resort (PSR). The results refer to the period 2051–2060 compared to 1971–1980 and show a clear increase in temperature and a considerable decrease in snow cover and snowfall throughout the Greek territory, as well as in the special case of PSR. The results for specific snow indicators (duration of the snow season, number of days with an amount of at least 100 and 120 kg m−2 of natural, groomed, or managed snow, and potential snowmaking hours for wet bulb temperature lower than −2 and −5 °C) from climate projections for the 1971–2099 period further highlight the risk for mountain tourism in Greece. Decreasing trends for all examined parameters are found for the RCP 4.5 and the RCP 8.5 scenarios. In light of these findings, necessary adaptation measures against climate change are proposed in order to maintain the viability of the ski tourism sector in Greece.

1. Introduction

Regardless of its small size, Greece has appreciably developed ski tourism due to the particular topographical relief of the country. Ski tourism thrives in areas with special topographical and climatic conditions, where the sustainable development of other productive activities is doubtful. Thus, ski tourism plays a crucial role in the development of mountain and remote areas, considerably contributing to their sustainable growth. Climate change (CC), which is recorded worldwide, has already had an impact in Greece, although still to a small degree. As a Mediterranean country, it is expected to be significantly affected as a climate change hot-spot [1,2] by rising temperatures above 2 °C by 2050, rising sea levels, degradation of soils, ecosystems, etc. [3,4]. According to the report on the “Environmental, Economic and Social Impacts of Climate Change in Greece” [5] and the climatic simulations for the upcoming decades, an increase in the mean air temperature is expected to be observed in Greece. This temperature increase is expected to be higher on the mainland and is predicted to be higher during the summer and autumn and lower during the winter and spring. The impacts include an increasing number and extent of forest fires, and a loss of biodiversity and species richness is also expected. Similarly, the study of diaNEOsis concludes with the same results [6,7]. The assessment of changes in climate parameters in Greece for the period 2046–2051 compared to the period 1961–1990 shows an average increase in temperature of 2.5 degrees Celsius, a decrease in rainfall by about 12% on average (but from 10 to 30% for the winter and summer months, respectively, and mainly in the southern regions), an increase in the moisture deficit (i.e., the difference in mm between rainfall and evaporation), a gradual transition to drier soils, and an increase in hot days as well as in the number of consecutive dry days.
Simultaneously with the disruption of production systems [8,9,10,11], CC has also exerted its impact on the tourism industry. Ski tourism especially depends strongly on the prevailing climatic conditions, which actually define its sustainability. As a result, the vulnerability assessment of ski tourism with respect to climate change (CC) and its impacts should be considered. The need to understand the different climate risks by region is increasing as investors and financial management authorities require the provision of data on the risk of CC and impacts, preferably at the SR level [12,13,14,15,16].
An early review of the impacts of climate change on the ski industry [17] emphasizes that climate change could pose a significant threat by leading to the closure of SRs in numerous mountain regions. Their sensitivity is found to be dependent on the climate scenarios and the elevation of the SRs. Following a literature review of CC impact studies on SRs in 27 countries [18], several outcomes emerged, namely decreased reliability of snow terrain areas, which are strongly dependent on natural snow conditions; increased demands for artificial snow; shorter and more variable ski seasons; an increase in the operational span period of ski resorts (SRs); and changes in competitiveness between regional SRs with consequences to ski tourism employment and the real estate market in these areas. The extent and time frame of these consequences depend on the CC rate, the way the public (skiers) adapt and respond to the changes, and the behavior of the SR operators and their competitors. Beniston et al. [19] provide a comprehensive review of the existing understanding of snow conditions in European mountainous regions and conclude that changes noticed in the snow depth and duration are primarily due to the transition from solid to liquid precipitation, along with an increase in the frequency and intensity of melting. Furthermore, the recent IPCC report [20] concludes that there is high confidence that snow cover will continue to decrease in almost all regions throughout the 21st century regardless of the Representative Concentration Pathway (RCP), making SRs increasingly vulnerable to CC.
There is, therefore, rising interest from different decision makers (e.g., institutional investors, manager–owners of ski areas, insurance companies, real estate agents, etc.) in information on the risk of CC and expert advice on the expected implications, both for individual ski areas as well as the ski industry as a whole. This interest is expected to increase further as the frequency of hot and snow-reduced ski seasons progressively affects the operation of ski tourism and the reputation of ski destinations, thus making climate risk reporting requirements more and more in-demand in the economic community. In any case, the information and knowledge will help the optimum adaptation of those involved with ski tourism to the upcoming CC. Over the next decades, ski tourism’s resilience to CC could be either reinforced or weakened. The financial limits of artificial snow production remain unclear. SR profits that are based on the use of artificial snow could be affected by potential rises in the price of energy due to higher taxes on the use of fossil fuels. Furthermore, a higher frequency of winters with limited snowfalls could also impair skiers’ decision making process, leading them to new tourism destinations or new tourism products [21]. In light of this concept, and taking into account multiple climate parameters and their interrelations, insights regarding the ski tourism industry are needed for the effective assessment of winter destination vulnerability.
From the above, it becomes clear that CC and its consequent impact will create new data in winter tourism. The perception of tourists and their attitude towards the new data are a key parameter that will trigger further changes. Ski tourists have significant adaptability due to their flexibility to change their vacation plan in a very short time. Therefore, an understanding of the perceptions of the specific tourist public and its behavioral approach is necessary to anticipate possible changes in the demand for skiing as a tourist product and to redistribute the preferences of tourist destinations on the regional market scale. Despite the above, only a few studies have examined this issue, a fact which demonstrates the need to further investigate this research objective [22,23].
In addition, it should be noted that when a leisure activity is considered inappropriate, there are three available options for its replacement:
  • Site replacement (change of destination);
  • Temporal replacement (the activity occurs at the same site but at different time periods);
  • Activity replacement (an activity is replaced by another activity) [23].
It is implied that the behavior of tourists who select ski tourism and their choices will affect each tourist area differently, causing, by analogy, different losses and gains in the market share of each area [23]. On a second level, there may be derivative indirect effects, since if the tourist standards change, this will affect the volume of traffic and subsequently increase energy consumption and greenhouse gas emissions by shifting them to new tourist destinations.
The aim of this study is, firstly, to present the existing SRs in Greece and then thoroughly investigate CC intensity for ski tourism through a number of essential CC parameters as simulated with the use of regional climate model simulations under two Representative Concentration Pathways (RCPs). Finally, the vulnerability of the Parnassos SR (PSR)—as a special case study—to CC impacts is examined, and adaptation measures are proposed accordingly.

2. Climate Change Impact Assessment on Ski Tourism in Greece

The specific objective of this work is to analyze the impact of CC on ski tourism in Greece. For this purpose, it is necessary to study the intensity and the shift of critical climatic parameters—such as the daily air temperature (tas), the minimum daily air temperature (tmin), the percentage of snow cover (snc), and the snow depth (snd)—the variability of which have a decisive influence on the operation of SRs. The above parameters were chosen, on the one hand, as the most representative, and on the other hand, because sufficient data are available for climate model simulations in relative high resolution. In addition, specific mountain tourism snow indicators that describe the duration of the snow period (sp), the snow water equivalent (swe100 and swe120), and potential snow-making hours (wbt-2 and wbt-5) are examined. Impact studies typically utilize regional climate model (RCM) simulations as an essential part of understanding the localized effects of global CC. In the field of CC impacts on ski tourism, the analysis methods vary considerably across several dimensions (e.g., the climate variables that are used, the spatio-temporal resolution, the geographical scope of the analysis, the inclusion of adaptation strategies) and use typical climate scenarios for providing future estimates [24].
The first methodological step refers to the mapping (with the use of the open-source Geographic Information System QGIS) of existing SRs in Greece on the basis of a literature review. Next, the selected critical climate parameters (tas, tmin, snc, snd) and their variability are analyzed in terms of their effect on the SR operation. To assess the variability of the climate parameters, the “stabilization” climate scenario RCP4.5 was selected as it refers to a radiative forcing level of 4.5 W/m2 before 2100. An ensemble of multiple regional climate model (RCM) (Appendix A) projections is used [25,26], with a resolution of approximately 12 km from the EURO-CORDEX experiment. The use of RCMs is advantageous, as they have the ability to more accurately represent the characteristics of the Earth’s surface such as orography, land and sea distribution, and land use, characteristics that can not be represented in the simulations of global climate models (GCMs).
The selected snow indicators are generated using the Crocus snowpack model, a multi-layer snowpack model embedded in the land surface model SURFEX (Surface Externalisée) forced with adjusted EURO-CORDEX ensemble climate projections [27].
The assessment of the spatiotemporal variation in the examined climatic parameters and indicators (nine variables in total) was based on the optimum possible combination of data, giving the obtained results the comparative advantage of capturing spatial differentiation in high resolution. It should be noted that the significant diversification of impacts from one region to another needs to take into account climate characteristics on the shortest possible spatial scale in order to achieve more valid estimates.

2.1. Characterization of Ski Resorts in Greece

The mapping of the SRs across Greece is presented in Figure 1 and their characteristics are listed in Table 1. The majority of SRs are located in the Central Macedonia region (6), followed by Central Greece (3), West Macedonia (3), Thessaly (3), Peloponnese (2), and Epirus (2), while East Macedonia and Thrace and Western Greece have one SR each. The analysis is based on the selection of 7 representative ski resorts, namely Vasilitsa, Velouchi, Mainalo, Parnassos, Pelion, Falakro, and 3–5 Pigadia. These SRs cover all geographic areas and are the most important winter tourism locations in Greece.

2.2. Climate Data and Indicators

Climate data are retrieved from the EURO-CORDEX database [25] following a multi-criteria search, and the following parameters are utilized:
(1)
Project (Experiment): Cordex/RCM
(2)
Parameter (Climate Parameters):
(2.1)
Mean daily air temperature (K): tas;
(2.2)
Minimum daily air temperature (K): tmin;
(2.3)
Snow area fraction—snow cover (%): snc;
(2.4)
Snow depth (m): snd.
(3)
Frequency: monthly
(4)
Experiment
(4.1)
Historical (Historical data of previous years)—1971–1980
(4.2)
RCP 4.5 (Future climate projections)—2051–2060
(4.3)
Domain: EUR-11 sector
It should be noted that all 4 climatic parameter ensembles are constructed based on multiple different simulations (Table 2). The exact ensemble GCM-RCM members are listed in Appendix A (Table A1).
For these SRs, a GIS algorithm is developed to retrieve critical data and perform a statistical analysis. For each climatic parameter and SR, the following is calculated:
  • The annual average value;
  • The average value from December to April (the usual SR operating period in Greece);
  • The average value of two time periods, namely 1971–1980 and 2051–2060, based on the annual averages;
  • The average value of two time periods, namely 1971–1980 and 2051–2060, based on the averages of the months December–April;
  • The resulting differences between the two examined time periods.
With respect to mountain tourism snow indicators, data are extracted and analyzed for RCP 4.5 and for the high-emission scenario RCP 8.5 with the aim to characterize the operating conditions of winter ski resorts [27] from 1970 up to 2099. The examined indicators include:
  • Duration of snow season, based on the start and end date of snow season (sp). The index is calculated as the longest continuous period where the snow depth is continuously above 30 cm.
  • Snow water equivalent (swe100 and swe120). The swe100 and swe120 indices calculate the number of days in a given time period where swe ≥ 100 kg m−2 or swe ≥ 120 kg m−2.
  • Potential snow-making hours (wbt-2 and wbt-5). The wbt-2 and wbt-5 indices are based on the wet bulb temperature (TWBT) calculation from temperature and relative humidity, and refer to the number of hours from November to December for which TWBT ≤ −2 °C or TWBT ≤ −5 °C.
The snow indicator analysis includes the development of a representative ensemble from a subset of 8 adjusted climate model simulations (Table 3), the trend identification, and the change point detection of the trend. For this, the Mann–Kendall (M-K) test is employed for the identification of a monotonic trend of the climate indicator time series at the 99% confidence level. The test examines the null hypothesis (H0), which states that no monotonic trend is present, versus the alternative hypothesis (Ha), where a monotonic trend exists in the time series [28,29,30]. Additionally, the non-parametric Theil–Sen estimator is utilized for a robust estimation of the linear slope that is insensitive to outliers, which is widely used in climatology in combination with the M-K test [31]. The time-series change point detection analysis is conducted using the Pettitt test [32], which identifies the most significant change in the mean of the time series and provides an estimate of the location of each change point.

3. Results

3.1. Data Analysis of the Daily Air Temperature Parameters (Tas and Tmin)

In Table 4, the average value for the climatic parameters of tas and tmin, based on their annual averages, for the time periods 1971–1980 and 2051–2060 are presented along with the corresponding differences. Similarly, in Table 5, the results are presented for December to April. An increase in both tas and tmin is found in all cases, and the relative increase for the yearly values is higher for tmin compared to tas, while the opposite is observed for the December to April period. It should also be noted that the highest differences are recorded for the northernmost Falakro SR. The mapping of the spatial distribution of the differences for tas and tmin for Greece for the period 2051–2060 compared to the 1971–1980 period from December to April are presented in Figure 2. The results highlight that the SRs are located in the regions where higher temperature differences are observed.

3.2. Data Analysis of the Snow Parameters (snc and snd)

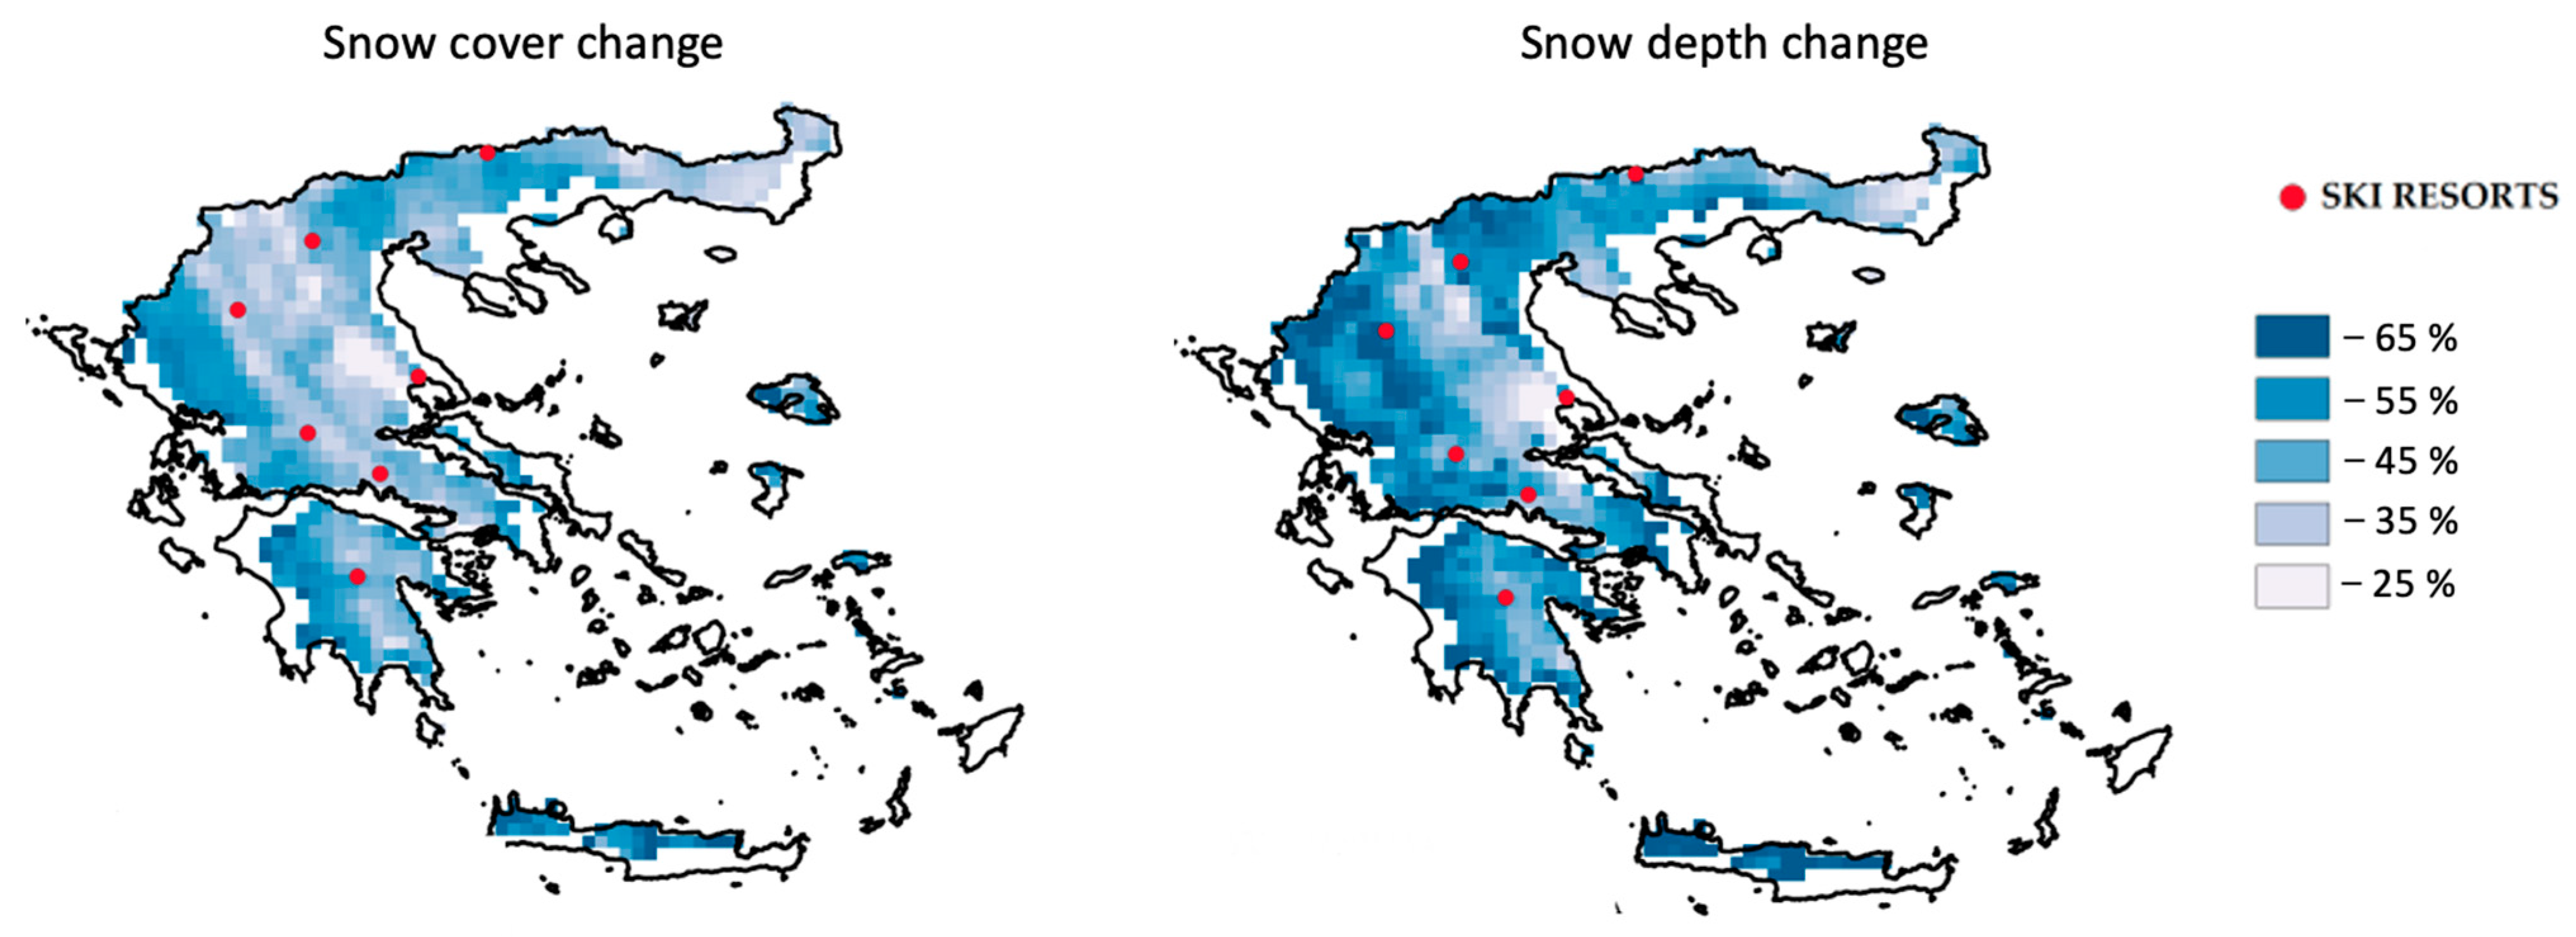
Table 6 presents the annual average values for the snc and snd climate parameters for the 1971–1980 and 2051–2060 periods, along with the percentage change from the comparison of the two examined periods. Similarly, in Table 7, the results are presented for the December to April period. Significant decreases for both parameters are projected and are more pronounced for the Menalon and the Falakro SRs. Both parameters highlight the climate risk related to the sustainability of the SRs. The spatial distribution of the snc and snd relative changes between 2051–2060 and 1971–1980 from December to April are presented in Figure 3.

3.3. Data Analysis of the Snow Indicators (sd, swe100, swe120, wbt-2, and wbt-5)

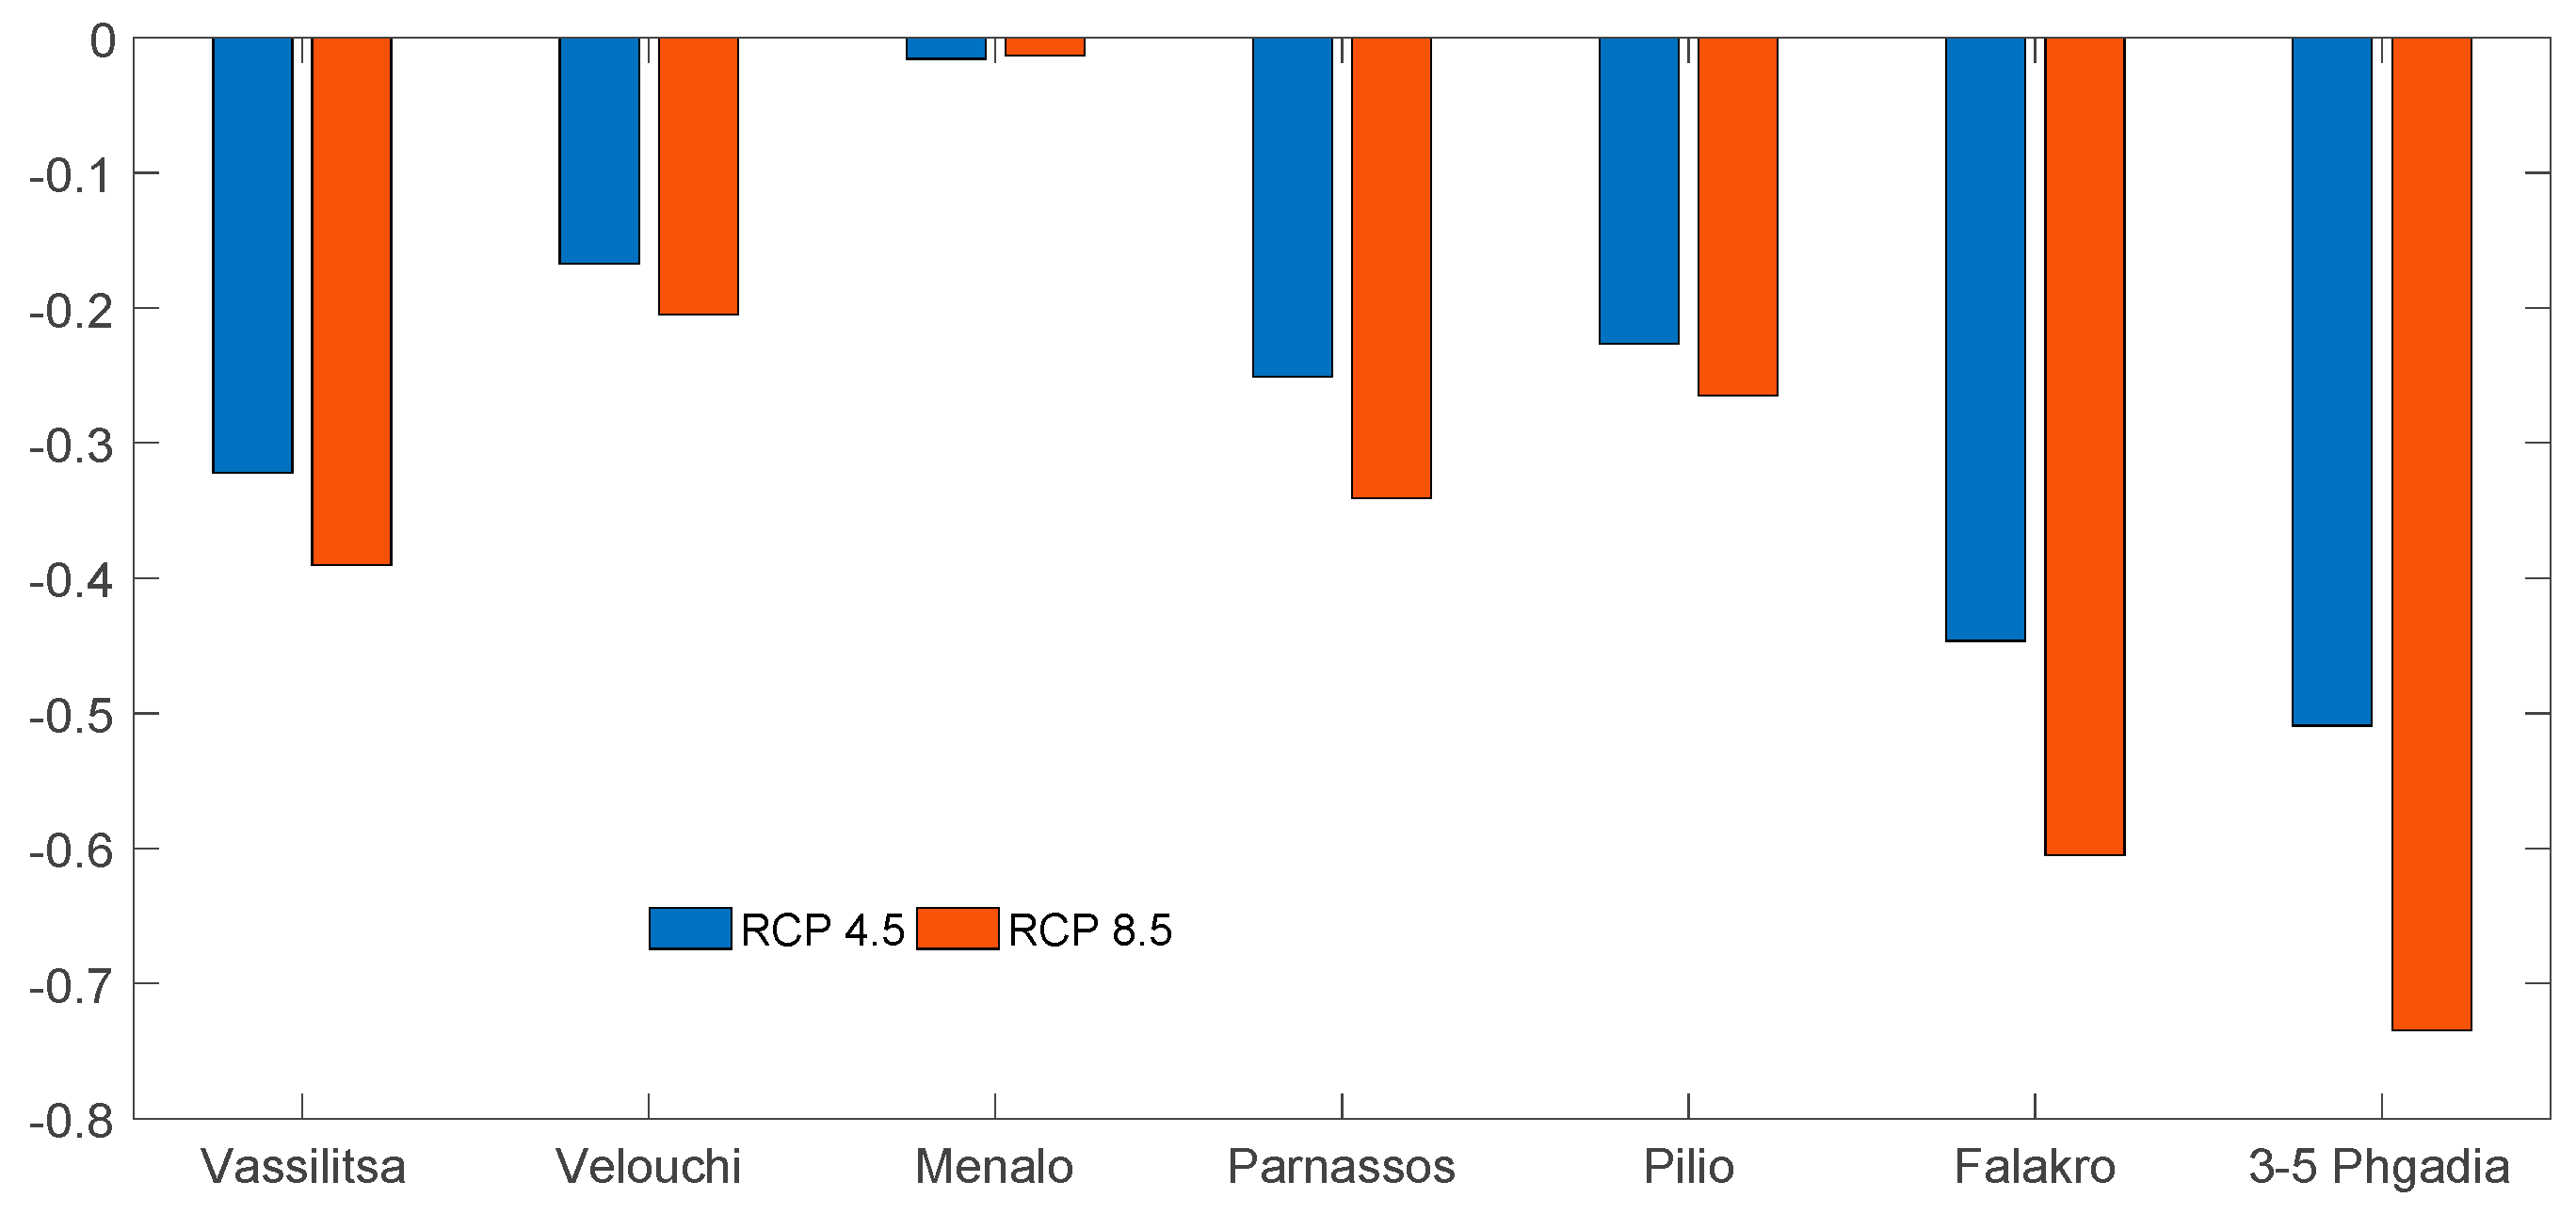
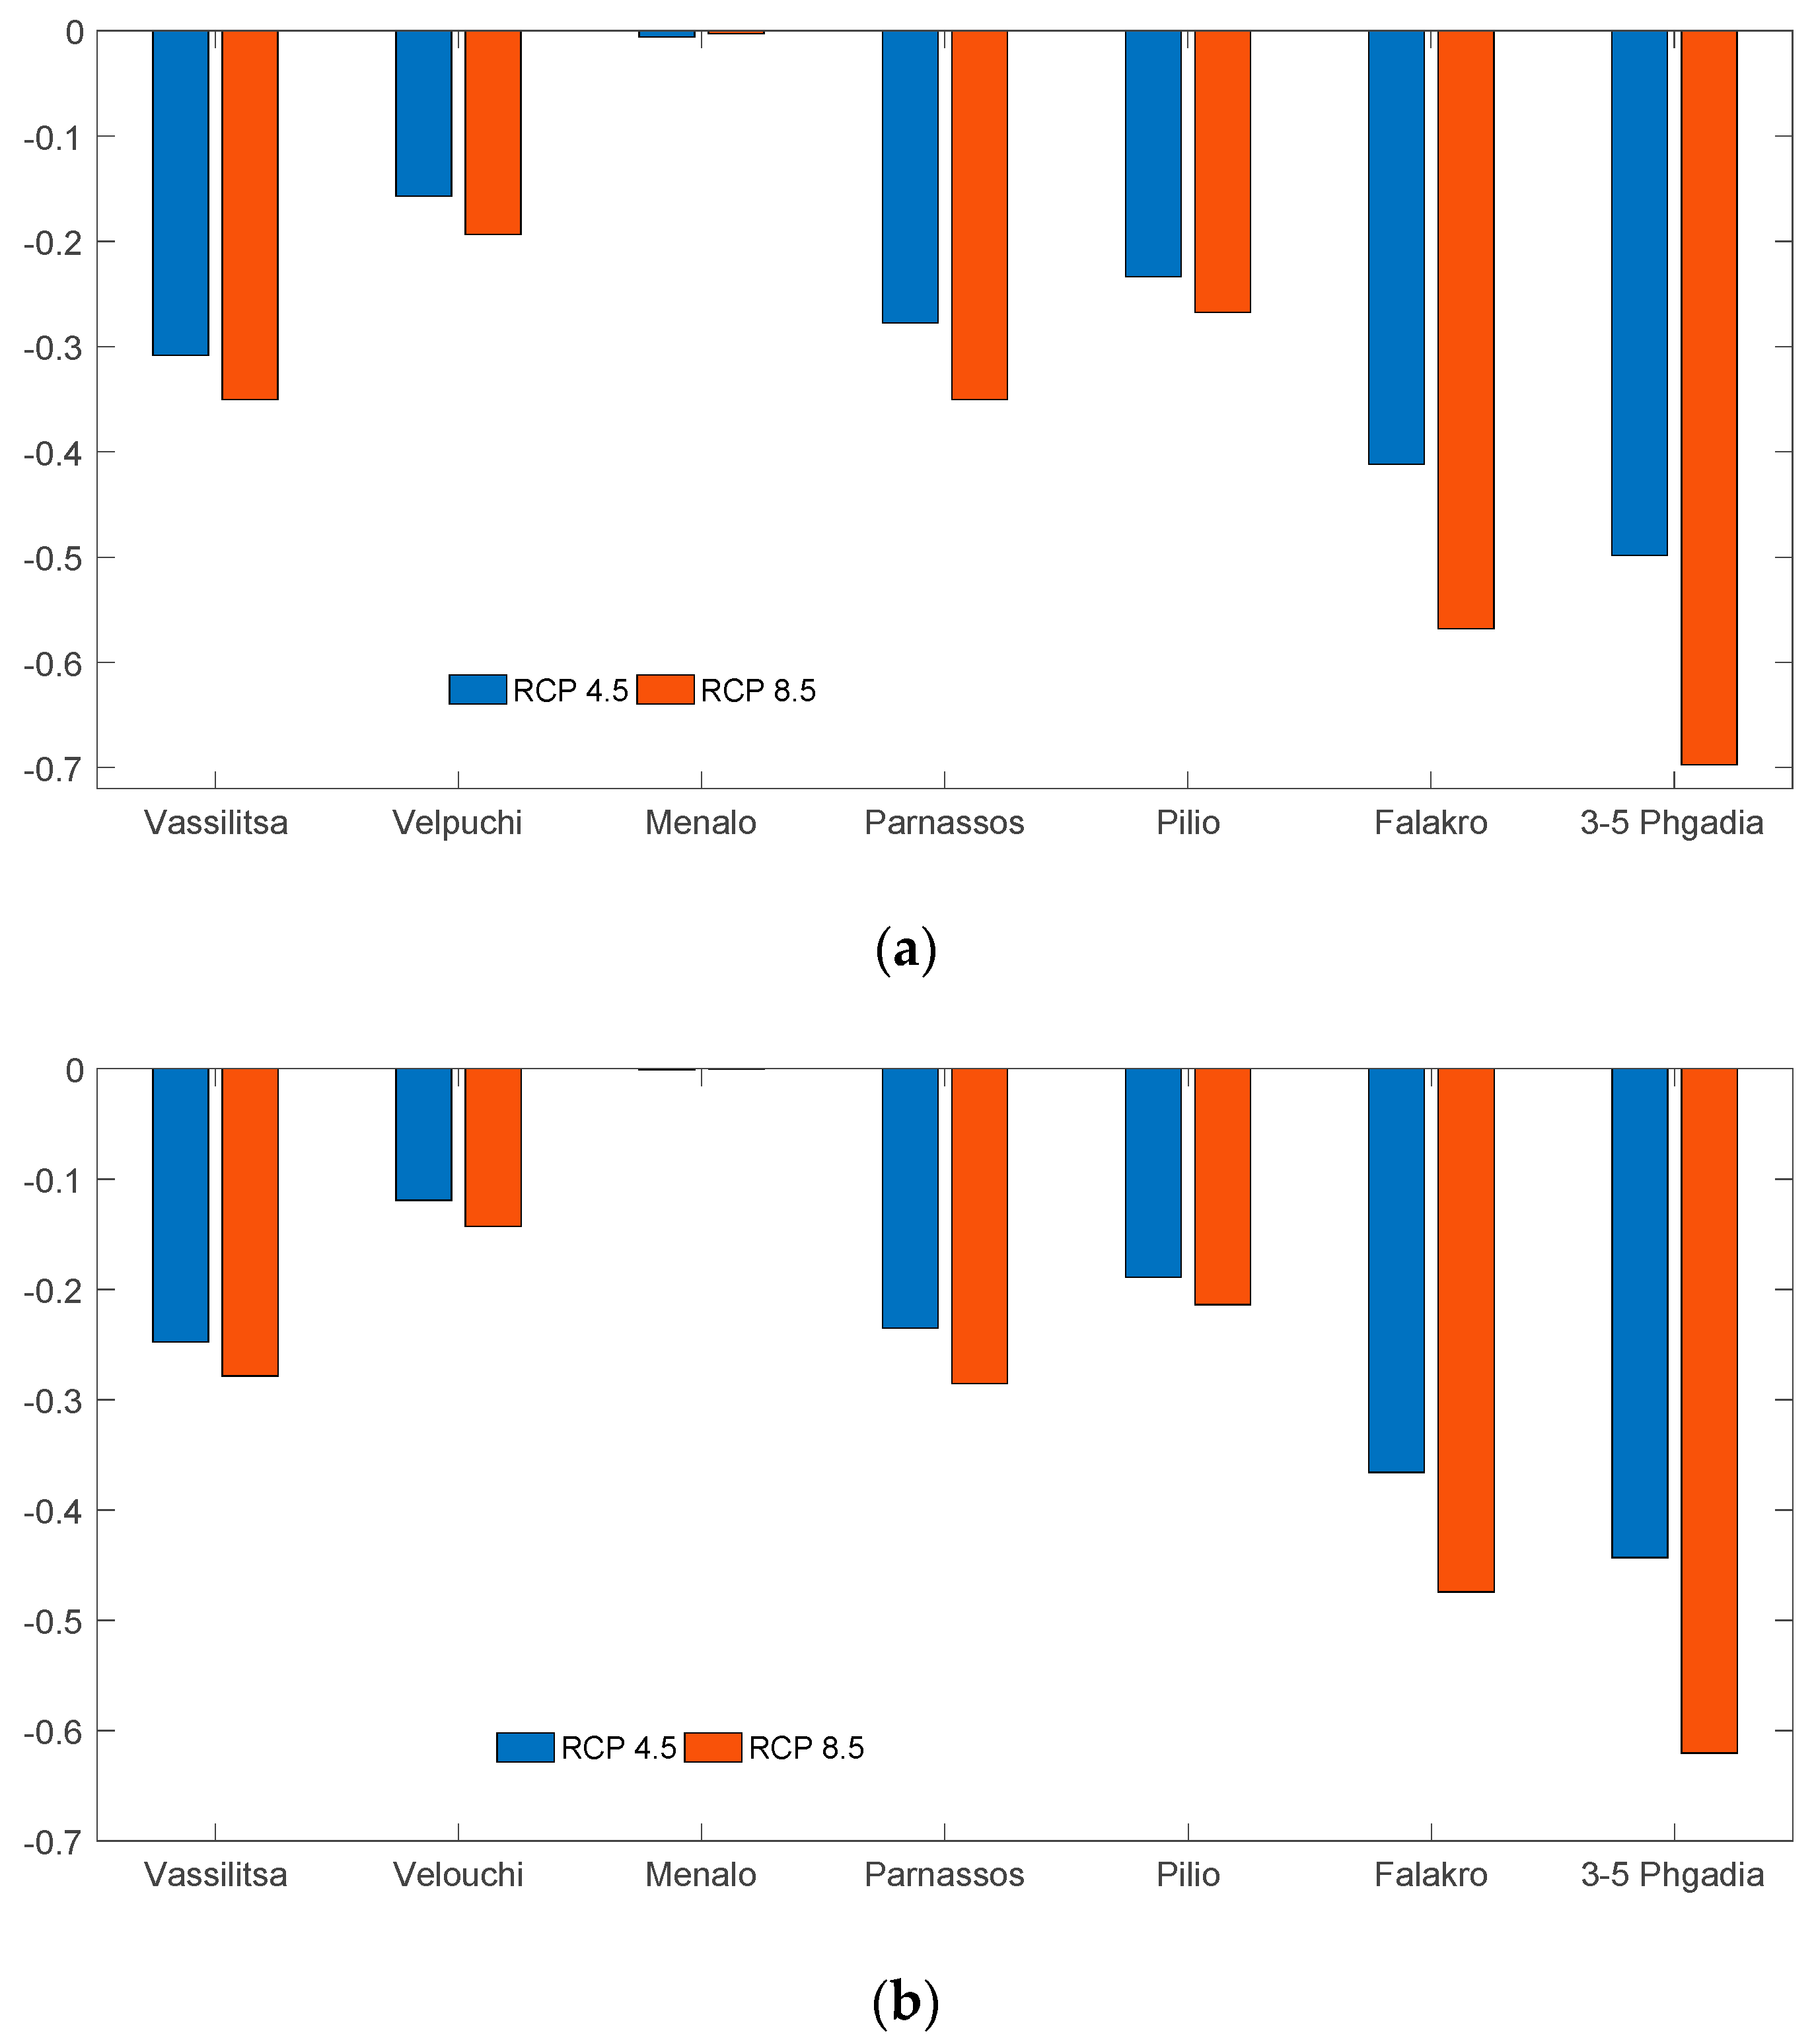
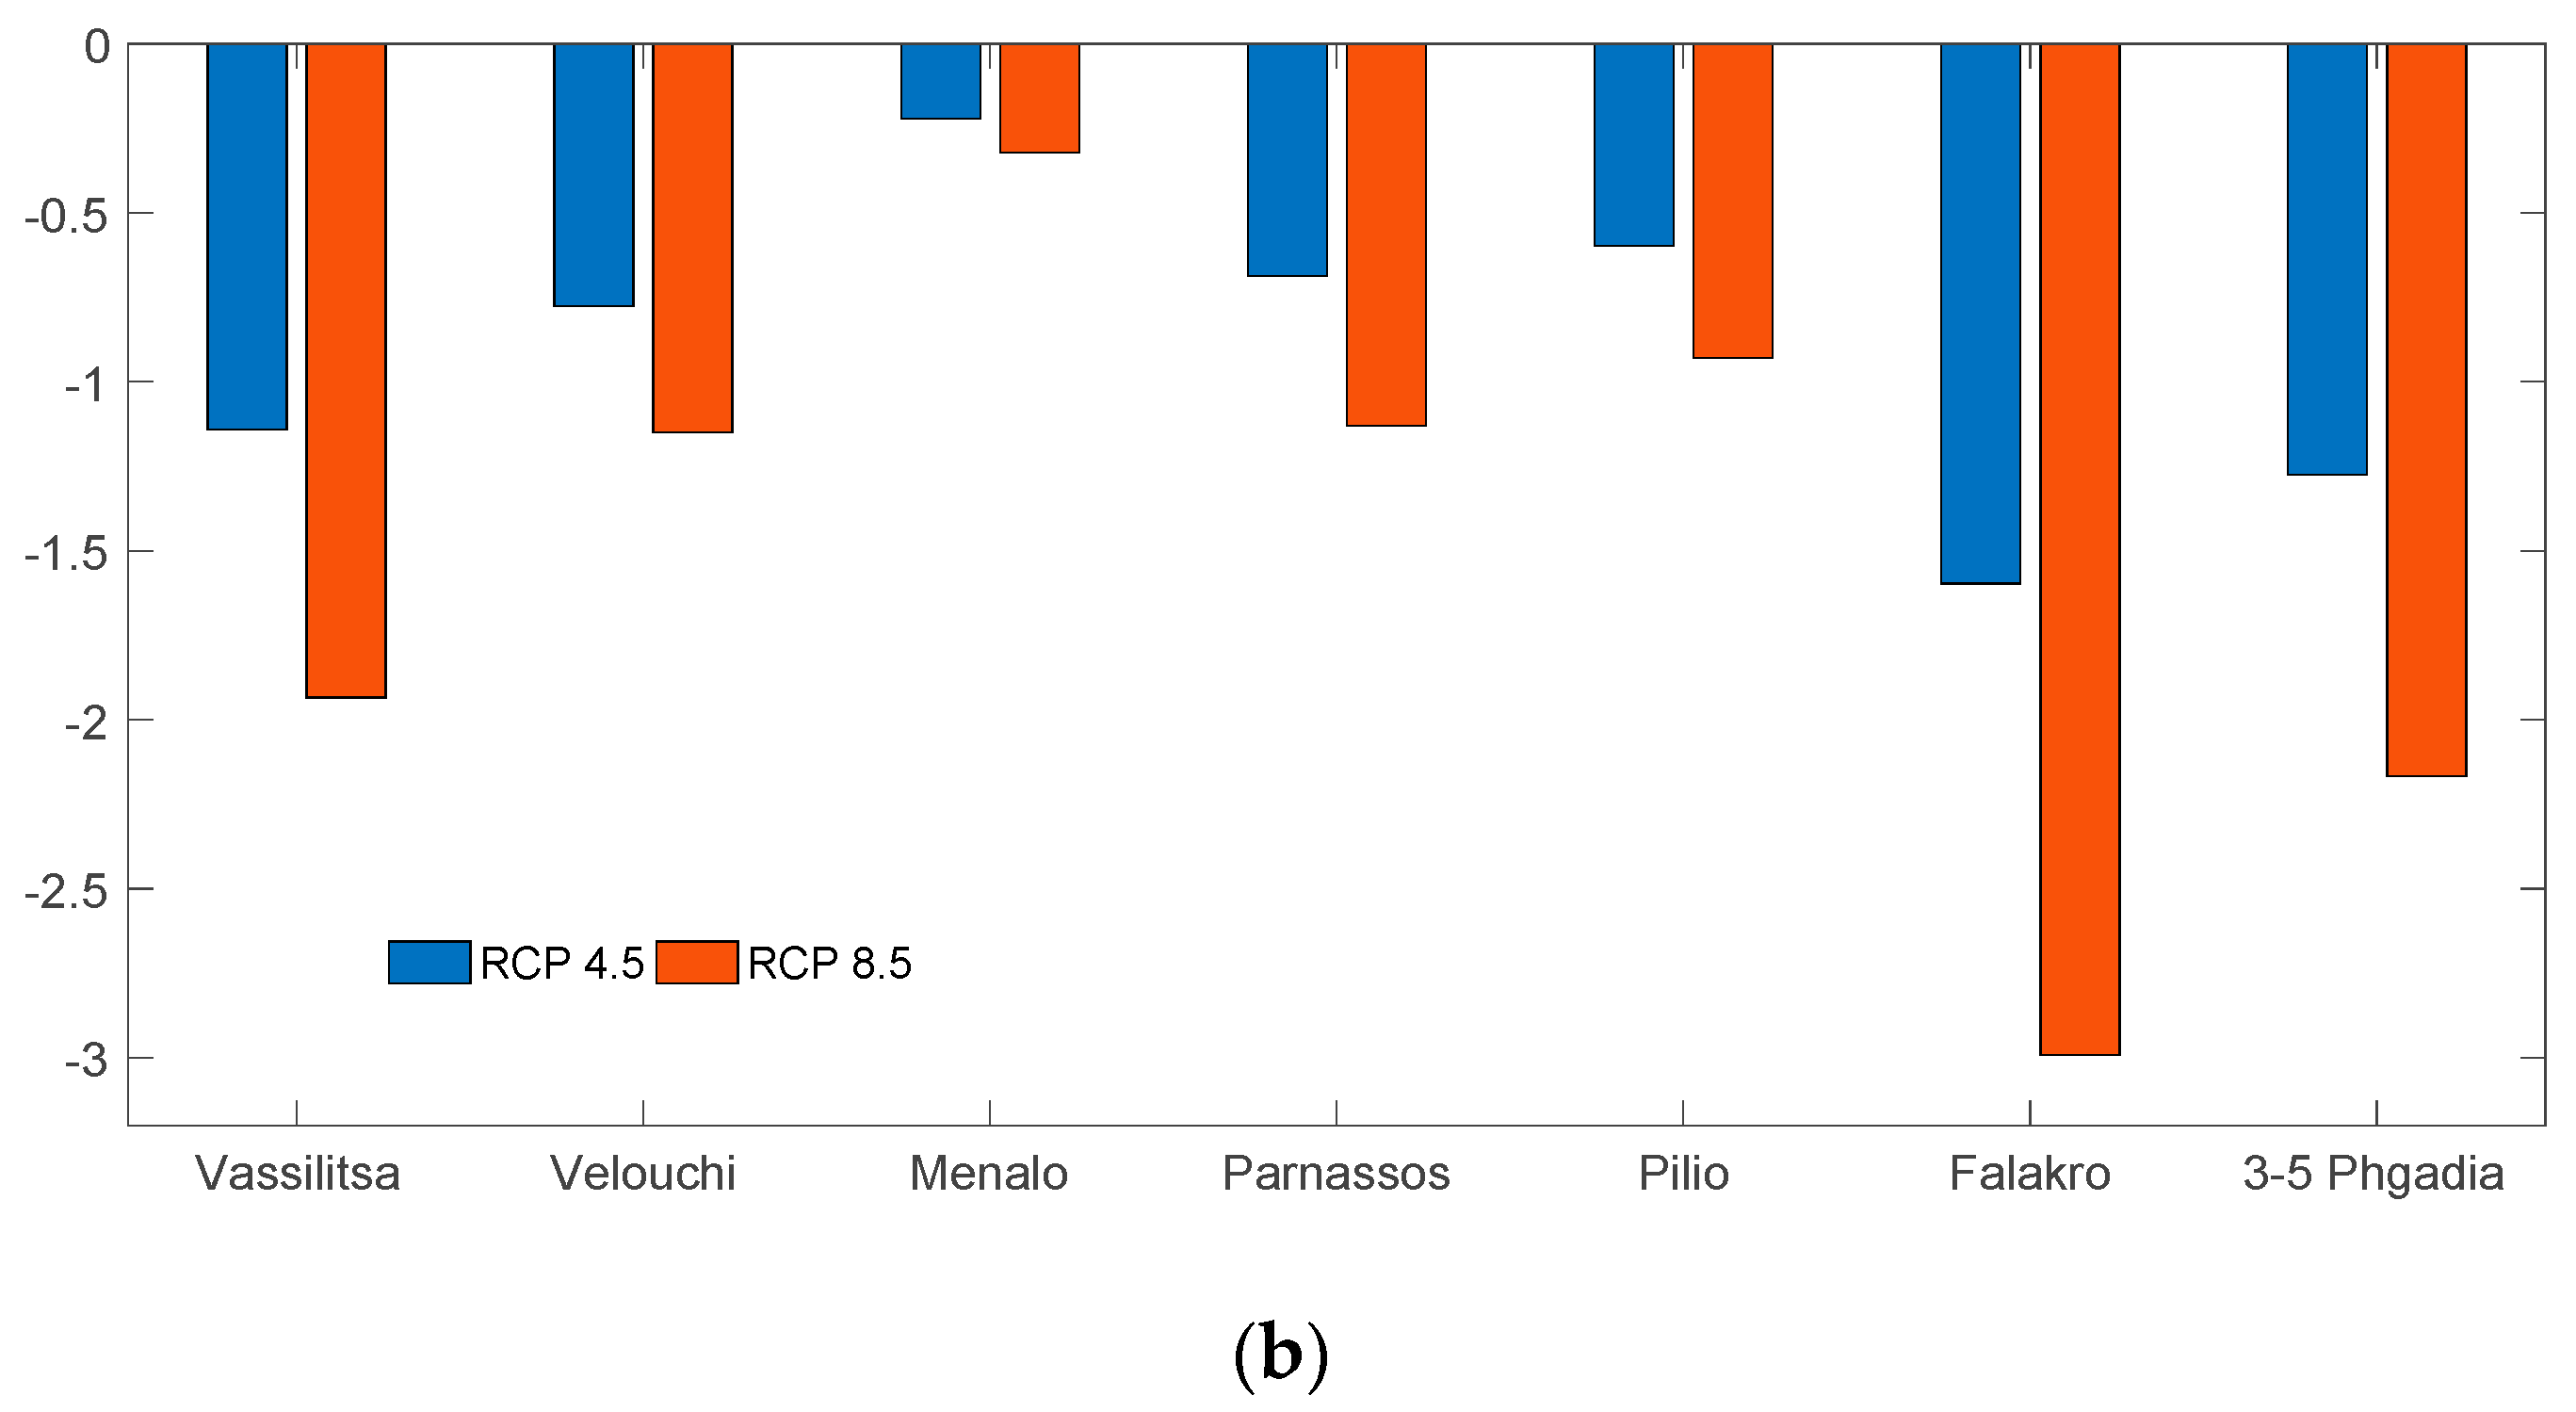
The results of the trend statistical analysis for the sd index, as it is calculated from the difference between the end and the start of the snow season projections from 1970 to 2099, are presented in Figure 4. The corresponding mean trends are presented as mean values per decade for both RCP 4.5 and RCP 8.5. In accordance with the sd findings, both the swe100 and the swe120 index results show a statistically significant decreasing trend for all SRs at the 99% confidence level (Figure 5). The decreasing trends are more pronounced for the RCP 8.5 scenario and for the Falakro and the 3–5 Phgadia SRs. The critical snow indicators in terms of the potential snowmaking hours (wbt-2 and wbt-5) are examined annually, and the mean trends for the eight models are presented in Figure 6. In all SR sites, statistically significant decreasing trends are identified at the 99% confidence level. As expected for all SR sites, the trends are higher for the RCP 8.5 scenario and more pronounced for the Vassilitsa, Falakro, and the 3–5 Phgadia SR sites.
The analysis of the time series breakpoints reveals that the most critical decades for the projected changes in the snow indicators are in the near future (2020–2040), where the climate change stress in the selected SRs will be a dominant factor that requires high-level adaptation measures. In more detail, for more than 80% of the examined snow indicator time series, the breakpoints are from 2020 to 2040.

4. The Case Study of the Parnassos Ski Resort (PSR)

The PSR is a resort with important comparative advantages, such as the rich biodiversity, the cultural and archaeological capital in the wider area, and finally the accessibility and connectivity to neighboring areas as well as to Athens. As far as visitor frequency of the PSR is concerned, great variability is observed. The highest percentage of arrivals is attributed to skiers in January, February, and March. April, which is also the last operating month of the PSR, seems to fall behind in terms of the arrivals of skiers, as well as just visitors. Though the PSR has extended its facilities, including types of alternative tourism, tourists do not appear to respond. Moreover, the vicinity of another tourist attraction with a high frequency of visitors—the archaeological site of Delphi—does not seem to be an advantage.
For the case study of the PSR, historical data were extracted regarding:
  • The natural environment (geomorphologic characteristics and ecosystems);
  • The anthropogenic environment (population data, land use, infrastructure networks, historic and cultural capital, etc.);
  • The infrastructure (buildings, ski fields, lifts, etc.);
  • The frequency of visits by skiers and/or the general public.
Data were extracted from the Public Properties Company [33] archives and the website of the PSR [34]. In particular, data regarding the mean temperature, the absolute maximum and minimum temperatures, total precipitation, and the mean and the maximum wind speed for the period 2009–2018 were also collected from the National Observatory of Athens [35] for the two meteorological stations (PARNASSOS-1650 and PARNASSOS-2250) located in the PSR.
On the basis of the analysis of the selected meteorological data, it was found that for the time period 2009–2018, the absolute minimum air temperature is −13 °C and −14.3 °C and is observed for both stations during January, while in terms of the maximum air temperature, the absolute maximum value is observed in July for the 1950 station and in August for the 2250 station (23.91 °C and 21.32 °C, respectively) (Figure 7a,b).
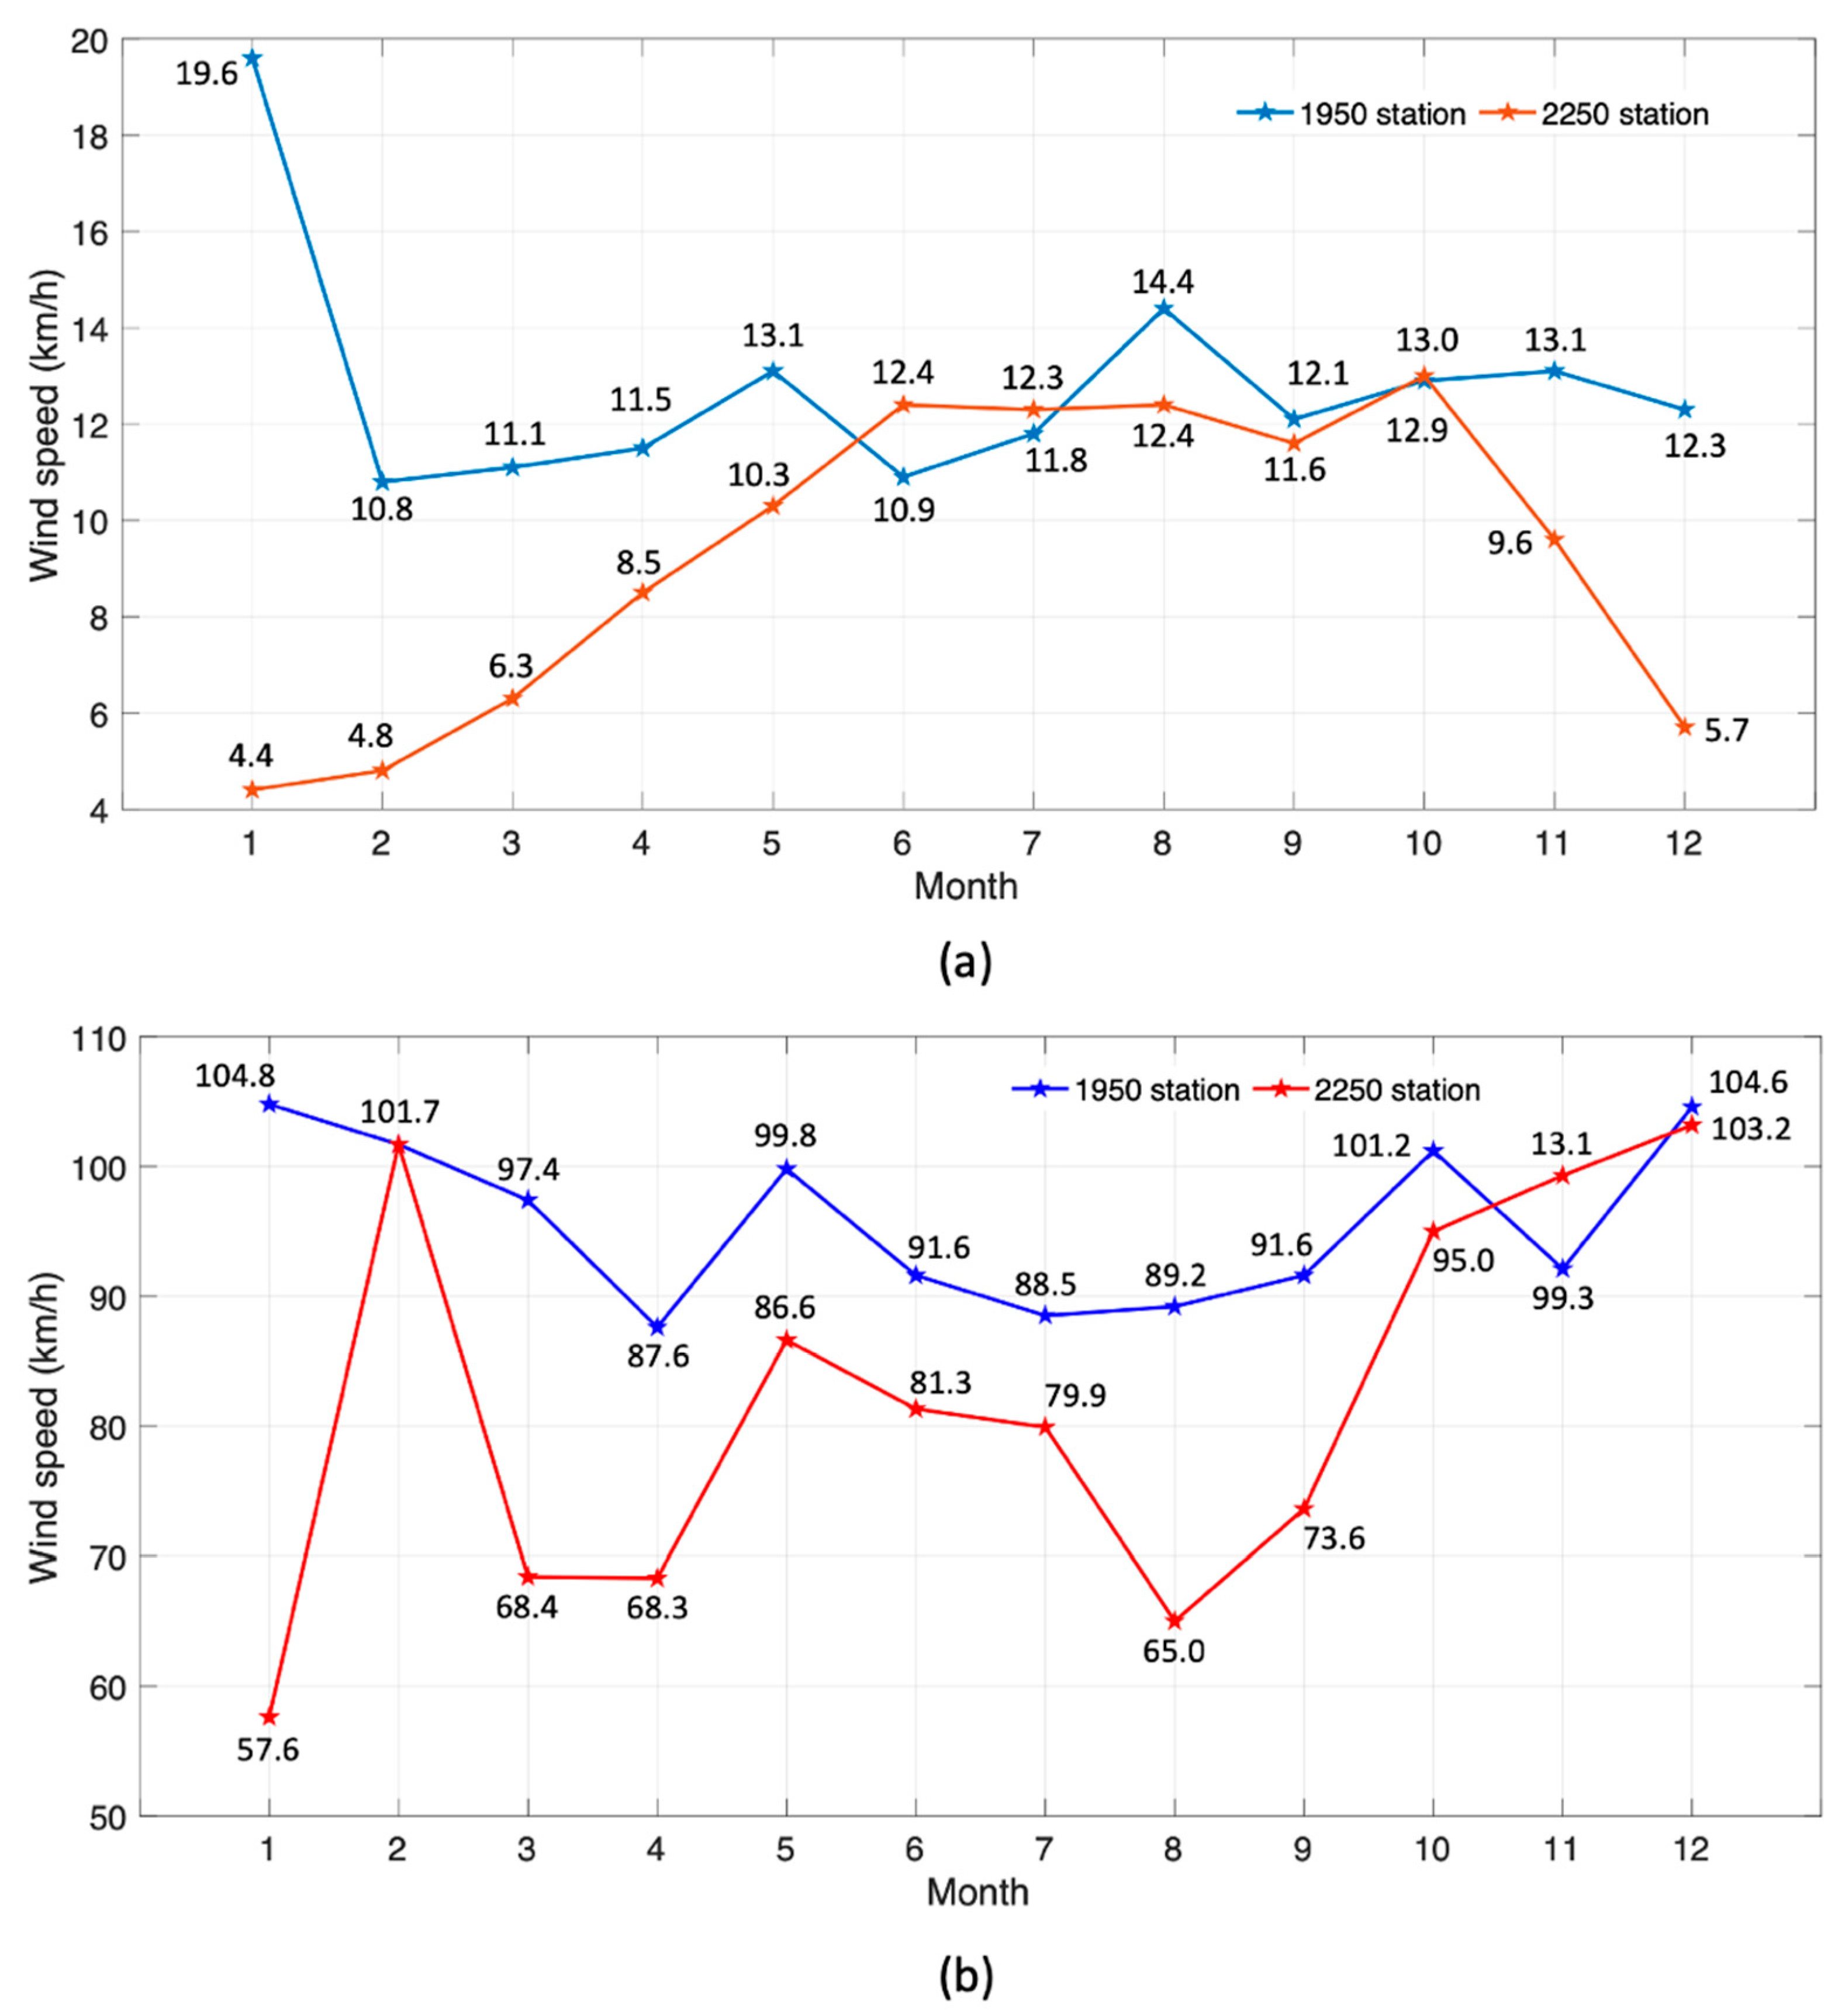
The mean and the maximum wind speeds per month for the two stations are depicted in Figure 8a,b. The mean wind speed per month ranges from 4.4 km/h and 10.8 km/h to 13 km/h and 19.6 km/h at stations 2250 and 1950, respectively.
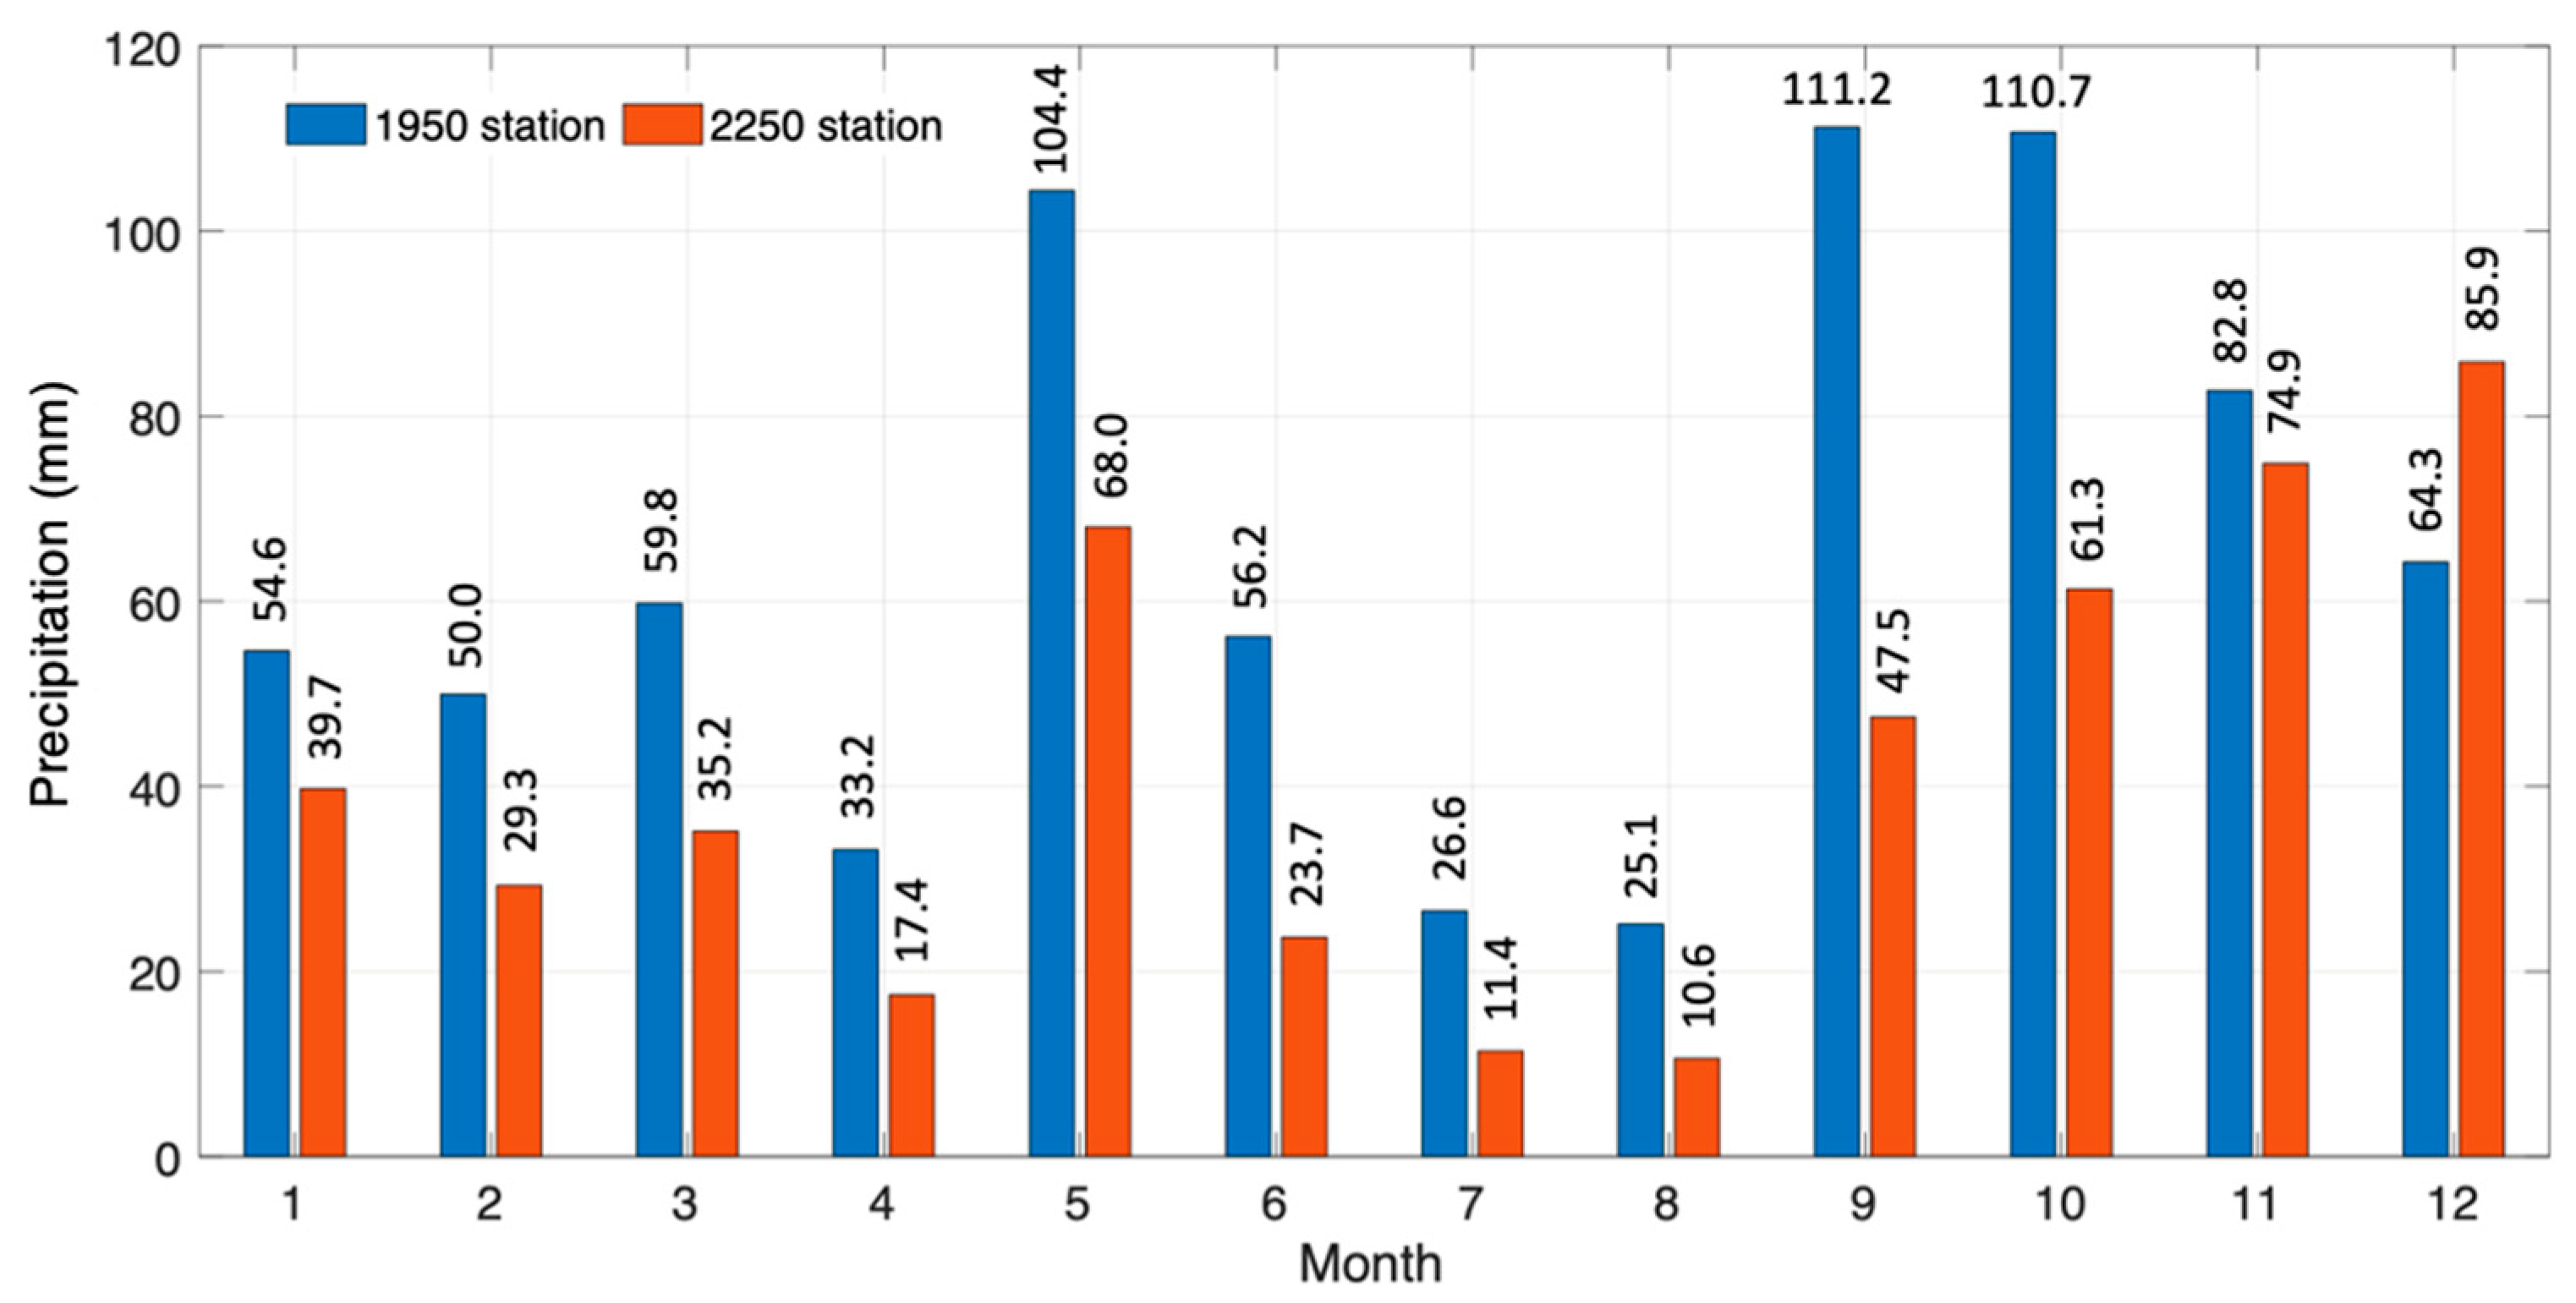
In terms of the average total precipitation per month for the time period 2009–2018 and for the two examined stations, higher values are observed for station 1950 (Figure 9).
In terms of the climate simulations for the PSR, the following wase deduced:
  • An increase in air temperature (mean and minimum) of 2 °C is observed (mean annual), with this value reaching 2.5 °C for the months of the PSR’s operation;
  • A decrease in snow cover percentage, of approximately 37%, for the annual average value and the average value from December to April;
  • A reduction in snow depth by 44% for the annual average value as well as the average value from December to April.
With respect to the two examined PSR stations, air temperature increases are greater at the 1950 station as compared to the 2250 station. Therefore, ski slopes that are located at lower altitudes are more vulnerable to an increase in air temperature due to climate change. In contrast, ski slopes situated at higher altitudes (2250 station) may be considered more resilient to temperature increases.

5. Discussion

The analysis of the climatic parameters and snow indicators for the SRs in Greece emphasizes the fact that they are heavily impacted by changes in climate patterns. Similar findings are recognized in studies that examine the impact of CC on natural snow resources [36,37,38,39]. It should be noted that negative trends in snow cover are already being reported in European mountain regions [40,41,42].
Climate change should be recognized as a driving force that strengthens and expedites the rate of transformative shifts in the winter tourism industry and especially in SRs. The management agencies of all SRs in Greece are urged to conduct vulnerability assessments in order to develop management plans with specific adaptation measures to CC. The assessments need to be implemented at the highest possible spatial resolution and take note of a wide range of parameters (climatic, topographic, and techno-economic). In this regard, the following robust adaptation policy recommendations could be employed to strengthen the capacity of SRs to deal with climate change:
(a)
Implement snowmaking technologies that help sustain good skiing conditions and prolong the ski season. Snowmaking requirements are assessed for major winter tourism destinations in Europe and artificial snow production under certain conditions is promoted as a robust adaptation measure for SRs [43,44,45,46].
(b)
Invest in infrastructure improvements to increase resilience to CC impacts.
(c)
Develop early warning systems (EWS); these tools can effectively allow SRs to manage risks related to changing climatic conditions and include both severe weather warnings and snowfall monitoring and forecasting systems. Access to such data-driven climate services can provide insights about expected climatic conditions and help SRs to adapt their strategies accordingly [47,48,49].
(d)
Diversify SR offerings and relocation of ski slopes; the focus is to gradually develop new recreational facilities and attractions that are not dependent solely on winter weather.
(e)
Development of training and education initiatives; such programs are focused on SR staff to manage the impacts of CC, such as emergency response training.
Applying the above general adaptation considerations to the PSR case study, we suggest promoting specific measures that fall into two main categories [50,51]:
Improvement of existing technical (ski-related) infrastructure:
(a)
Management actions to improve the morphology of the snow fields, i.e., snow grooming to achieve the appropriate depth of snow cover with reduced requirements for snowfall;
(b)
Placement of snow fences at critical points of the snow fields to minimize snow losses;
(c)
The development of new snow slopes at higher altitudes (e.g., Liakoura area), which demonstrate lower vulnerability to CC;
(d)
The suitable formulation of existing natural caverns and water reservoirs in order to create the potential of artificial snowfall.
Actions to increase visitor numbers and expand the operating period:
(a)
Promotion of alternative types of tourism incorporating new recreation activities, such as ecotourism and adventure tourism;
(b)
Taking advantage of the proximity to the archaeological site of Delphi to create bipolar tourism growth;
(c)
Preparation and implementation of turfing and restoration studies regarding the disturbed soil surfaces to visually upgrade the landscape;
(d)
Development of a collaboration network with the municipalities in the wider geographic area as well as the Parnassos National Park Management Body to effectively promote the PSR.

6. Conclusions

The contribution of this study lies in the evidence-based estimation of CC impacts on ski tourism in Greece and in particular for the case study of the PSR; this is accomplished through the examination of the CC-induced changes in several climate parameters and snow indices on the basis of high-spatial resolution RCM simulations.
The results of the climate simulations for the period 2051–2060 as compared to the reference period 1971–1980 show an increase in tas and tmin. In particular, the highest increase in tas and tmin is observed in the north-west part of the country, whereas high-altitude regions tend to show a greater temperature increase. Similarly, a considerable decrease in the percentage of snc and snd is predicted for the whole Greek territory for the months of December to April. This decrease presents a remarkable spatial heterogeneity, with areas in western Greece and the northern part of the country being the most affected.
The variation (%) in the mean value of snd during the months December–April is greater in the Epirus and West Macedonia areas, with the percentage of reduction reaching 65%. The geographical differentiation of the variation in snd follows that of tas and tmin. As a result, the percentages of snd reduction are most apparent in the high-altitude mountainous areas, while the situation is weakened in lowland areas.
According to the findings of this study, a strong dependence of ski tourism on future climate conditions is recognized, even for the moderate RCP 4.5 scenario (RCP4.5). More precisely, the simulated climate conditions for the period 2051–2060 as compared to the reference one are:
(a)
The tmin increase exceeds 1 °C, reaching 3 °C in some cases;
(b)
The mean reduction in snc in the examined SRs is, on average, 40% (ranging from 35% to 50%);
(c)
Snow depth demonstrates remarkable losses, ranging from 10% to 70% reduction.
It is worth noting that high-altitude SRs were also found to be severely affected by CC, a fact which implies that altitude itself cannot guarantee the resilience of SRs to CC impacts. Regarding the snow indicators, statistically significant decreasing trends are identified for all examined indicators, and the need for adaptation strategies is established from the analysis of the time-series breakpoints. In the majority of the cases, the breakpoints in the time series are identified in the next two decades for both RCP 4.5 and RCP 8.5. Among the seven examined SRs, Falakro is the most vulnerable to CC; on the other hand, vulnerability seems to be lower at the SRs of Pilio, Velouchi, and Vassilitsa, where air temperature increase reaches smaller values; in addition, snc and snd show limited changes for the period 2051–2060 as compared to the reference one.
The proposed adaptation measures include primarily the use of technological developments (e.g., artificial snowmaking) and initiatives related to the sustainability of each SR such as the diversification of offerings at ski resorts that can also provide economic benefits to local communities and transform SRs into multi-seasonal tourist destinations.

Author Contributions

Conceptualization, D.T. and C.C.; methodology, D.T.; validation D.T.; writing—original draft preparation, D.T. and K.P.; writing—review and editing, C.C. and K.P. All authors have read and agreed to the published version of the manuscript.

Funding

This research received no external funding.

Data Availability Statement

The data presented in this study are available on reasonable request.

Conflicts of Interest

The authors declare no conflict of interest.

Appendix A

Table A1. Regional climate model (RCM) catalogue used in the simulations.
RCMDriving ModelInstitutePeriod
ALADIN53CNRM-CERFACS-CNRM-CM5CNRM1971–1980
ALADIN63CNRM-CERFACS-CNRM-CM5CNRM1971–1980
ALARO-0CNRM-CERFACS-CNRM-CM5RMIB-UGent1971–1980
CCLM4-8-17CNRM-CERFACS-CNRM-CM5CLMcom1971–1980
CCLM4-8-17ICHEC-EC-EARTHCLMcom1971–1980
CCLM4-8-17MOHC-HadGEM2-ESCLMcom1971–1980
CCLM4-8-17MPI-ESM-LRCLMcom1971–1980
CCLM4-8-17MPI-M-MPI-ESM-LRCLMcom1971–1980
HIRHAM5CNRM-CERFACS-CNRM-CM5DMI1971–1980
HIRHAM5ICHEC-EC-EARTHDMI1971–1980
HIRHAM5MOHC-HadGEM2-ESDMI1971–1980
HIRHAM5NCC-NorESM1-MDMI1971–1980
RACMO22ECNRM-CERFACS-CNRM-CM5KNMI1971–1980
RACMO22EICHEC-EC-EARTHKNMI1971–1980
RACMO22EMOHC-HadGEM2-ESKNMI1971–1980
RACMO22ENCC-NorESM1-MKNMI1971–1980
RCA4CNRM-CERFACS-CNRM-CM6SMHI1971–1980
RCA4ICHEC-EC-EARTHSMHI1971–1980
RCA4IPSL-IPSL-CM5A-MRSSMHI1971–1980
RCA4MOHC-HadGEM2-ESSMHI1971–1980
RCA4MPI-M-MPI-ESM-LRSMHI1971–1980
RCA4NCC-NorESM1-MSMHI1971–1980
REMO2009MPI-ESM-LRMPI-CSC1971–1980
REMO2015IPSL-CM5A-LRGERICS1971–1980
REMO2015NCC-NorESM1-MGERICS1971–1980
REMO2015NOAA-GFDL-GFDL-ESM2GGERICS1971–1980
WRF331FIPSL-CM5A-MRIPSL1971–1980
WRF331FIPSL-IPSL-CM5A-MRIPSL-INERIS1971–1980
CNRM-CERFACS-CNRM-CM5ALADIN53CNRM2051–2060
CNRM-CERFACS-CNRM-CM5ALARO-0RMIB-Ugent2051–2060
CNRM-CERFACS-CNRM-CM5CCLM4-8-17CLMcom2051–2060
CNRM-CERFACS-CNRM-CM5RACMO22EKNMI2051–2060
CNRM-CERFACS-CNRM-CM5RCA4SMHI2051–2060
ICHEC-EC-EARTHCCLM4-8-17CLMcom2051–2060
ICHEC-EC-EARTHHIRHAM5DMI2051–2060
ICHEC-EC-EARTHRACMO22EKNMI2051–2060
ICHEC-EC-EARTHRCA4SMHI2051–2060
IPSL-IPSL-CM5A-MRRCA4SMHI2051–2060
IPSL-IPSL-CM5A-MRWRF331FIPSL-INERIS2051–2060
MOHC-HadGEM2-ESCCLM4-8-17CLMcom2051–2060
MOHC-HadGEM2-ESRACMO22EKNMI2051–2060
MOHC-HadGEM2-ESRCA4SMHI2051–2060
MPI-M-MPI-ESM-LRCCLM4-8-17CLMcom2051–2060
MPI-M-MPI-ESM-LRRCA4SMHI2051–2060
MPI-M-MPI-ESM-LRREMO2009MPI2051–2060
MPI-M-MPI-ESM-LRREMO2009MPI-CSC2051–2060
NCC-NorESM1-MHIRHAM5DMI2051–2060

References

  1. Tuel, A.; Eltahir, E.A. Why is the Mediterranean a climate change hot spot? J. Clim. 2020, 33, 5829–5843. [Google Scholar] [CrossRef]
  2. Cos, J.; Doblas-Reyes, F.; Jury, M.; Marcos, R.; Bretonnière, P.A.; Samsó, M. The Mediterranean climate change hotspot in the CMIP5 and CMIP6 projections. Earth Syst. Dyn. 2022, 13, 321–340. [Google Scholar] [CrossRef]
  3. Zittis, G.; Almazroui, M.; Alpert, P.; Ciais, P.; Cramer, W.; Dahdal, Y.; Fnais, M.; Francis, D.; Hadjinicolaou, P.; Howari, F.; et al. Climate change and weather extremes in the Eastern Mediterranean and Middle East. Rev. Geophys. 2022, 60, e2021RG000762. [Google Scholar] [CrossRef]
  4. Georgoulias, A.K.; Akritidis, D.; Kalisoras, A.; Kapsomenakis, J.; Melas, D.; Zerefos, C.S.; Zanis, P. Climate change projections for Greece in the 21st century from high-resolution EURO-CORDEX RCM simulations. Atmos. Res. 2022, 271, 106049. [Google Scholar] [CrossRef]
  5. Committee for Impact Study of Climate Change (EMEKA). The Environmental, Financial Impacts of Climate Change in Greece; Bank of Greece, Eurosystem: Athens, Greece, 2011. [Google Scholar]
  6. Cartalis, C.; Oikonomou, D.; Kokkosis, H.; Santamouris, D. Impacts of Climate Change to the Development Model of Greece; Dianeosis: Athens, Greece, 2017; p. 300. [Google Scholar]
  7. Cartalis, C.; Kokkosis, H.; Philippopoulos, K.; Polydoros, A.; Lappa, K.; Mavrakou, T. Incorporating Climate Change in the Transformation of Greece’s Development Model; Dianeosis: Athens, Greece, 2021; p. 333. [Google Scholar]
  8. Abbas, A.; Waseem, M.; Ahmad, R.; Khan, K.A.; Zhao, C.; Zhu, J. Sensitivity analysis of greenhouse gas emissions at farm level: Case study of grain and cash crops. Environ. Sci. Pollut. Res. 2022, 29, 82559–82573. [Google Scholar] [CrossRef] [PubMed]
  9. Abbas, A.; Zhao, C.; Ullah, W.; Ahmad, R.; Waseem, M.; Zhu, J. Towards sustainable farm production system: A case study of corn farming. Sustainability 2021, 13, 9243. [Google Scholar] [CrossRef]
  10. Elahi, E.; Khalid, Z.; Tauni, M.Z.; Zhang, H.; Lirong, X. Extreme weather events risk to crop-production and the adaptation of innovative management strategies to mitigate the risk: A retrospective survey of rural Punjab, Pakistan. Technovation 2022, 117, 102255. [Google Scholar] [CrossRef]
  11. Elahi, E.; Khalid, Z.; Zhang, Z. Understanding farmers’ intention and willingness to install renewable energy technology: A solution to reduce the environmental emissions of agriculture. Appl. Energy 2022, 309, 118459. [Google Scholar] [CrossRef]
  12. Damm, A.; Greuell, W.; Landgren, O.; Prettenthaler, F. Impacts of+ 2 C global warming on winter tourism demand in Europe. Clim. Serv. 2017, 7, 31–46. [Google Scholar] [CrossRef] [Green Version]
  13. Pütz, M.; Gallati, D.; Kytzia, S.; Elsasser, H.; Lardelli, C.; Teich, M.; Waltert, F.; Rixen, C. Winter tourism, climate change, and snowmaking in the Swiss Alps: Tourists’ attitudes and regional economic impacts. Mt. Res. Dev. 2011, 31, 357–362. [Google Scholar] [CrossRef]
  14. Steiger, R.; Posch, E.; Tappeiner, G.; Walde, J. The impact of climate change on demand of ski tourism-a simulation study based on stated preferences. Ecol. Econ. 2020, 170, 106589. [Google Scholar] [CrossRef]
  15. Scott, D.; Steiger, R.; Dannevig, H.; Aall, C. Climate change and the future of the Norwegian alpine ski industry. Curr. Issues Tour. 2020, 23, 2396–2409. [Google Scholar] [CrossRef]
  16. Scott, D.; Steiger, R.; Rutty, M.; Pons, M.; Johnson, P. Climate change and ski tourism sustainability: An integrated model of the adaptive dynamics between ski area operations and skier demand. Sustainability 2020, 12, 10617. [Google Scholar] [CrossRef]
  17. Gilaberte-Búrdalo, M.; López-Martín, F.; Pino-Otín, M.R.; López-Moreno, J.I. Impacts of climate change on ski industry. Environ. Sci. Policy 2014, 44, 51–61. [Google Scholar] [CrossRef] [Green Version]
  18. Steiger, R.; Scott, D.; Abegg, B.; Pons, M.; Aall, C. A critical review of climate change risk of ski tourism. Curr. Issues Tour. 2017, 22, 1343–1379. [Google Scholar] [CrossRef] [Green Version]
  19. Beniston, M.; Farinotti, D.; Stoffel, M.; Andreassen, L.M.; Coppola, E.; Eckert, N.; Fantini, A.; Giacona, F.; Hauck, C.; Huss, M.; et al. The European mountain cryosphere: A review of its current state, trends, and future challenges. Cryosphere 2018, 12, 759–794. [Google Scholar] [CrossRef] [Green Version]
  20. Hock, R.; Rasul, G.; Adler, C.; Cáceres, B.; Gruber, S.; Hirabayashi, Y.; Jackson, M.; Kääb, A.; Kang, S.; Kutuzov, S. High mountain areas. In IPCC Special Report on the Ocean and Cryosphere in a Changing Climate; Pörtner, H.-O., Roberts, D.C., Masson-Delmotte, V., Zhai, P., Tignor, M., Poloczanska, E., Mintenbeck, K., Alegría, A., Nicolai, M., Okem, A., et al., Eds.; 2019; pp. 131–202. Available online: https://www.ipcc.ch/srocc/ (accessed on 1 May 2020).
  21. Gössling, S.; Scott, D.; Hall, C.M.; Ceron, J.P.; Dubois, G. Consumer behaviour and demand response of tourists to climate change. Ann. Tour. Res. 2012, 39, 36–58. [Google Scholar] [CrossRef]
  22. Scott, D.; Hall, C.M.; Gössling, S. Tourism and Climate Change. Impacts, Adaptation & Mitigation, 1st ed.; Routledge: London, UK, 2012. [Google Scholar]
  23. Iso-Ahola, S.E. A theory of substitutability of leisure behavior. Leis. Sci. 1986, 8, 367–389. [Google Scholar] [CrossRef]
  24. Elsasser, H.; Bürki, R. Climate change as a threat to tourism in the Alps. Clim. Res. 2002, 20, 253–257. [Google Scholar] [CrossRef] [Green Version]
  25. European-CORDEX, Euro-CORDEX. Available online: https://euro-cordex.net (accessed on 1 May 2020).
  26. Fifth Assessment Report/AR5. IPCC, 2013. Available online: https://unfccc.int/topics/science/workstreams/cooperation-with-the-ipcc/the-fifth-assessment-report-of-the-ipcc?gclid=EAIaIQobChMI-PynubXx_wIV6l0PAh0OewJ1EAAYASAAEgL1dvD_BwE (accessed on 1 May 2020).
  27. Morin, S.; Samacoït, R.; Hugue, F.; Abegg, B. Mountain tourism meteorological and snow indicators for Europe from 1950 to 2100 derived from reanalysis and climate projection. Copernic. Clim. Change Serv. (C3S) Clim. Data Store (CDS) 2020. [Google Scholar] [CrossRef]
  28. Mann, H.B. Non-parametric tests against trend. Econometrica 1945, 13, V163–V171. [Google Scholar] [CrossRef]
  29. Kendall, M.G. Rank Correlation Methods, 4th ed.; Charles Griffin: London, UK, 1975. [Google Scholar]
  30. Gilbert, R.O. Statistical Methods for Environmental Pollution Monitoring; John Wiley & Sons: Wiley, NY, USA, 1987. [Google Scholar]
  31. Khan, A.; Papazoglou, E.G.; Cartalis, C.; Philippopoulos, K.; Vasilakopoulou, K.; Santamouris, M. On the mitigation potential and urban climate impact of increased green infrastructures in a coastal Mediterranean city. Build. Environ. 2022, 221, 109264. [Google Scholar] [CrossRef]
  32. Pettitt, A.N. A non-parametric approach to the change point problem. J. R. Stat. Soc. Ser. C Appl. Stat. 1979, 28, 126–135. [Google Scholar] [CrossRef]
  33. Public Properties Company. Available online: https://www.hppc.gr/en/home/ (accessed on 1 May 2020).
  34. Ski Resort of Parnassos. Available online: https://parnassos-ski.gr/ (accessed on 1 May 2020).
  35. Meteo. Available online: http://meteosearch.meteo.gr/ (accessed on 1 May 2020).
  36. Rousselot, M.; Durand, Y.; Giraud, G.; Mérindol, L.; Dombrowski-Etchevers, I.; Déqué, M.; Castebrunet, H. Statistical adaptation of ALADIN RCM outputs over the French Alps–application to future climate and snow cover. Cryosphere 2012, 6, 785–805. [Google Scholar] [CrossRef] [Green Version]
  37. Steger, C.; Kotlarski, S.; Jonas, T.; Schär, C. Alpine snow cover in a changing climate: A regional climate model perspective. Clim. Dyn. 2013, 41, 735–754. [Google Scholar] [CrossRef] [Green Version]
  38. Schmucki, E.; Marty, C.; Fierz, C.; Lehning, M. Simulations of 21st century snow response to climate change in Switzerland from a set of RCMs. Int. J. Climatol. 2015, 35, 3262–3273. [Google Scholar] [CrossRef]
  39. Marty, C.; Schlögl, S.; Bavay, M.; Lehning, M. How much can we save? Impact of different emission scenarios on future snow cover in the Alps. Cryosphere 2017, 11, 517–529. [Google Scholar] [CrossRef] [Green Version]
  40. Durand, Y.; Giraud, G.; Laternser, M.; Etchevers, P.; Mérindol, L.; Lesaffre, B. Reanalysis of 47 years of climate in the French Alps (1958–2005): Climatology and trends for snow cover. J. Appl. Meteorol. Climatol. 2009, 48, 2487–2512. [Google Scholar] [CrossRef]
  41. Dyrrdal, A.V.; Saloranta, T.; Skaugen, T.; Stranden, H.B. Changes in snow depth in Norway during the period 1961–2010. Hydrol. Res. 2012, 44, 169. [Google Scholar] [CrossRef]
  42. Pons, M.R.; San-Martín, D.; Herrera, S.; Gutiérrez, J.M. Snow trends in Northern Spain: Analysis and simulation with statistical downscaling methods. Int. J. Climatol. 2009, 30, 1795–1806. [Google Scholar] [CrossRef] [Green Version]
  43. Marke, T.; Strasser, U.; Hanzer, F.; Stötter, J.; Wilcke, R.; Gobiet, A. Scenarios of future snow conditions in Styria (Austrian Alps). J. Hydrometeorol. 2015, 16, 261–277. [Google Scholar] [CrossRef]
  44. Hanzer, F.; Marke, T.; Strasser, U. Distributed, explicit modeling of technical snow production for a ski area in the Schladming region (Austrian Alps). Cold Reg. Sci. Technol. 2014, 108, 113–124. [Google Scholar] [CrossRef]
  45. Schmidt, P.; Steiger, R.; Matzarakis, A. Artificial snowmaking possibilities and climate change based on regional climate mod- eling in the Southern Black Forest. Meteorol. Z. 2012, 21, 167–172. [Google Scholar] [CrossRef]
  46. Rixen, C.; Teich, M.; Lardelli, C.; Gallati, D.; Pohl, M.; Pütz, M.; Bebi, P. Winter tourism and climate change in the Alps: An assessment of resource consumption, snow reliability, and future snowmaking potential. Mt. Res. Dev. 2011, 31, 229–236. [Google Scholar] [CrossRef]
  47. Köberl, J.; François, H.; Cognard, J.; Carmagnola, C.; Prettenthaler, F.; Damm, A.; Morin, S. The demand side of climate services for real-time snow management in Alpine ski resorts: Some empirical insights and implications for climate services development. Clim. Serv. 2021, 22, 100238. [Google Scholar] [CrossRef]
  48. Damm, A.; Köberl, J.; Stegmaier, P.; Alonso, E.J.; Harjanne, A. The market for climate services in the tourism sector–An analysis of Austrian stakeholders’ perceptions. Clim. Serv. 2020, 17, 100094. [Google Scholar] [CrossRef]
  49. Scott, D.J.; Lemieux, C.J.; Malone, L. Climate services to support sustainable tourism and adaptation to climate change. Clim. Res. 2011, 47, 111–122. [Google Scholar] [CrossRef] [Green Version]
  50. Abegg, B.; Agrawala, S.; Crick, F.; de Montfalcon, A. Climate change impacts and adaptation in winter tourism. In Climate Change in the European Alps. Adapting Winter Tourism and Natural Hazards Management; Agrawala, S., Ed.; OECD: Paris, France, 2007; pp. 25–60. [Google Scholar]
  51. Aall, C.; Hall, M.C.; Groven, K. Tourism: Applying rebound theories and mechanisms to climate change mitigation and adaptation. In How to Improve Energy and Climate Policies. Understanding the Role of Rebound Effects; Aall, C., Santarius, T., Walnum, H.J., Eds.; Springer: London, UK, 2016; pp. 209–227. [Google Scholar]
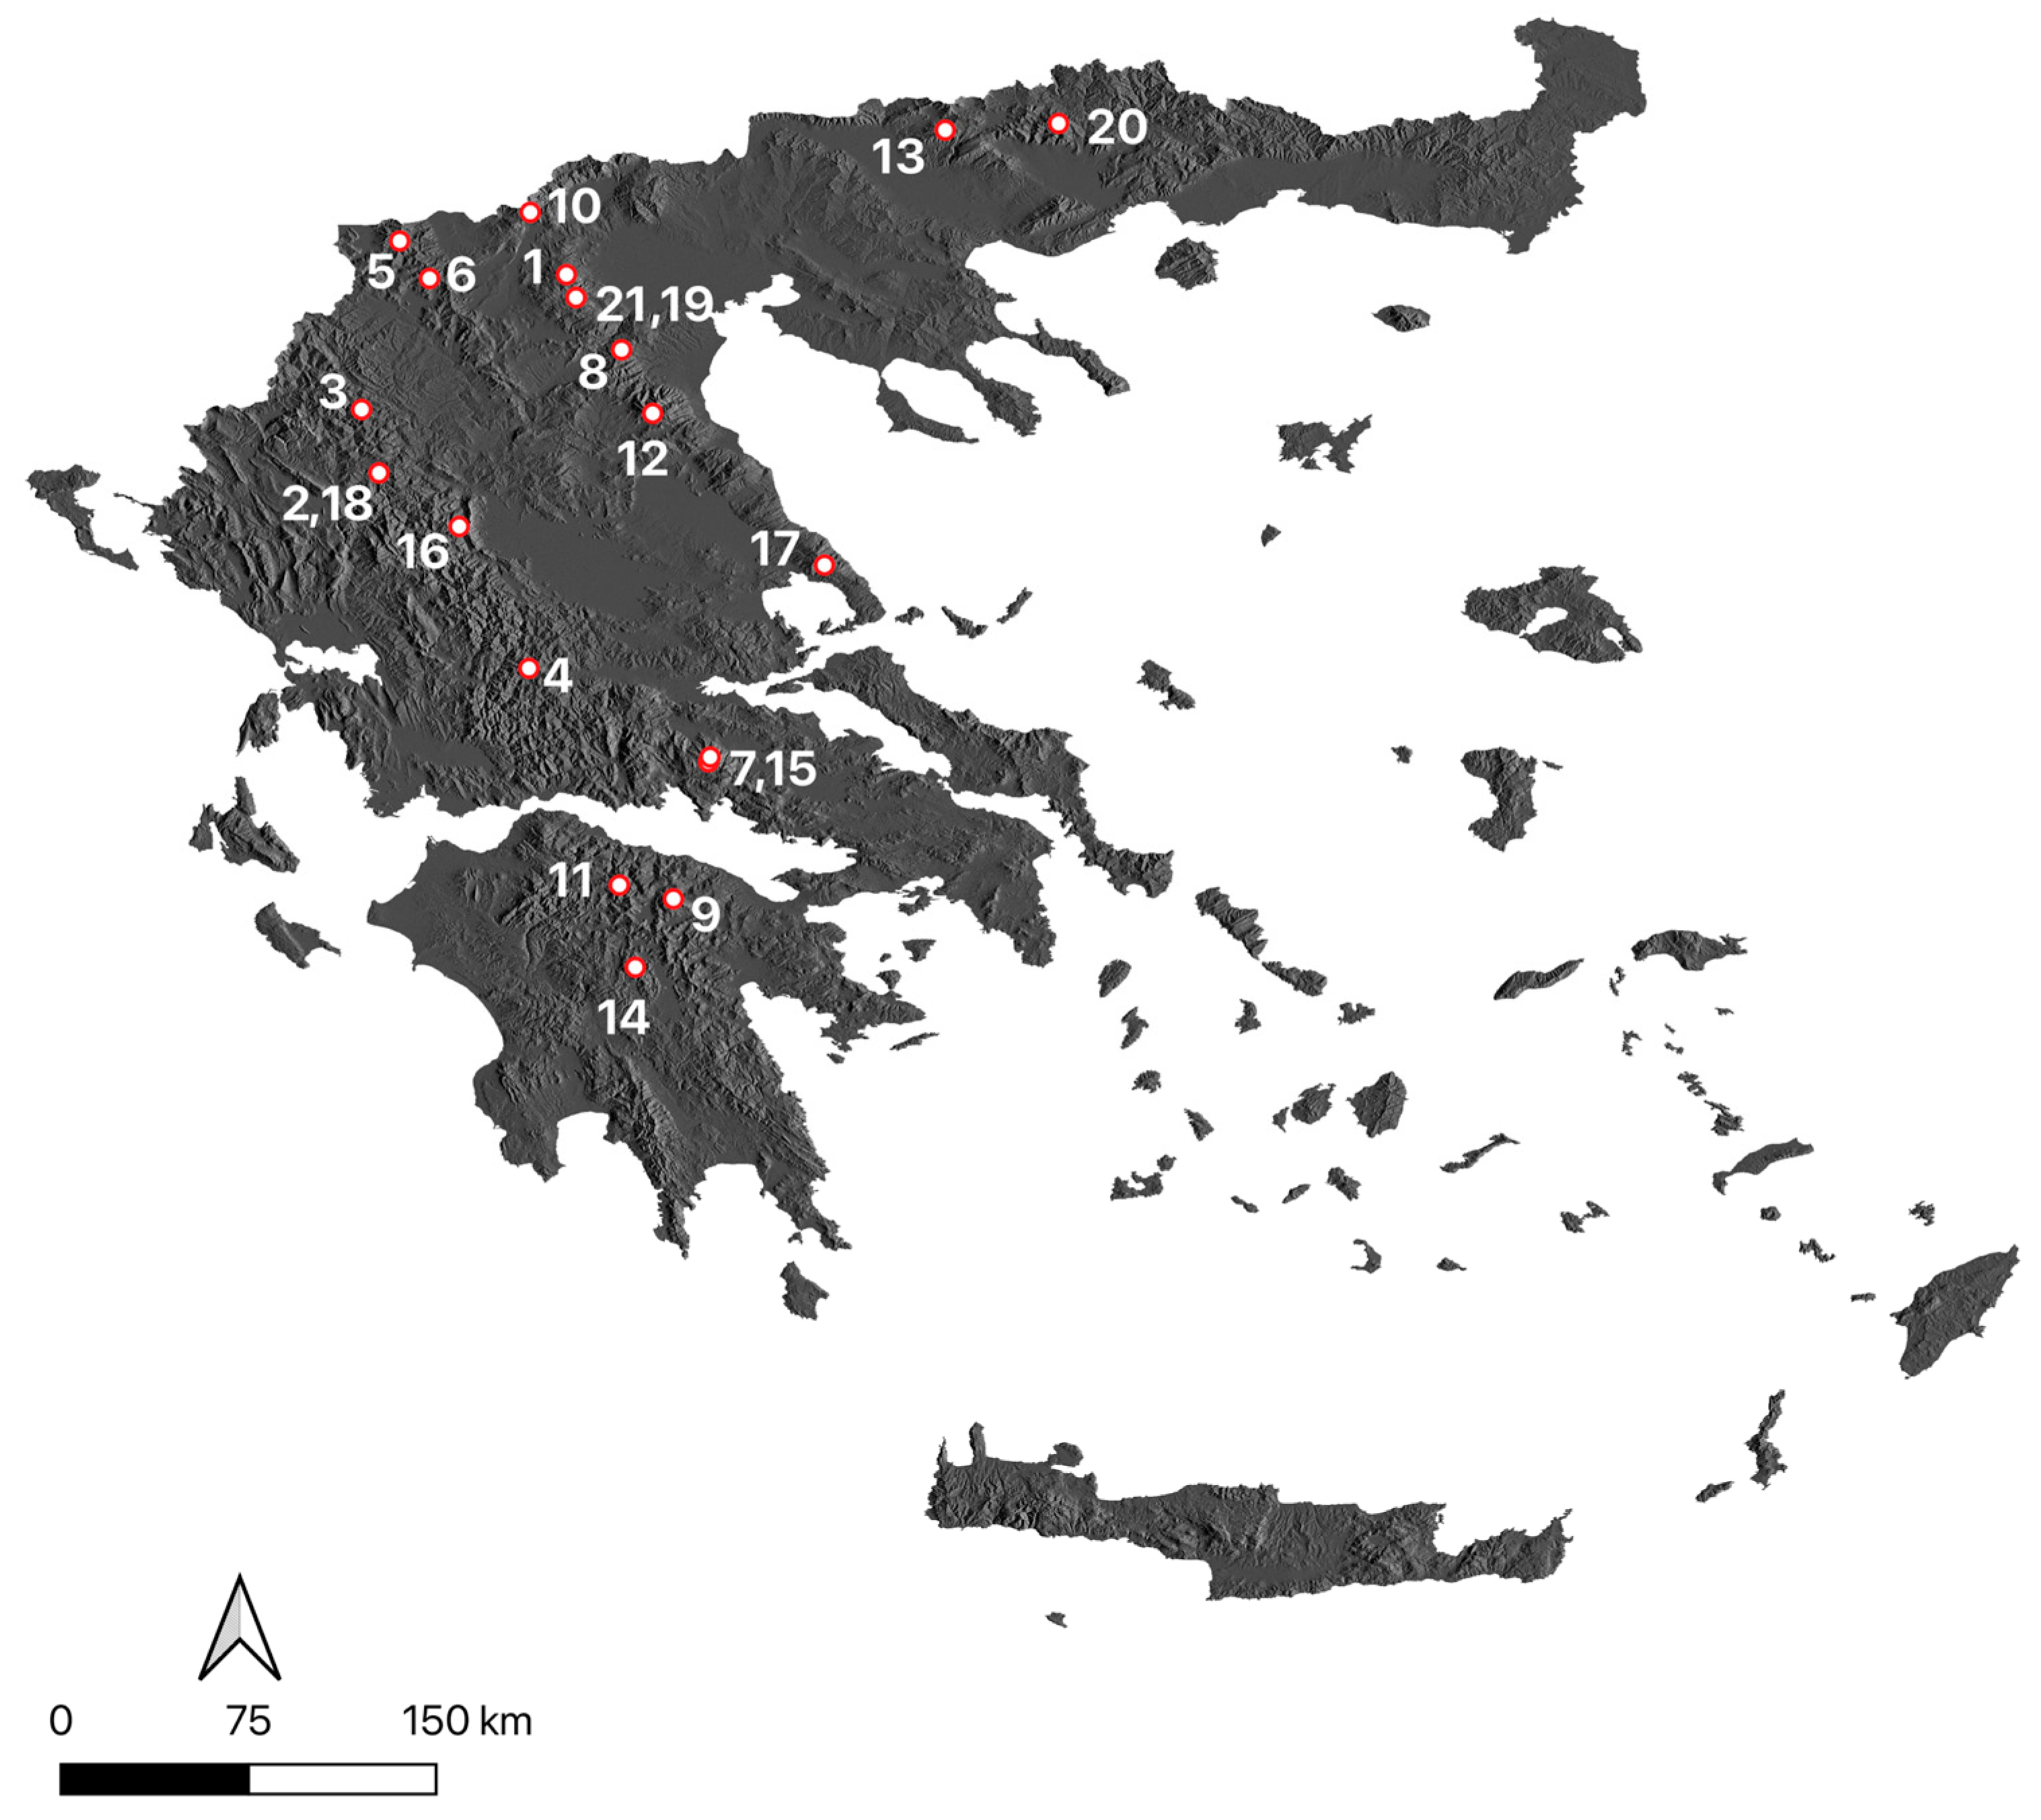
Figure 1. Map of Greek ski resorts (SR). Legend: 1. 3–5 Pigadia; 2. Anilio Metsovou; 3. Vassilitsa; 4. Velouchi; 5. Vigla Pisoderiou; 6. Vitsi; 7. Gerontovrachos; 8. Elatochori; 9. Ziria; 10. Kaimaktsalan; 11. Kalavrita; 12. Olympos; 13. Lailas; 14. Menalo; 15. Parnassos; 16. Pertouli; 17. Pilio; 18. Politsies Metsovou; 19. Seli; 20. Falakro; 21. Chryso Elafi.
Climate 11 00140 g001
Figure 2. Mean tas (left subplot) and tmin (right subplot) change from December to April for the period 2051–2060 as compared to 1971–1980 (the dark spots denote the locations of the seven SRs).
Climate 11 00140 g002
Figure 3. Mean snc (left subplot) and snd (right subplot) change from December to April for the period 2051–2060 as compared to 1971–1980 in percent (the red spots denote the locations of the seven SRs).
Climate 11 00140 g003
Figure 4. Average trends in snow season duration from 1970 to 2099 for RCP 4.5 and RCP 8.5.
Climate 11 00140 g004
Figure 5. Average trends for the swe100 (a) and the swe120 (b) snow indicators from 1970 to 2099 for RCP 4.5 and RCP 8.5.
Climate 11 00140 g005
Figure 6. Average trends in hours/year for the wbt-2 (a) and the wbt-5 (b) snow indicators from 1970 to 2099 for RCP 4.5 and RCP 8.5.
Climate 11 00140 g006aClimate 11 00140 g006b
Figure 7. Mean monthly distribution for the minimum temperature (blue lines), mean temperature (green lines), and maximum temperature (red lines) for the 1950 station (a) and for the 2250 station (b) for the 2009–2018 time period.
Climate 11 00140 g007
Figure 8. Mean (a) and maximum wind speed (km/h) per month (b) for the time period 2009–2018 at 1950 and 2250 stations.
Climate 11 00140 g008
Figure 9. Mean precipitation (mm) per month for the time period 2009–2018 at stations 1950 and 2250.
Climate 11 00140 g009
Table 1. Main characteristics of Greek ski resorts (SRs).
I.D.Ski ResortRegional UnitAdministrative RegionElevation (m)SlopesLifts
13–5 PigadiaImathiaCentral Macedonia1450–2005107
2Anilio metsovouIoanninaEpirus1650–1889135
3VassilitsaGrevenaWest Macedonia1788–2060127
4VelouchiEvrytaniaCentral Greece1750–2100185
5Vigla pisoderiouFlorinaWest Macedonia1600–190095
6VitsiKastoriaWest Macedonia1610–187531
7GerodovrachosBoeotiaCentral Greece185022
8ElatochoriPieriaCentral Macedonia1400–1912105
9ZiriaCorinthiaPeloponnese150022
10KaimaktsalanPellaCentral macedonia2051–2480146
11KalavritaAchaeaWest Greece1700–2340127
12OlymposLarissaThessaly2000–245033
13LailasSerresCentral Macedonia1595–184723
14MenaloArcadiaPeloponnese1550–177084
15ParnassosBoeotiaCentral Greece1640–22602313
16PertouliTrikalaThessaly1170–134033
17PilioMagnesiaThessaly1170–147175
18Politsies metsovouIoanninaEpirus1360–162042
19SeliImathiaCentral Macedonia1.500–1.9001711
20FalakroDramaEast Macedonia and Thrace1620–2232209
21Chryso elafiImathiaCentral Macedonia1540–166042
Table 2. Climate data and number of EURO-CORDEX simulations.
ParameterTime PeriodNumber of Simulations
tas1971–198024
2051–206019
tmin1971–198024
2051–206019
snc1971–198025
2051–206015
snd1971–198025
2051–206015
Table 3. Climate model simulations for the snow indicators.
Global Climate ModelRegional Climate Model
MPI-ESM-LRCCLM4-8-17
CNRM-CM5ALADIN53
CM5A-MRWRF331F
MPI-ESM-LRREMO2009
MPI-ESM-LRRCA4
CNRM-CM5RCA4
CM5A-MRRCA4
EC-EARTHRCA4
Table 4. Yearly statistical analysis of tas and tmin for the selected SRs in Greece.
SRTas
Annual
Average °C 1971–1980
Tas
Annual
Average °C 2051–2060
Tas
Difference °C
Tmin
Annual
Average °C 1971–1980
Tmin
Annual
Average °C 2051–2060
Tmin
Difference °C
VASSILITSA6.587.981.392.504.211.71
VELOUCHI8.299.981.694.456.371.92
MENALO8.6210.481.864.676.802.12
PARNASSOS8.7710.611.844.937.152.23
PILIO13.3414.621.289.8011.181.38
FALAKRO8.2510.292.043.846.292.46
3–5 PHGADIA7.769.391.633.705.7620.6
Table 5. Statistical analysis of tas and tmin for the selected SRs in Greece from December to April.
SRTas
Dec–Apr
Average °C
1971–1980
Tas
Dec–Apr
Average °C
2051–2060
Tas
Difference °C
Tmin
Dec–Apr
Average °C
1971–1980
Tmin
Dec–Apr
Average °C
2051–2060
Tmin
Difference °C
VASSILITSA0.162.282.12−3.16−1.401.76
VELOUCHI2.104.312.21−0.940.741.68
MENALO2.585.032.44−0.461.461.92
PARNASSOS2.455.062.61−0.711.482.19
PILIO7.018.841.843.965.021.05
FALAKRO1.334.383.05−2.390.232.63
3–5 PHGADIA1.073.572.51−2.27−0.122.15
Table 6. Yearly statistical analysis of snc and snd for the selected SRs in Greece.
SRSnc
Annual Average %
1971–1980
Snc
Annual Average %
2051–2060
Snc
Relative Change
%
Snd
Annual Average m
1971–1980
Snd
Annual Average m
2051–2060
Snd
Relative Change
%
VASSILITSA15.489.96−36%0.040.02−53%
VELOUCHI6.674.21−37%0.010.00−38%
MENALO4.982.51−49%0.010.00−53%
PARNASSOS6.984.39−37%0.010.01−44%
PILIO1.771.14−35%0.000.00−12%
FALAKRO5.052.72−46%0.010.00−69%
3–5 PHGADIA10.526.20−41%0.030.01−54%
Table 7. Statistical analysis of snc and snd for the selected SRs in Greece from December to April.
SRSnc
Dec–Apr
Average %
1971–1980
Snc
Dec–Apr
Average % 2051–2060
Snc
Relative Change
%
Snd
Dec–Apr
Average m
1971–1980
Snd
Dec–Apr
Average m
1971–1980
Snd
Relative Change
%
VASSILITSA34.2722.27−35%0.100.04−54%
VELOUCHI15.089.58−36%0.030.01−37%
MENALO11.495.79−50%0.020.01−53%
PARNASSOS15.7910.02−37%0.040.02−44%
PILIO4.072.65−35%0.000.00−10%
FALAKRO11.566.20−46%0.040.01−68%
3–5 PHGADIA23.3213.92−40%0.070.03−54%
Disclaimer/Publisher’s Note: The statements, opinions and data contained in all publications are solely those of the individual author(s) and contributor(s) and not of MDPI and/or the editor(s). MDPI and/or the editor(s) disclaim responsibility for any injury to people or property resulting from any ideas, methods, instructions or products referred to in the content.