1. Introduction
South-East Asia’s tropical rainforests are experiencing the highest rate of deforestation worldwide and fire is one of the most important drivers of forest loss and subsequent carbon dioxide emissions [
1]. Indonesia has one of the highest rates of deforestation and forest degradation in the world [
2]. The main causes are agricultural expansion and timber extraction as well as the increasing incidences of forest fires [
3,
4,
5]. Indonesian peatlands store an estimated 57 Gt of carbon, 55% of the world’s tropical peatland carbon [
6,
7]. Indonesia’s peatlands have been extensively degraded and peatland fires are on the rise.
Peatland fires make a major contribution to emissions of greenhouse gases, fine particulate matter, and aerosols, thus contributing to climate change as well as presenting a problem for human health [
8]. The areas affected by the fires in 1997–98 and 2015 under very strong El Niño conditions were estimated at about 9.7 Mha [
9] and about 2.6 Mha [
10], respectively. The Indonesian fires in 1997 released more than 870 Tg of carbon into the atmosphere, which was equivalent to 14% of the average global annual fossil fuel emissions released during the 1990s [
11]. Peat fires in Indonesia during July–October 2015 released about 2 Tg of carbon into the atmosphere, 81% of which was in the form of carbon dioxide (CO
2), 16% carbon monoxide (CO), and 2.3% methane (CH
4) [
12]. Fine particulate matter (PM2.5) emissions from fires across Sumatra and Kalimantan (Borneo) during September–October 2015 were estimated at 7.33 Tg [
13].
In Sumatra, recurring peatland fires have resulted in severe economic and social impacts for local people along with globally significant environmental impacts. The greenhouse gas (GHG) emissions during the June peatland fires in 2013 were considerable, 172 ± 59 Tg CO
2 -eq (or 31 ± 12 Tg C), and represented 5–10% of Indonesia’s mean annual GHG emissions for 2000–2005 [
14]. Haze from these June peatland fires in 2013 in Sumatra made the worst air pollution episode ever recorded in Singapore (24 h pollutants standards index reached an all-time record 246 (rated ‘‘very unhealthy’’)) [
14,
15].
Under climate change, Indonesia is predicted to experience temperature increases of approximately 0.8 °C by 2030 and will exceed 1.5 °C in the near term (2021–2040) [
16]. Moreover, rainfall patterns are predicted to change, with the rainy season ending earlier and the length of the rainy season becoming shorter. Warming temperatures and rainfall trends in Indonesia have been reported to support this prediction. Estimates from the Berkeley Earth dataset suggest that annual mean temperatures in Indonesia were typically about 0.8 °C above the 1951–1980 baseline for the 2010–2017 period. Since 1960, hot days and nights have increased by 88 days and 95 nights per annum, respectively, especially during the summer months of July–September [
16]. Studies have noted an overall decrease in the average annual precipitation [
17]. Rising sea temperatures could increase the frequency of El Niño events and intensify droughts [
18,
19]. Thus, fires in Indonesia will increase under warmer conditions in near future.
Nevertheless, fire weather in Indonesia has not been clarified. There are few papers on fire weather. Most papers have explained the activities of the fires using rainfall data to evaluate drought conditions related to groundwater level (GWL) and the El Niño-Southern Oscillation (ENSO). A. Sulaiman et al. (2023) analyzed the teleconnection relationship between groundwater levels (GWL) and extreme climatic conditions such as ENSO and positive Indian Ocean Dipole (IOD+). They showed that the dropped sea surface temperature anomaly induced by anomalously easterly winds along the Southern Java-Sumatra occurs several weeks before the GWL dropped to the lowest value [
20]. Another study using rainfall data in Kalimantan proposed that seasonal precipitation forecasts should be central to Indonesia’s evolving fire management policy, derived from their analysis of long, up-to-date series observations on the burnt area, rainfall, and tree cover [
21].
To assess future fire activities under climate change, fire weather conditions should be clearer by using fundamental weather parameters such as temperature, air pressure, wind speed, and direction. However, we could not clear fire weather conditions in Indonesia, including Sumatra, due to the large diurnal variations in the tropics of using weather maps and the lack of reliable and long-term hourly weather data at near active fire regions. Fortunately, we found hourly data for several locations in Indonesia. We have already analyzed the peatland fires in Papua and Central Kalimantan and submitted reports on their fire weather conditions [
22,
23].
The objective of this study is to determine the fire weather in the fire-prone areas of Sumatra. For this purpose, preliminary analysis using weather data (temperature, relative humidity, wind speed, and wind direction) every 30 or 60 min from midnight (12 am) measured at several local airport weather stations was carried out to clear fire weather conditions in Sumatra. We also used 20 years (2003–2022) of satellite-observed fire (hotspot) data to clarify the peatland fire occurrence trend in Sumatra.
2. Materials and Methods
2.1. Study Area
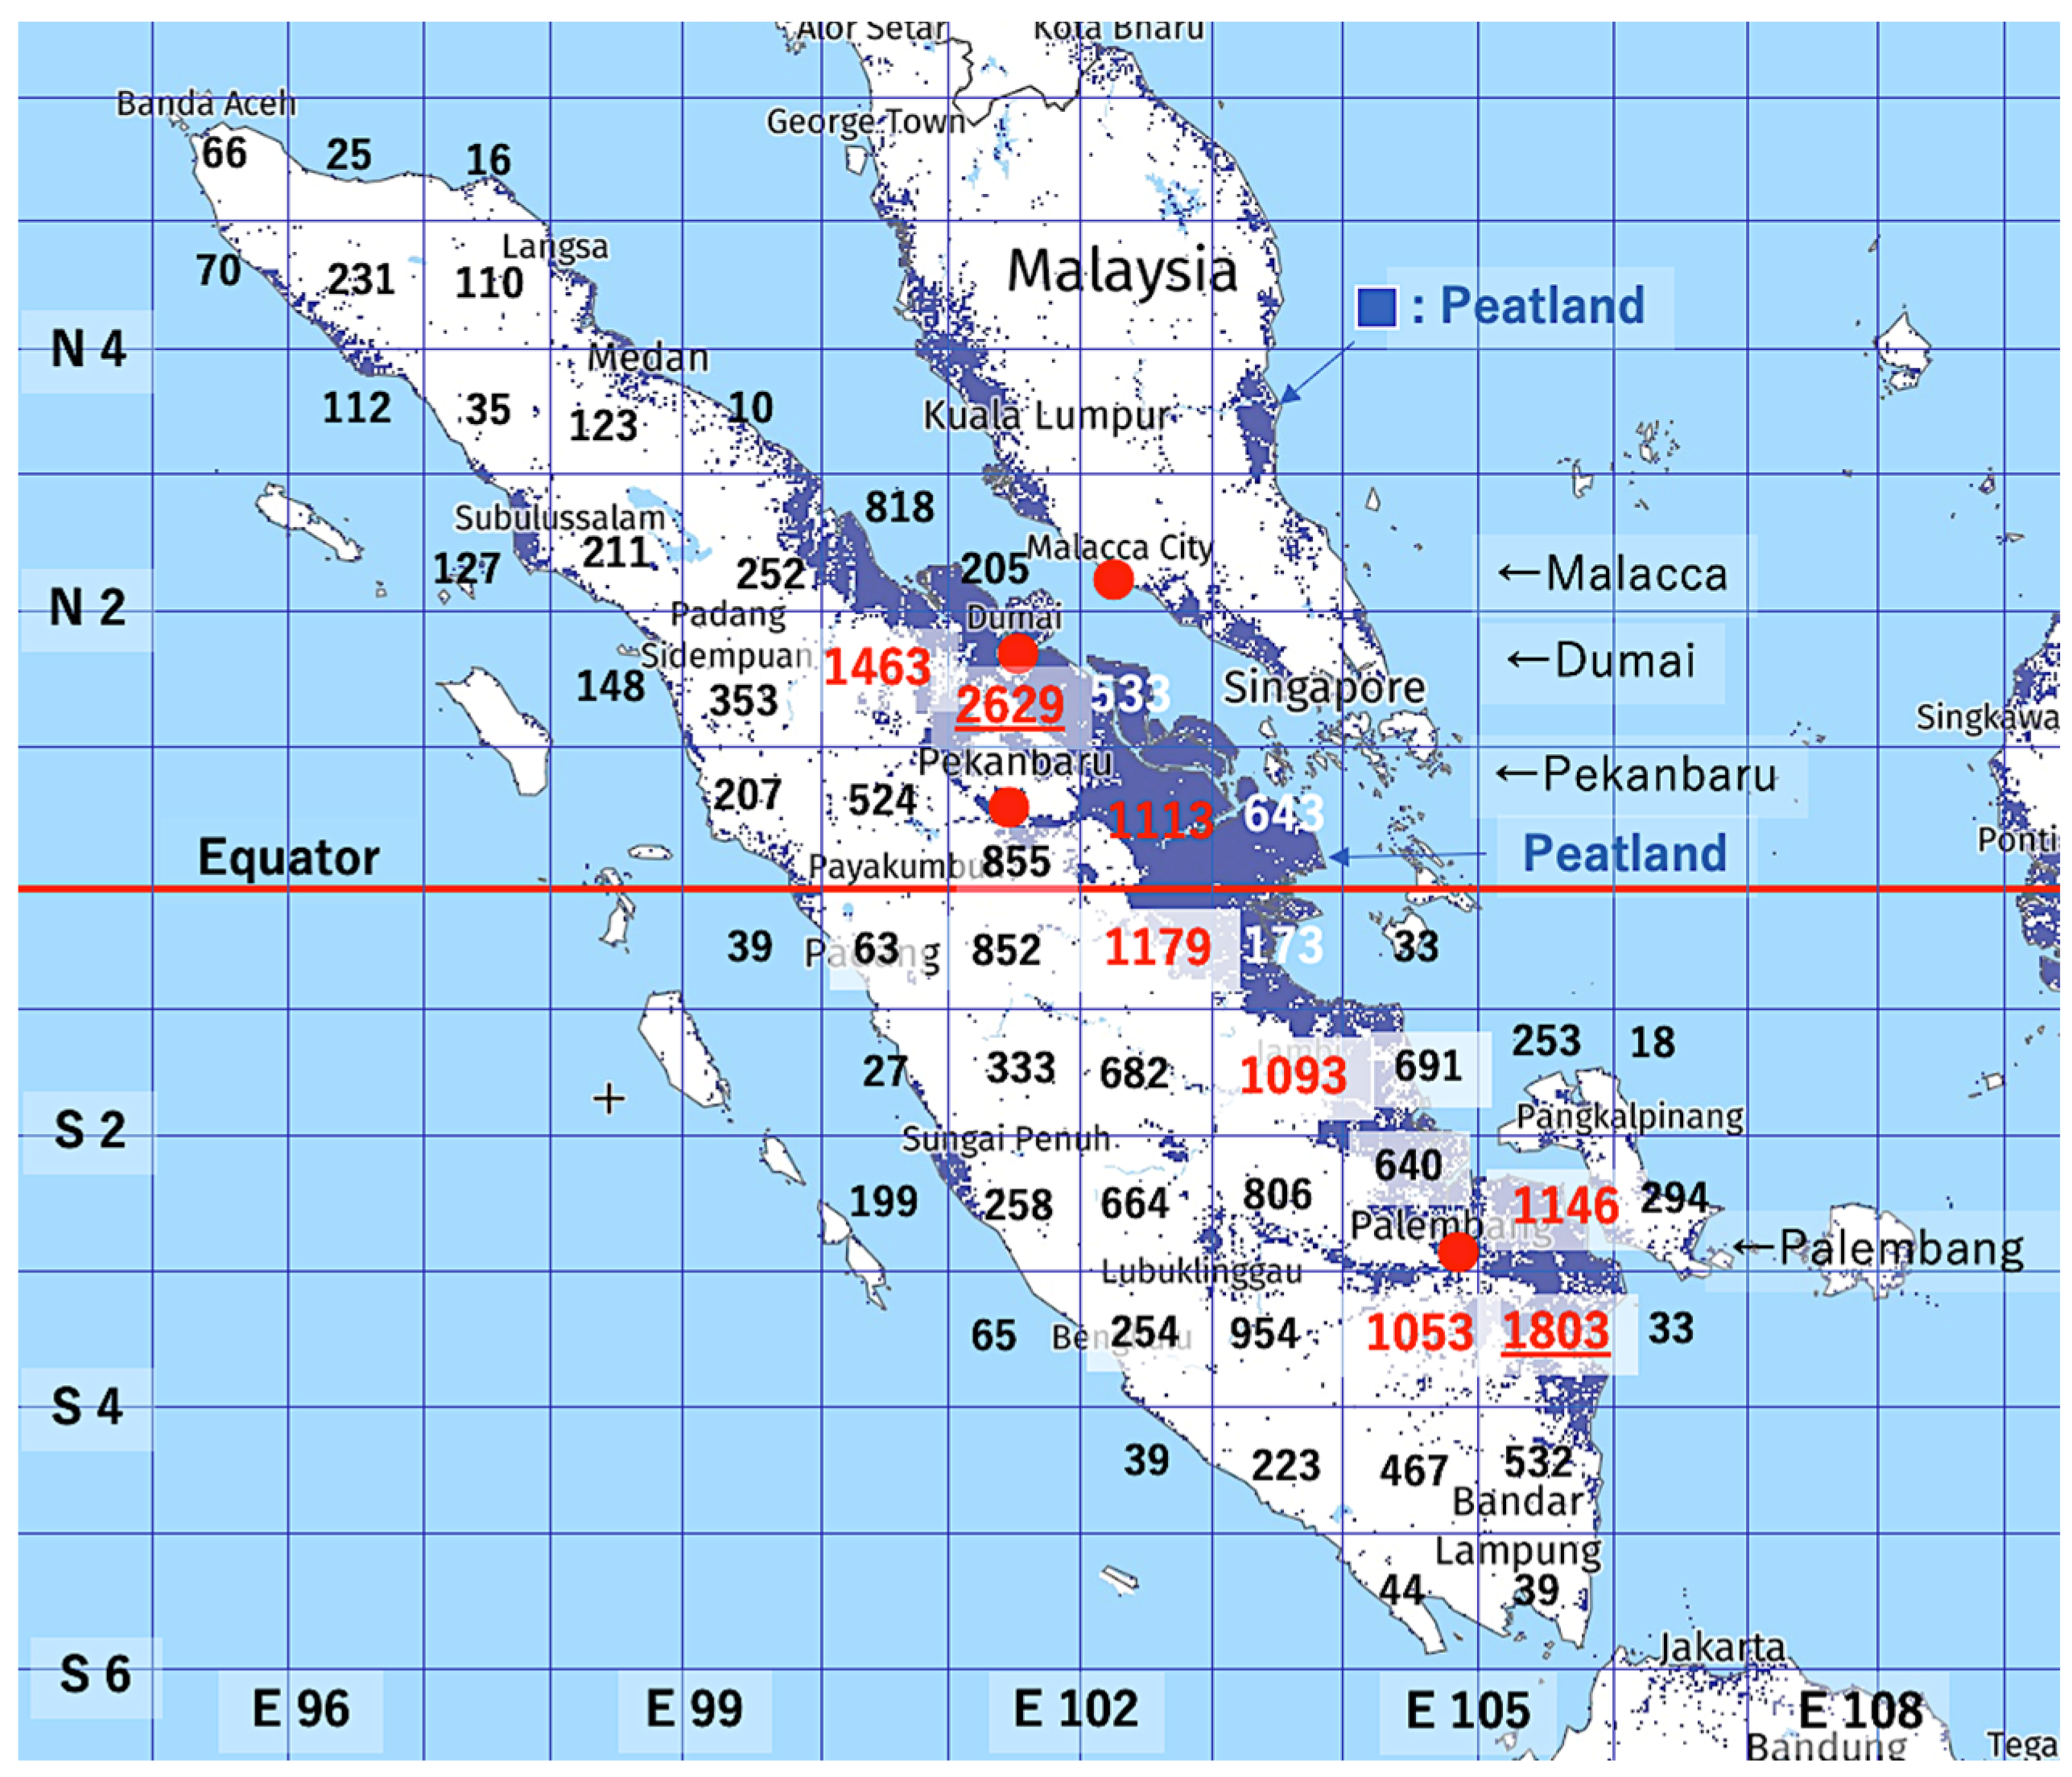
The study area is Sumatra Island and covers the latitude range from about 6° S (South latitude) to 6° N (North latitude) and the longitude range from about 95° to 107° E (East longitude) as shown in
Figure 1. The island is the sixth largest island in the world, with an area of 475,807.63 km
2, 1790 km long from Northwest to Southeast, and a maximum width of 435 km. Peatland in Sumatra is about 6.4 Mha (Riau province: 3.9 Mha (60%), South Sumatera province:1.2 Mha (20%)) and covers 11% of the total land area [
24].
2.2. Fire Hotspot (Hotspot) and Weather Data
The hotspot (HS) data of 20 years, from 1 July 2003 to 31 December 2022, detected by the Moderate Imaging Resolution Spectroradiometer (MODIS) on the Terra and Aqua satellites were used to evaluate wildfires in Sumatra. The MODIS HS data were obtained from the NASA Fire Information for Resource Management System
https://firms.modaps.eosdis.nasa.gov/download (accessed on 15 January 2023) with a pixel resolution of 1 km. The number of daily HSs is used to identify fire season, active fire period, and the dates of major HS peaks during the fire periods.
Various daily weather maps, such as pressure, wind, temperatures of 500 hPa, 850 hPa, and 925 hPa, sea surface temperature (SST), and each of those anomalies, were obtained from the NCEP/NCAR 40-year reanalysis data (
https://psl.noaa.gov/data/composites/day/, accessed on 15 January 2023). We analyzed these to find fire–weather conditions during active fire periods, fire-related synoptic-scale circulation patterns, rainy conditions, STT, etc. The coverage and spatial resolution of the NCEP reanalysis data are geographic longitude and latitude: 0.0°–358.125° E, 88.542°–88.542° N, spatial resolution: about 2.5° × 2.5°, period and temporal resolution: 1 January 1948 to present. The Long-term means (climatologies) are based on 1991–2020.
Daily rainfall data for the Dumai area (set at 1.66° N, 101.45° E) for 20 years from 2003 to 2022 were obtained from the JAXA (
https://sharaku.eorc.jaxa.jp/GSMaP_CLM/index.htm, accessed on 15 January 2023). The JAXA rainfall data are generated with information from multiple precipitation-observing satellites and geostationary meteorological satellites.
Weather data (temperature, relative humidity, wind speed, and wind direction) in Palembang (2.88° S, 104.69° E), Pekanbaru (0.45° N, 101.44° E), Medan (3.57° N, 98.68° E), and Malacca (2.25° N, 102.25° E) are obtained from the weather underground (
https://www.wunderground.com/history/daily/id/banjarbaru/WAOO/date/2015-9-15, accessed on 15 January 2023), and 30 min increments from midnight (12 AM) in the Banjarbaru airport weather station (3.45° S, 114.74° E) are obtained from the weather underground (
https://www.wunderground.com/history/daily/id/banjarbaru/WAOO/date/2015-9-15, accessed on 15 January 2023).
Outgoing longwave radiation (OLR, NOAA) measured by the Atmospheric Infrared Sounder (AIRS) on the EOS Aqua (the second Earth Observing System polar-orbiting platform) was obtained through “EOSDIS Worldview (NASA)” (
https://worldview.earthdata.nasa.gov, accessed on 26 February 2023) and used to show their correlation with fires in Sumatra. Outgoing longwave radiation (OLR–MC, JMA) is a rain-related index derived from outgoing longwave radiation (OLR) issued by the Japan Meteorological Agency (JMA). (
http://www.data.jma.go.jp/gmd/cpd/db/diag/emi/emi.html, accessed on 26 February 2023).
2.3. Analysis Methods
The MODIS hotspot (HS) data from 20 years (2003–2022) are used to clarify the spatio-temporal structure of peatland fires in Sumatra. The distribution of fires was determined by setting the 1-degree grid cell (1° × 1°, latitude and longitude) as shown in
Figure 1. The daily hotspot (HS) data are used to show fire activities, annual fire history, fire-prone areas, fire season, and active fire periods in Sumatra.
Daily rainfall data for 20 years (2003–2022) of Dumai are used to explain different fire activities in North Sumatra under similar drought conditions in 2005 and 2015 (top fire year). Rainfall patterns in 2005 and 2015 are used for both years.
Based on the daily HSs and rainfall data, three types of peatland fire could be defined: Surface fires (SF, GWL= 0 to −300 mm), shallow peatland fires (SPF, GWL= −300 to −500 mm), and deep peatland fires (DPF, GWL= lower than −500 mm) [
20,
24,
25,
26,
27].
The weather data (temperature, relative humidity, wind speed, and wind direction) of every 30 or 60 min from midnight (12 AM) in Palembang, Pekanbaru, Medan, and Malacca are used for diurnal fire weather conditions during the active fire periods in 2005 (El Niño year), 2014, 2015, and 2021 (La Niña year).
Analysis using various synoptic scale weather maps at various air levels (1000, 925, 850, and 500 hPa) are also used to grasp fire weather conditions during the active fire periods.
The NOAA composite weather maps are used to identify the presence and location of high pressure, low pressure, sea surface temperature, wind speed and direction, wind vector, and their anomalies (1991–2020 climatology).
The Niño 3.4 index, Sea Surface Temperature Anomaly (SSTA), Outgoing longwave radiation (OLR-NOAA), and Outgoing longwave radiation (OLR–MC) are used to show their correlation with fire activities in Sumatra.
3. Results
3.1. Fire and Peatland Distribution
Fire and peatland spatial distribution on the Sumatra Island is shown in
Figure 1. A grand total of 521,676 hotspots (HSs) were detected from 2003 to 2022. The numbers of each grid cell (1° × 1° resolution) show the average HSs of the last 20 years. A Large average number of HSs (>1000), or frequent fire areas shown by red-colored numbers, are found mostly in the peatland area (the East side of Sumatra Island). The highest number of HSs is 2629 in a Dumai grid cell and the second one (HSs = 1803) is in a grid cell Southeast of Palembang.
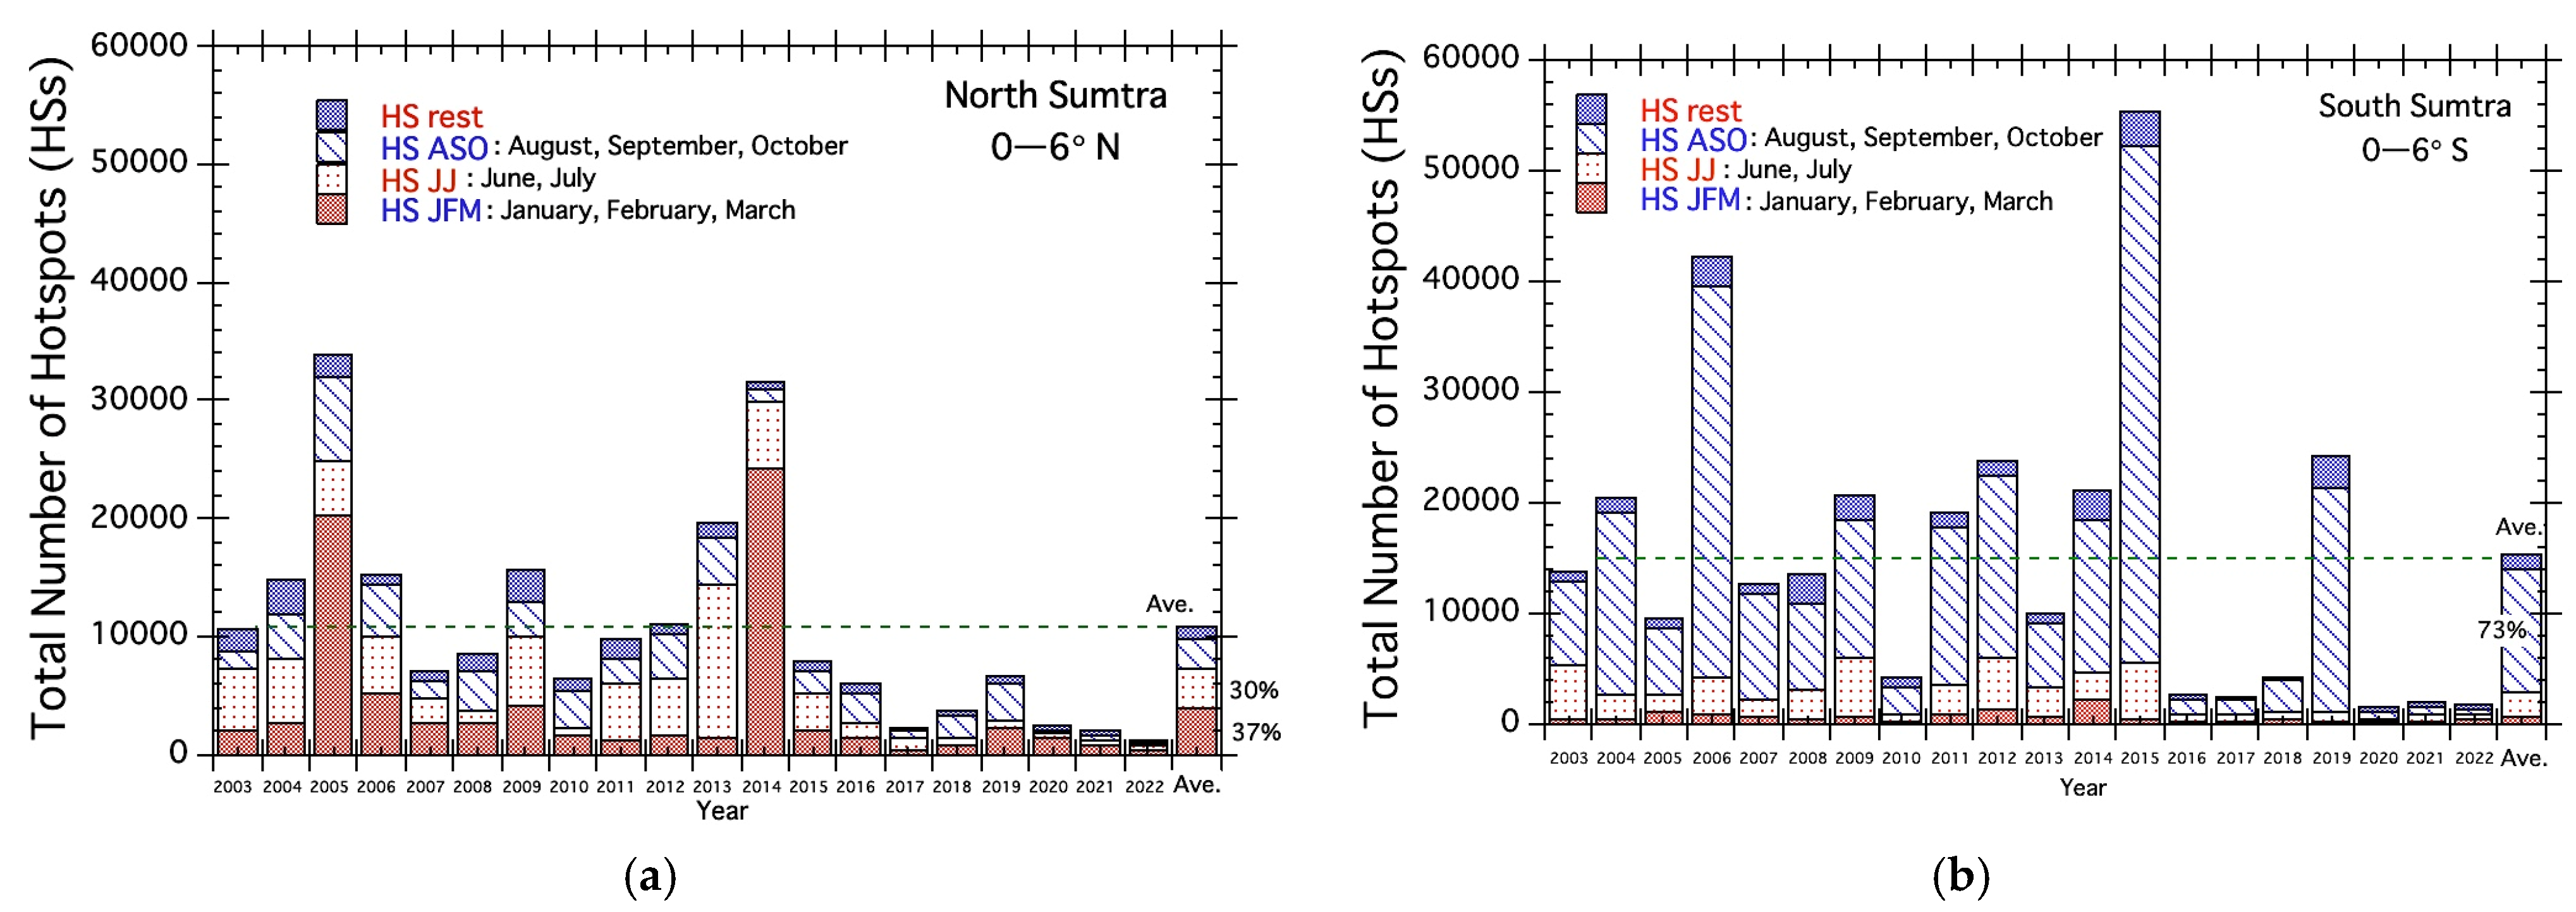
3.2. Fire History in North and South Sumatra
Figure 2 shows the recent fire history from 2003 to 2022 in North and South Sumatra. The number of HSs in several years exceeds the average annual value (green straight lines in
Figure 2) and will be referred to as “fire year” in this report. From
Figure 2a, the top and second fire years in North Sumatra are 2005 and 2014. In South Sumatra, the top and second fire years are 2006 and 2015. Each bar graph in
Figure 2 is divided into four and shows the fire seasons. For North Sumatra, the main fire season is from January to March (see red dotted bar graph in
Figure 2a). In contrast, the main fire season in South Sumatra is from August to October (see blue colored diagonal bar graph in
Figure 2b).
3.3. Fire Season
Fires in Sumatra, as in the rest of Indonesia, are occurring under drought during the dry season. In North Sumatra (>0° N), large fires occurred when droughts intensified during the four dry seasons. In South Sumatra (<0° S), when droughts intensify in the dry season, large fires occur during the one dry season from August. Therefore, this report totally analyzes the four large fires from January to August, including one unique fire in June in North Sumatra due to the Typhoon [
28].
3.3.1. North Sumatra
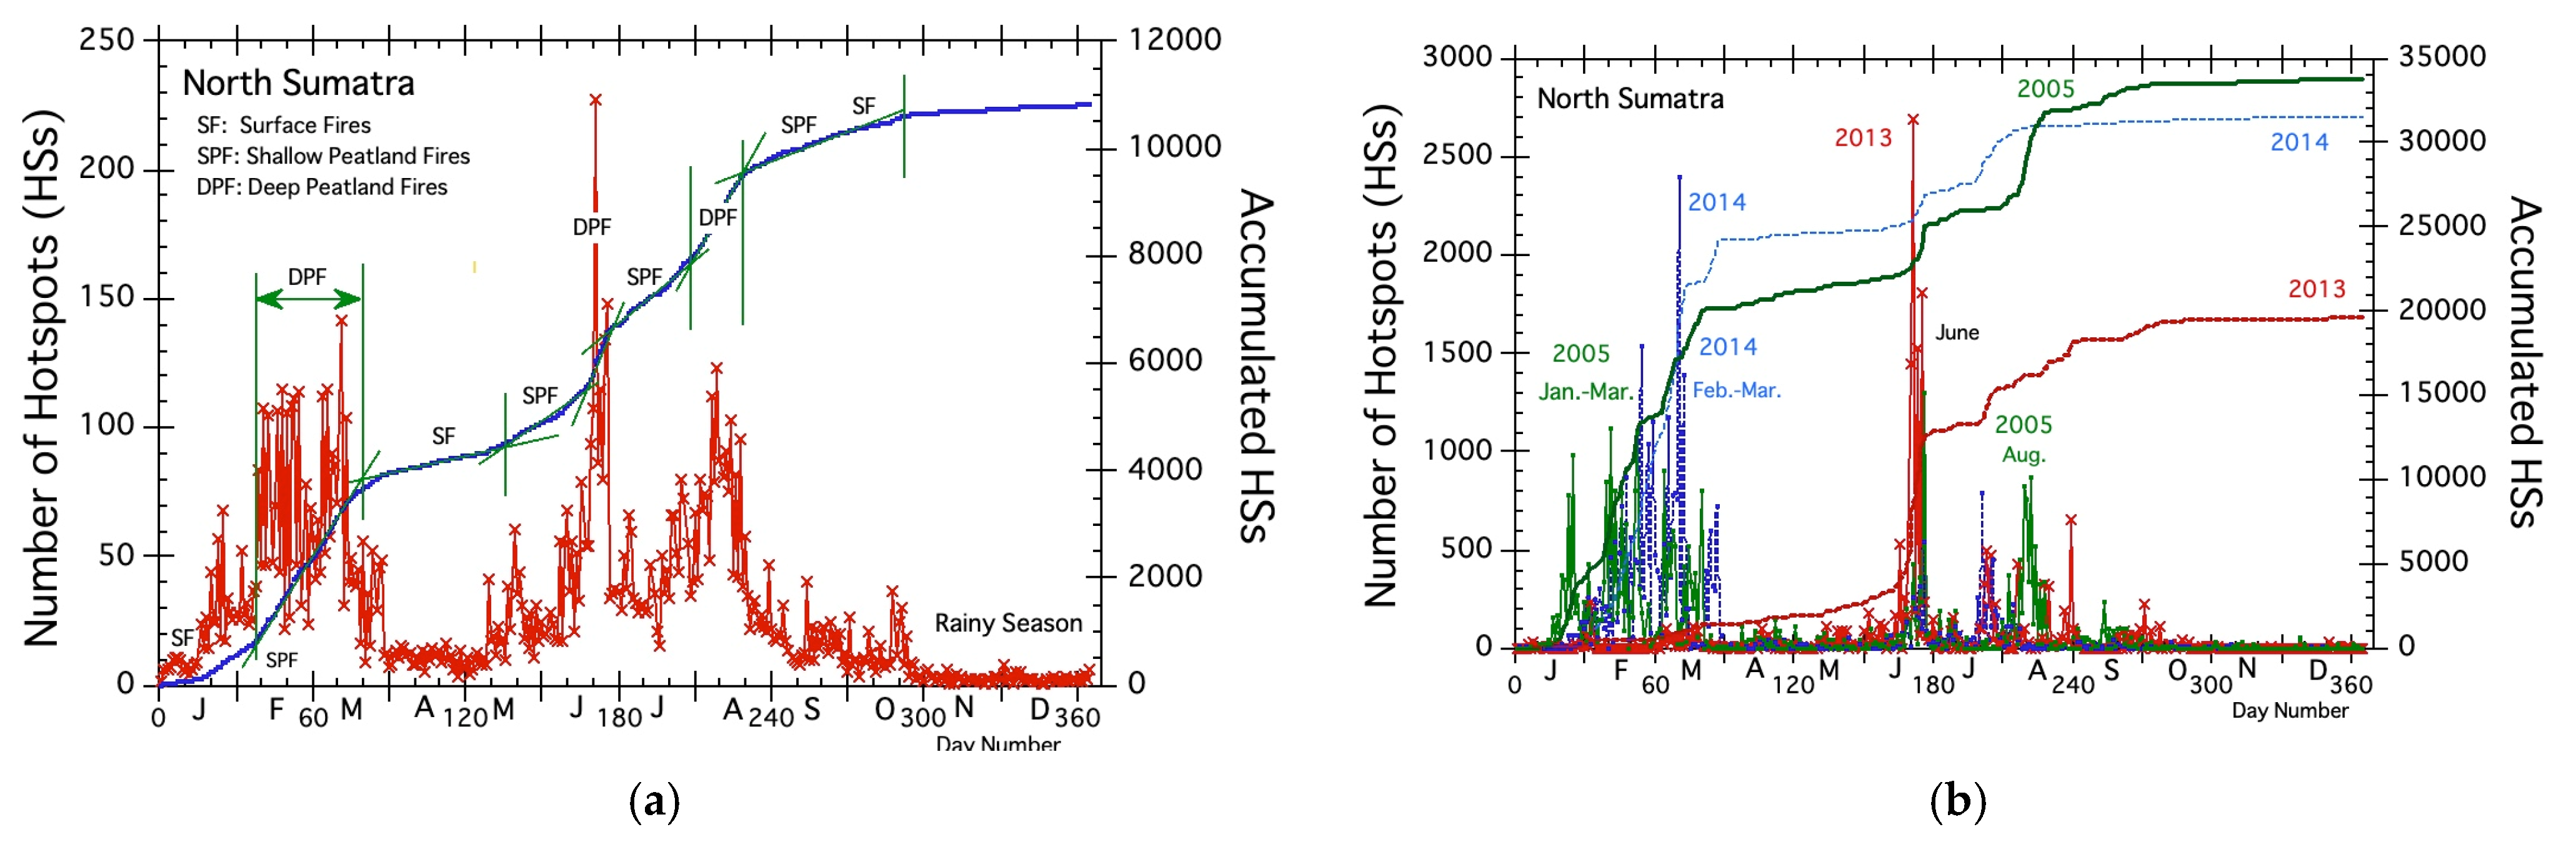
To clarify the fire season in North Sumatra, the fire occurrence of 20 years average is shown in
Figure 3a. From the fire occurrence trend in
Figure 3a, we may say fires in North Sumatra last about 10 months from January to October. To find the fire season of very active peatland fires, we applied our evaluation method obtained on Kalimantan Island [
26,
27]. We could define three fire stages, called surface fires (SF), shallow peatland fires (SPF), and deep peatland fires (DPF). The different fire activities of the three fire stages come from the groundwater level (GWL). SF starts just after the GWL is less than 0 mm. The other two GWL boundary values are about −300 mm and about −500 mm. With the help of the thin green straight lines on the accumulated HS curves in
Figure 3a, we could define the three fire stages. The largest gradients of straight lines show the period of the most active fires, DPF, and occur in February, March, June, and August.
Figure 3b shows the fire occurrence trends for the top three years, 2005, 2014, and 2013. In 2005, the top fire year, active fires occurred in each of the three fire periods (January to March, June, and August). In 2014, the second fire year, the active fires occurred mainly in February, March, June, and July. In 2013, the third fire year, the active fires occurred mainly in June.
3.3.2. South Sumatra
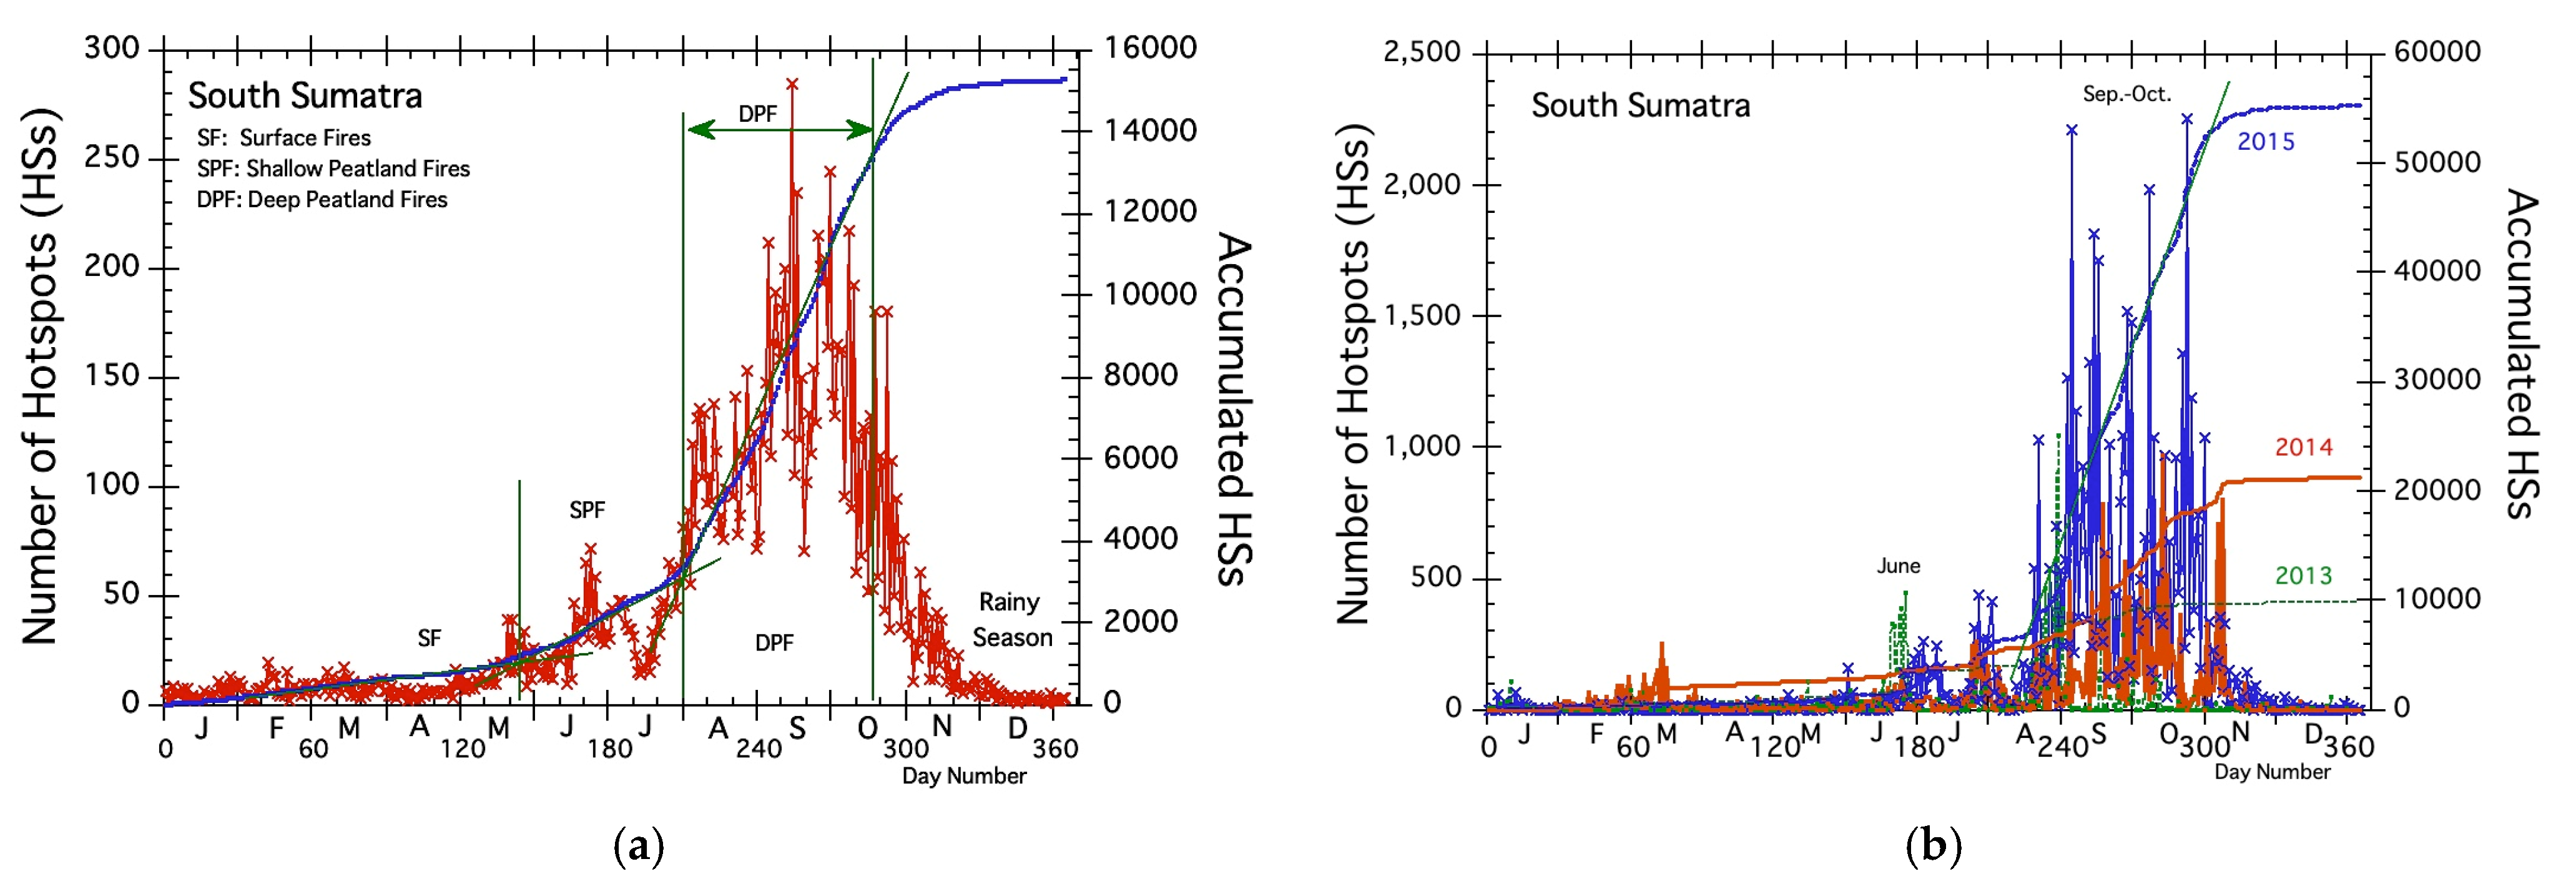
To clarify the fire season in South Sumatra, the fire occurrence for the 20-year average is shown in
Figure 4a. From the fire occurrence trend in
Figure 4a, we may say fires in South Sumatra last about 11 months from January to November. The HS accumulation curve in
Figure 4a shows that surface fires (SF) begin in early January and shallow peatland fires (SPF) start at the end of July. Then, deep peatland fires (DPF) become very active in August and last until October.
Figure 4b shows the fire occurrence trends for the top three years, 2015, 2014, and 2013. In 2015, the top fire year, the active fires occurred from the middle of August and lasted until October. In 2014, the second fire year, the active fires occurred from the middle of August and lasted until early November. However, its fire rate is not as high as that of 2005. In 2013, the third fire year, the active fires occurred mainly in June and August. The June fires in 2013 may be due to the Typhoons, much like the June fires in North Sumatra.
3.4. Fire Weather Conditions in North Sumatra
To clarify the fire weather conditions in North Sumatra, we analyze the diurnal range of air temperature, relative humidity, wind speed, and wind direction during three very active fire periods in the top three years (2015, 2014, and 2013) in this section.
3.4.1. Comparison of January–March Fires in 2005 and 2015
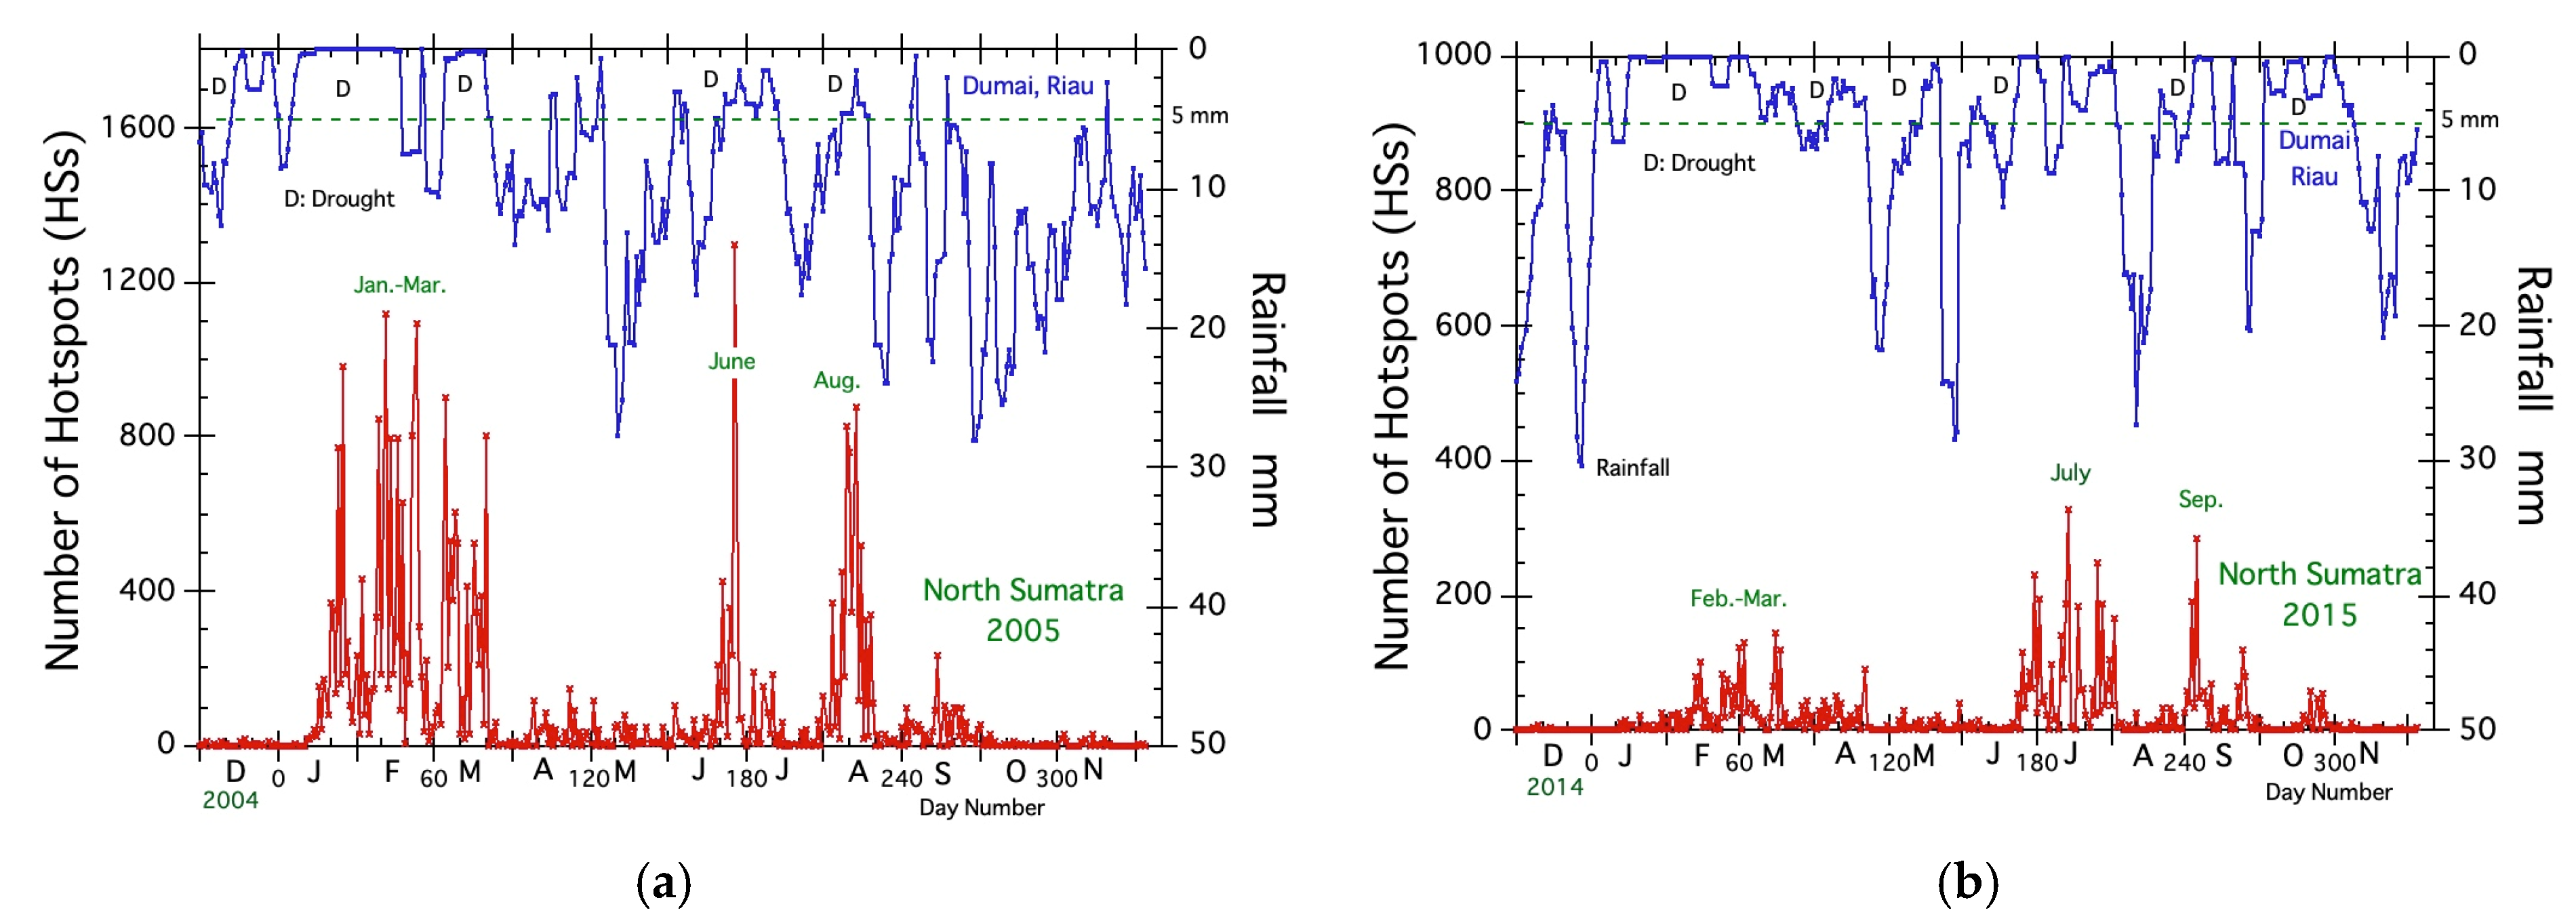
To explain the fire weather conditions of the very active fires in 2005, we compared those with fires in 2015. The total number of hotspots (HSs) are 33,799 in 2005 and 7922 in 2015 (the eleventh fire year in North Sumatra).
Figure 5 shows the daily HSs and rainfall in 2015 (El Niño year) and 2015 (neutral year). Although the drought period from February to March is nearly the same in both years, there are significant differences in fire activity. In 2005, there are many active fire days (daily HSs of more than 400). In contrast, most daily HSs in 2015 are less than 150.
To clarify the differences in fire activity, we added rainfall in December of the previous year in
Figure 5.
Figure 5b shows a considerable amount of rainfall in December 2014. The total rainfall in December of 2014 and 2004 is 148.7 and 460.2 mm, respectively. This difference in rainfall, about 310 mm, makes a significant difference in fire activity in both years. In particular, there is a difference of about 10 times in the number of fires in February.
Next, we analyze the diurnal range of weather conditions during the very active fire periods in 2005 and compare those of the same period in 2015 measured in Malacca. There are two reasons why we used data from Melaka. The first reason is that the Dumai data does not include the year 2005. The second reason is that the data from Pekanbaru was affected by haze from the peatland fire and the temperatures did not change much under the windless conditions. Similar weather conditions are expected from Dumai to Malacca, which is only about 110 km across the Malacca straits (the narrowest strait is about 40 km wide near Dumai, see
Figure 1).
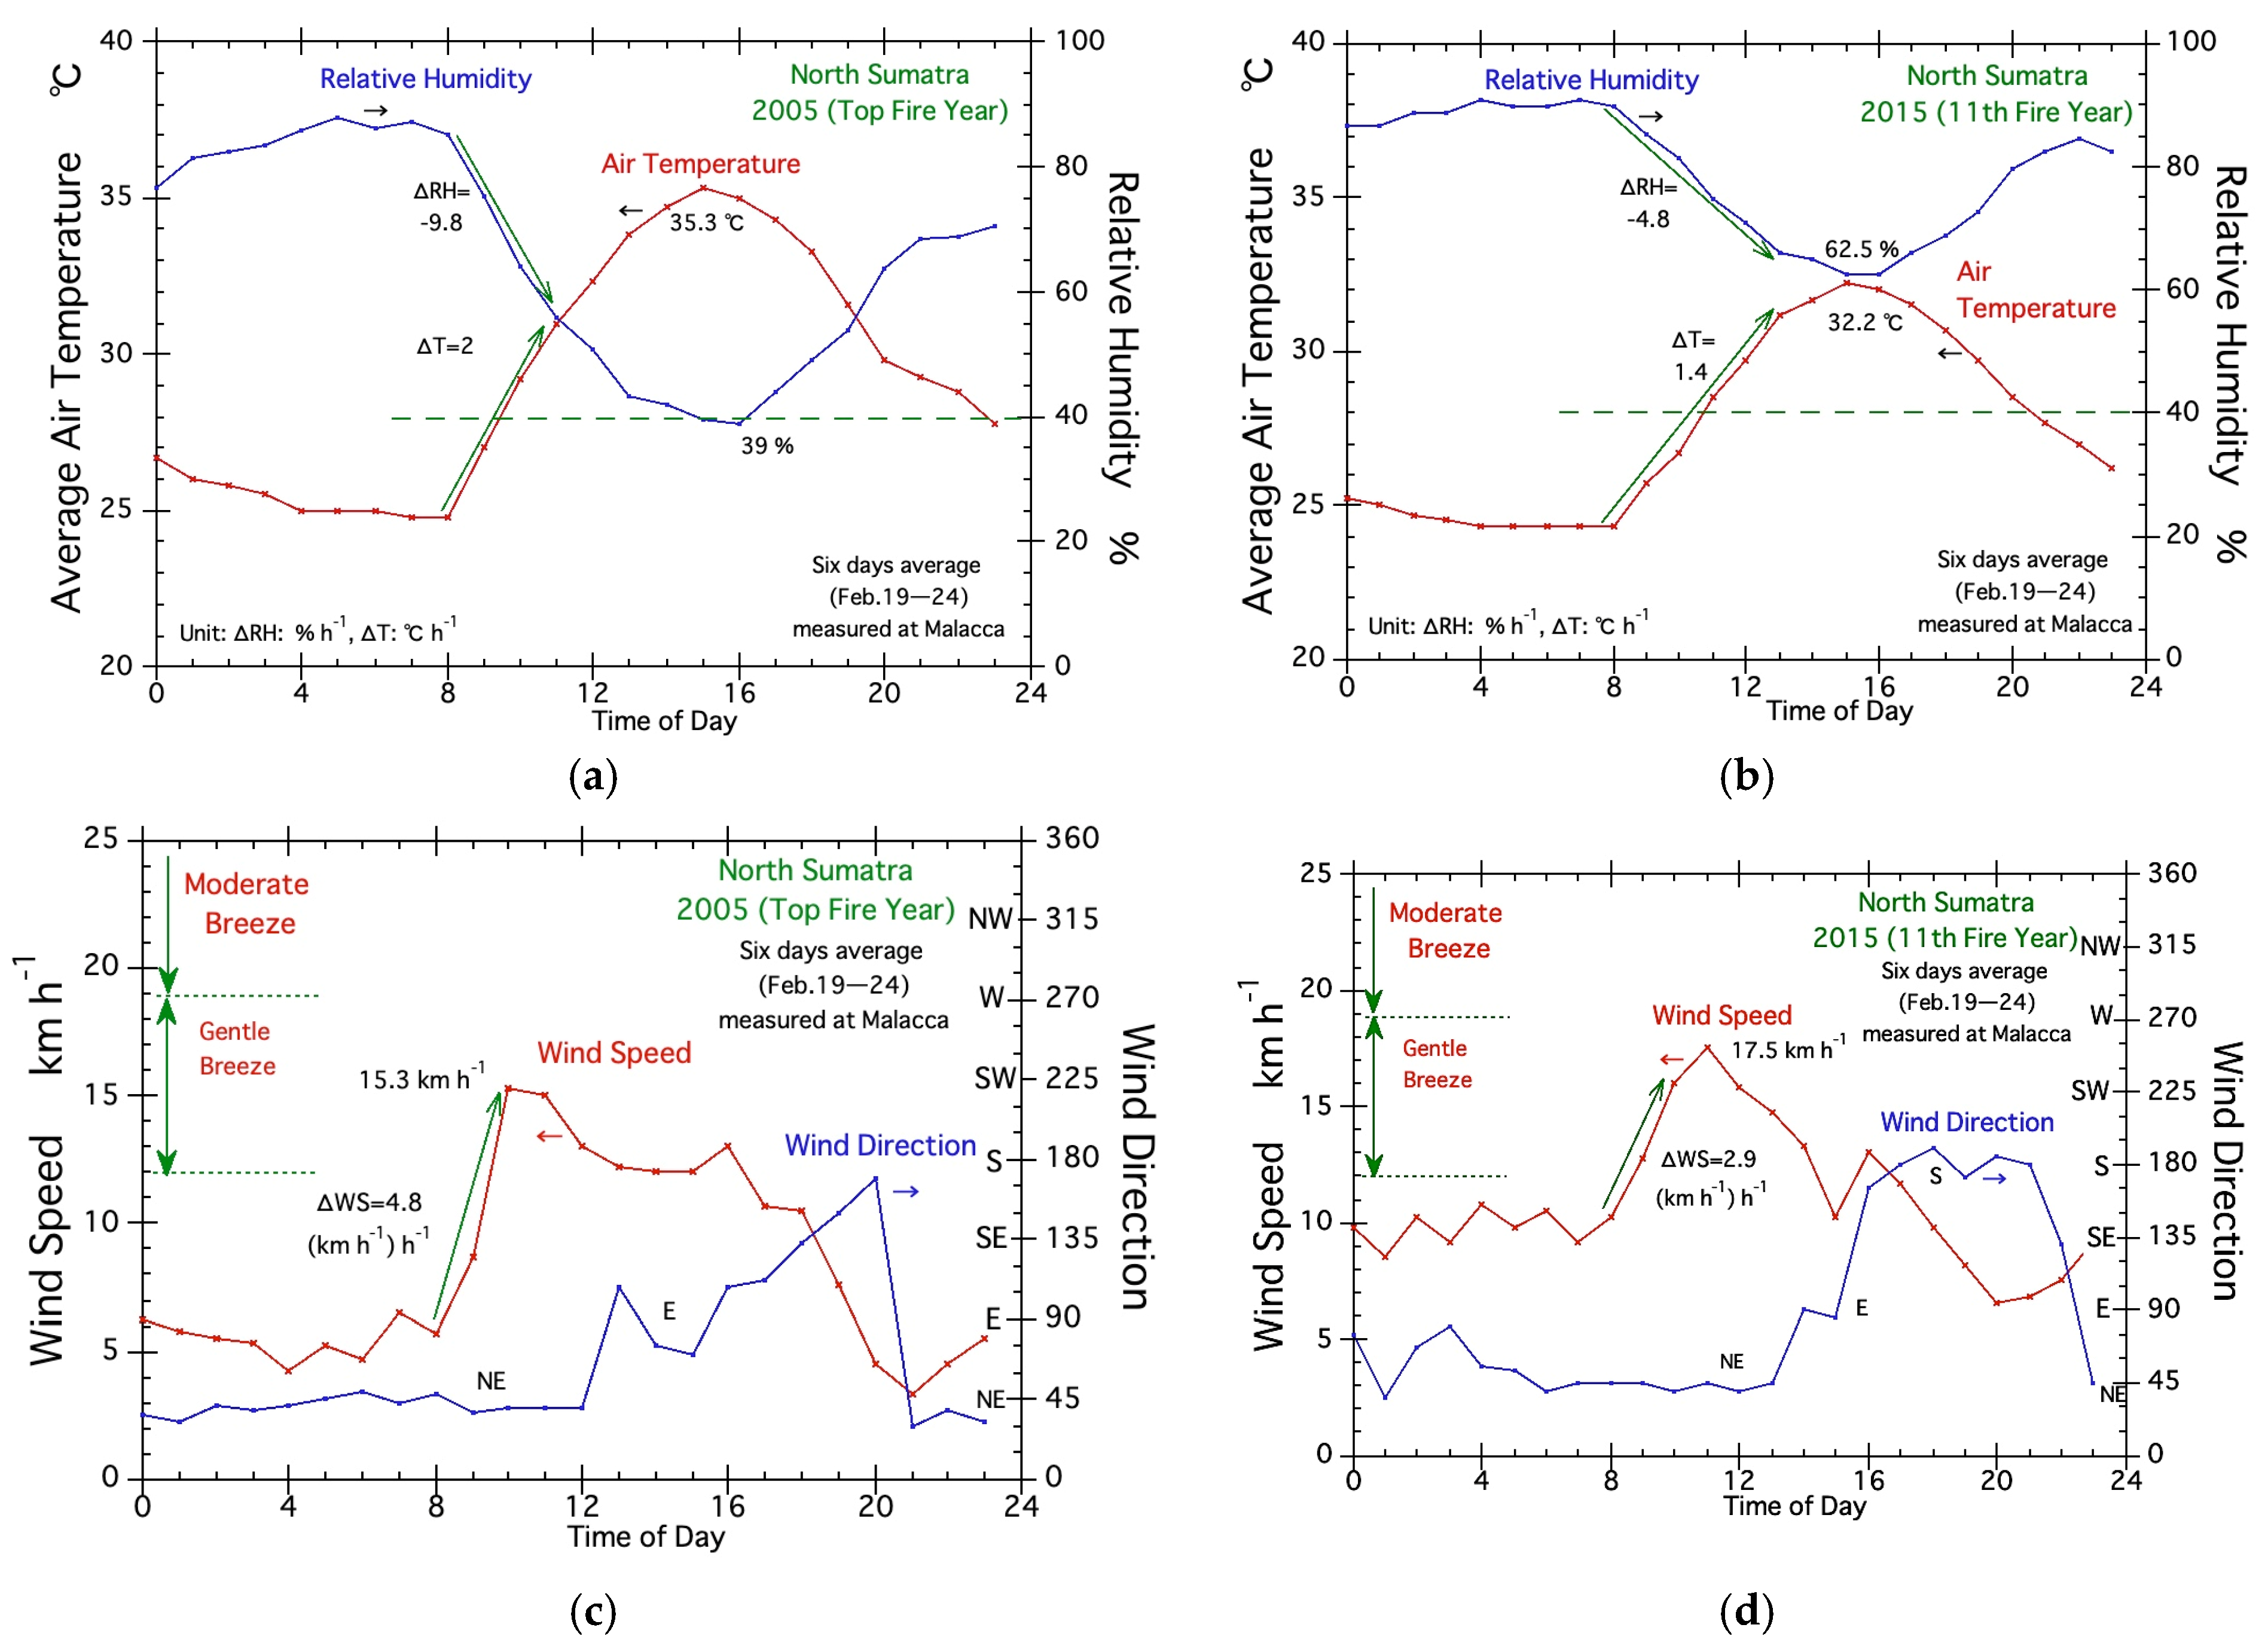
To find the fire-prone weather conditions in January, February, and March, we used the weather data for every hour from midnight (12:00 AM) from February 19th to 24th measured in Malacca. This period contains the largest and second large HSs’ peak day (1093 HSs on February 22nd) in 2005. The total number of data was 144 (=6 days × 24 (every hour)). Data for the same period in 2015 is used for comparison.
Figure 6a and b show the average air temperature and average relative humidity (RH) in 2005 and 2015 respectively. The X-axis is the time of day.
Figure 6a,b show that the average maximum air temperature in 2005 was 35.3 °C, at 15:00, which is higher than that of about 32.2 °C at 15:00 in 2015. There is a relatively large difference in the average RH in 2005 and 2015. A total of 39% at 16:00 in 2005 (
Figure 6a) is considerably lower than that of about 62.5% in 2015 (
Figure 6b).
In addition to these differences, there are also differences in the temperature increase rate (ΔT) and the RH decrease rate (ΔRH) from 8:00 to 11:00 in the morning as indicated by the auxiliary lines in
Figure 6a,b. The ΔT and ΔRH in 2005 are 2 °C h
−1 and −9.8% h
−1. Both values are larger than the corresponding values of 1.4 °C h
−1 and −4.8% h
−1 in 2015. After these large morning changes, the air temperature rose to 35.3 °C and the RH dropped below 40% in 2005. In contrast, the air temperature in 2015 did not rise much and the RH was over 60%.
Figure 6c and d shows the average wind speed and direction in 2005 and 2015. The wind speed of both years tends to rise in the morning, reaches its highest speed around noon, and slows down in the evening. This trend shows a feature of the sea breeze, which intensifies mainly due to the relatively large temperature difference between land and sea.
The average wind speed and direction in
Figure 6c show that the maximum wind speed of the Northeasterly wind in 2005 is 15.3 km h
−1 at 10:00. In 2015, the maximum wind speed is 17.5 km h
−1 at 11:00 and higher than that in 2005. The fact that fires in 2015 did not activate under the strong winds suggests that the peatlands were moist. The wind directions in 2005 and 2015 are dominated by the Northeastern winds, suggesting that they were the prevailing winds in February.
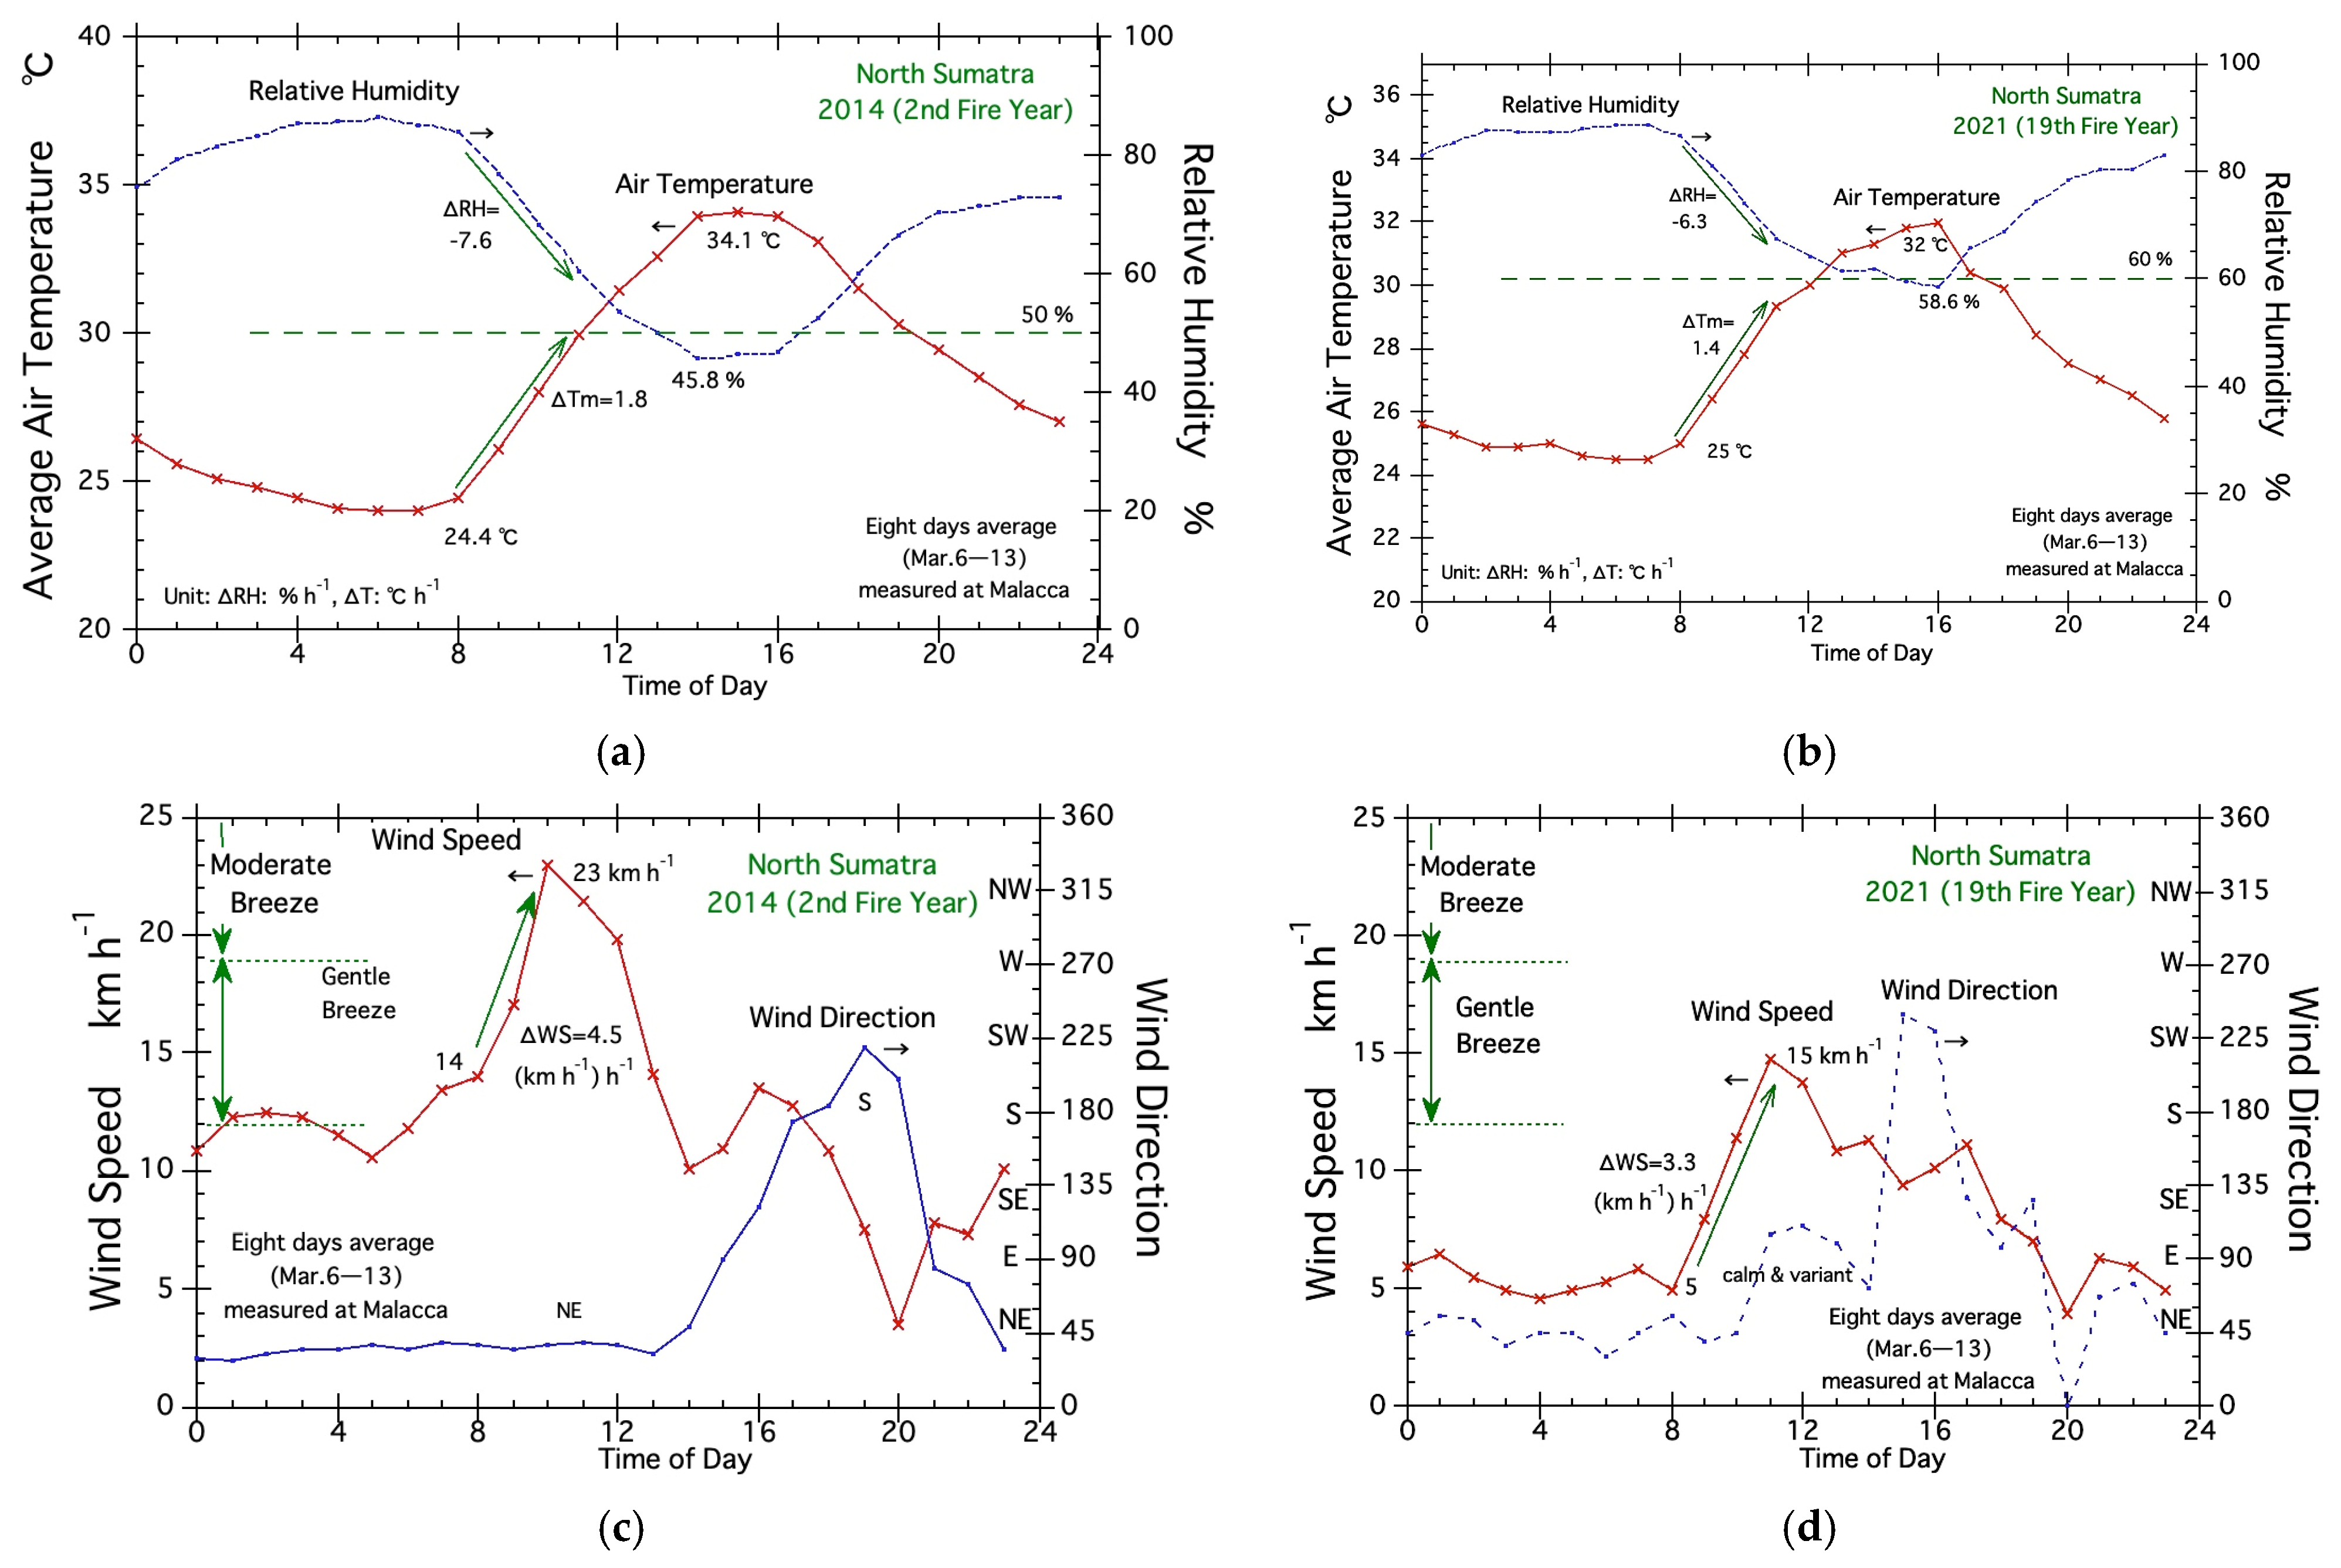
3.4.2. Peatland Fires in January–March 2014
To find the fire-prone weather conditions in March, we used the weather data for every hour from midnight (12 AM) from March 6th to 13th measured in Malacca. This period contains the largest and second large HS peak day (2394 HSs on March 12th) in 2014. The total number of data was 192 (=8 days × 24 (every one hour)). Data for the same period in 2021 is used for comparison.
Figure 7a and b show the average air temperature and average relative humidity (RH) in 2014 and 2021, respectively. The X-axis is the time of day.
Figure 7a,b show that the average maximum air temperature in 2005 was 34.1 °C, at 15:00, which is higher than that of about 32 °C at 16:00 in 2021. There is a relatively large difference in the average RH in 2014 and 2021. A total of 45.8% at 14:00 in 2014 (
Figure 7a), which is considerably lower than that of about 58.6% in 2021 (
Figure 7b).
In addition to these differences, there are also differences in temperature increase rates (ΔT) and RH decrease rates (ΔRH) from 8:00 to 11:00 in the morning as indicated by the auxiliary lines in
Figure 7a,b. ΔT andΔRH in 2014 are 1.8 °C h
−1 and −7.6% h
−1. Both values are larger than the corresponding values of 1.4 °C h
−1 and −6.3% h
−1 in 2015. After these large morning changes, the air temperature rose to 34.1 °C and the RH dropped below 40% in 2014. In contrast, the air temperature in 2021 did not rise much and the RH was over 58%.
Figure 7a,b show average wind speed and direction. The average wind speed and direction in
Figure 7a show that the maximum wind speed of the Northeasterly wind in 2014 is 23 km h
−1 (classification speed of moderate breeze, >19 km h
−1) at 10:00. On the contrary, the maximum wind speed in 2021 was 15 km h
−1 at 11:00. From those relatively large difference in wind speed, we may say that strong wind conditions are an important fire weather condition in North Sumatra.
In addition to these differences, there are also differences in wind speed increase rates (ΔWS) from 8:00 to 10:00 in the morning as indicated by the auxiliary lines in
Figure 7c. ΔWS in 2014 and 2021 are 4.5 and 3.3 (km h
−1) h
−1.
3.4.3. June Fires Related to Typhoon in 2013
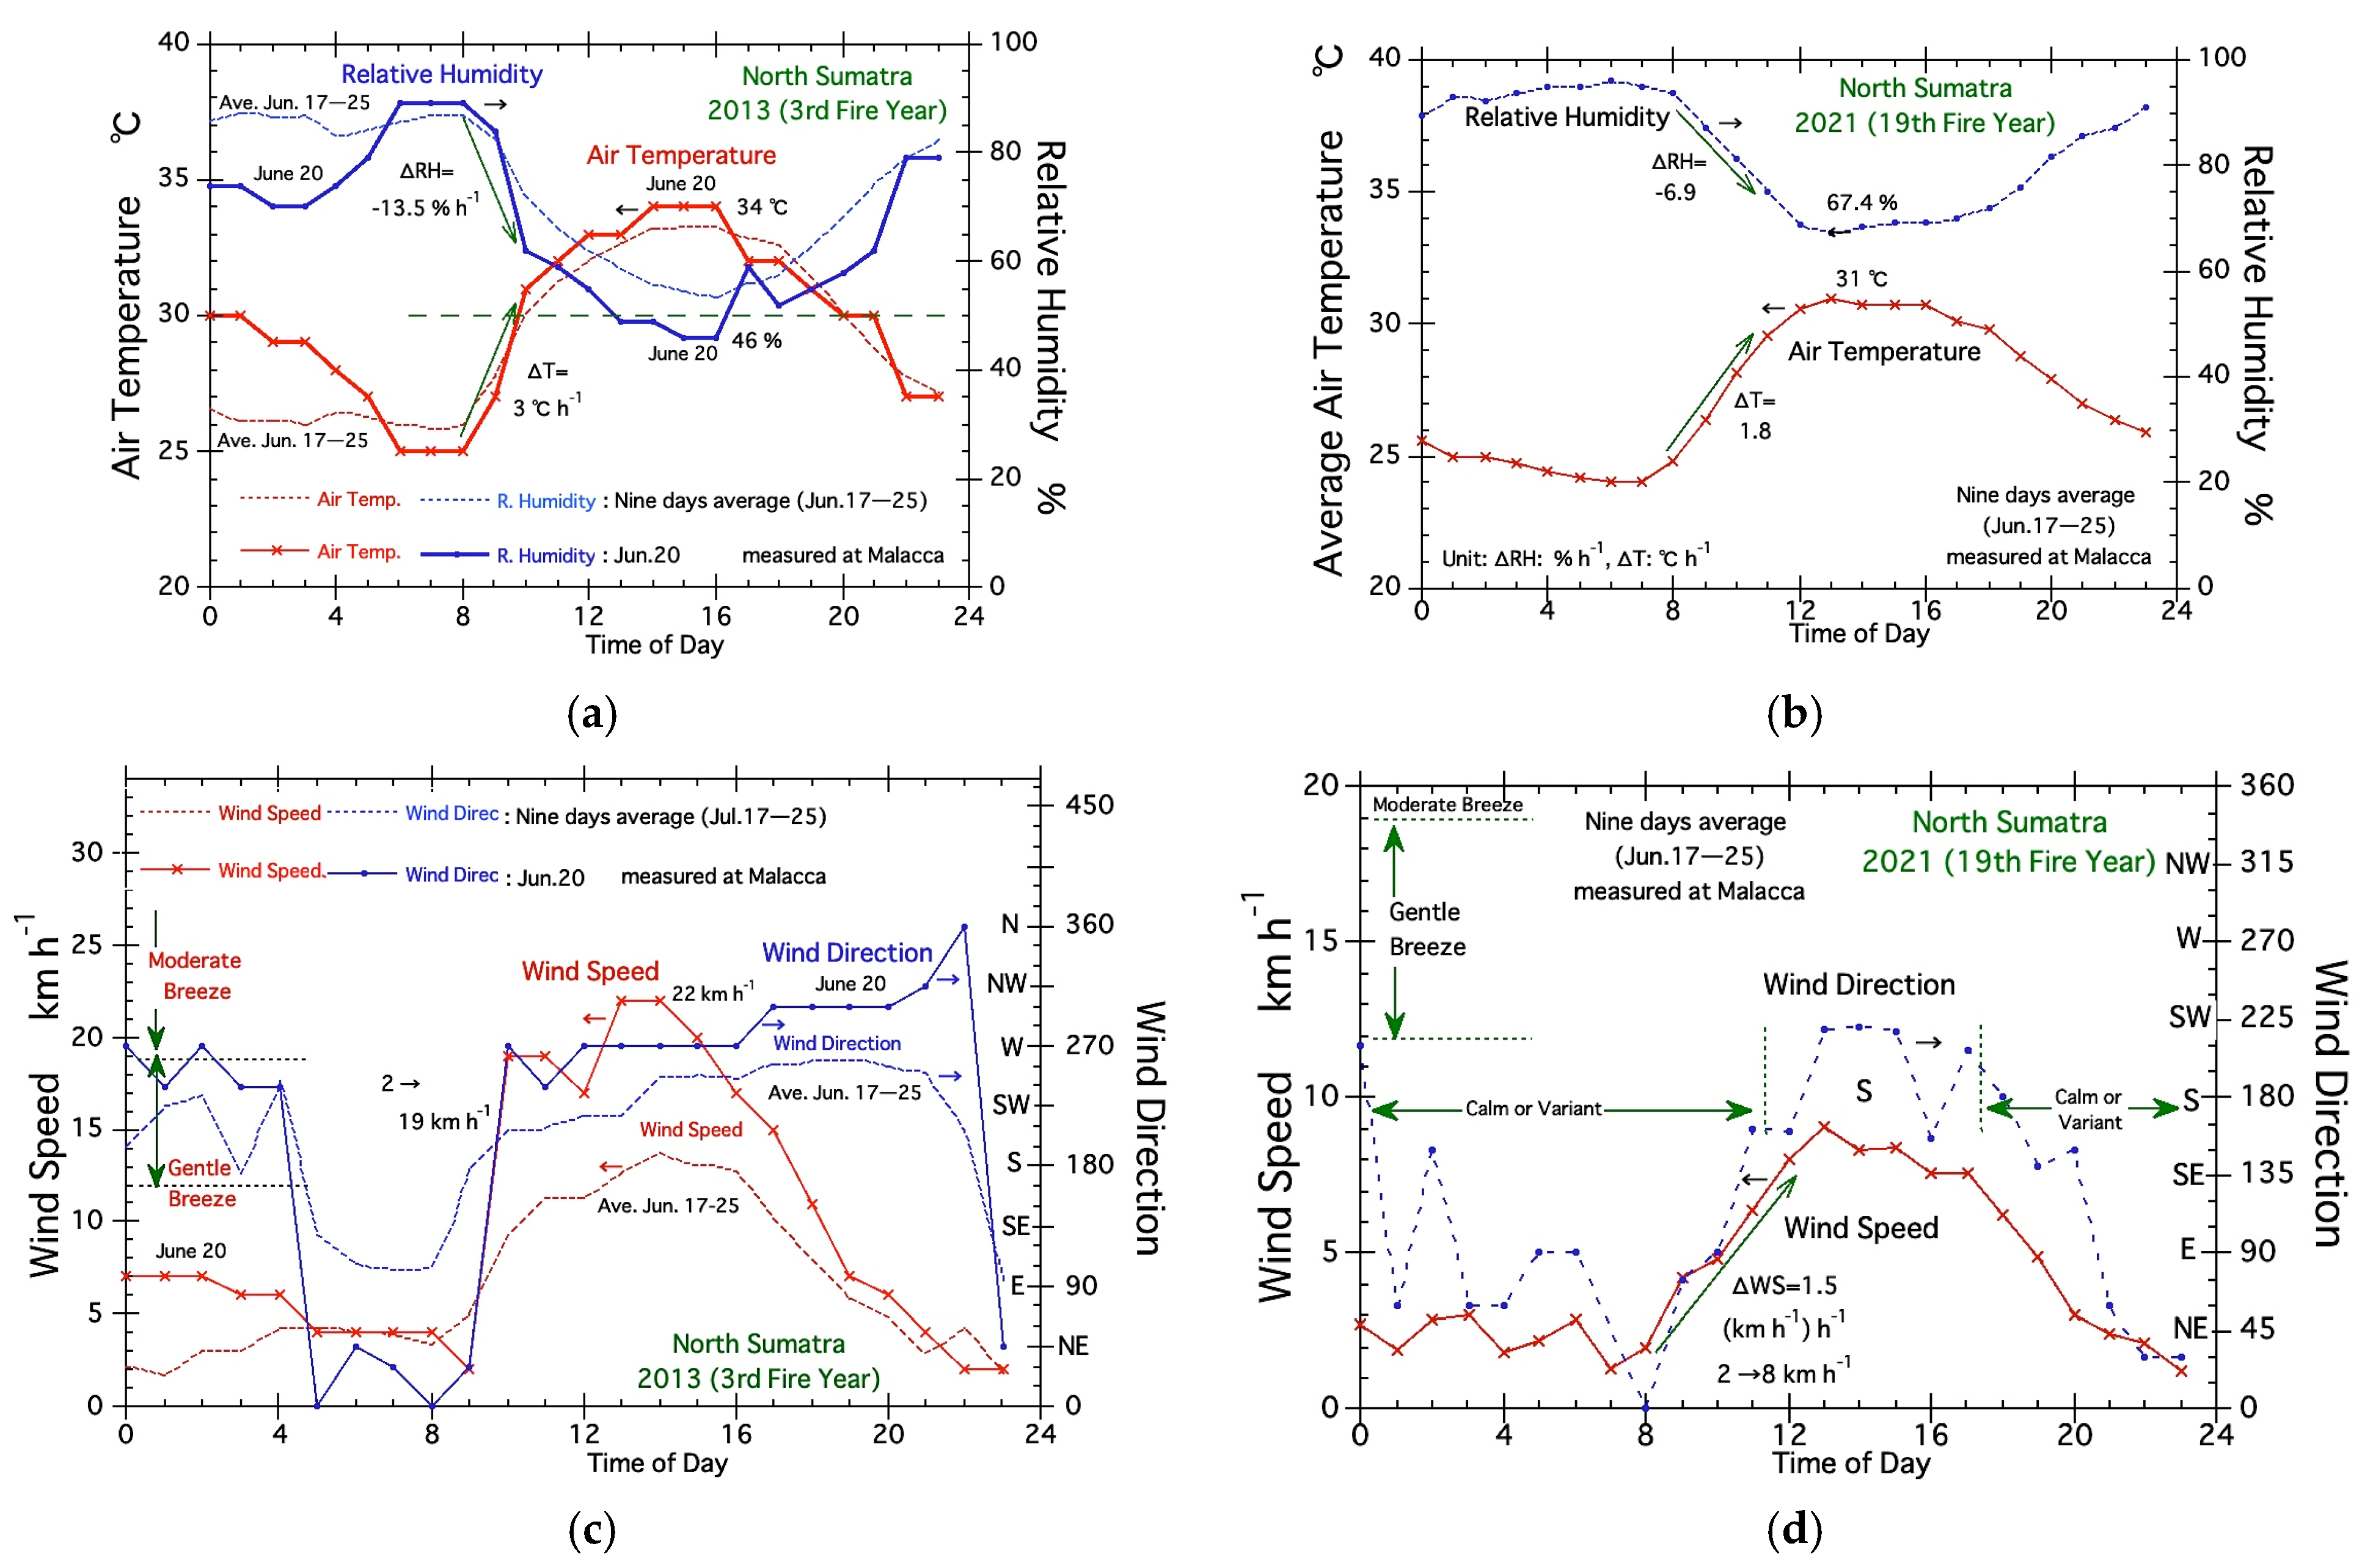
To find the fire-prone weather conditions in June, we used the weather data of every hour from midnight (12 AM) from June 7th to 25th measured in Malacca. This period contains the largest HS peak day (2394 HSs on June 20th) in 2013. The total number of data is 216 (=9 days × 24 (every one hour)). Data for the same period in 2021 is used for comparison.
Figure 8a and b show the average air temperature and average relative humidity (RH) in 2014 and 2021, respectively.
Figure 8a,b show that the average maximum air temperature on June 20 in 2013 was about 33 °C, at around 15:00, (33 °C on June 20
th), which is higher than that of about 31 °C at 13:00 in 2021. There is a relatively large difference in the average RH in 2013 and 2021. A total of 46% at 15:00 on June 20
th in 2014 (
Figure 7a) is considerably lower than that of about 67.4% in 2021 (
Figure 7b).
In addition to these differences, there are also differences in the temperature increase rates (ΔT) and RH decrease rates (ΔRH) from 8:00 to 10:00 in the morning, as indicated by the auxiliary lines in
Figure 8a,b. The ΔT and ΔRH in 2013 are 3 °C h
−1 and −13.5% h
−1. Both values are larger than the corresponding values of 1.8 °C h
−1 and −6.9% h
−1 in 2021. After these large morning changes, the air temperature rose to 34 °C and the RH dropped below 50% in 2014. In contrast, the air temperature in 2021 did not rise much and the RH was over 58%.
Figure 8c,d show the average wind speed and direction. The average wind speed and direction in
Figure 8c show that the maximum wind speed of the Northwesterly wind in 2013 is 22 km h
−1 (classification speed of moderate breeze, >19 km h
−1) at 13:00. On the contrary, the maximum wind speed in 2021 was about 9 km h
−1 at 13:00. From those relatively large difference in wind speed, we may say that strong wind conditions are an important fire weather condition in North Sumatra.
In addition to these differences, there are also differences in wind speed increase rate (ΔWS) from 9:00 to 10:00 in the morning as indicated by the auxiliary lines in
Figure 7c. ΔWS in 2013 and 2021 are 19 and 1.5 (km h
−1) h
−1 respectively.
An analysis using weather maps at the upper air (500 hPa) show strong westerly winds due to the Typhoon [
28] in the South China Sea and anticyclones over Indonesia. Unusual strong Westerly winds will be one of the major causes of the very large peatland fires in 2013. The results of the analysis in this section could provide background on the occurrence of fires in Sumatra in non-drought years [
14] and severe air pollution in Singapore [
15].
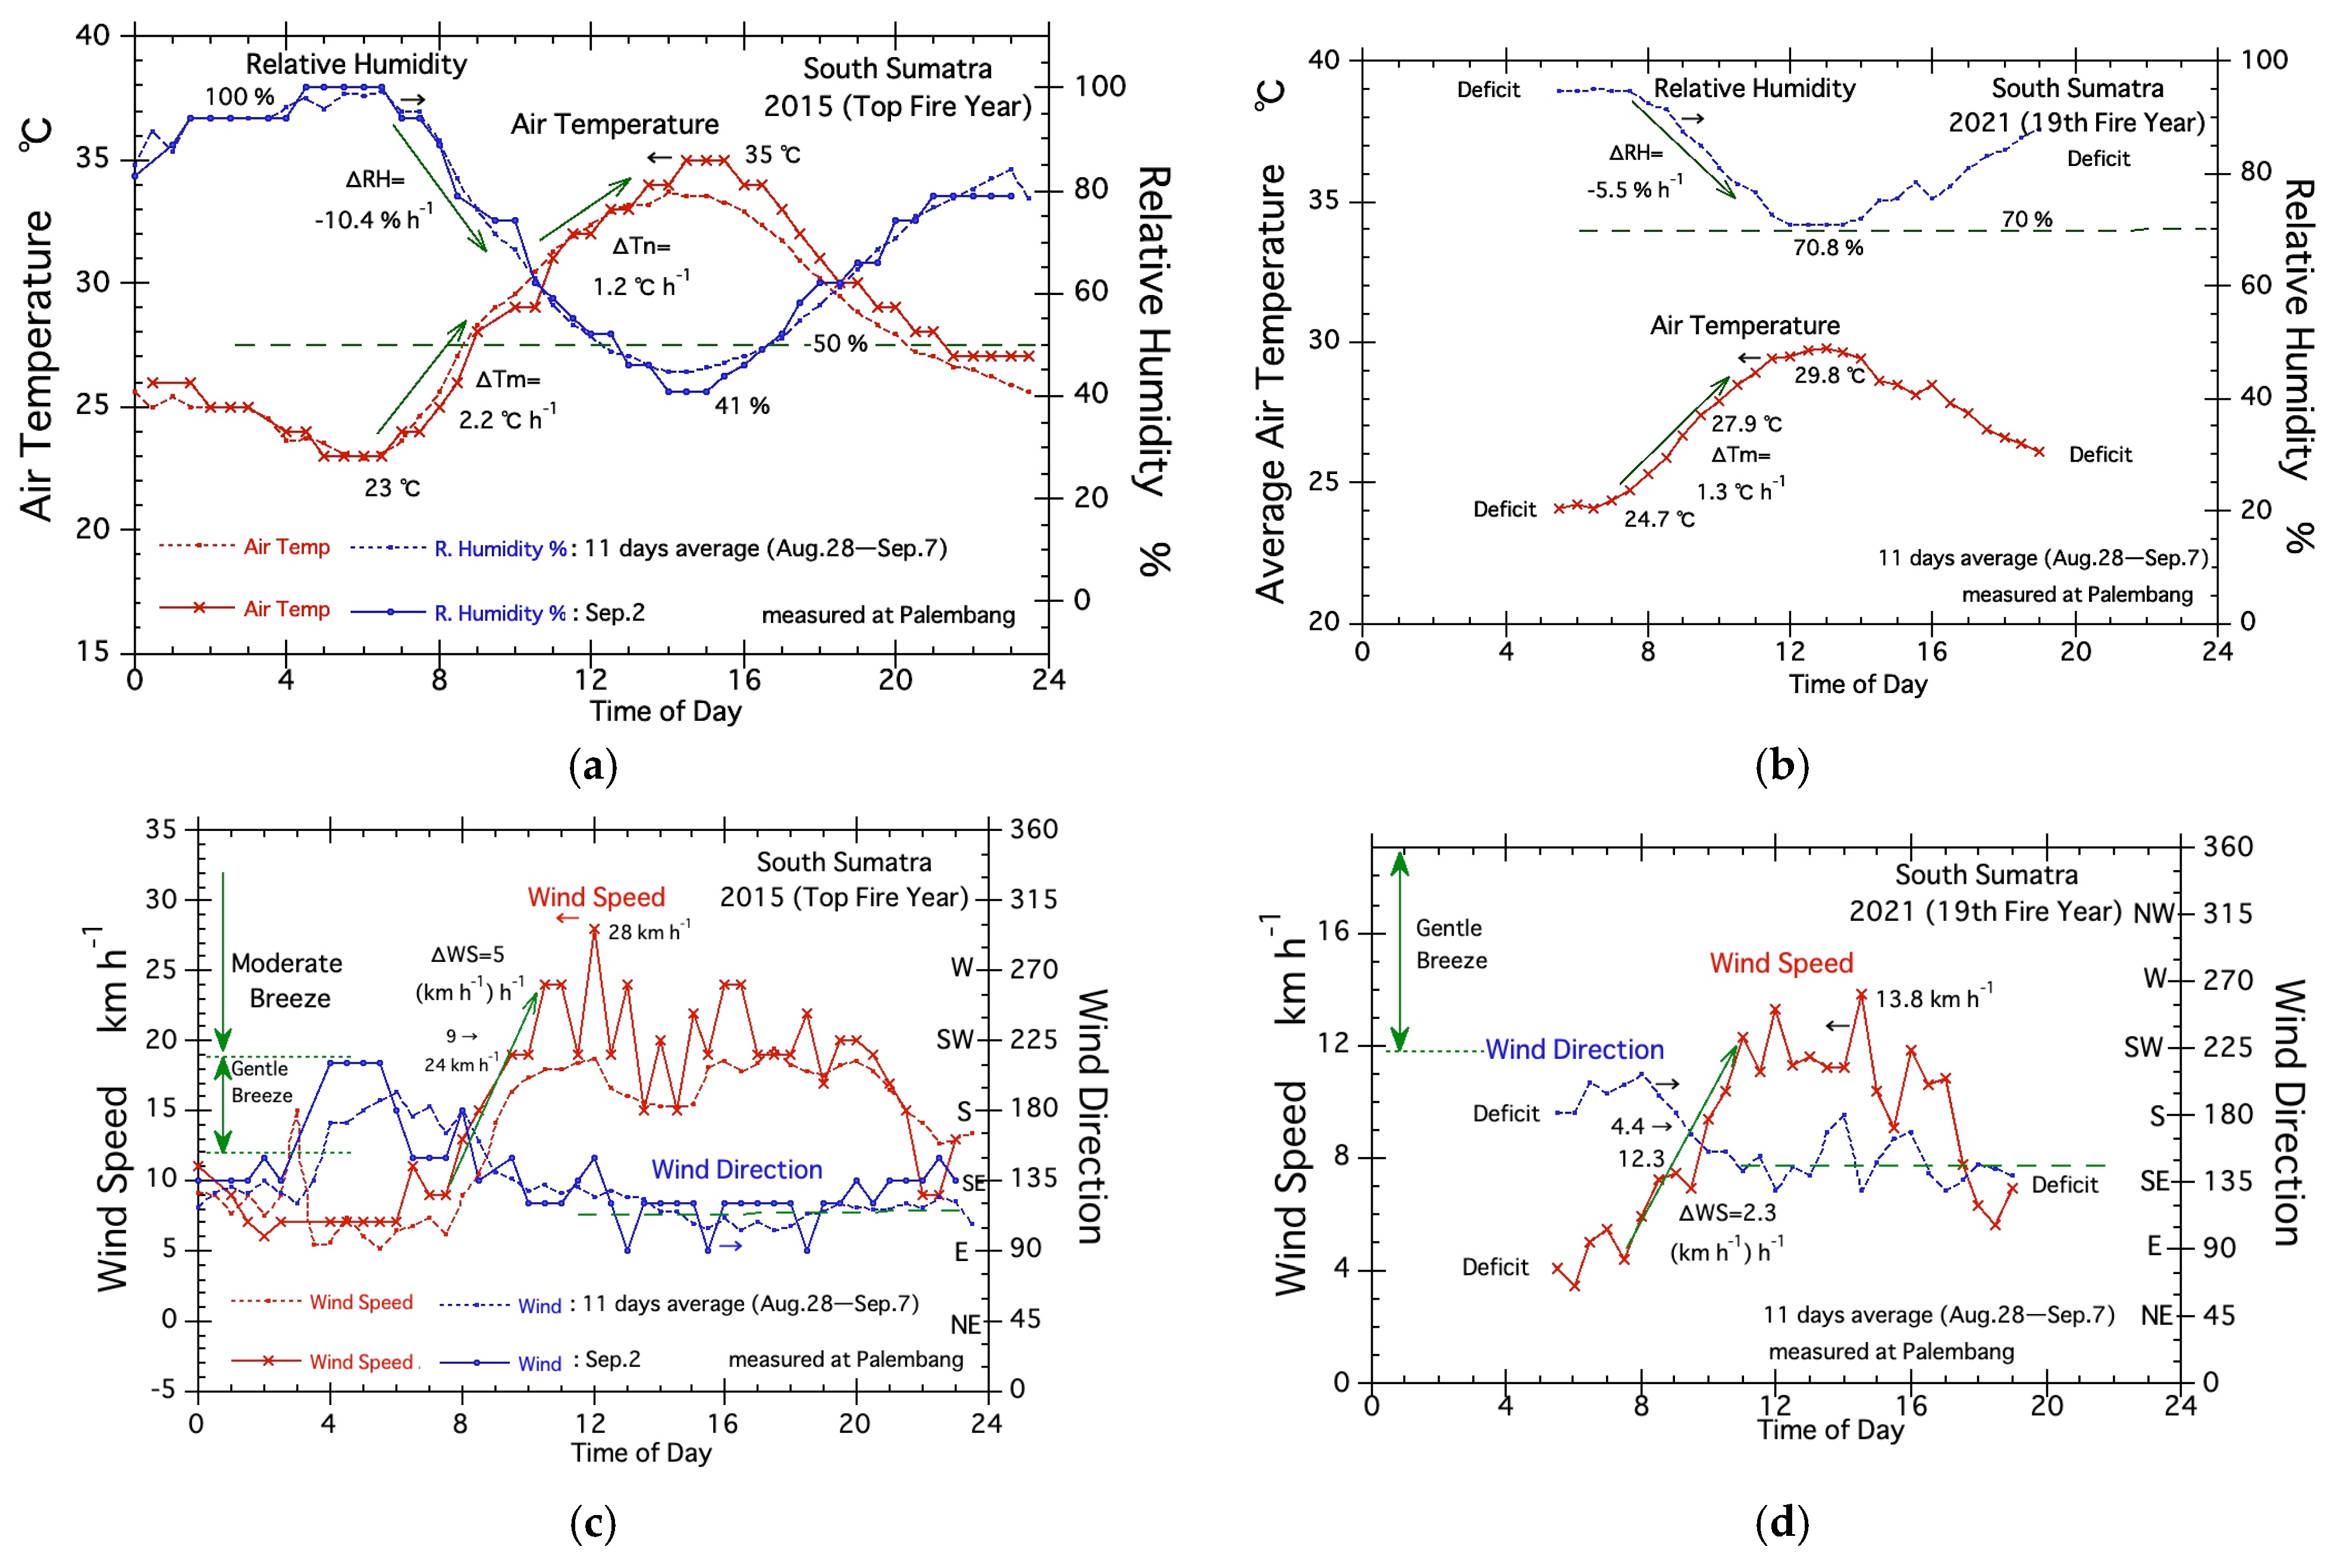
3.5. Fire Weather Conditions in South Sumatra
From here, we discuss the various fire weather conditions in 2015 under El Niño (top fire year) and 2021 under La Niña (19th fire year).
Fire Weather Conditions in 2015
To find the fire-prone weather conditions in Palembang, South Sumatra, we used the weather data for every 30 min from mi night (12 AM) from August 28th to September 7th measured in Palembang. This period contains the second largest HS peak day (2214 HSs on September 2nd) in 2015. The total number of data is 528 (=11 days × 48 (every 30 min)). Data for the same period in 2021 is used for comparison.
Figure 9a shows the air temperature and the relative humidity (RH) on September 2
nd, 2015, along with their average values of active fire periods.
Figure 9b shows the average air temperature and average relative humidity (RH) in 2021. The X-axis is the time of day.
Figure 9a,b show that the average maximum air temperature on September 2
nd in 2015 was about 35 °C, at around 14:00, which is higher than that of about 30 °C at 13:00 in 2021. There is a relatively large difference in the average RH in 2013 and 2021. A total of 41% at 14:00 on 2 September 2015 (
Figure 9a) is considerably lower than that of about 70% in 2021 (
Figure 9b).
In addition to these differences, there are also differences in the temperature increase rates (ΔT) and the RH decrease rates (ΔRH) from 7:00 to 9:00 in the morning, as indicated by the auxiliary lines in
Figure 9a,b. The ΔT andΔRH in 2015 are 2.2 °C h
−1 and −10.4% h
−1. Both values are larger than the corresponding values of 1.3 °C h
−1 and −5.5% h
−1 in 2021. After these large morning changes, the air temperature rose to 35 °C and the RH dropped below 50% in 2015. In contrast, the air temperature in 2021 did not rise much and the RH was over 70%.
Figure 9c shows the wind speed and direction on September 2
nd, 2015, along with their average values of active fire periods.
Figure 9d shows the average wind speed and direction. The average wind speed and direction in
Figure 9c show that the maximum wind speed of the southeasterly wind in 2015 was 28 km h
−1 (classification speed of moderate breeze, >19 km h
−1) at 12:00 and that the moderate breeze conditions (>19 km h
−1) lasted until 20:00. On the contrary, the maximum wind speed in 2021 was about 14 km h
−1 at 14:30. From those relatively large differences in wind speed, we may say that strong wind conditions are an important fire weather condition in South Sumatra.
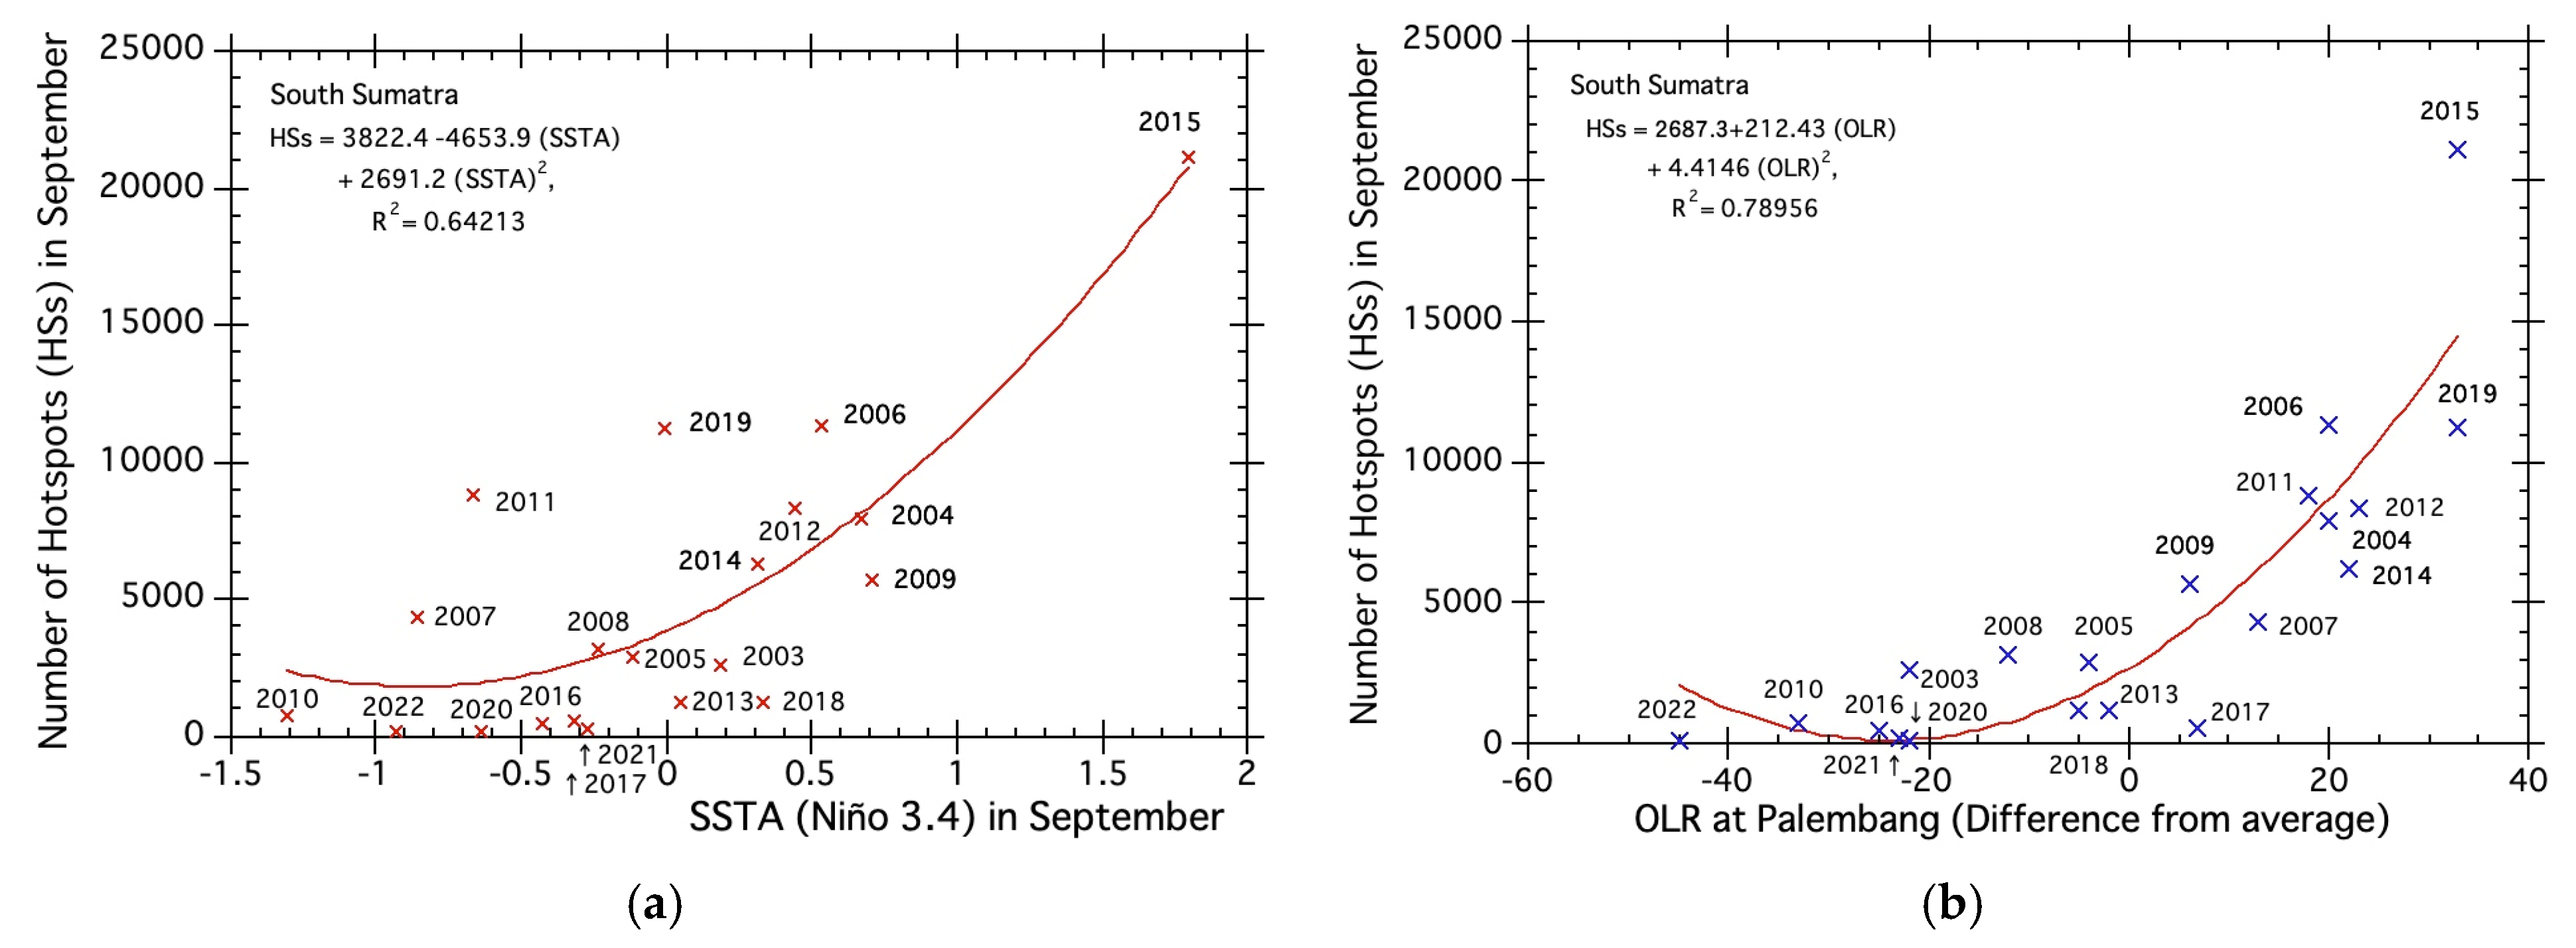
3.6. Various Fire-Related Index
Until 2018, the El Niño–Southern Oscillation (ENSO) was used as an explanation for the fires in Indonesia’s peatlands. However, when the 2019 fires occurred independently of El Niño, more suitable indicators and methods were required to (a) analyze, (b) evaluate and (c) forecast peatland fires. The correlations of the three indices with fire activity were examined. The three indices are Niño 3.4 (region: 5° N–5° S, 170°–120° W, one of the ENSO indices), Outgoing longwave radiation (OLR, NOAA), and Outgoing longwave radiation (OLR–MC, JMA).
Niño 3.4 is one of the ENSO indices and is commonly used to describe fires in Indonesia.
Figure 10a shows the relationship between the number of hotspots (HSs) and Niño 3.4 in September (both values for South Sumatra). Sea surface temperature anomaly (SSTA) at Niño 3.4 has a good correlation with HSs in most active fire years such as 2015, 2004, 20012, and 2014. In comparison, Niño 3.4 could not explain active fires in 2019 (neutral year). From this large difference from the regression curve in 2019 and other years, the value of the decision coefficient (R
2) was 0.642, as shown in
Figure 10a.
To explain the active fires in 2019, we first introduced Outgoing longwave radiation (OLR–MC, JMA) in our study in 2020 [
26]. The OLR–MC, JMA was originally developed by JMA to monitor the convective activity in Indonesia (Maritime Continent (MC)) over the central part of Indonesia, except for Sumatra. This rain-related index is derived from the OLR. In this study, the value of the decision coefficient (R
2) from the regression curve for OLR–MC, JMA was 0.625 and about the same value as the above 0.642 (SSTA, Niño 3.4).
In addition to the OLR–MC, we introduce Outgoing longwave radiation (OLR) to evaluate the land temperature of any place in Sumatra. We extract OLR at the Southeast area of Palembang in South Sumatra (the second highest HS grid cell in
Figure 1) through “EOSDIS Worldview (NASA)”.
Figure 10b shows the correlation between the OLR (NOAA), and HSs. The value of the decision coefficient (R
2) was 0.827 (the regression equation: HSs = 3.2111 × 10
6 – 22,393 (OLR) + 39.038 (OLR)
2, R
2 = 0.78956) and was higher than those of SSTA, Niño 3.4 and OLR–MC, JMA.
4. Discussion
This study was conducted to identify the fire weather conditions needed to assess future peatland fires under climate change. Due to the lack of meteorological data, many studies have indirectly evaluated fire weather conditions using meteorological indices such as Niño 3.4, groundwater level (GWL), and sea surface temperature anomaly (SSTA). However, fire weather conditions need to be defined in order to assess future peatland fire activities under climate change. Fortunately, we found and use hourly data from several locations in Indonesia and Malaysia and create this report. However, unfortunately, as there is only a list of hourly, day-by-day, data, the process of converting these data into long-term data for analysis is now difficult and disrupting our work.
4.1. Peatland Fires in Sumatra
The analysis results using 20 years of satellite hotspot data from 2003 in
Figure 2a and
Figure 3 show that peatland fires in Sumatra occur every other month, except December and April when rainfall intensifies. Due to relatively low rainfall, peatland fires in North Sumatra occur not only from January to March (the main dry season), but also around June and August if short-term drought happens.
The rainfall data in Dumai, from the weather spark database (
https://weatherspark.com/y/113794/Average-Weather-in-Dumai-Indonesia-Year-Round, accessed on 30 March 2023), could explain those fire activities. Its summary data shows that there are two periods each of dry and rainy seasons. Two dry months with bottom dates are February 9
th and June 21
st, and their average monthly rainfall values are 121 mm and 116 mm, respectively. Around these dates are the dry seasons for North Sumatra. Fires in January to March, June, and August in
Figure 3a occurred under two dry seasons. The two high rainfall months with peak dates are November 12
th (248 mm) and April 14
th (199 mm). These high rainfalls of two months could suppress the fires in November and April shown in
Figure 3a.
In contrast, the peatland fires in South Sumatra occur mainly from August to October, as shown in
Figure 4a. This is due to one long and severe dry season compared to two dry seasons in North Sumatra. The rainfall data in Palembang, from the weather spark database (
https://weatherspark.com/y/115096/Average-Weather-in-Palembang-Indonesia-Year-Round, accessed on 30 March 2023), show that August is the driest month, the lowest rainfall is 68 mm on August 12
th, and the average monthly precipitation below 100 mm starts from late June to mid-September. We may say this period is the dry season for South Sumatra. Thus, most fires in South Sumatra occurred during this one dry season.
The three fire stages on the accumulated hotspot (HSs) curves in
Figure 3a and
Figure 4a are derived from our analysis results of the peatland fires in central Kalimantan [
20,
24,
25,
26,
27]. The three fire stages, surface fire (SF), shallow peatland fire (SPF), and deep peatland fire (DPF), shown in
Figure 3a and
Figure 4a demonstrate that their continuous occurrence, except during the rainy months of November and December in North Sumatra (
Figure 3a) and December in South Sumatra (
Figure 4), suggest that peatland fires (SPF and DPF) in Sumatra can easily occur when drought conditions occur. In other words, Sumatra has peatlands that are prone to fires.
4.2. Fire Weather Conditions in Sumatra
Fundamental fire weather conditions in the top three fire years in North Sumatra and the top fire year in South Sumatra are summarized in
Table 1. The fire weather conditions are maximum air temperature (AT), relative humidity (RH), wind speed (WS), and wind direction change from morning to evening. These diurnal ranges are found in
Figure 6a,c to
Figure 9a,c.
Table 2 summarizes the fundamental fire weather conditions in the weak fire years of 2015 and 2021.
From a comparison of these values, we may say active peatland fires tend to occur under high air temperatures (around 34 °C), low relative humidity (lower than 50%), and high wind speeds (higher than 18 km h
−1). Wind direction changes from morning to evening in 2005 and 2014 in North Sumatra are from NE (Northeaster) to S (South), suggesting that they are the prevailing winds. The W (West) wind direction during fire periods in 2013, in North Sumatra, is an exceptional case and the Westerly winds blew due to the Typhoon [
28]. Southeasterly (SE) winds in 2015, in South Sumatra, suggest that SE are the prevailing winds in September.
In addition to the above fire weather conditions, a sign of active fire occurrence appeared in the morning at around 8:00 am are:
- (1)
Rapid temperature increase rates (ΔT) are more than around 2 °C h−1.
- (2)
Rapid relative humidity decrease rates (ΔRH) are more than around −10% h−1.
- (3)
Rapid wind speed increase rates (ΔWS) are more than around 5 (km h−1) h−1.
These values will help to improve fire forecasting in Sumatra.
5. Conclusions
This study clarified the peatland fire situations and the fire weather conditions in Sumatra. The major conclusions are summarized below:
Analysis results using 20 years of satellite hotspot data showed:
- (1)
Fires in Sumatra occurred for about 10 months from January to October.
- (2)
In North Sumatra, surface fire (SF), shallow peatland fire (SPF), and deep peatland fire (DPF) repeatedly occurred under relatively low rainfall, except in November and December.
- (3)
SPF and DPF in Sumatra frequently occurred when drought conditions occurred.
From the above fire trends, we may say that the peatlands of Sumatra are mostly in a combustible state.
Analysis results of the fire weather conditions using the diurnal weather data showed:
- (4)
Active peatland fires tended to occur under high air temperatures (around above 34 °C), low relative humidity (lower than 50%), and high wind speed (higher than 18 km h−1).
- (5)
W (West) wind in the fire periods in 2013, in North Sumatra, is an exceptional case and Westerly wind blew due to the Typhoon.
- (6)
Signs of active fire occurrence that appeared the in the morning at around 8:00 am are:
Rapid temperature increase rate (ΔT) is more than around 2 °C h−1, rapid relative humidity decrease rate (ΔRH) is more than around −10% h−1, and rapid wind speed increase rate (ΔWS) is more than around 5 (km h−1) h−1.
- (7)
These signs of theΔT, ΔRH, and ΔWS will help to improve the fire forecasting system in Sumatra.
Finally, we hope that this report will help improve future peatland fire assessments and fire forecasting under rapid climate change.


