Article

Changing Trends in Temperatures and Rainfalls in the Western Pacific: Guam

1
Water and Environmental Research Institute of the Western Pacific, University of Guam, Mangilao, GU 96923, USA
2
School of Engineering, University of Guam, Mangilao, GU 96923, USA
3
Western Pacific Tropical Research Center, University of Guam, Mangilao, GU 96923, USA
*
Author to whom correspondence should be addressed.
Climate 2023, 11(4), 81; https://doi.org/10.3390/cli11040081
Submission received: 23 February 2023 / Revised: 3 April 2023 / Accepted: 4 April 2023 / Published: 5 April 2023

Abstract

:
Pacific islands have always been at the front of the great challenge of climate change. In this study, Mann–Kendall’s tau-based slope estimator was implemented to detect statistical trends in daily maximum and minimum temperatures of 2 stations and daily rainfalls at 14 stations over Guam for the period of 1953–2021, respectively, with 17 climate change detection indices. Mann–Kendall tests were implemented to the detection indices with respect to different time frames (i.e., annual, two-seasonal, and four-seasonal). The p-values from Mann–Kendall tests were used to determine the strength of trends, and Sen’s slopes were applied for the magnitudes of trends. The temperature trend analysis results indicate that Guam’s climate is getting warmer year by year. The increasing magnitudes of a seasonal maximum of daily maximum temperatures during the dry season are 0.036 °C/year for the dry season and 0.025 °C/year for the wet season at Anderson Airforce Base, while 0.031 °C/year and 0.023 °C/year for the dry and wet seasons at Guam International Airport. Trend analyses for temperatures have indicated that temperature during April through June has been increasing rapidly compared to other seasons. Strong trends in seasonal total rainfall amounts and the number of wet days were observed from July through December. The increasing trends in extreme rainfall indices during January–March and July–September periods would aggravate water quality due to the more sediments since important ecological reserve areas and coral reef areas are linked to watersheds in southern Guam.

1. Introduction

The perception of the seriousness of climate change on small islands has long persisted. The rise in sea level not only encroaches on territories of coastal cities and communities on small islands, but also contributes to seawater intrusion on freshwater systems [1]. Small islands rely only on precipitation for drinking and irrigation water resources; thus, changes in precipitation patterns directly influence freshwater resources on small islands because small landmasses imply a low water holding capacity [1,2,3]. In addition to the impacts on water resources, increasing seawater temperature and more frequent disturbances by extreme weather conditions bring adverse impacts on coastal ecosystems. For example, Comeros-Raynal, Lawrence, Sudek, Vaeoso, McGuire, Regis and Houk [4], and Smith, Hunter and Smith [5] address that these extreme events accelerate coral bleaching and adversely affect coral reproduction rates.
Guam is located in the one of the most impacted regions of the world from climate change. Freshwater on oceanic islands is made up three major components: freshwater lens, transition zone, and saltwater. Freshwater lens floats on saltwater; thus, the chloride concentration increases easily from the top of the lens to bottom of saltwater zone when the withdrawal rate is bigger than aquifer recharging rate. About 90% of freshwater demand in Guam is from the freshwater lens, but chloride concentrations in the production wells from the aquifer system have indicated statistically significant upward trends for the period of 1973–2010 [6,7]. Because the lens floats saltwater, the upward trends in chloride concentration of the withdrawn freshwater provide the decreasing trend in the thickness of the lens. The chloride concentration can be expressed by a function of pumping withdraw rate, rainfall-infiltration recharge rate, hydraulic conductivity, and sea level. As a result, changes in rainfall distribution patterns in time and space result in ground water availability. In addition, more intense extreme weather events such as tropical cyclones, tropical depressions storms, and droughts are highly likely to be expected with the climate change. Increased heavy rainfall events will result in flooding, erosion, and run-off—affecting major roads, highly valued real estate, coral reefs, and shallow coastal ecosystems. Hence, the comprehensive understanding of the current temperature and rainfall attribution is crucial for Guam’s water security for the current and future.
Accordingly, many efforts to identify alterations in temperatures and precipitation over Pacific Islands have been conducted [8,9,10,11,12,13]. Caesar, Alexander, Trewin, Tse-Ring, Sorany, Vuniyayawa, Keosavang, Shimana, Htay and Karmacharya [14] and Choi, Collins, Ren, Trewin, Baldi, Fukuda, Afzaal, Pianmana, Gomboluudev and Huong [8] to investigate regional climate pattern changes in South-East Asia in time and space. McGree, Herold, Alexander, Schreider, Kuleshov, Ene, Finaulahi, Inape, Mackenzie and Malala [12] looks into the attribution of climate change at the pacific islands using various climate change detection indices. Overall, strong increasing temperature trends in the Western Pacific are observed, while various patterns of precipitation changes are identified over the region. However, these studies are unable to provide the detailed information on climatic variables in Guam since the main purpose of their study is to find regional trends in temperatures and precipitations in too extensive region. On the other hands, other recent studies [9,11] conduct trend tests in temperature and rainfalls for each pacific island to support local governments’ protection plans. Despite the spatiotemporal complexities, they employ very limited indices (i.e., annual anomalies and the 95th percentiles for both temperature and rainfalls, and monthly maximum temperature and the number of dry days) to detect trends with one site for each island. Moreover, annual-based indices in their studies are used to detect the changes; thus, they only detect increasing trends in annual temperatures and conclude that there is no climate change in precipitation events in Guam. Yet, the annual estimates are unable to account for interseasonal variations. For instance, the re-distribution of rainfall amounts and intensities without changes in annual total rainfall amounts cannot be detected by the annual estimates. Because they can influence in local water cycles or water resources, it is essential to conduct trend analyses in different time scales (e.g., annual, two-seasonal, and four-seasonal) with various climate change detection indices for supporting sustainability of each local government.
Detection and attribution of trends in the climate systems are not straightforward due to their natural variability and complexity. The localized characteristics and high spatiotemporal variations of precipitations have amplified the need to use change detection indices in climate change studies. Expert team on climate change detection and indices (ETCCDI) developed 11 core indices to detect changes in precipitations and 16 indices in maximum and minimum temperature, respectively, with support of the World Meteorological Organization (WMO) Commission for Climatology (CCI) [15]. The ETCCDI indices have been used to detect climatic variables and to identify the characteristics of extreme weather systems [16,17,18]. In this study, the selected ETCCDI indices are, therefore, implemented for Guam’s temperature and precipitation records.
The main objective of this study is to conduct thoroughly trend analyses using the climate change detection indices provided by the ETCCDI with historical daily temperature and rainfall records available at 2 temperature gauge stations and 14 rainfall gauge stations, respectively. The remainder of this article is organized as follow: Section 2 provides the information about the data, description of the detection indices, and a trend test approach used in this study. In Section 3, we present our trend test results and interpretation. Finally, our conclusions are presented in Section 4.

2. Study Region, Data, and Methodology

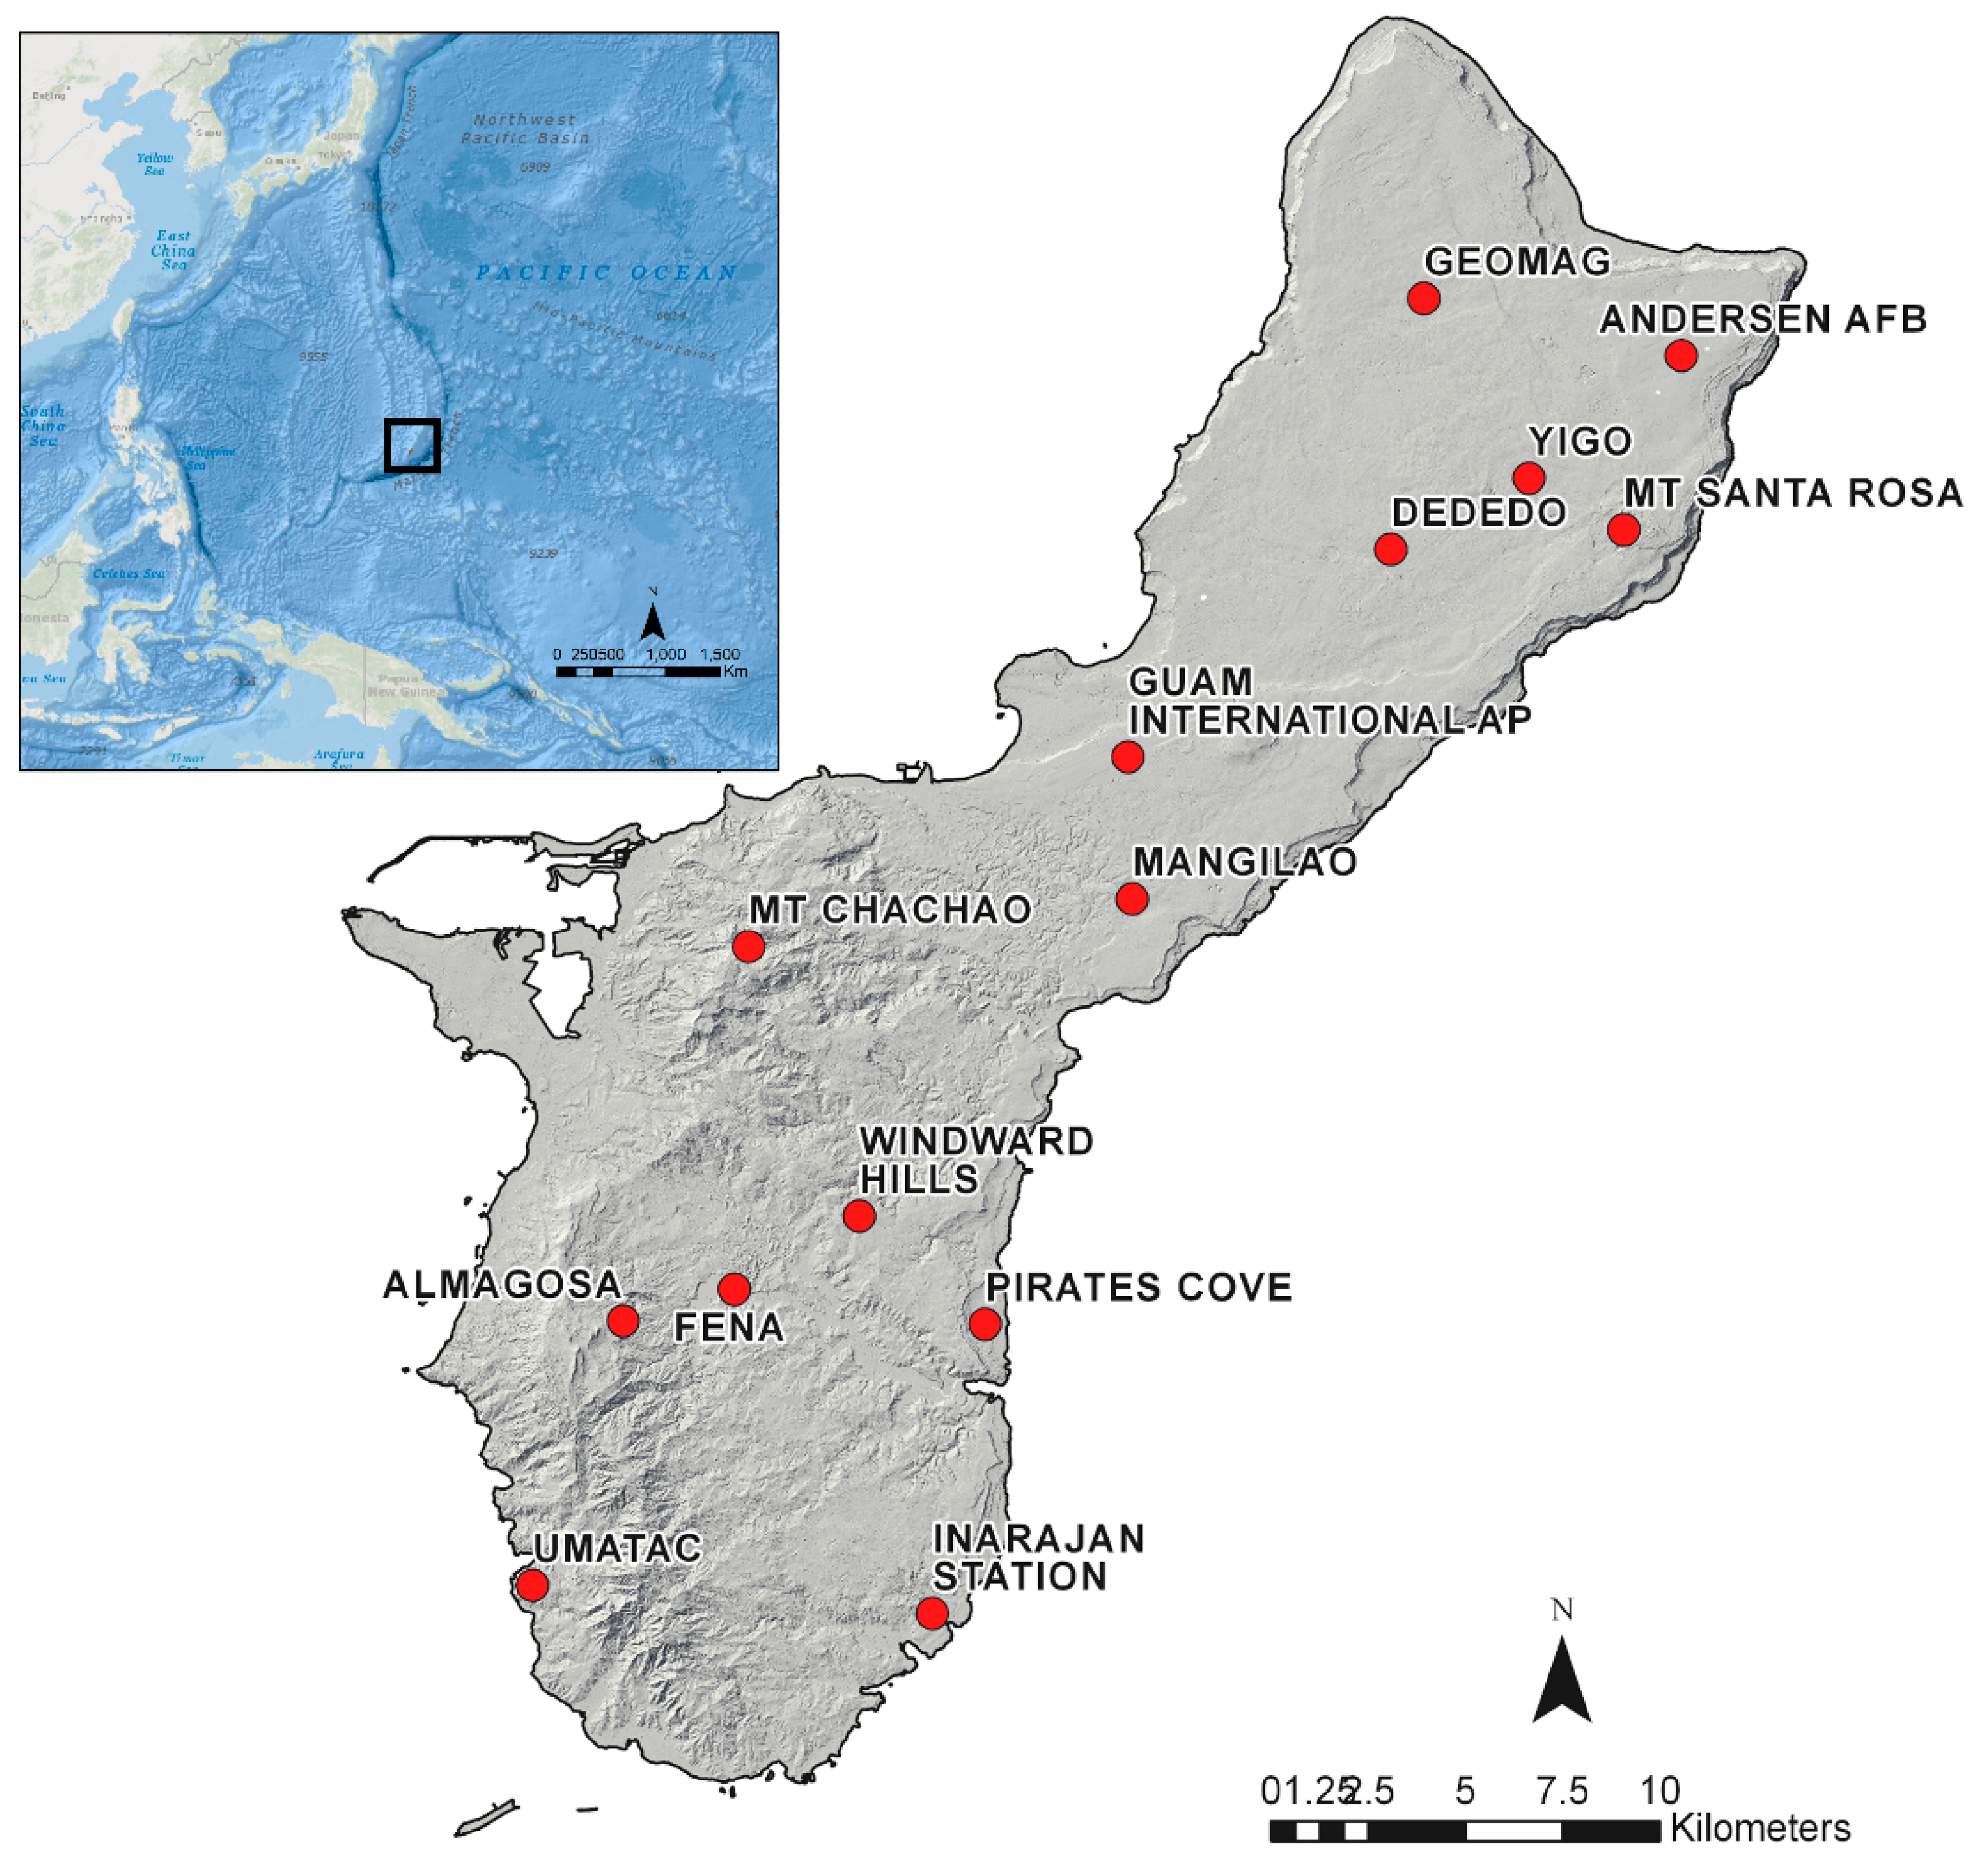
2.1. Study Area and Data

Guam located at 13°28′ N, 144°45′ E is the largest and the southernmost island of the Mariana Islands. Guam is 50 km long and 14 km wide, giving it an area of about 550 km2 (Figure 1). The northern portion is a broad uneven limestone plateau with precipitous coastal cliffs standing 60–180 m above sea level, while the southern portion is a dissected volcanic upland with the cliff standing 70 m above sea level [19,20].
With air temperature generally ranging between 24 °C and 32 °C, the island of Guam receives a substantial amount of annual rainfall. The average annual rainfall on this tropical island is near 2540 mm per year. The weather and climate of the region are strongly characterized by the trade winds and proximal East Asian Monsoon. Almost 70% of annual rainfall falls during the wet season of July through December, and the remaining 30% arrives during dry season of January through June [21]. Moreover, because inter-annual variation of rainfall is associated with El Niño-southern oscillation (ENSO) cycle, very extreme weather conditions such as devastated typhoons and drought have been observed. Historical daily rainfall data at seven rain gauge stations were prepared from National Climatic Data Center (NCDC) of the National Oceanic and Atmospheric Administration (NOAA) and those at seven stations from the National Water Information System of the United States Geological Survey (USGS), respectively. Historical daily maximum and minimum temperatures were obtained from the NOAA NCDC site. Table 1 and Figure 1 show the locations of the stations, and data period used for this study. Heterogeneity of climate data brings unreliable results in especially trend analysis; thus, it is required to proceed with homogeneity test for climate data available [12,22]. In this study, a Pettitt’s test [23], commonly used to detect a single change-point in a time series, is implemented to detect change-points of monthly means of both temperatures and rainfall records before undertaking statistical analyses. Only one historical record (temperatures of Guam International Airport) shows heterogenous condition as shown in Figure 2. Temperature records have been measured by two different systems: NOAA Weather Service Meteorological Observatory (WSMO) and NOAA Weather Forecast Office (WFO). WSMO system was deactivated in 1995, and the data of the system is not reliable due to instrumentation errors [11]. Hence, daily maximum and minimum temperatures for the period of 1996–2022 at this station is used for statistical trend tests.

2.2. Climate Change Detection Indices

To detect statistical trends in temperatures and precipitations over Guam, this study uses 17 indices, including 13 core indices facilitated by ETCCDI for both temperature and precipitation, respectively (Table 2). They consist of 4 user-defined indices: Prcp1 for the percentage of monthly/seasonal wet days, R10mm for the number of heavy-rain days exceeding 10 mm/day, R95pTOT for the total precipitation corresponding to the 95th percentile, and R99pTOT for the total precipitation for the 99th percentile. Although the last two indices are included the core indices of ETCCDI, we modify the definition of them in this study. Changes in extreme climate conditions can be detected using 10 indices (TXx, TNn, TN10p, TX90p, R10mm, R20mm, R95pTOT, and R99pTOT) for temperature and precipitation, respectively. The indices are calculated based on different time frames: annual, two-seasonal (dry-season and wet-season), and four-seasonal (January–March, April–May, June–August, and September–December).

2.3. Trend Analysis

Non-parametric Mann–Kendall’s tau-based slope estimator [24] was implemented to investigate statistical significance of each climate change detection index introduced in the Table 2. The approach does not require assumption of a specific distribution for data, and the calculated statistics are not sensitive to normality of data. Hence, the approach has been widely used to detect trends in climate variables [22,25,26,27]. In this study, we used three calculated statistics (τ statistic, p-value, and Sen’s slope) for accounting for statistical significance of trend and increasing/decreasing trends. The value of τ indicated the increasing or decreasing trends, the p-value was used to determine whether the null hypothesis can be rejected or accepted by the comparison with the certain significance level (α), and the Sen’s slope showed the magnitude of trends. After obtaining independently the statistics for each timeframe at each site, we used the p-value for determining the strength of trends such as the following [25];
  • Case 1: p-value ≤ 0.05 ⇒ significant strong trend
  • Case 2: 0.05 < p-value ≤ 0.1 ⇒ significant trend
  • Case 3: p-value > 0.1 ⇒ insignificant trend
The values of Sen’s slope were plotted into maps to identify the spatiotemporal trends over Guam.

3. Results and Discussion

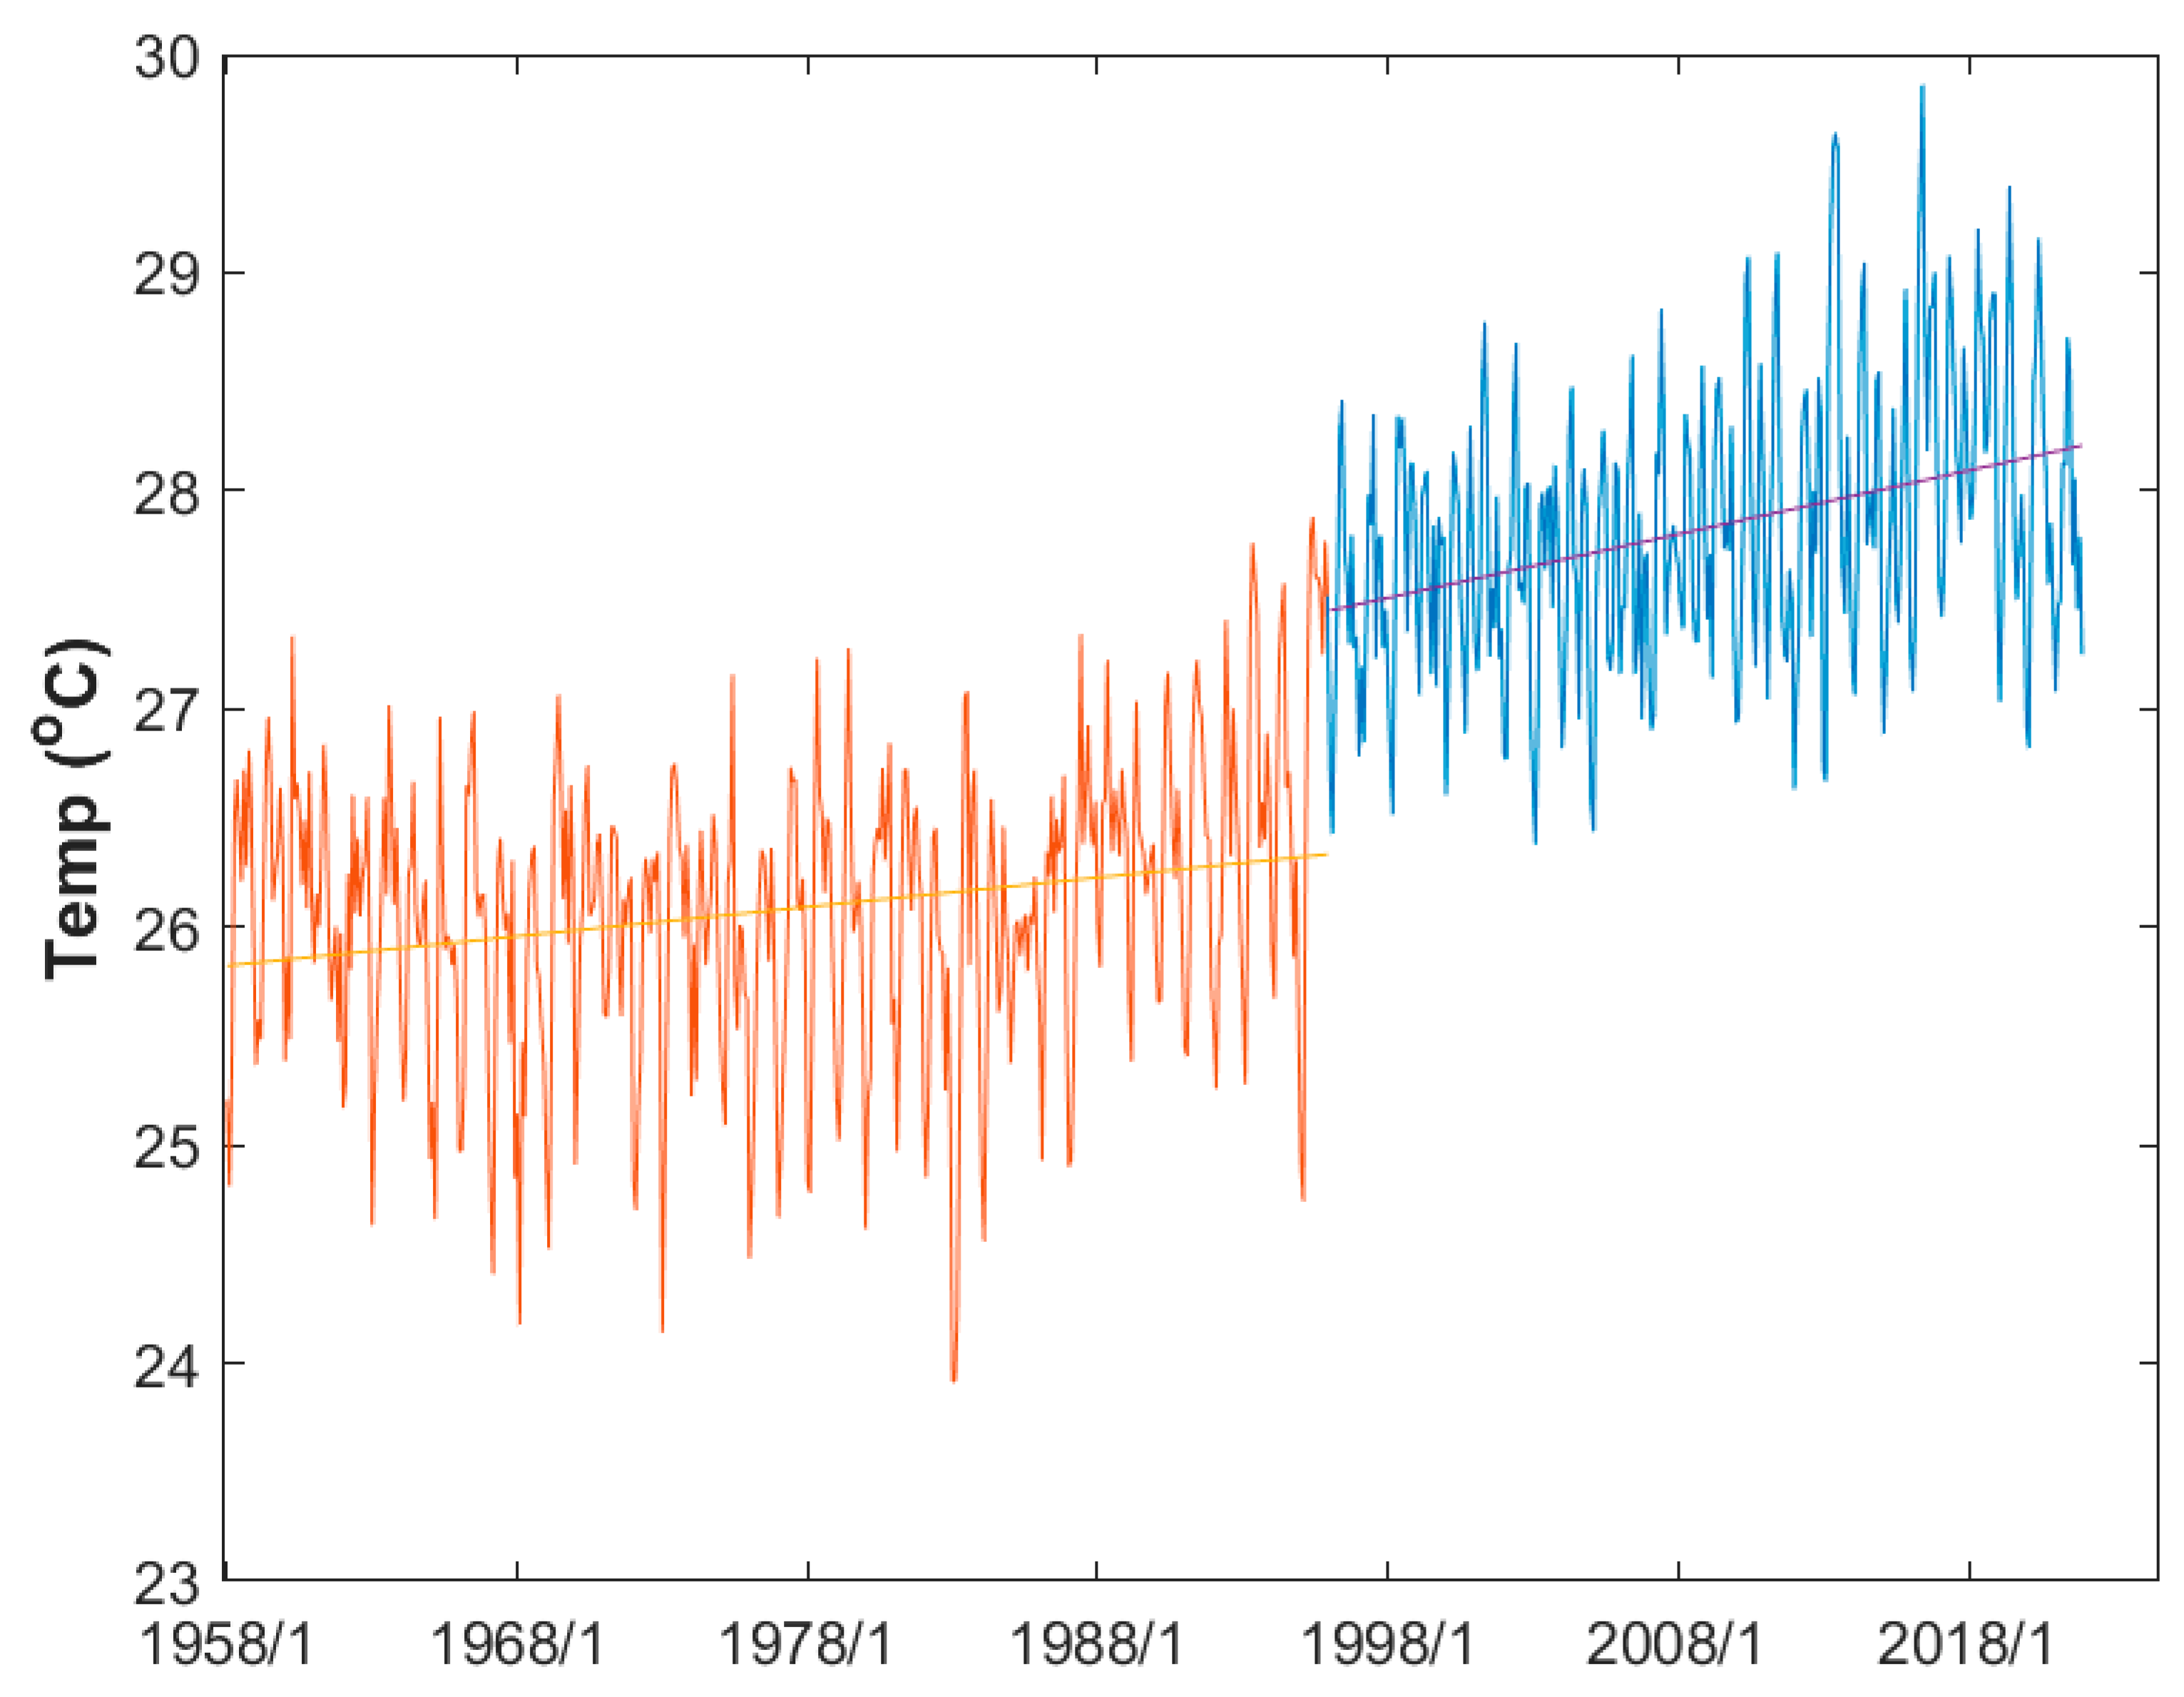
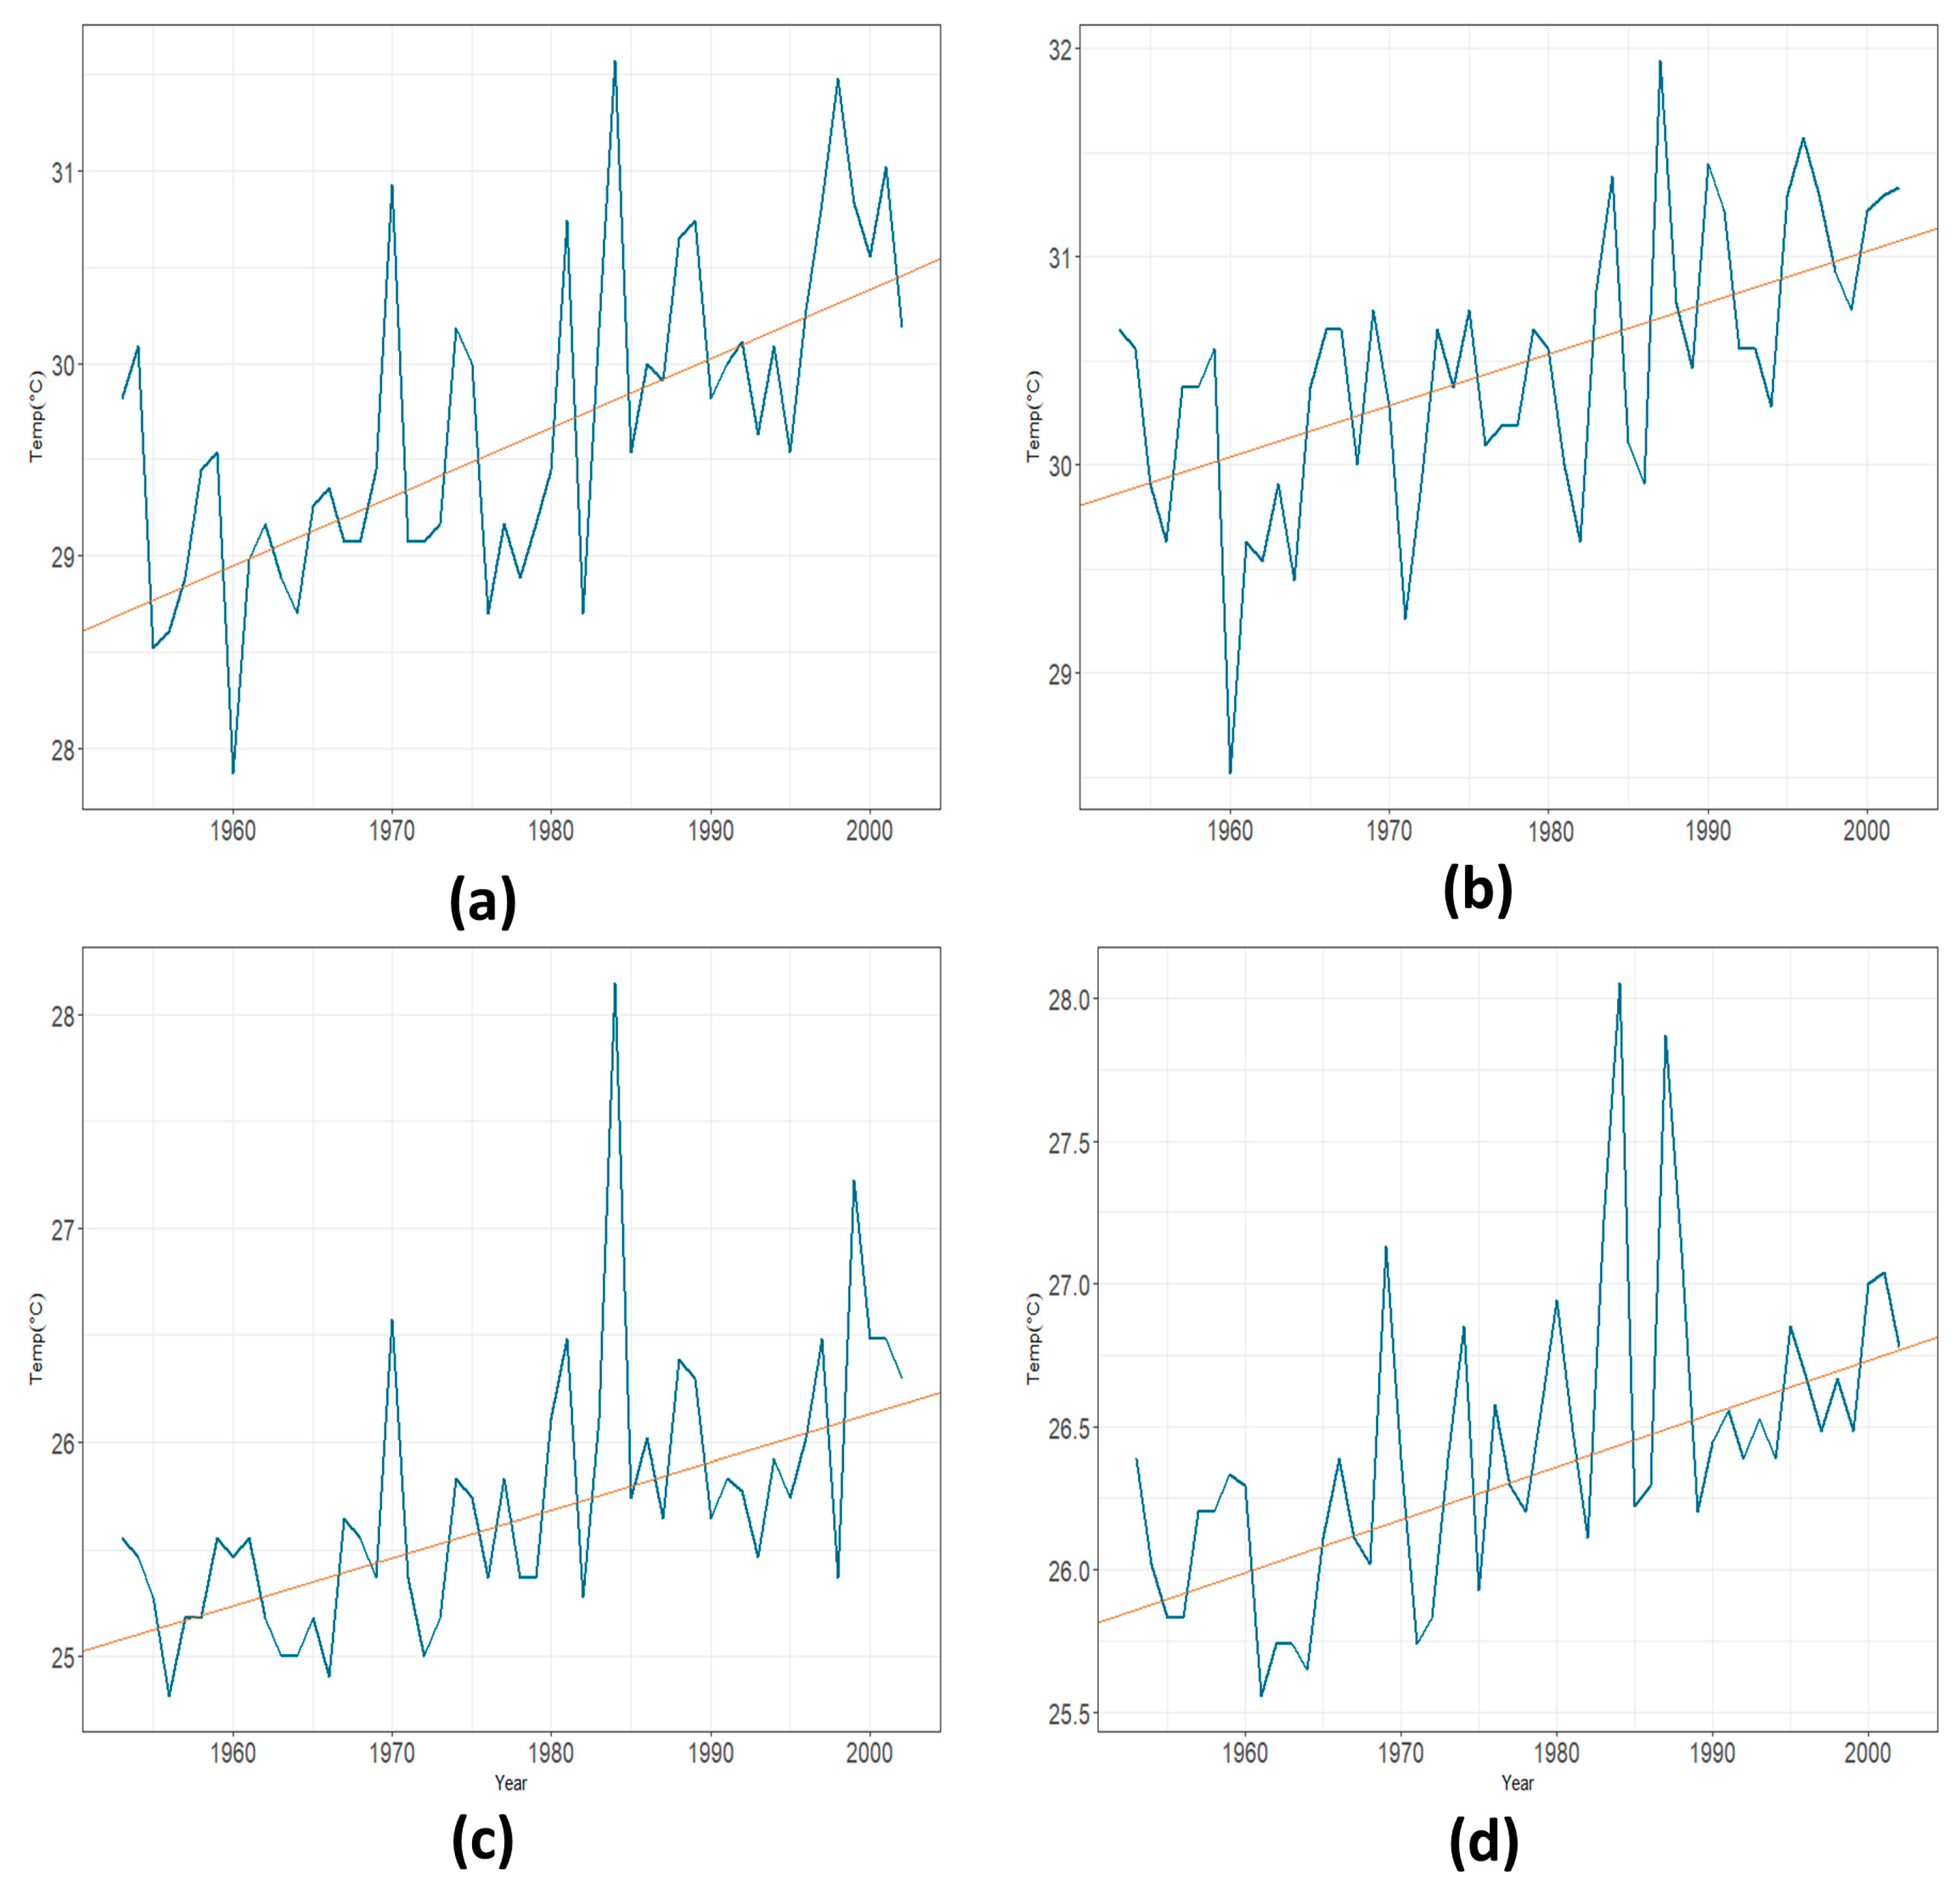
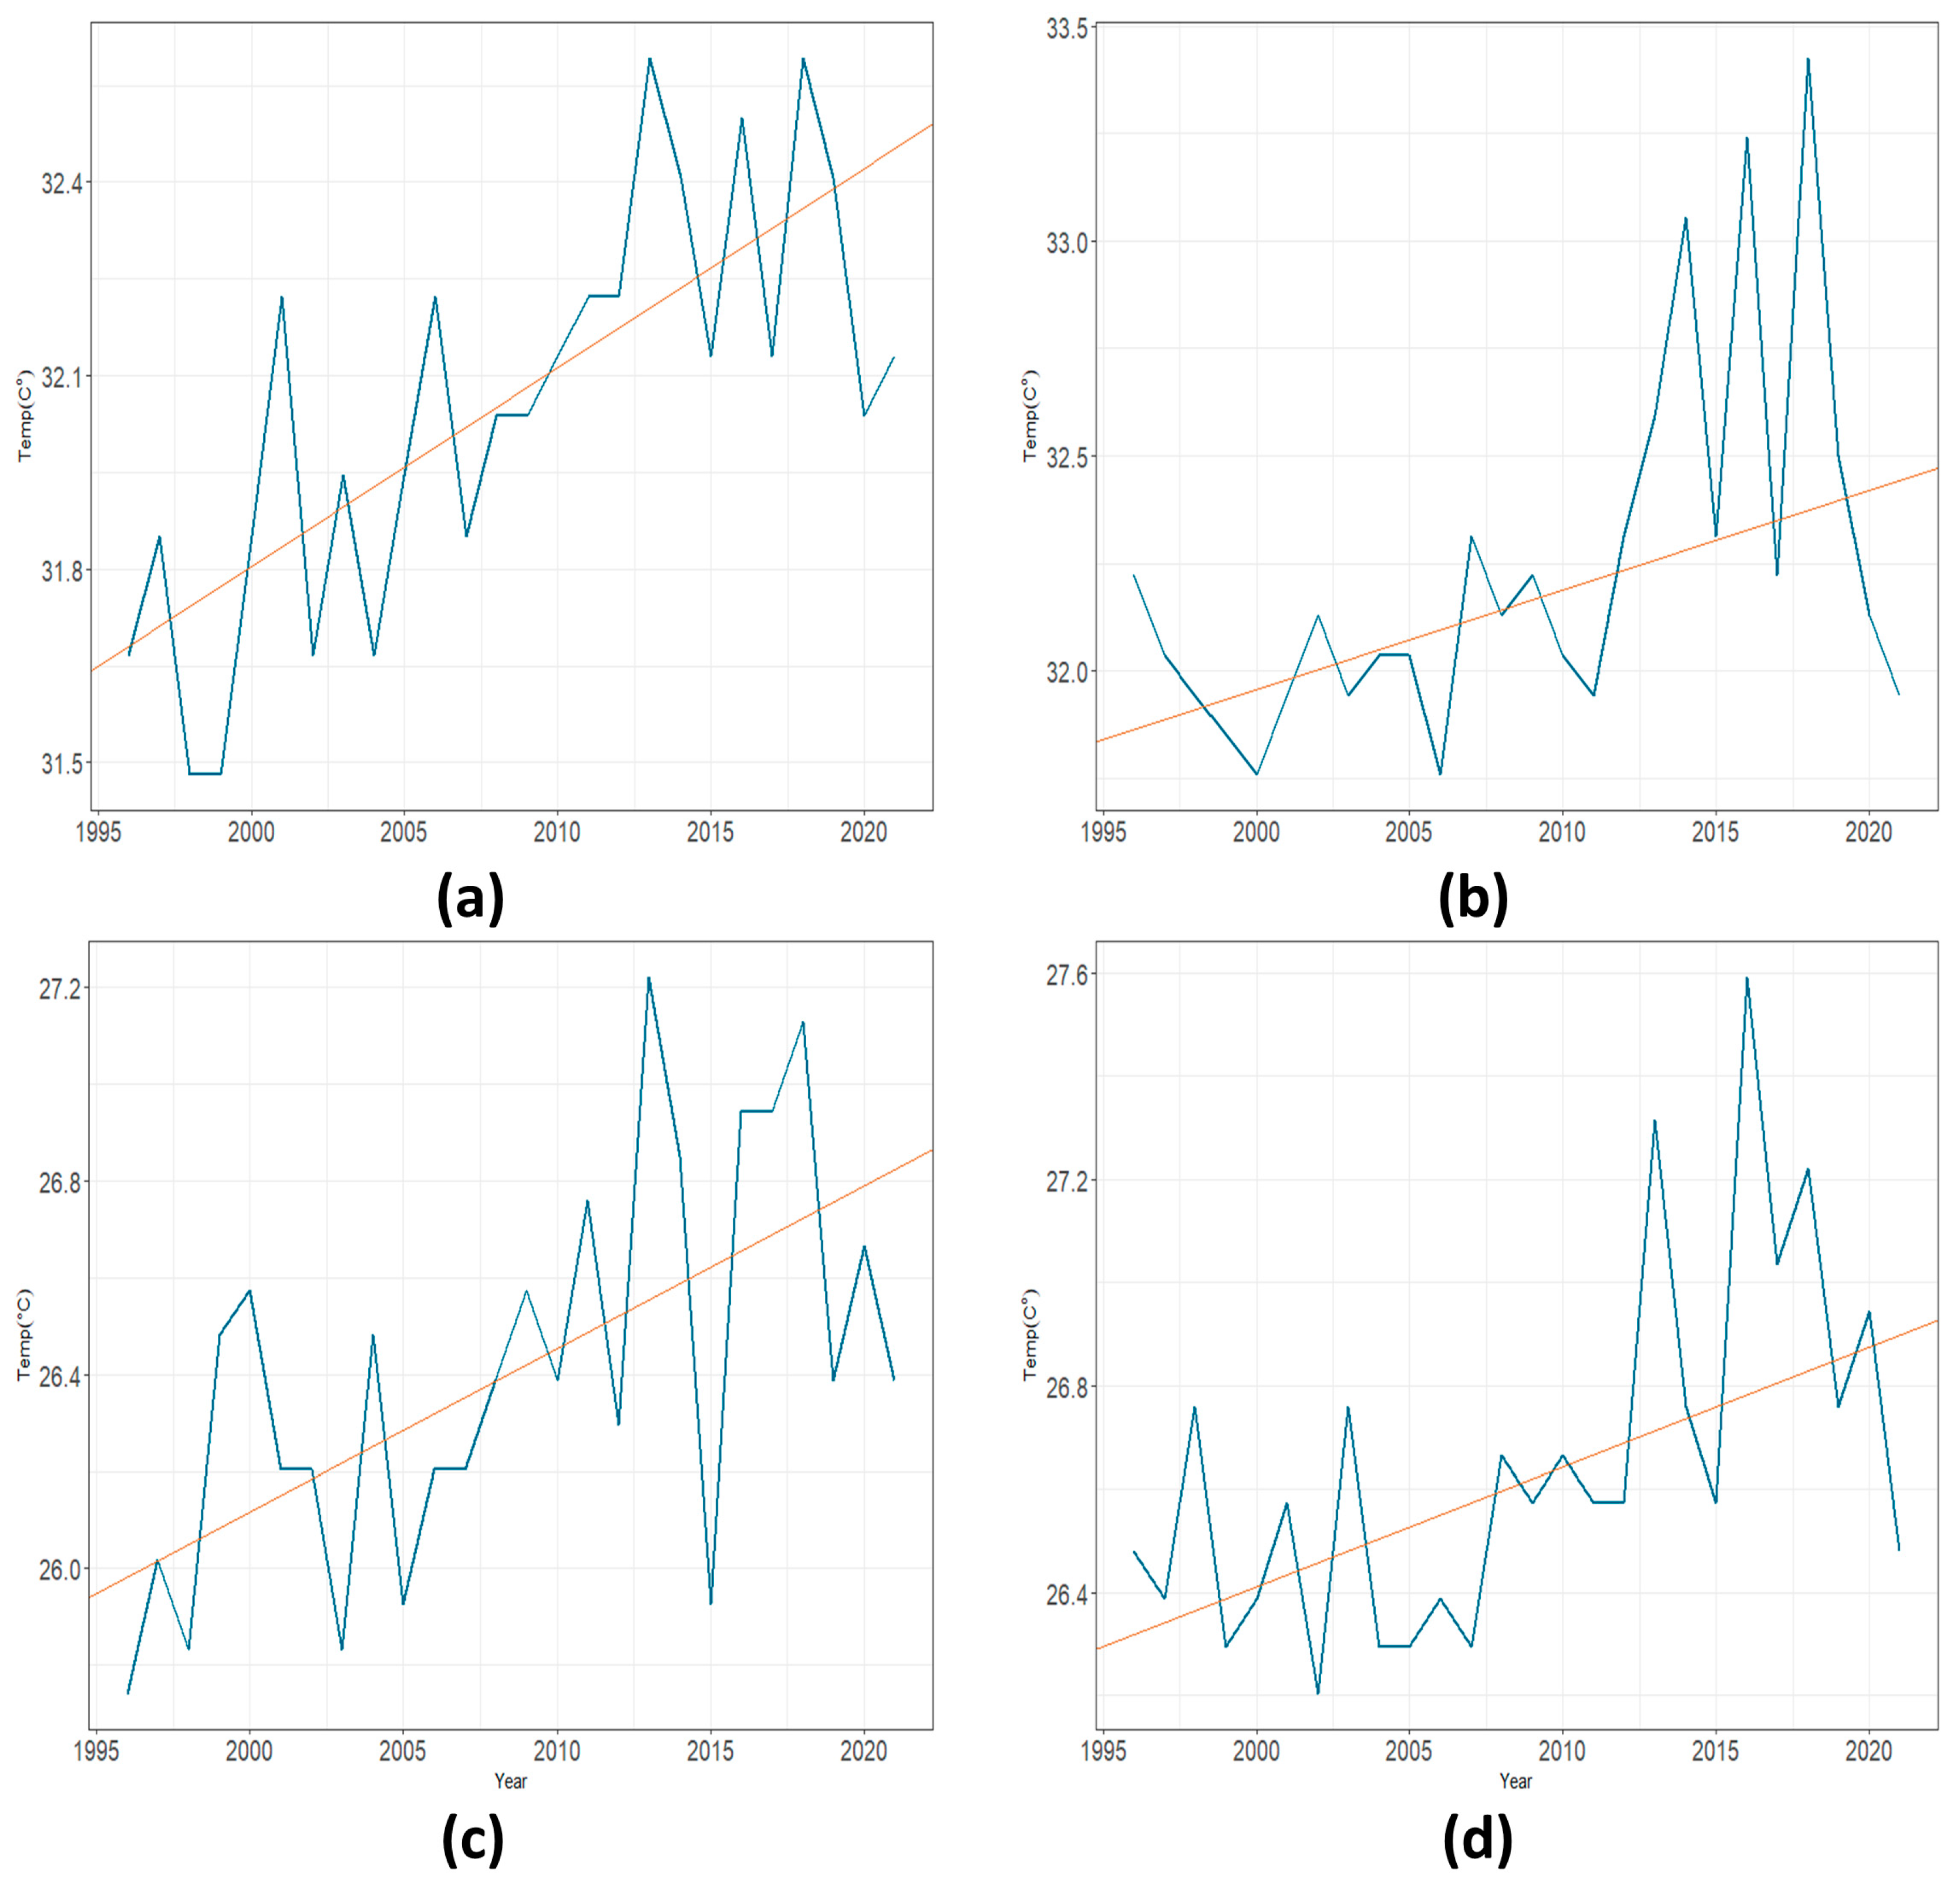
3.1. Trends in Temperatures

Only two stations (Andersen Airforce Base (AAFB) and Guam International Airport (GIAP)) in Guam have reliable temperature records over the period of 1953–2002 and 1958–current, respectively. To avoid the effects induced by heterogeneity on trend tests, this study uses the entire data from AAFB station, but those from 1996–2021 from GIAP station.
Mann–Kendall tests were implemented for six climate change indices (TXx, TXn, TX90p, TNx, TNn, and TN10p) for Tmax and Tmin with three different time scales: annual, two-seasons (dry season and wet season), and four seasons (JFM: January–February–March, AMJ: April–May–June, JAS: July–August–September, and OND: October–November–December). Table 3 and Table 4 show the Kendall’s tau and Sen’s slope (°C/year) test results for the annual, two seasonal, and four seasonal series of TXx, TXn, TX90p, TNx, TNn, and TN10p. In these table, bold and underlined values represent significant strong-trend (p ≤ 0.05), and bold those denote significant trend (0.05 < p-value ≤ 0.1).
Trend analyses have indicated that strong increases in Tmax and Tmin are detected in both AAFB and GIAP. More specifically, the values of TXx, as an extremely hot day index, were 0.036 °C/year for dry season and 0.025 °C/year for wet season at AAFB, and 0.031 °C/year and 0.023 °C/year for dry and wet seasons at GIAP, respectively. The increasing magnitude of TXx during AMJ and JAS was bigger than those during JFM and OND at both stations. It happened to not only TXx, but also all indices. Only AAFB has statistically significant increasing trends in TX90p, another extremely hot day index. Like the TXx, the increasing magnitude of TX90p during AMJ was the biggest among other periods. Regarding Tmin, AAFB showed significant strong trends in all indices and all time frames, while GIAP performed strong trends in only TNx and significant trends in other indices. The magnitudes of TNn, as an extreme cool day index, were 0.022 °C/year for dry season and 0.019 °C/year for wet season at AAFB, and 0.034 °C/year for dry season and 0.023 °C/year for wet season at GIAP, respectively. The highest values of all Sen’s slopes for all indices during AMJ means the greatest change in temperature during the season, so the temperature has been changing rapidly compared to other seasons. Theil–Sen regression lines in two-seasonal maximums of Tmax (TXx) and Tmin (TNx) for AAFB and GIAP are shown in Figure 3 and Figure 4, respectively.

3.2. Trends in Rainfalls
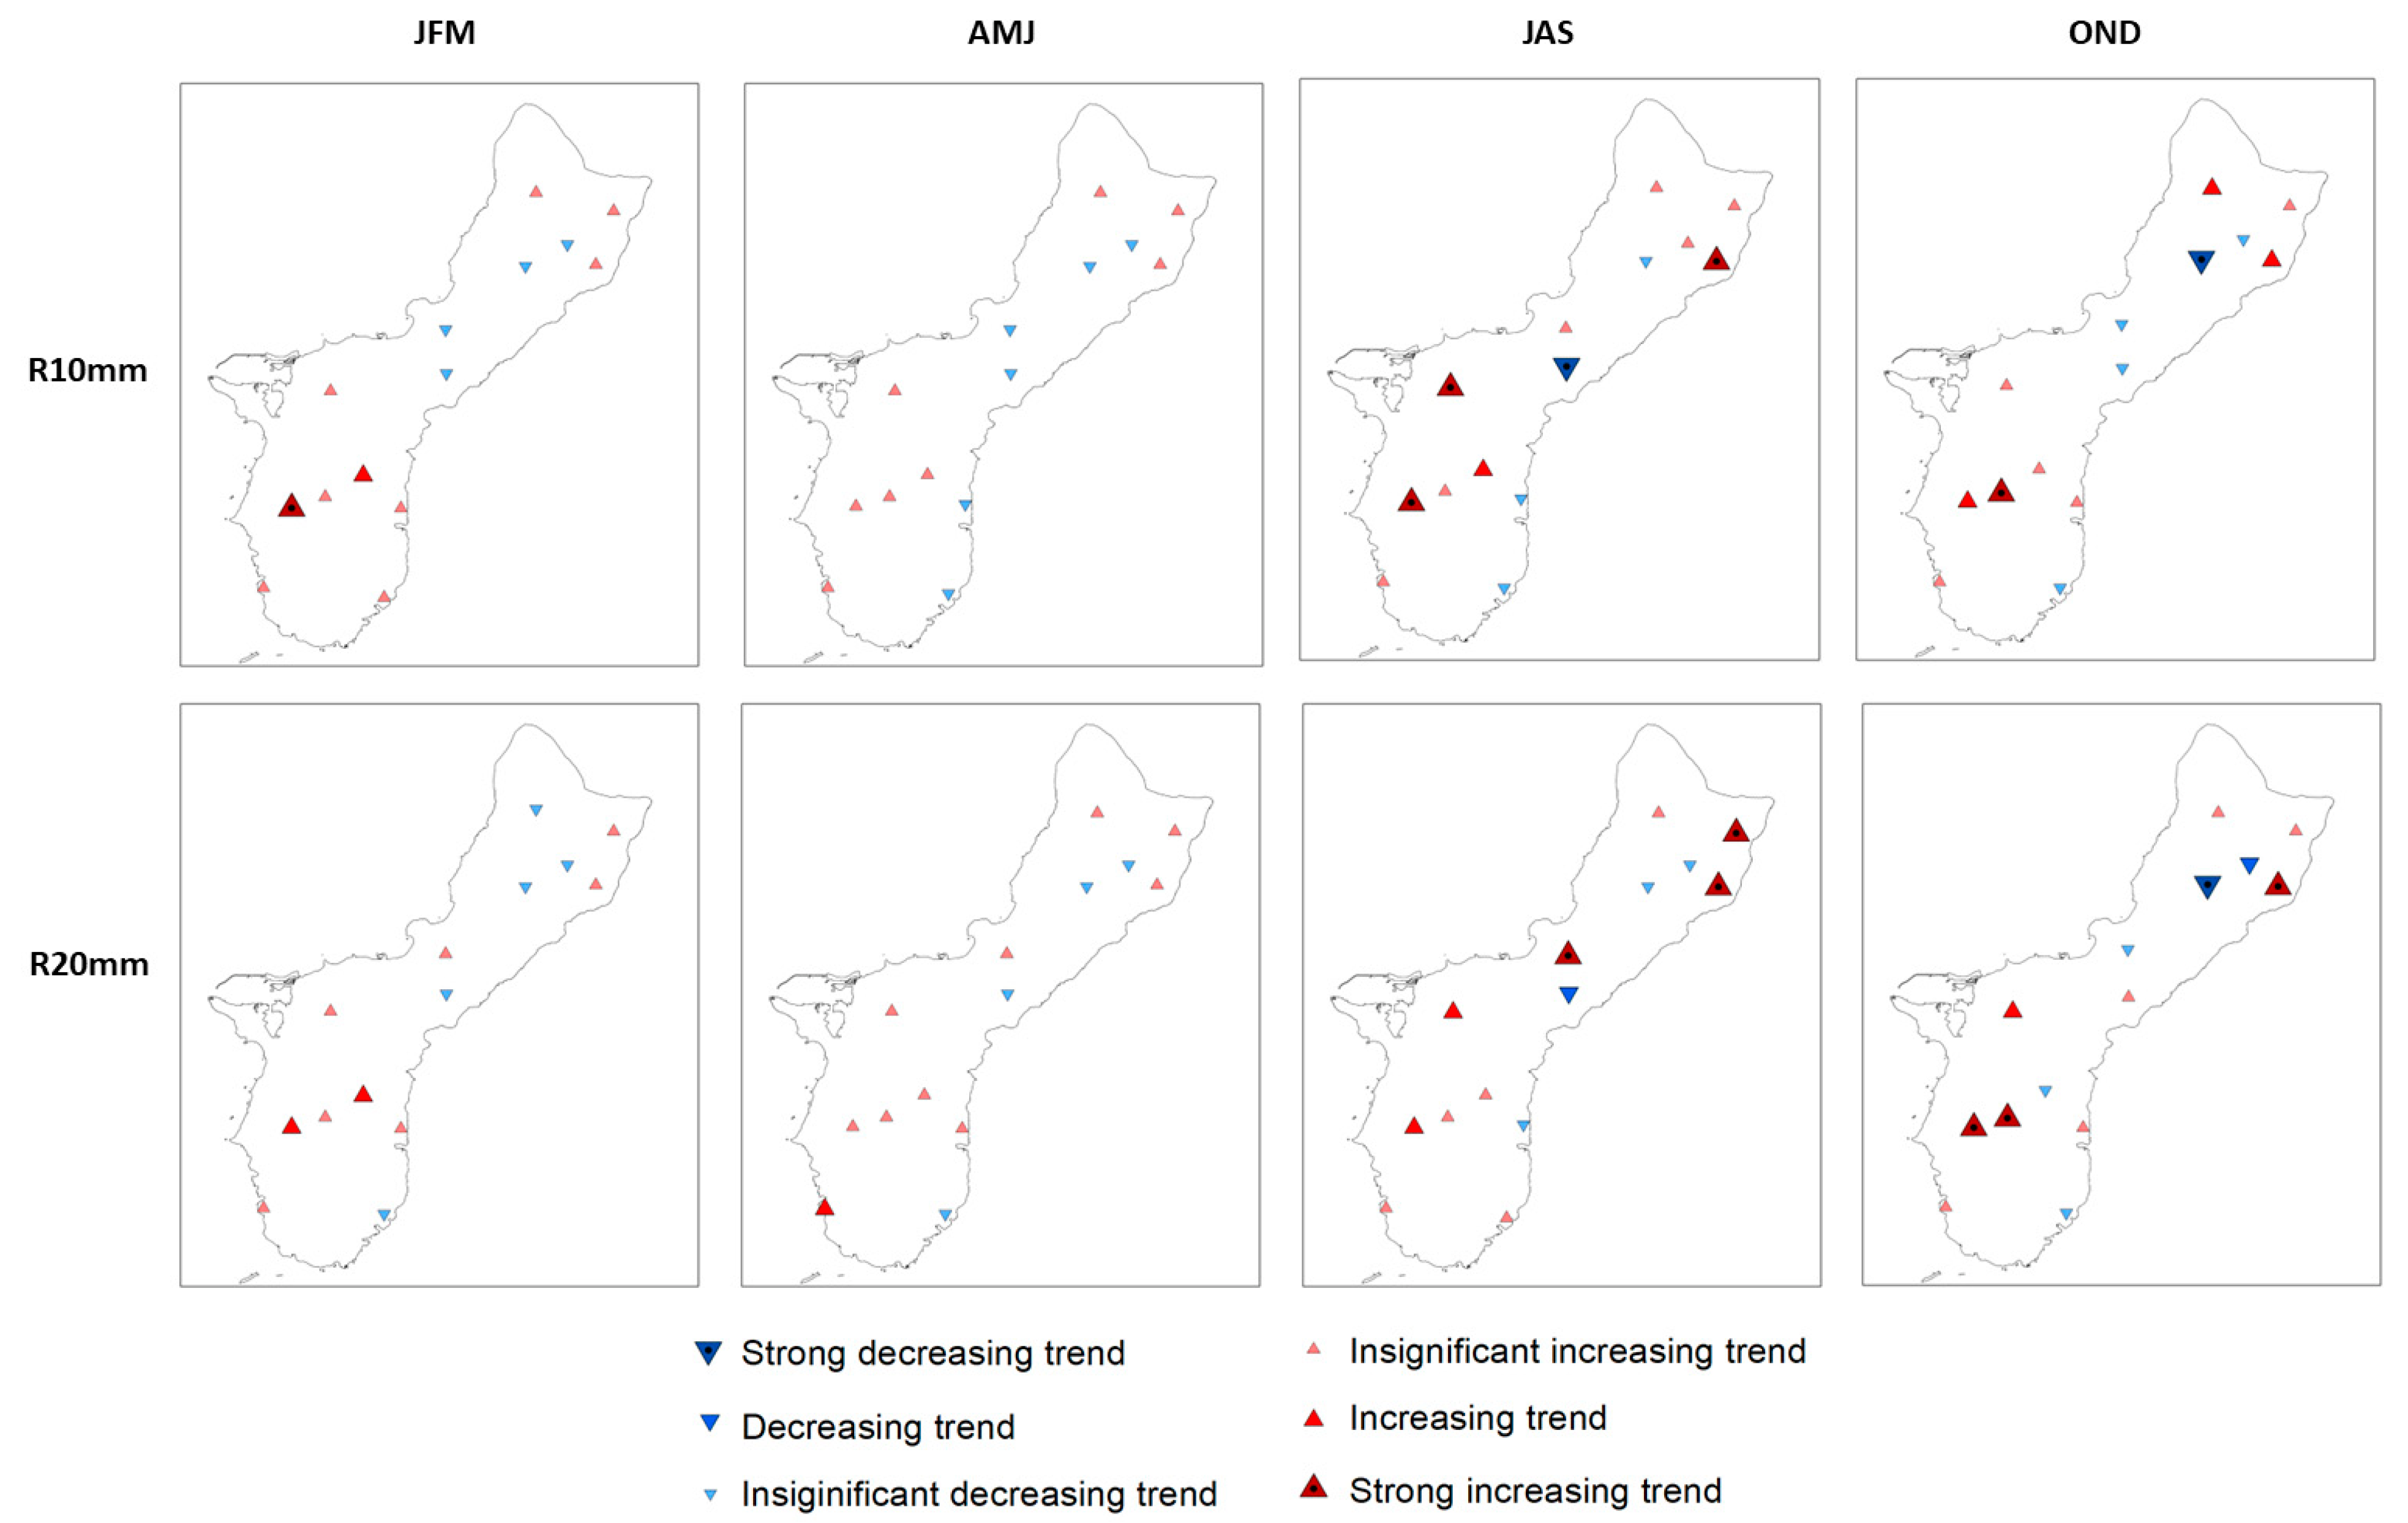
A total of seven indices are used to evaluate the statistical significance of trends in annual, two-seasonal, and four-seasonal rainfall features. Three of them represent basic information, while the remaining represent characteristics of rainfall extremes.

3.2.1. Basic Index

Regarding total rainfall amount, statistically significant trends were detected during wet season (JAS and OND) (Figure 5). The strong increasing trends in three stations and statistically significant increasing trends in three stations during JAS, while Mangilao and Dededo show strong increasing and decreasing trends during OND, respectively. The majority of stations showing significant trends are located in southern Guam. Prcp1 represents the percentage of wet days; thus, the significance of the index implies that the rainfall occurrence patterns are changing. The second row of Figure 5 indicates that the results of the four-seasonal rainfall occurrences show most of the significant trends (9 stations out of 14 stations) during JAS period. Trends in the total rainfall amounts are observed for JAS, while those in occurrences are detected all year round. SDII is used to investigate trends in rainfall intensities over the stations. By the combination of the increased rainfall amount and occurrences, some stations do not have statistical trends. Because 90% of freshwater demand in Guam is from the freshwater lens, statistically significant trends in rainfall total amount and occurrences over the region inevitably result in changes in groundwater resources. Figure 5 has indicated that strong trends in rainfall amounts, occurrences, and intensities are detected over northern Guam.
Table 5 shows Sen’s slopes of each index in terms of different time frames. Likewise, temperatures trend result table, bold and underlined values represent statistically significant strong trend (p ≤ 0.05), and bold those show significant trend (0.05 < p-value ≤ 0.1). For example, Dededo has strong trends in total rainfall amount with −0.105 mm/year, rainfall occurrence with −0.347%/year of, and rainfall intensity with −0.223 mm/year during OND period.

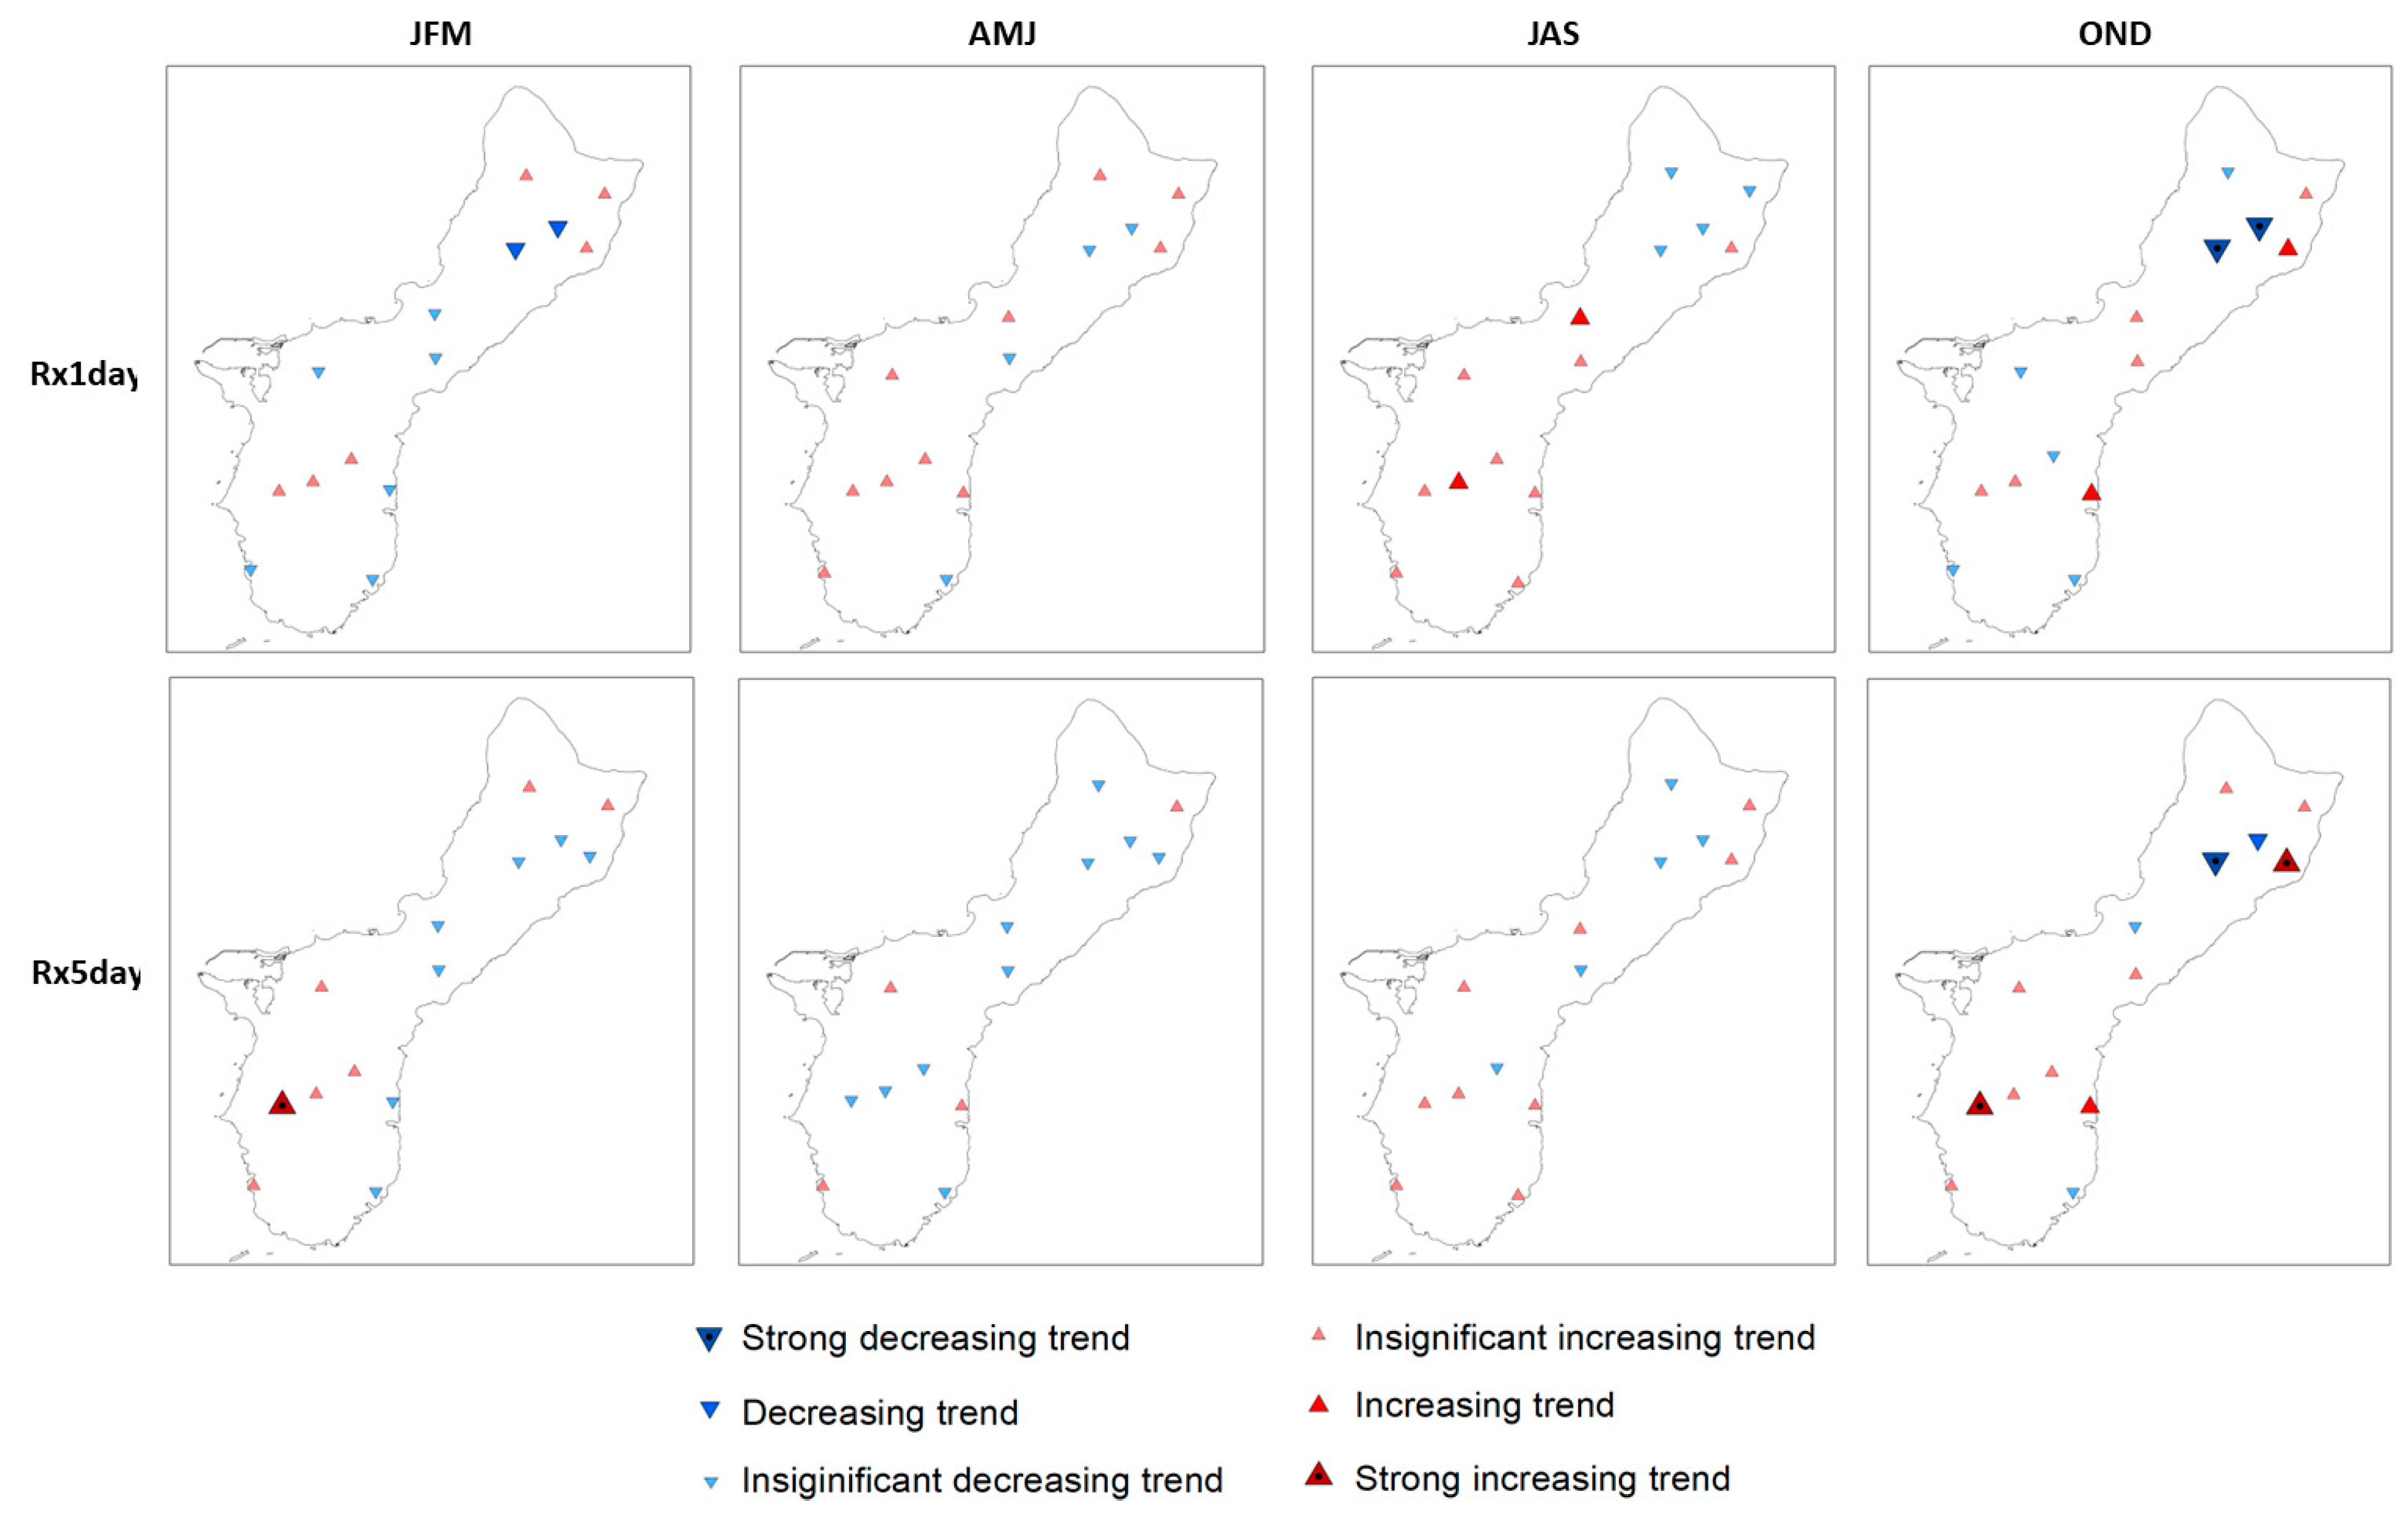
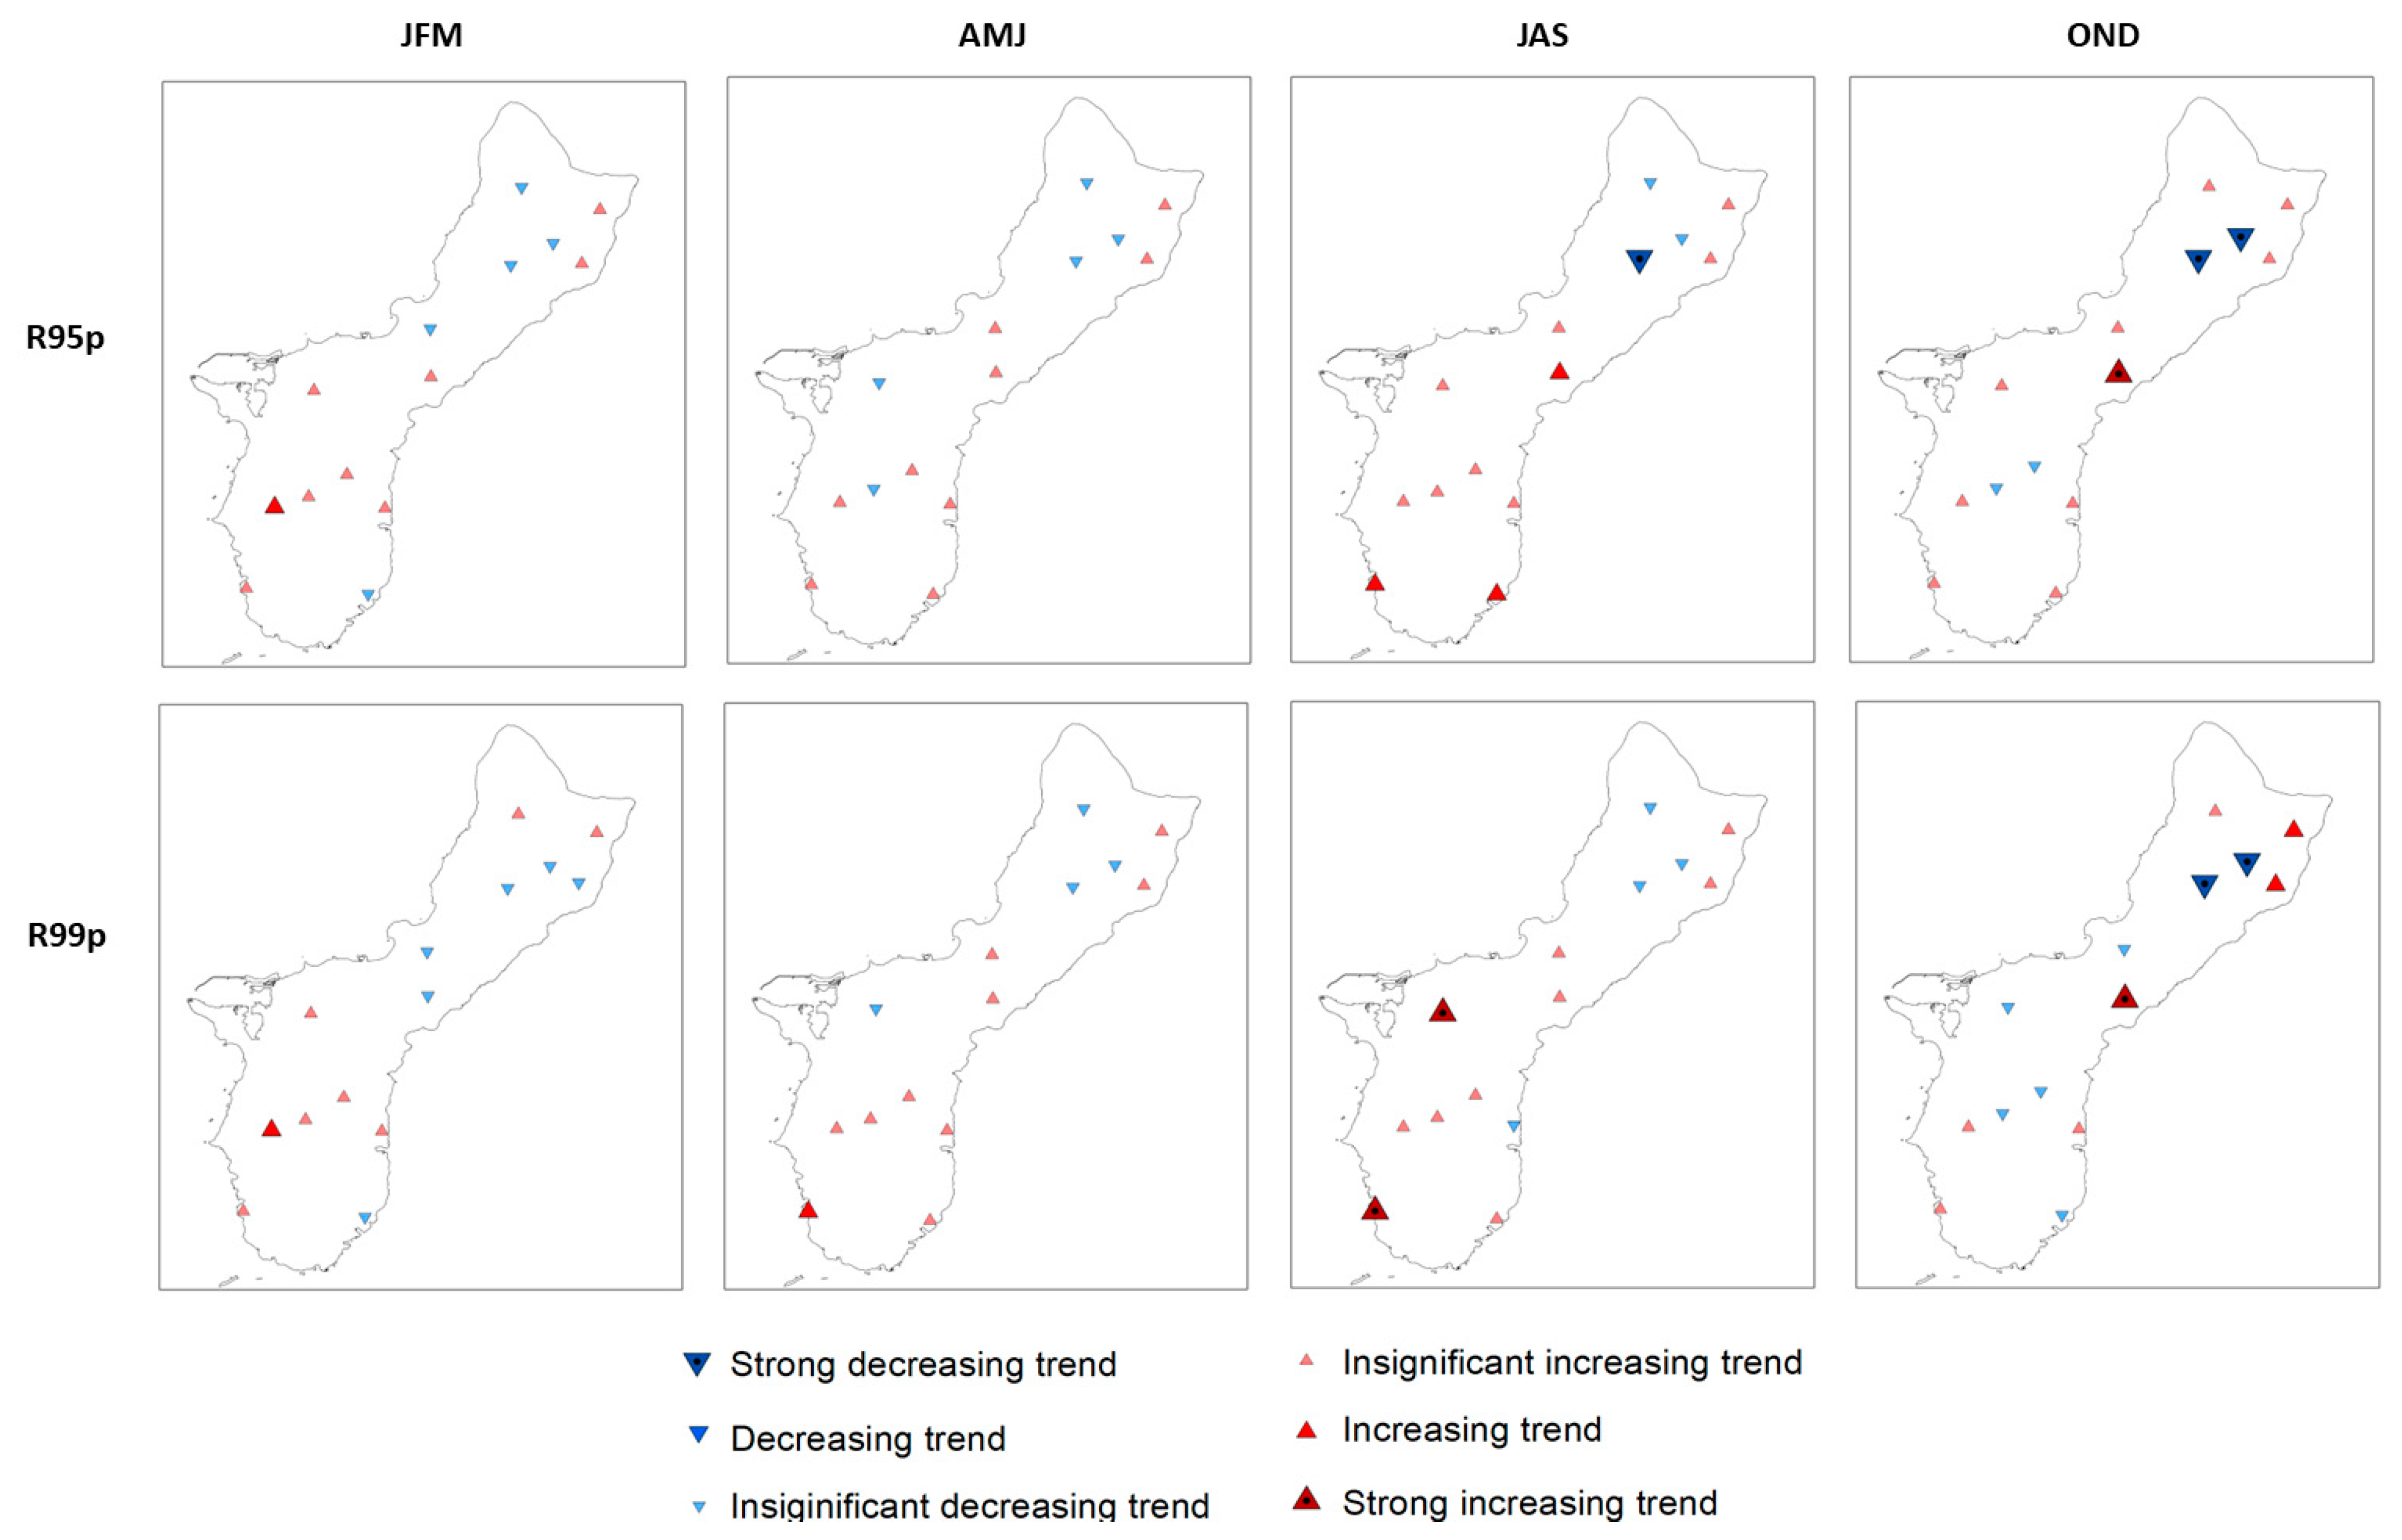
3.2.2. Extreme Rainfall Index

In this study, seasonal values of R10mm, R20mm, Rx1day, Rx5day, R95p, and R99p are calculated for trend analyses of extreme rainfall events. R10mm and R20mm indicate the number of rain events exceeding 10 mm/day and 20 mm/day, respectively. Figure 6 reveals strong trends and statistically significant trends in the extreme indices. For the JAS period, a majority of strong increasing trends in R10mm are observed in southern Guam, while those in R20mm are detected in the northern Guam. However, the increasing and decreasing trends in R10mm and R20mm for the OND are similar. The magnitudes of R10mm and R20mm at Mt. Santa Rosa, located in northern Guam, are 0.732 day/year and 0.646 day/year, respectively (Table 5). Figure 7 shows the trend analysis results for Rx1day and Rx5days. Only four stations have strong increasing and decreasing trends in these indices for the OND. Although Mt. Santa Rosa and Dededo stations are very close to each other, the trend directions for the OND period are opposite (3.144 mm/year for Mt. Santa Rosa and −3.714 mm/year for Dededo). It implies the high localized characteristics of extreme rainfalls. The 95th and 99th quantiles of daily rainfall trend analysis results have been shown in Figure 8. In general, rain gauge stations located along the shoreline show significant increasing trends. Especially, sub-watersheds receiving rainfalls around Mt. Chachao rain gauge are connected to important ecological reserve areas (ERAs), such as Apra harbor, Haputo ERA, and Orote Peninsula ERA. As shown in Table 6, the strong increase (0.862 mm/year) in R99p during the JAS period would aggravate water quality due to the more sediments; thus, more coral reef bleach would be expected with the increasing trend. Moreover, Umatac, one of the major rain gauges in southern Guam, shows increasing trends during the JAS in both R95p (0.633 mm/year) and R99p (1.503 mm/year). Although floods have been observed in the region, the trend analysis results indicate that the region is likely to be exposed to high risks due to the strong increase in extreme rainfalls.

4. Conclusions

Pacific islands have always been at the front of the great challenge of climate change. Sea level rise threatens not only the survival of small Pacific islands, but also have a significant impact on freshwater resources. Due to the relatively small size of catchments receiving rainfalls, the small islands rely only on precipitation for drinking water and irrigation water resources. Consequently, changes in precipitation patterns such as intensity, occurrences, and extreme events result directly in water availability on the islands. This study has, therefore, been conducted to provide a better understanding of the current characteristics of the Guam climate system for supporting the following climate change-related hazard mitigation programs.
Natural variability and complexity of the climate system make it difficult to detect climate change. In this study, we use 17 climate change detection indices, including 13 core indices facilitated by ETCCDI and 4 use-defined indices. The indices are calculated for different time frames (annual, two-seasonal, and four-seasonal) using daily precipitation data and maximum and minimum temperature from a network of 14 gauged stations in Guam region for the period 1953–2021. Mann–Kendall’s tau-based slope estimator is implemented for the calculated indices.
The temperature trend analysis results indicate that Guam’s climate is getting warmer year by year. The values of the seasonal maximum of Tmax (TXx) are 0.036 °C/year for the dry season, which is from January to July, and 0.025 °C/year for the wet season, which is from August to December, at AAFB, and 0.031 °C/year and 0.023 °C/year for the dry and wet seasons at GIAP, respectively. The increasing magnitudes of TXx during the dry season are 0.011 °C/year at AAFB and 0.08 °C/year at GIAP, bigger than those during the wet season, respectively. For Tmin, AAFB showed significant strong trends in all indices and all time frames, while GIAP performed strong trends in only TNx and significant trends in other indices. The magnitudes of TNn, as an extreme cool day index, were 0.022 °C/year for dry season and 0.019 °C/year for wet season at AAFB, and 0.034 °C/year for dry season and 0.023 °C/year for wet season at GIAP, respectively. The highest values of Sen’s slope for all temperature change indices are shown in the period of AMJ. It implies that the temperature during AMJ has been increasing rapidly compared to other seasons.
Regarding rainfall trends, we conduct the trend analyses with two different features: basic statistics and extreme statistics. Statistically significant trends in total rainfall amount are detected during wet season (JAS and OND). In particular, strong trends in rainfall occurrences are observed at 64 % of total rain gauges during JAS period. In addition to the basic statistics, trends analyses using R10mm, R20mm, Rx1day, Rx5day, R95p, and R99p have been carried out to detect changes in the extreme rainfall events. R10mm and R20mm indicate the number of rain events exceeding 10 mm/day and 20 mm/day, respectively. For the JAS period, a majority of strong increasing trends in R10mm are observed in southern Guam, while those in R20mm are detected in northern Guam. Regarding one-day and five-day accumulated maximum rainfall amounts, only four stations have strong change trends during OND. For the 95th and 99th quantiles of daily rainfall, Umatac located in southern Guam, shows increasing trends during the JAS in both R95p (0.633 mm/year) and R99p (1.503 mm/year). Since important ecological reserve areas and coral reef areas are linked to watersheds in southern Guam, the increasing trends in extreme rainfall indices (R10mm, R20mm, R95p, and R99p) during JFM and JAS periods would aggravate water quality due to the more sediments.
In subsequent work, we will further refine the climate change trend analysis results by adding groundwater quality data for investigating the effects of climate change on freshwater resources in Guam. However, many sites are not only deactivated but also contain a lot of missing data; a more stable weather station is needed for future climate change adaptation studies. In addition, the reliability of the data when the typhoon came was unstable, so there was a limit to analyzing the extreme event by the typhoon. Finally, further studies will cover regional climate change studies to reveal current climate-related risks.

Author Contributions

Conceptualization, M.-H.Y.; methodology, M.-H.Y.; validation, M.-H.Y.; formal analysis, M.-H.Y.; investigation, M.-H.Y.; resources, M.-H.Y. and A.C.; data curation, A.C.; writing—original draft preparation, M.-H.Y.; writing—review and editing, U.D.P., A.C. and R.K.; visualization, M.-H.Y.; supervision, M.-H.Y.; project administration, M.-H.Y.; funding acquisition, M.-H.Y. All authors have read and agreed to the published version of the manuscript.

Funding

This work was supported by a subaward from the FEMA-4398-DR-GU Hazard Mitigation Grant Program [HMGP DR-4398-05].

Data Availability Statement

The data that support the findings of this study are available from National Oceanic and Atmospheric Administration (NOAA) National Climatic Data Center (NCDC). These data were derived from the following resources available in the public domain: https://www.ncei.noaa.gov/cdo-web/.

Conflicts of Interest

The authors declare no conflict of interest.

References

  1. Mycoo, M.; Wairiu, M.; Campbell, D.; Duvat, V.; Golbuu, Y.; Maharaj, S.; Nalau, J.; Nunn, P.; Pinnegar, J.; Warrick, O. Small Islands. In Climate Change 2022: Impacts, Adaptation and Vulnerability. Contribution of Working Group II to the Sixth Assessment Report of the Intergovernmental Panel on Climate Change; Cambridge University Press: Cambridge, UK; New York, NY, USA, 2022. [Google Scholar]
  2. Khalid, S.; Khan, H.A.; Arif, M.; Altawaha, A.R.; Adnan, M.; Fahad, S.; Shah, A.; Parmar, B. Effects of climate change on irrigation water quality. In Environment, Climate, Plant and Vegetation Growth; Springer: Cham, Switzerland, 2020; pp. 123–132. [Google Scholar]
  3. Pearce, T.; Currenti, R.; Mateiwai, A.; Doran, B. Adaptation to climate change and freshwater resources in Vusama village, Viti Levu, Fiji. Reg. Environ. Change 2018, 18, 501–510. [Google Scholar] [CrossRef]
  4. Comeros-Raynal, M.T.; Lawrence, A.; Sudek, M.; Vaeoso, M.; McGuire, K.; Regis, J.; Houk, P. Applying a ridge-to-reef framework to support watershed, water quality, and community-based fisheries management in American Samoa. Coral Reefs 2019, 38, 505–520. [Google Scholar] [CrossRef]
  5. Smith, J.E.; Hunter, C.L.; Smith, C.M. The effects of top–down versus bottom–up control on benthic coral reef community structure. Oecologia 2010, 163, 497–507. [Google Scholar] [CrossRef] [PubMed]
  6. Gingerich, S.B. The Effects of Withdrawals and Drought on Groundwater Availability in the Northern Guam Lens Aquifer, Guam: US Geological Survey Scientific Investigations Report 2013–5216; U.S. Geological Survey: Reston, VA, USA, 2013. [Google Scholar]
  7. Simard, C.A.; Lander, M.A.; Habana, N.C. Salinity in the Northern Guam Lens Aquifer: WERI Technical Report; Water and Environmental Research Institute, University of Guam: Mangilao, GU, USA, 2015; p. 82. [Google Scholar]
  8. Choi, G.; Collins, D.; Ren, G.; Trewin, B.; Baldi, M.; Fukuda, Y.; Afzaal, M.; Pianmana, T.; Gomboluudev, P.; Huong, P.T.T.; et al. Changes in means and extreme events of temperature and precipitation in the Asia-Pacific Network region, 1955–2007. Int. J. Climatol. A J. R. Meteorol. Soc. 2009, 29, 1906–1925. [Google Scholar] [CrossRef]
  9. Grecni, Z.; Miles, W.; King, R.; Frazier, A.; Keener, V. Pacific Islands Regional Climate Assessment. In Climate Change in Guam: Indicators and Considerations for Key Sectors; East-West Center: Honolulu, HI, USA, 2020. [Google Scholar]
  10. Lough, J.M.; Meehl, G.A.; Salinger, M.J. Observed and projected changes in surface climate of the tropical Pacific. In Vulnerability of Tropical Pacific Fisheries and Aquaculture to Climate Change; Secretariat of the Pacific Community: Noumea, New Caledonia, 2011; pp. 49–99. [Google Scholar]
  11. Marra, J.J.; Kruk, M.C.; Abecassis, M.; Diamond, H.; Genz, A.; Heron, S.F.; Lander, M.; Liu, G.; Potemra, J.T.; Sweet, W.V.; et al. State of Environmental Conditions in Hawaii and the US Affiliated Pacific Islands under a Changing Climate: 2017; NOAA NCEI; John C. Stennis Space Center: Hancock County, MS, USA, 2017. [Google Scholar]
  12. McGree, S.; Herold, N.; Alexander, L.; Schreider, S.; Kuleshov, Y.; Ene, E.; Finaulahi, S.; Inape, K.; MacKenzie, B.; Malala, H.; et al. Recent changes in mean and extreme temperature and precipitation in the Western Pacific Islands. J. Clim. 2019, 32, 4919–4941. [Google Scholar] [CrossRef]
  13. Taylor, S.; Kumar, L. Global climate change impacts on pacific islands terrestrial biodiversity: A review. Trop. Conserv. Sci. 2016, 9, 203–223. [Google Scholar] [CrossRef] [Green Version]
  14. Caesar, J.; Alexander, L.V.; Trewin, B.; Tse-Ring, K.; Sorany, L.; Vuniyayawa, V.; Keosavang, N.; Shimana, A.; Htay, M.M.; Karmacharya, J.; et al. Changes in temperature and precipitation extremes over the Indo-Pacific region from 1971 to 2005. Int. J. Climatol. 2011, 31, 791–801. [Google Scholar] [CrossRef]
  15. Tank, A.M.G.K.; Zwiers, F.W.; Zhang, X. Climate Data and Monitoring WCDMP-72: Guidelines on Analysis of Extremes in a Changing Climate in Support of Informed Decisions for Adaptation; World Meteorological Organization: Geneva, Switzerland, 2009; p. 56. [Google Scholar]
  16. Hong, Y.; Ying, S. Characteristics of extreme temperature and precipitation in China in 2017 based on ETCCDI indices. Adv. Clim. Change Res. 2018, 9, 218–226. [Google Scholar]
  17. Chervenkov, H.; Slavov, K. ETCCDI climate indices for assessment of the recent climate over southeast Europe. In Advances in High Performance Computing: Results of the International Conference on “High Performance Computing” Borovets, Bulgaria, 2–6 September 2019; Springer: Cham Switzerland, 2021. [Google Scholar]
  18. Kang, K.K.; Lee, D.S.; Hwang, S.H.; Kim, B.S. Analysis of extreme weather characteristics change in the Gangwon province using ETCCDI indices. J. Korea Water Resour. Assoc. 2014, 47, 1107–1119. [Google Scholar] [CrossRef]
  19. Taboroši, D.; Hirakawa, K.; Sawagaki, T. Carbonate precipitation along a microclimatic gradient in a Thailand cave—Continuum of calcareous tufa and speleothems. J. Cave Karst Stud. 2005, 67, 69–87. [Google Scholar]
  20. Tracey, J.I., Jr.; Schlanger, S.O.; Stark, J.T.; Doan, D.B.; May, H.G. General Geology of Guam; United States Government Printing Office: Washington, DC, USA, 1964. [Google Scholar]
  21. Mark, L.; Chip, G. Creation of a 50-Year Rainfall Database, Annual Rainfall Climatology, and Annual Rainfall Distribution Map for Guam. In WERI Technical Report 2003; Water and Environmental Research Institute of the Western Pacific: Mangilao, GU, USA, 2003; p. 31. [Google Scholar]
  22. Qian, B.; Gregorich, E.G.; Gameda, S.; Hopkins, D.W.; Wang, X.L. Observed soil temperature trends associated with climate change in Canada. J. Geophys. Res. Atmos. 2011, 116, D02106. [Google Scholar] [CrossRef]
  23. Pettitt, A.N. A non-parametric approach to the change-point problem. J. R. Stat. Soc. Ser. C (Appl. Stat.) 1979, 28, 126–135. [Google Scholar] [CrossRef]
  24. Sen, P.K. Estimates of the regression coefficient based on Kendall’s tau. J. Am. Stat. Assoc. 1968, 63, 1379–1389. [Google Scholar] [CrossRef]
  25. Almeida, C.T.; Oliveira-Júnior, J.F.; Delgado, R.C.; Cubo, P.; Ramos, M.C. Spatiotemporal rainfall and temperature trends throughout the Brazilian Legal Amazon, 1973–2013. Int. J. Climatol. 2017, 37, 2013–2026. [Google Scholar] [CrossRef]
  26. Sharma, D.; Babel, M.S. Trends in extreme rainfall and temperature indices in the western Thailand. Int. J. Climatol. 2014, 34, 2393–2407. [Google Scholar] [CrossRef]
  27. Wu, C.; Huang, G.; Yu, H.; Chen, Z.; Ma, J. Spatial and temporal distributions of trends in climate extremes of the Feilaixia catchment in the upstream area of the Beijiang River Basin, South China. Int. J. Climatol. 2014, 34, 3161–3178. [Google Scholar] [CrossRef]
Figure 1. Locations of meteorological stations on Guam daily maximum and minimum temperature and daily precipitations.
Climate 11 00081 g001
Figure 2. Change detection of monthly mean temperatures at Guam International Airport using Pettitt’s test. Orange line represents monthly mean temperatures recorded by NOAA SWMO (1958–1995), and blue line denotes those by NOAA WFO (1996–current). A change point was detected in March 1995. Orange line shows the trend line for monthly temperatures for the 1958–1995 and purple line does for the 1996–current.
Climate 11 00081 g002
Figure 3. Trends in two-seasonal maximum of Tmax (TXx) and Tmin (TNx) over 1953–2002 at AAFB. (a) dry-season of TXx, (b) wet-season of TXx, (c) dry-season of TNx, and (d) wet-season of TNx. Red lines are Theil–Sen regression lines.
Climate 11 00081 g003
Figure 4. Trends in two-seasonal maximum of Tmax (TXx) and Tmin (TNx) over 1996–2021 at GIAP. (a) dry-season of TXx, (b) wet-season of TXx, (c) dry-season of TNx, and (d) wet-season of TNx. Red lines are Theil–Sen regression lines.
Climate 11 00081 g004
Figure 5. Spatial distributions of seasonal trends of the basic rainfall indices: total precipitation in wet days (PRCPTOT, mm)), the percentage of wet days (Prcp1, %), and the simple precipitation intensity index (SDII, mm). Columns represent each season, and rows represent each index.
Climate 11 00081 g005
Figure 6. Spatial distributions of seasonal trends of the extreme rainfall indices: the number of heavy-rain days exceeding 10 mm/day (R10mm, days) and the number of heavy-rain days exceeding 20 mm/day (R20mm, days). Columns represent each season, and rows represent each index.
Climate 11 00081 g006
Figure 7. Spatial distributions of seasonal trends of the extreme rainfall indices: the maximum 1-day precipitation (Rx1day, mm) and the maximum 5-day precipitation (Rx5day, mm). Columns represent each season, and rows represent each index.
Climate 11 00081 g007
Figure 8. Spatial distributions of seasonal trends of the extreme rainfall indices: the 95th percentile of total precipitation (R95p, mm) and the 99th percentile of total precipitation (R99p, mm). Columns represent each season, and rows represent each index.
Climate 11 00081 g008
Table 1. List of station, their coordinates, data periods, and data sources.
NameLatitudeLongitudeData PeriodData Source
PrecipitationAndersen AFB13.576144.9281953–2002NOAA
NCDC
Dededo13.531144.8611975–2012
Guam International AP13.483144.8001958–2021
Inarajan Station13.285144.7551978–2021
Mangilao13.450144.8011970–2021
Pirates Cove13.352144.7672004–2019
Yigo13.548144.8931978–2012
Almagosa13.353144.6831993–2021USGS
Fena13.360144.7091994–2021
Geomag13.589144.8682012–2021
Mt Chachao13.439144.7121989–2021
Mt Santa Rosa13.536144.9152002–2021
Umatac13.292144.6621989–2021
Windward Hills13.377144.7381974–2021
TemperatureAndersen AFB13.576144.9281953–2002NOAA
NCDC
Guam International AP13.483144.8001958–2021
Table 2. Core indices of ETCCDI and additional user-defined indices. Bold/italic index denotes those used in this study. Here, PRCP = precipitation, TN = minimum temperature, and TX = maximum temperature.
Index CodeIndicator NameDefinitionUnit
FDnumber of frost daysno. of days when TN (daily minimum temperature) < 0 °Cdays
SUnumber of summer daysno. of days when TX (daily maximum temperature) > 25 °Cdays
IDnumber of icing daysno. of days when TX (daily maximum temperature) < 0 °Cdays
TRnumber of tropical nightsno. of days when TN (daily minimum temperature) > 20 °Cdays
GSLgrowing season lengthAnnual (1 January to 31 December in Northern Hemisphere (NH), 1 July to 30 June in Southern Hemisphere (SH)) count between first span of at least 6 days with daily mean temperature (TG) > 5 °C and first span after 1 July (1 January in SH) of 6 days with TG < 5 °Cdays
TXxmax TXmonthly maximum value of daily TX°C
TNxmax TNmonthly maximum value of daily TN°C
TXnmin TXmonthly minimum value of daily TX°C
TNnmin TNmonthly minimum value of daily TN°C
TN10p10th percentile of TNvalue of 10th percentile of daily TN°C
TX10p10th percentile of TXvalue of 10th percentile of daily TX °C
TN90p90th percentile of TNvalue of 90th percentile of daily TN °C
TX90p90th percentile of TXvalue of 90th percentile of daily TX °C
WSDIwarm spell duration indexno. of days with at least 6 consecutive days when TX > 90th percentiledays
CSDIcold spell duration indexno. of days with at least 6 consecutive days when TN < 10th percentiledays
DTRdaily temperature rangemonthly mean difference between TX and TN°C
PRCPTOTtotal PRCP in wet dayssum of daily PRCP amountmm
Prcp1percentage of wet daysPercentage of wet days%
SDIIsimple PRCP intensity indextotal PRCP divided by the no. of wet days (when total PRCP ≥ 1.0 mm)mm/day
R10mmno. of heavy-rain days exceeding 10 mm/daycount of days when PRCP ≥ 10 mmdays
R20mmno. of heavy-rain days exceeding 20 mm/daycount of days when PRCP ≥ 20 mmdays
Rx1daymaximum 1-day PRCPmax 1-day PRCP totalmm
Rx5daymaximum 5-day PRCPmax 5-day PRCP totalmm
R95pTOTtotal PRCP from heavy-rain days (95th percentile)sum of daily PRCP > 95th percentile mm
R99pTOTtotal PRCP from very-heavy-rain days (99th percentile)sum of daily PRCP > 99th percentilemm
CDDconsecutive dry daysmaximum number of consecutive days with RRCP < 1 mmdays
CWDconsecutive wet daysmaximum number of consecutive days with RRCP ≥ 1 mmdays
Table 3. Mann–Kendall’s tau and Sen’s slope (°C/year) for annual/two-seasonal/four-seasonal maximum of Tmax, minimum of Tmax, and the 90th percentile of Tmax from two stations (Andersen Airforce Base and Guam International Airport). Bold and underlined values represent statistically significant strong trend (p ≤ 0.05), and those bold represent a significant trend (0.05 < p-value ≤ 0.1). Here, JFM denotes the season from January to March, AMJ does from April to June, JAS does from July to September, and OND does from October to December.
Time
Frame
StatisticsTXxTXnTX90p
AAFBGIAPAAFBGIAPAAFBGIAP
AnnualTau0.3860.2910.2120.2070.3810.095
Sen0.0370.0000.0000.0000.0240.000
DryTau0.4720.5440.3800.2390.3800.239
Sen0.0360.0310.0310.0310.0310.031
WetTau0.4100.3980.3940.2150.3940.215
Sen0.0250.0230.0220.0130.0220.013
JFMTau0.4070.5570.3540.1550.3540.155
Sen0.0310.0290.0260.0230.0260.023
AMJTau0.4190.3530.3170.2690.3170.269
Sen0.0410.0250.0330.0400.0330.040
JASTau0.4510.4010.3920.1090.3920.109
Sen0.0360.0310.0300.0120.0300.012
ONDTau0.2720.2210.3020.2240.3020.224
Sen0.0190.0130.0180.0150.0180.015
Table 4. Mann–Kendall’s tau and Sen’s slope (°C/year) for annual/two-seasonal/four-seasonal maximum of Tmin, minimum of Tmin, the 10th percentile of Tmin from two stations (Andersen Airforce Base and Guam International Airport). Bold and underlined values represent statistically significant strong trend (p ≤ 0.05), and those bold represent a significant trend (0.05 < p-value ≤ 0.1). Here, JFM denotes the season from January to March, AMJ does from April to June, JAS does from July to September, and OND does from October to December.
Time
Frame
StatisticsTNxTNnTN10p
AAFBGIAPAAFBGIAPAAFBGIAP
AnnualTau0.4480.6070.2830.2530.2830.253
Sen0.0170.0370.0170.0260.0170.026
DryTau0.4560.4450.3990.3260.3990.326
Sen0.0220.0340.0190.0310.0190.031
WetTau0.4360.3930.2240.4800.2240.480
Sen0.0190.0230.0120.0350.0120.035
JFMTau0.3380.2060.2710.3230.2350.323
Sen0.0190.0150.0140.0340.0120.034
AMJTau0.4810.5070.3140.2570.3140.257
Sen0.0250.0490.0190.0340.0190.034
JASTau0.4330.3750.2720.5690.2720.569
Sen0.0190.0310.0150.0460.0150.046
ONDTau0.3250.1800.1700.2230.1700.223
Sen0.0160.0130.0090.0170.0090.017
Table 5. Magnitudes (Sen’s slopes) of the increasing or decreasing trends in PRCPTOT, Prcp1, SDII, R10mm, and R20mm. Bold and underlined values represent statistically significant strong trend (p ≤ 0.05), and those bold represent a significant trend (0.05 < p-value ≤ 0.1).
Site PRCPTOT
(mm)
Prcp1
(%)
SDII
(mm)
R10mm
(days)
R20mm
(days)
SitePRCPTOT
(mm)
Prcp1
(%)
SDII
(mm)
R10mm
(days)
R20mm
(days)
AAFBAnnual0.0230.0000.0290.0240.128Alamosa0.0890.5780.0440.8580.528
Dry0.0140.0000.2360.0890.0510.0570.5840.2640.2500.138
Wet0.0360.0000.243−0.050.0560.0640.437−0.0710.6670.444
JFM0.010.0000.027000.0730.5840.0320.2000.087
AMJ0.0210.1000.0310.04500.0320.573−0.0050.1030.048
JAS0.0330.1000.0210.0590.0830.0900.5010.0610.3120.200
OND0.016−0.1000.057000.0600.481−0.0020.3000.245
DededoAnnual−0.0480.235−0.120−0.750−0.462Fena0.0710.754−0.0420.8000.310
Dry−0.0450.192−0.434−0.229−0.0870.0380.643−0.3860.2060.048
Wet−0.056−0.018−1.207−0.500−0.3680.1060.834−0.8210.5000.279
JFM−0.0120.582−0.098−0.0430.0000.0540.802−0.1120.1380.000
AMJ−0.067−0.237−0.055−0.200−0.1030.0240.573−0.0390.0630.000
JAS0.0070.289−0.1280.000−0.1020.0670.735−0.0320.1560.000
OND−0.105−0.347−0.223−0.469−0.2740.0900.956−0.1050.4000.276
Guam APAnnual0.002−0.1000.018−0.0750.027Geomag−0.284−0.216−0.2821.4290.143
Dry−0.013−0.100−0.03−0.0780−0.239−0.753−0.6610.3330.000
Wet0.017−0.1000.15400.0630.0130.4820.1541.4000.500
JFM−0.01−0.100−0.012−0.0170−0.369−0.738−0.1980.333−0.250
AMJ−0.008−0.1000.003−0.0290−0.101−0.370−0.1190.6670.125
JAS0.030.0000.04200.057−0.2740.437−0.3760.0000.000
OND−0.003−0.1000.006000.4230.4300.3791.6000.667
InarajaAnnual0.0420.401−0.009−0.0770.037Mt. Chachao0.0290.432−0.0590.8210.400
Dry0.0080.355−0.110−0.067−0.0670.0040.177−0.2480.1360.103
Wet0.0710.4240.166−0.1090.0250.0170.535−0.9230.6670.333
JFM0.0160.381−0.0470.000−0.051−0.0010.246−0.0190.0770.000
AMJ−0.0010.254−0.023−0.103−0.0630.0260.243−0.0460.1060.056
JAS0.0960.4010.054−0.0420.0000.0030.562−0.1430.3180.184
OND0.0340.390−0.019−0.0280.0000.0000.427−0.0870.2500.140
MangilaoAnnual0.0670.1560.067−0.343−0.171Mt. Santa Rosa0.0810.3190.0391.8661.165
Dry0.0180.1120.249−0.074−0.040−0.0200.110−0.5300.2500.250
Wet0.1260.2180.465−0.133−0.0490.1700.2331.3041.7481.000
JFM0.0160.0830.011−0.0250.000−0.0230.145−0.2420.1910.143
AMJ0.0070.1750.055−0.0910.000−0.027−0.0540.0530.0000.111
JAS0.1190.2620.053−0.155−0.0950.1820.2220.0700.7320.646
OND0.1180.2160.1200.0000.0000.1900.3780.1631.0000.500
Pirates CoveAnnual0.048−0.1580.072−0.321−0.111Umatac0.0460.3810.0170.3270.297
Dry0.003−0.2390.9840.2780.2930.0400.3590.6240.2310.131
Wet0.1060.0170.2410.2220.0420.0930.4770.2620.2120.167
JFM−0.013−0.6340.0330.3330.0910.0280.4060.0450.0850.000
AMJ0.068−0.1510.041−0.0830.0000.0450.3300.0780.1340.103
JAS0.094−0.350−0.099−0.400−0.1740.1190.4850.1250.0590.143
OND0.1060.498−0.0290.2000.1430.0450.490−0.0190.0740.000
YigoAnnual−0.0170.319−0.065−0.381−0.273Windward0.0110.0670.0030.1550.081
Dry−0.0110.124−0.441−0.286−0.0830.011−0.0150.2130.1400.091
Wet0.0040.189−0.962−0.286−0.3130.0190.091−0.0620.0920.047
JFM−0.0020.184−0.0750.0000.0000.0180.1220.0340.0750.037
AMJ0.0100.258−0.061−0.133−0.059−0.009−0.0680.0130.0000.000
JAS0.0780.635−0.1200.000−0.1080.0460.1810.0180.1190.065
OND−0.038−0.396−0.169−0.395−0.200−0.0010.025−0.0200.0000.000
Table 6. Magnitudes (Sen’s slopes) of the increasing or decreasing trends in Rx1day, Rx5day, R95pTOT, and R99pTOT. Bold and underlined values represent a statistically significant strong trend (p ≤ 0.05), and those bold represent a significant trend (0.05 < p-value ≤ 0.1).
Site Rx1day
(mm)
Rx5day
(mm)
R95pTOT
(mm)
R99pTOT
(mm)
SiteRx1day
(mm)
Rx5day
(mm)
R95pTOT
(mm)
R99pTOT
(mm)
AAFBAnnual−0.313−0.3130.0950.208Alamosa3.6473.6470.3750.756
Dry0.0660.5810.0730.1131.5502.2220.2480.832
Wet0.030.4420.1230.2942.3103.6530.1550.667
JFM0.1480.3940.0260.0851.0671.9200.3360.677
AMJ0.1110.5720.1250.0770.762−0.4880.0540.477
JAS00.4720.0510.1361.2392.5520.5310.913
OND0.180.1620.1410.3691.1413.7770.1100.694
DededoAnnual−2.578−2.578−0.290−0.661Fena2.6422.6420.1280.581
Dry−0.593−2.064−0.116−0.3761.2631.7270.0150.246
Wet−1.461−1.981−0.734−1.3181.7343.1910.0380.393
JFM−0.540−0.914−0.090−0.3680.1501.3690.0800.097
AMJ−0.457−1.036−0.190−0.3390.496−0.777−0.0910.477
JAS−0.305−0.635−0.571−0.6531.7533.4690.3320.896
OND−2.332−3.714−0.738−1.6790.3612.247−0.169−0.025
Guam APAnnual0.305−0.2860.0160.072Geomag−19.304−19.3040.013−2.540
Dry0.191−0.5200.0130.044.205−0.381−1.2981.080
Wet0.2−0.0730.060.081−21.209−19.304−0.560−1.245
JFM−0.113−0.683−0.001−0.0394.6574.064−1.0260.953
AMJ0.254−0.7960.0130.1180.889−8.033−0.219−1.630
JAS0.4470.1420.1250.23−21.209−34.629−1.565−6.745
OND0.061−0.0180.002−0.017−0.1276.7631.4410.857
InarajaAnnual−0.286−0.2860.2370.076Mt. Chachao0.8160.8160.100−0.348
Dry−0.098−0.5200.0990.113−0.0440.8830.006−0.116
Wet−0.322−0.0730.3460.1340.7951.386−0.0650.392
JFM−0.237−0.683−0.062−0.006−0.0730.6880.0860.135
AMJ−0.074−0.7960.0850.1140.0000.541−0.033−0.099
JAS0.0000.1420.3270.0910.9551.3860.0820.862
OND−0.385−0.0180.019−0.092−0.7981.1940.015−0.208
MangilaoAnnual−0.178−0.1780.2330.521Mt. Santa Rosa3.8213.8210.3281.140
Dry−0.271−0.8080.162−0.053−0.145−2.9770.1190.228
Wet0.492−0.1980.2540.2082.8534.7090.7322.706
JFM−0.092−0.5080.124−0.1520.318−1.5210.175−0.231
AMJ−0.062−0.6350.1950.0580.305−0.0180.0890.333
JAS0.254−1.6640.3270.2223.4194.6990.8901.819
OND0.3811.0670.3910.3733.1446.3500.6542.073
Pirates CoveAnnual5.8545.8540.0941.728Umatac2.2642.2640.3810.565
Dry−0.4690.5860.8011.1320.5852.4470.3110.708
Wet7.2958.1130.6370.2331.4872.3900.3700.611
JFM−1.270−1.7550.4330.160−0.2050.2050.2530.226
AMJ1.7271.3550.4951.0270.3811.0550.2190.635
JAS4.4106.5120.205−0.5071.7962.3190.6331.503
OND3.5985.9560.5280.064−0.2481.2570.2110.132
YigoAnnual−1.711−1.711−0.107−0.394Windward−0.088−0.0880.0170.157
Dry−0.711−1.651−0.170−0.1660.2350.5480.1280.236
Wet−0.720−1.722−0.534−0.3890.602−0.194−0.0600.136
JFM−0.670−1.295−0.109−0.4960.1200.1650.0970.208
AMJ−0.282−1.746−0.201−0.0070.008−0.0270.0370.062
JAS−0.310−0.776−0.371−0.2370.545−0.0640.1460.369
OND−0.750−1.981−0.515−0.847−0.0300.621−0.169−0.075
Disclaimer/Publisher’s Note: The statements, opinions and data contained in all publications are solely those of the individual author(s) and contributor(s) and not of MDPI and/or the editor(s). MDPI and/or the editor(s) disclaim responsibility for any injury to people or property resulting from any ideas, methods, instructions or products referred to in the content.

