Abstract
Temperate conifer forests stressed by climate change could be lost through tree regeneration decline in the interior of high-severity fires, resulting in type conversion to non-forest vegetation from seed-dispersal limitation, competition, drought stress, and reburns. However, is fire triggering this global change syndrome at a high rate? To find out, I analyzed a worst-case scenario. I calculated fire rotations (FRs, expected period to burn once across an area) across ~56 million ha of forests (~80% of total forest area) in 11 western USA states from 2000 to 2020 for total high-severity fire area, interior area (>90 m inward), and reburned area. Unexpectedly, there was no trend in area burned at high severity from 2000 to 2020 across the four forest types studied. The vulnerable interior area averaged only 21.9% of total high-severity fire area, as 78.1% of burned area was within 90 m of live seed sources where successful tree regeneration is likely. FRs averaged 453 years overall, 2089 years in interiors, and 19,514 years in reburns. Creation of vulnerable interior area in a particular location is thus, on average, a 2000+ year event, like a very rare natural disaster, and reburns that may favor type conversion to non-forest have almost no effect. This means that, from 2021 to 2050 at most, only 3.0–4.2% of total forest area may become a vulnerable interior area, based on a likely high aridity-based climate projection of future fire and a higher scenario, where rates in the exceptional 2020 fire year have become the norm. These findings show that increased management to reduce high-severity fires is not currently needed, as the risk to forests from this global change syndrome is likely quite low up to 2050. Faster and larger disturbances (e.g., severe droughts) are more likely to cause most tree mortality or forest loss that occurs by 2050.
1. Introduction
Is the rate of high-severity fires becoming so high that western USA forests are threatened by failing post-fire tree regeneration that could cause permanent forest loss? Rising temperatures and increasing fuel aridity, which is ~55% attributable to anthropogenic climate change [], along with more ignitions by humans [], are expanding high-severity fires that kill ≥70% of trees in western USA forests [,]. High-severity fires are documented to be part of the historical range of variability (HRV []) in montane and subalpine forests of western USA [,,], including lower elevation dry forests previously incorrectly considered to have been shaped only by low- to moderate-severity fires []. However, high-severity fires, particularly the most severe stand-replacing fires (90–100% mortality) are increasingly leaving hotter and drier post-fire environments in western USA forests from the lower montane up to near the tree line []. Montane and subalpine conifers, that often dominate mature forests in western USA, are vulnerable, as they rely on regeneration by seed and disperse readily over only 100–200 m from live seed sources []. Here, I analyzed the rates of potential forest loss from high-severity fires.
This combination of increased high-severity fire and limited post-fire tree regeneration, particularly in hotter and drier stand-replacing fire interiors [], suggests that western USA forests are being converted to non-forests by this global change syndrome. The basic process of conversion of forest to non-forest, by natural disturbances, that eventually recovers to forest again, was long accepted as a normal successional process (e.g., []), but is now considered potentially “type-conversion”, if forest recovery is arrested by increasing stand-replacing fires with hotter and drier interior areas [,]. This possibility expanded ca 2000, when increased high-severity fire linked to fuel aridity from anthropogenic climate change accelerated []. There was also both increasing drought stress and declining post-fire tree regeneration [] across very large areas of western USA forests.
It has been possible to estimate the potentially most affected areas, based on actual and expected tree regeneration and climate patterns, but with only a little integration of the high-severity fires that happen before these effects occur. More tree regeneration decline is expected at lower elevations and on drier sites, particularly in the Southwest and California [,]. Davis et al. [] went a step further to show where stand-replacing fires were most likely to occur if a fire occurred, and found that 16% of ponderosa pine (Pinus ponderosa) and 10% of Douglas-fir (Pseudotsuga menziesii) ranges are vulnerable, especially in Arizona and New Mexico. Studies from Canada to the Southwestern USA [], found that vulnerability suggests up to about 50% of forests could possibly be lost by ca 2100. But, how often are the essential triggers, the high-severity fires, actually occurring?
These global change processes and trends are now well established, but the effects of high-severity fire spatial patterns and, particularly, the rates at which high-severity fire is creating vulnerable post-fire settings, remain insufficiently known and are explicitly studied here. However, Wickham et al. [] used remote sensing and estimated that between 2001 and 2016 about 0.5% of ~69 million ha of western USA forests showed evidence of potential type conversion from multiple disturbances. The patterns and rates of the fires are significant because if the burn interior habitat, where tree regeneration is most reduced, is uncommon in either space or time, then this problem could be less serious. Fire spatial pattern is reasonably understood, as these fires can leave surviving individual trees or small groups of trees from which seed can be dispersed the 100–200 m that most western USA conifers can reach []. However, it was surprising that in the northern Rocky Mountains, >90% of >3 million ha burned from 1984 to 2010, includingin the exceptional 1988 fire year, was ≤150 m from live seed sources []. If this is a general finding, estimates of this problem could be high. However, perhaps not, because increasingly large fires, especially if ≥30% stand-replacing within their perimeters, can create post-fire habitat well beyond 150 m from unburned trees []. Moreover, a reburn by a subsequent fire, the main potential positive feedback [,], could remove tree regeneration that was established soon after the first high-severity fire, and also perpetuate fire-prone post-fire vegetation, further limiting successful tree regeneration.
Here, I studied the rates and patterns of the creation of a vulnerable interior area from high-severity fires across four forest types, about 80% of total forest area, in the western USA from 2000 to 2020, using a climate projection and scenario to estimate the vulnerable interior burned area to 2050. These provide the first estimates of rates at which this important global change syndrome could possibly lead to forest loss. These estimates support the unexpected conclusion that this is likely not a major source of forest loss. This is the first study to quantify recent and projected rates and patterns of tree regeneration decline and type conversion from high-severity fires across most western USA forests.
2. Materials and Methods
First, a synopsis of methods and the flow of work (Figure 1) are discussed. I directly measured the rates (fire rotations, FRs) and patterns of high-severity fires that are leading to reduced tree regeneration and potential type conversion. I used federal government maps of high-severity fires in four major types of forests (dry pine, dry mixed conifer, moist mixed conifer, subalpine) covering ~56 million ha of 11 western USA states. This is about 80% of ~69 million ha of western forests, based on Wickham et al. []. After measuring the annual area burned at high severity from 1984 to 2020 and testing for change points and trends, I used the 2000–2020 period, which lacked trends (see Section 3) and had more burned area than prior to 2000, for all analyses. Since there has been variability in the effects of climate change on tree regeneration in burned areas [,], I then used these data to estimate fire rotation (FR), the expected period to burn across an area equal to the area of each of these four types of forests. FR is the most accurate measure of fire rates, since fires vary in area and earlier methods (e.g., mean fire-return interval) are typically based on just counts of fires [,]. FR is estimated for the study period as 21 years divided by the fraction of total area of a forest type that burned (sum of all individual fire areas) over the 21 year period. Therefore, for example, if 20% burned in 21 years, then 21/0.20 would be equal to an FR of 105 years. For each of the four forest types, I estimated FRs for: (1) total high-severity fire area, (2) interior high-severity fire area, and (3) reburned interior high-severity fire area.
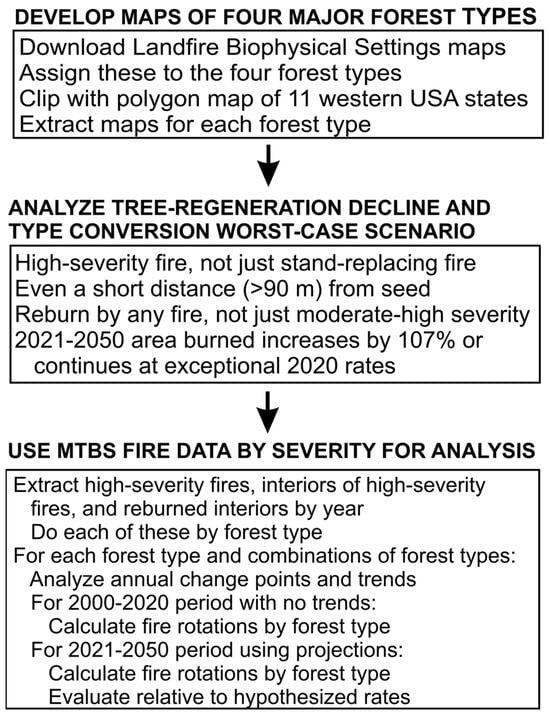
Figure 1.
Overview of the flow of work.
The focus is on two major dry forest types and two major moist forest types common in the western USA, where tree regeneration decline has been found []. Dry forests include ponderosa pine and similar dry pine forests (Pinus ponderosa, Pinus jeffreyi) and dry mixed conifer forests, which are dominated by these pines, but include several associated trees (e.g., Abies concolor, Abies grandis, Picea spp., Populus tremuloides, Pseudotsuga menziesii). Moist forests are moist mixed conifer forests, that include the same suite of trees as in dry mixed conifer, but have few pines, and subalpine forests that are typically dominated by Abies lasiocarpa, Picea engelmannii, and Pinus contorta.
The estimated historical distribution and extent of these forests was identified by Landfire Biophysical Settings (BPS) maps from 2020 (https://landfire.gov/version_download.php, accessed on 4 April 2023). I used detailed descriptions [] to place Landfire Ecological Systems into these four forest types (Table S1). I used historical BPS Landfire maps rather than existing vegetation type (EVT) maps, because the focus is on areas that historically were in each type of forest, not just current forests; tree regeneration decline could still influence whether historical forests could recover, even if they are not currently mature forests due to alterations by disturbances. Nonetheless, it is unlikely that results using EVT maps would differ dramatically. Also, I assume here that no significant vegetation change occurs up to 2050, as it is beyond the feasible scope of this analysis and its focus to project future vegetation changes. To map the four historical forest types (Figure 2), I downloaded the Landfire 2020 BPS raster for the continental USA, then clipped it in ArcGIS Pro 3.1, using a polygon feature for the boundary of the 11 western USA states. All GIS work used the NAD 1983 Contiguous USA Albers projection. I added a field for forest type, coded from 1 to 4, and extracted rasters for each forest type. I calculated their areas, in hectares, by multiplying the count of pixels in each attribute table by 0.09 ha (30 m × 30 m pixels), although there is some change in pixel area with latitude. Dry pine forests covered 12,405,879 ha, dry mixed conifer forests covered 13,068,389 ha, moist mixed conifer forests covered 16,357,705 ha, and subalpine forests covered 14,356,199 ha (Table S1) for a total of 56,188,172 ha.
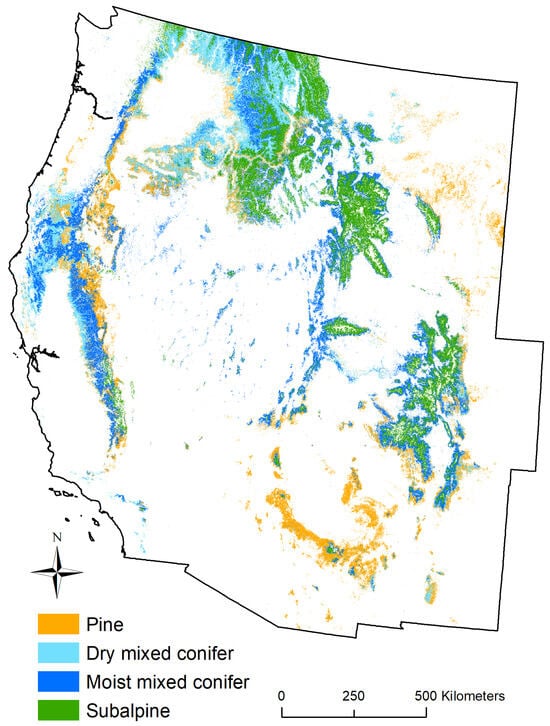
Figure 2.
The study area, the four forest types, and the boundary of the 11 western states.
I made a high worst-case estimate of rates of fires and spatial patterns of regeneration that could lead to tree regeneration decline. First, I used higher estimates of the area that is potentially adversely affected by tree regeneration decline and type conversion. To achieve this, I assumed that any high-severity fire, not just stand-replacing fires, which are much less common but leave much fewer surviving potential seed trees, could lead to tree regeneration decline. Here, I assumed that the ≥70% tree mortality of high-severity fire could produce vulnerable interior areas, whereas Davis et al. [] used ≥92% mortality, which would lead to a much smaller interior area. Second, I assumed that even a short distance (>90 m) from seed sources in unburned forests could lead to tree regeneration decline and type conversion. This is shorter than the 100–200 m that McCaughey et al. [] showed was within the reach of most western USA conifers. Among 24 studies of tree regeneration decline, ponderosa pine regeneration often declined to low levels until 100–200 m into fires []. I also assumed that a reburn by fire of any severity could retard tree regeneration, when it is more typical to assume that this primarily occurs after moderate- to high-severity fires []. Finally, I assumed that from 2021 to 2050, the annual area burned would likely increase by a median 107% over the 2000–2020 period rates, using the aridity-based static model results of Abatzoglou et al. [], which is based on the SSP2-45 middle-of-the-road emissions scenario. The Abatzoglou et al. model again is a high estimate. It likely now substantially overestimates the extent of future fire, since it uses a now pessimistic scenario in which emissions continue and do not even reach net zero by AD 2100. Moreover, the static model I used assumes no negative feedback of the accumulating burned area on fire spread. I assumed that high-severity fire would increase at the same rate as the annual area burned, which is likely a reasonable assumption based on previous studies that found no recent significant trend in fire patch size or interior area [,]. Finally, I also analyzed a high scenario in which high-severity fires from 2021 to 2050 burned at rates that occurred in the exceptional 2020 fire year, even though initial data suggest that the area burned in 2021 was substantially lower. Together, these assumptions will likely lead to a high estimate of the potential area affected by tree regeneration decline and type conversion.
I used fire-severity data from the US government’s Monitoring Trends in Burn Severity (MTBS) program (www.mtbs.gov, accessed on 4 February 2023). MTBS data provide the government’s assessment of fire severity, and are the basis for government programs, but have some limitations. These include the use of both interpreted and fixed severity-class limits [], rather than just fixed definitions of severity classes, imperfect relationships with field-plot estimates of severity, and some other limitations []. However, potential replacements that use fully objective severity-class definitions are not government data and perform only slightly better (e.g., 68–73% correct versus 66% correct) when compared with field plots [], which is likely due to inherent limits in indices and 30 m Landsat data [], and are more time consuming to use over large land areas and many fires. Moreover, field-plot estimates greatly overestimate canopy-tree mortality in dry forests [] which is a significant error; therefore, I used MTBS data which are not based primarily on only plot-based estimates. These MTBS data were also used, for example, by Abatzoglou et al. [], which includes Kolden, who critiqued MTBS data. The high-severity MTBS class is likely similar to the commonly used field-based high-severity classes, thus 70% or more mortality []. Again, high-severity fire is also substantially less severe and more abundant than “stand-replacing” fire, which leaves few to no surviving trees (e.g., 90–100% mortality), the severity that is thought to be most leading to tree regeneration decline and type conversion [].
I downloaded MTBS annual burn-severity mosaics for the continental United States for the 1984–2020 period, as full 2021 data were not yet available in April 2023 when the study began, then clipped each annual raster by a polygon map of the 11 western states. Using the ArcGIS Con command, I extracted high-severity fires (MTBS class 4) for each year as new annual rasters. I repeated this process for high-severity patch-interior areas. The interior area was estimated by shrinking each high-severity patch by 3 pixels (90 m) from the outside inward. I used the ArcGIS Pro 3.1 Shrink command to extract just the interior area of high-severity patches into new annual rasters. Then, I extracted both of these by forest type and measured their annual total area and interior area using pixel counts in attribute tables. To measure the rate of reburns, for each area that burned at high severity in a particular year, I extracted area that also burned again at any severity. I used Python code from running each of these programs once to sequentially execute this process for both high-severity total area, interior area, and reburn area for the 21 years and four forest types.
To examine the potential trend in area burned at high severity, I first created a spreadsheet with the sequence of annual area burned at high severity over the 1984–2020 period for each forest type and their summation. I graphed the area burned at high severity per year for each of the four forest types and their summation, which shows substantial year-to-year variability and possible trends over the 37 years of record. Then, I tested for a change point, where central tendencies (median) abruptly shift to a new level, using Wild Binary Segmentation [] in R 4.1.3, package Wbs, which is shown to be one of the most effective change point detection methods []. Based on the change point results, I tested a two-tailed null hypothesis of no significant trend in area burned per year for each forest type and their summation for the 37 years from 1984 to 2020, 16 years from 1984 to 1999, and 21 years from 2000 to 2020. A non-parametric test of trend was used, as exploratory histograms showed that variability in area burned was not normally distributed. Thus, I used the non-parametric Mann–Kendall trend test [], at α = 0.05, in package Kendall in R similar to past wildfire trend research []. As a prerequisite in testing trend, I tested a null hypothesis of no temporal autocorrelation, at α = 0.05, for each series in Minitab 21.4 (Minitab, Inc., Coventry, UK). All series lacked significant temporal autocorrelation at up to 10 lags, using the Ljung–Box Q test statistic.
I calculated FRs, by forest type and for combinations of the four types, for total high-severity fire area, interior high-severity fire area, and interior high-severity fire area that reburned at any severity in any succeeding year. To help understand changes in fire rates over the longer 1984–2020 period, I also compared FRs for total high-severity fire for the 2000–2020 period, 1984–1999, and for the single year, 2020, since it was an exceptional fire year. The periods used to calculate FR were 21 years, 16 years, and 1 year. In the case of reburns where the period varies from 1 to 20 years, the mean period of 7.333 years was used.
To estimate the extent of interior area expected to be beyond the distance where seed from unburned forests can likely lead to tree regeneration, I used a distance of 90 m, as explained above, or three 30 m pixels. I estimated how much of the total area burned at high severity was beyond 90 m by calculating the percentage of total area burned at high severity that was in this smaller interior area burned at high severity.
To estimate the percentage of the area of each forest type expected to be burned by high-severity fire by AD 2050, assuming that fire rates over the 2000–2020 period continued to be unchanged, increased by 107%, or by 200%, I divided 2000–2020 FRs by the number of years (30) to 2050, and multiplied by 100, 207, or 300 to express this as a percentage. I hypothesized that the interior area could reach about 18.5% of forest area in 30 years from 2021 to 2050, which, if continued, could lead to 50% of forest area affected by 2100, an upper limit of vulnerability from Coop et al. []. This is the only estimate across these forests.
3. Results
The four major forest types included more pine in the Southwest and more subalpine forests along the Rocky Mountains, but substantial mixed conifer forests throughout the 11 western states (Figure 2). The Wild Binary Segmentation test identified two significant and generally consistent change points in the area burned series for the 1984–2020 period, in 1999 among three of four forest types, and in 2019 in both mixed conifer forests (Table 1, Figure 3). Subalpine forests, in contrast, had change points only in 1987, 1988, and 2006 (Table 1). The area burned significantly increased across all forest types over the 1984–2020 period (Table 2), but the increase appears to have occurred by 1999–2000, as there were no significant trends from 1984 to 1999 and, unexpectedly, no trends from 2000 to 2020 (Table 2). Based on these findings, I chose the 2000–2020 period as the most recent period, with the highest rates of area burned but having no trend, within which to estimate FRs.

Table 1.
Results of the Wild Binary Segmentation (Wbs) change point detection for 1984–2020. Shown are change points ranked 1 or 2 by the program. Only 1999 and 2019, which are most consistent, are shown in Figure 3.
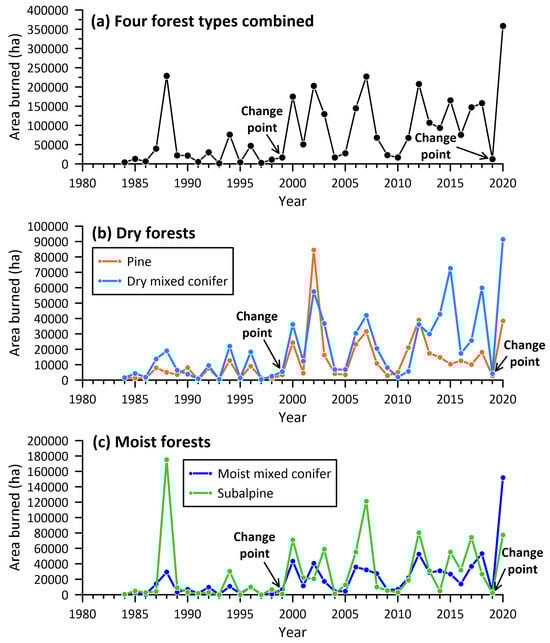
Figure 3.
Annual area burned at high severity for (a) the four forest types combined, (b) dry forests, and (c) moist forests. Two change points are shown.
Table 2.
Results of Mann–Kendall tests of trend in annual area burned at high severity. The two-sided null hypothesis (α = 0.05) was that there was no trend over the test period.
FRs for total high-severity fire area, in the 2000–2020 period (Table 3), averaged 453 years across all four forest types, a little shorter at 427 years in moist forests and a little longer at 489 years in dry forests. Rotations had multi-century length in all four forest types, shortest at 366 years in subalpine forests and 404 years in dry mixed conifer forests, longer at 502 years in moist mixed conifer forests, and longest at 626 years in pine forests. Since these are long FRs, it is not surprising that by AD 2050, only 4.8–8.2% of forest area would be expected to have burned at high severity, if the 2000–2020 rates continue as they were in 2000–2020 (Table 3). Using the fire projections of Abatzoglou et al. [] based on increasing aridity, that there will be a 107% increase in fire, and only about 9.9–17.0% would be burned at high severity by 2050 (Table 3).
Table 3.
Fire rotations in the 2000–2020 period for total high-severity fire area, interior high-severity fire area, and interior high-severity fire area that reburned in a subsequent fire year, across four major forest types in 11 western USA states. Also shown is the expected burned area, assuming that the fire in the 2000–2020 period does not increase or increases by 107% [].
FRs for interior high-severity fire areas were much longer, since the area burned was much smaller in the same time period. The interior high-severity fire area averaged only 21.7% of total high-severity fire area across the four types, and was smallest (13.5%) in pine forests and largest (25.7%) in subalpine forests (Table 3). In the pine case, as an example, this means that the FR for interior high-severity fire area was 100/13.5 or 7.407 times the 626 year FR for total high-severity fire area, which is 4636 years (Table 3). FRs for interior high-severity fire areas averaged 2089 years, and ranged from 1423 years in subalpine forests to 4636 years in pine forests. These very long FRs meant that, on average, only 1.4% of study area forests by 2050, if rates do not change, 3.0% using the Abatzoglou et al. aridity-based projections, and 4.2% using fire rates in 2020, would actually have the interior setting that is vulnerable to tree regeneration failure and type conversion. FRs for reburns of any part of the interior high-severity fire area, were even longer, even though the reburn could have been at any severity (low, moderate, or high), with reburn rotations averaging 19,514 years and ranging from 14,351 years in dry mixed conifer to 30,010 years in subalpine forests (Table 3).
4. Discussion
High-severity fires that leave behind the burned interior area, where significant tree regeneration decline and potential type conversion are documented [,], unexpectedly had no trend and were burning at rates from 2000 to 2020 that are far too low to cause much western USA forest loss. The lack of trend in the area burned by high-severity fires over 21 years in four major forest types over about 80% of total forest area in western USA is also a significant and unexpected finding. Fire has been widely expected to increase rapidly as the climate changes (e.g., []), but it was not even significantly increased by the exceptional 2020 fire year. Also, most studies (e.g., []) did not analyze change points, so could not find that the year 1999 was a key change point (Figure 3). The analysis here shows that the rates of high-severity fire in western forests increased to about the year 2000, then had no trend from 2000 to 2020, when analyzed using the non-parametric Mann–Kendall test and the Wild Binary Segmentation change point analysis (Figure 3). Non-parametric tests, not linear tests, are appropriate as most annual fire data are not normally distributed. Large year-to-year variability also is evident (Figure 3). Of course, recent rates of high-severity fires are a consequence of multiple influences including climate change, indirect fire exclusion, intentional management during fires, alteration of fuels, and ignitions by both people and lightning (e.g., [,]). No study has predicted how these might together affect future fire; therefore, this analysis assumes that these effects remain influences, although projections of climate change on fires are explicitly incorporated here.
High-severity fires burned from 2000 to 2020 with a 453 year FR, varying from 366 to 626 years among forest types (Table 3), which is ample time to allow forests to recover and grow to old growth stages, as further discussed later. High-severity fire itself does not necessarily cause forest loss, as there is widespread evidence that all four of these forest types, with 70% or more tree mortality, can generally recover to mature forests, typically within 1–2 centuries (e.g., [,]). High-severity fire rotations in the two dry forest types are not too short and outside their HRV, based on multiple lines of historical evidence, including tree-ring studies, paleo-charcoal reconstructions, and early aerial photographs, forest atlases, and land surveys []. This was also found earlier []. The available evidence also shows that fire patches are not recently too large or outside their HRV, or likely to cause type conversions that are outside their HRV [].
Vulnerability to the global change syndrome of tree regeneration decline and type conversion is primarily in stand-replacing parts of high-severity fires, where tree mortality is, for example, 90–100%. This vulnerable area is effectively the “interior” of the fire, which is assumed here to be 90 m or more from unburned forest that can provide post-fire seed. Under the less strict severity definition used here, the vulnerable interior area was still created from 2000 to 2020 at very long rotations of 1423–4636 years (mean = 2089 years) across the four major forest types (Table 3). This is a high estimate. First, it assumes that high-severity fires create this interior habitat, when only stand-replacing parts of high-severity fires are likely to cause this []. Also, among 1485 sites across the four forest types in the Rocky Mountains [], the minimum distance to seed source was the primary spatial variable that predicted declining post-fire recruitment. Here, I used 90 m as the threshold for tree regeneration decline, when another study used 150 m [], which again would lead to a smaller interior area and longer fire rotation. In any case, over the 21 year study period, at most only ~1% of forest area, on average, became a vulnerable high-severity interior area. By 2050, assuming a 107% increase in fires from climate change, only a mean of at most 3.0% of the four forest types and range of 1.3–4.4% would be adversely affected by potential tree regeneration decline and type conversion in interior areas (Table 3). Even if rates were to triple from 2000–2020 rates, so reaching the level of the extreme fire year of 2020, well beyond the 107% increase of the Abatzoglou et al. [] projection, a mean of only 4.2% and range of only 1.8–6.3% of forest area would be burned interior area by 2050 (Table 3).
If interior high-severity fire area reburns before regenerating trees reach an age where they can survive fire, tree regeneration would likely be delayed further []. However, rates of reburning from 2000 to 2020 were so low, with rotations from 14,351 to 30,010 years indicating that reburning will likely remain an insignificant effect (Table 3).
Together, these measured, projected, and scenario (2020) rates are very low relative to the estimate of up to 50% potential loss from tree regeneration decline and type-conversion by 2100 [], which would be 18.5% by 2050; therefore, this hypothesis of Coop et al. is rejected. Coop et al.’s [] and others [,,] were valid estimates, but only for vulnerability, not actual rates of the creation of vulnerable interior area from high-severity fires, as measured and projected here. The low measured and projected rates here, using a worst-case scenario, are compelling evidence that tree regeneration decline in burned interior areas is likely to be a rare mechanism for forest loss by mid-century in the four types of western USA forests, which represent about 80% of total western USA forests.
Is there validation of these FR estimates for the vulnerable interior area made here? Yes, Wickham et al. [] found, using remote sensing with Landsat data, that only ~72% of 0.5%, thus about 0.4% of ~69 million ha of western USA forests were “potential forest conversion” by natural disturbances, between 2001 and 2016, overlapping my analysis period. Their disturbance rotation would be 15 years/0.004 = 3750 years. This is support for both findings, since my estimates of high-severity interior disturbance rotations were 1423–4636 years (Table 3), a range that includes the Wickham et al. estimate, which from space is likely better able to identify the physically evident vulnerable interior area. The Wickham et al. estimate provides support for the use of the 90 m estimate of vulnerable interior area here. Of course, both sets of estimates are for large land areas, and it is possible that some smaller parts of these land areas have high-severity fires that are burning at high rates; if this is the case, then this is likely unusual.
Recent assessments, that did not measure the actual rates that vulnerable interiors of high-severity fires are being created, incorrectly concluded that the situation is severe, and substantial management, particularly fuel reduction and fire suppression, is needed [,]. One of these studies suggested that “...management activities that effectively reduce fire severity (e.g., treatments including forest thinning and reduction of surface fuels...)” (p. 5, []) are needed, along with post-fire planting or seeding. Findings here, based on actual measurements of the rates of creation of vulnerable interior high-severity fire areas, do not support these recommendations. Tree regeneration decline in the interiors of high-severity fires is occurring, but over far too small an area to warrant fuel reduction, intentional suppression of high-severity fires, or post-fire planting and seeding, which all have significant adverse ecological impacts [] that are likely to add to the already significant direct adverse impacts of climate change on forests (e.g., reduced tree growth).
Infrequent high-severity fires, like major floods, tropical cyclones, and other large, infrequent disturbances (LIDs []) in other forests, were a natural part of the HRV of western forests [,,], including both kinds of dry forests []. Fire rotations of high-severity fires during the 2000–2020 period across the four forest types were 366–626 years, averaging 453 years. These long rates allow for lengthy tree regeneration and forest recovery that would likely still enable old growth forest stages to be reached. LIDs create complex, early-seral habitat that supports many species uncommon elsewhere [], and also rare low-density forests and non-forested openings that provide landscape heterogeneity that slows natural disturbances []. These are still rare natural landscape features that provide ecosystem services and are part of the HRV in these landscapes.
It is difficult to fully estimate future rates of tree regeneration decline in vulnerable openings, because understanding the key details of climate change and fire in the future is still in flux. There is uncertainty about precipitation, a key to tree regeneration []. Future fire is very likely to increase [], but why did the 2000–2020 period lack a trend in high-severity fires (Table 2)? One possibility is enduring ocean-atmosphere teleconnections, which also influence fire rates. Also, this period contained much of what has been called a global warming “hiatus” or “slowdown”, with a complex, unresolved suite of possible causes []. In any case, I estimated that high-severity fire increased substantially (3.6 times) between 1984–1999 and 2000–2020, a little less than the 5.0 discovered by Abatzoglou and Williams [] for a somewhat shorter period. The large fire year, 2020, was after the climate slowdown, and was included in my analysis; could it indicate the start of another dramatic rise in rates? If the 2020 level of fire continued, it could increase fire rates again by about three times. However, even this large increase would still not make tree regeneration decline and type conversion in fire-interior areas very significant, only averaging about 4.2% instead of 1.4% by 2050 (Table 3), and this is likely a high estimate. The recent IPCC Sixth Assessment Report [] indicates it is likely that warming will reach >1.5 °C but ≤3.2 °C; so recent estimates of future tree-regeneration decline under RCP 4.5 or 8.5 may now, from this too, also be too high, as is also the Abatzoglou et al. [] fire projection I used. Projections likely will continue to be in revision, but as new projections arise, it is possible to re-estimate the potential interior affected area relative to the baseline 2000–2020 estimates here using simple multiplication (Table 3).
This study shows that disturbances more frequent and much larger than 2000–2020 high-severity fires, given long high-severity fire rotations and quite limited interior area with tree-regeneration vulnerability, would be needed to cause large losses of forests by the middle to end of this century from the tree-regeneration decline syndrome. High-severity fires would have to increase much more substantially than the already high projection of Abatzoglous et al. and the 2020 scenario used here. The known remaining candidates that could cause major tree mortality or even forest loss include droughts and bark-beetle outbreaks. However, these have in the past often been mostly moderate in severity, leaving many surviving trees that can nearly recover the forest without much tree regeneration by seed []. The largest known North American bark-beetle outbreaks in the montane have been only 200–300,000 ha [], not large enough to cause extensive forest loss, unless they greatly increase in area and severity. However, the subalpine bark-beetle outbreaks have covered tens of millions of hectares in a short period []. The example of the 2011–2017 California drought suggests rapid, large-scale, but modest mortality []. Drought is fast, as it does not require physical spread through the forest itself, as do fires and beetles. But, without tree regeneration decline as an added force, why would droughts and bark-beetle outbreaks alone lead to forest loss, given typically many survivors? These two disturbances, that can relatively rapidly kill many trees at moderate severity over very large areas, are much more likely sources of extensive tree mortality, if not forest loss, especially if tree regeneration decline also occurs. Data on the possibility of tree regeneration decline after these disturbances could provide key insight.
5. Conclusions
The worst-case high estimate here shows that rates of tree regeneration decline and type conversion from high-severity fires, in four major forest types covering ~80% of forests in the western USA, are so low that this global change syndrome is likely to cause little forest loss by 2050. Vulnerable interior areas of high-severity fires, where tree regeneration decline and type conversion are most likely, have been small and infrequent (fire rotations averaging 2089 years) during the 2000–2020 period which lacked a trend in area burned. This period may be a temporary climatic hiatus, but projected effects of renewed climate change would likely cause at most an average of only 3.0–4.2% type conversion to non-forest by 2050 with almost no added effect from reburns. This is a much lower rate than the previously hypothesized up to 50% vulnerability by 2100, which is rejected. No additional management, such as fuel reduction and forest thinning, is ecologically needed. The contribution of high-severity fires to restoring landscape heterogeneity and biodiversity, both valuable ecosystem services as climate changes, can continue to be appreciated. Faster and larger disturbances (e.g., droughts, bark-beetle outbreaks) are more likely to be able to cause extensive tree mortality in forests by 2050.
Supplementary Materials
The following supporting information can be downloaded at https://www.mdpi.com/article/10.3390/cli11110214/s1, Table S1. Landfire Biophysical Settings (BPS) for each western USA conifer forest type used in this analysis.
Funding
This research received no external funding.
Data Availability Statement
All primary data are available from public sources given in the article.
Acknowledgments
I appreciate the insightful comments from reviewers.
Conflicts of Interest
The author declares no conflict of interest.
References
- Abatzoglou, J.T.; Battisti, D.S.; Williams, A.P.; Hansen, W.D.; Harvey, B.J.; Kolden, C.A. Projected increases in western US forest fire despite growing fuel constraints. Commun. Earth Environ. 2021, 2, 227. [Google Scholar] [CrossRef]
- Balch, J.K.; Bradley, B.A.; Abatzoglou, J.T.; Nagy, R.C.; Fusco, E.J.; Mahood, A.L. Human-started wildfires expand the fire niche across the United States. Proc. Nat. Acad. Sci. USA 2017, 114, 2946–2951. [Google Scholar] [CrossRef] [PubMed]
- Agee, J.K. Fire Ecology of Pacific Northwest Forests; Island Press: Washington, DC, USA, 1996. [Google Scholar]
- Parks, S.A.; Abatzoglou, J.T. Warmer and drier fire seasons contribute to increases in area burned at high severity in western US forests from 1985 to 2017. Geophys. Res. Lett. 2020, 47, e2020GLO89858. [Google Scholar] [CrossRef]
- Landres, P.B.; Morgan, P.; Swanson, F.J. Overview of the use of natural variability concepts in managing ecological systems. Ecol. Appl. 1999, 9, 1179–1188. [Google Scholar]
- Baker, W.L. Fire Ecology in Rocky Mountain Landscapes; Island Press: Washington, DC, USA, 2009. [Google Scholar]
- Van Wagtendonk, J.W.; Sugihara, N.G.; Stephens, S.L.; Thode, A.E.; Shaffer, K.E.; Fites-Kaufman, J.A. (Eds.) Fire in California Ecosystems; University of California Press: Oakland, CA, USA, 2018. [Google Scholar]
- Baker, W.L.; Hanson, C.T.; Williams, M.A.; DellaSala, D.A. Countering omitted evidence of variable historical forests and fire regime in western USA dry forests: The low-severity-fire model rejected. Fire 2023, 6, 146. [Google Scholar] [CrossRef]
- Stevens-Rumann, C.S.; Kemp, K.B.; Higuera, P.E.; Harvey, B.J.; Rother, M.T.; Donato, D.C.; Morgan, P.; Veblen, T.T. Evidence for declining forest resilience to wildfires under climate change. Ecol. Lett. 2018, 21, 243–252. [Google Scholar] [CrossRef] [PubMed]
- McCaughey, W.W.; Schmidt, W.C.; Shearer, R.C. Seed-dispersal characteristics of conifers in the inland mountain West. In Proceedings of the Conifer Tree Seed in the Inland Mountain West Symposium, Missoula, MT, USA, 5–6 August 1985; USDA General Technical Report, INT-203. Shearer, R.C., Ed.; Intermountain Research Station: Ogden, UT, USA, 1986; pp. 50–62. [Google Scholar]
- Davis, K.T.; Higuera, P.E.; Dobrowski, S.Z.; Parks, S.A.; Abatzoglou, J.T.; Rother, M.T.; Veblen, T.T. Fire-catalyzed vegetation shifts in ponderosa pine and Douglas-fir forests of the western United States. Environ. Res. Lett. 2020, 15, 1040b8. [Google Scholar] [CrossRef]
- Glenn-Lewin, D.C.; Peet, R.K.; Veblen, T.T. (Eds.) Plant Succession, Theory and Prediction; Chapman & Hall: London, UK, 1992. [Google Scholar]
- Coop, J.D.; Parks, S.A.; Stevens-Rumann, C.S.; Crausbay, S.D.; Higuera, P.E.; Hurteau, M.D.; Tepley, A.; Whitman, E.; Assal, T.; Collins, B.M.; et al. Wildfire-driven forest conversion in western North American landscapes. BioScience 2020, 70, 659–673. [Google Scholar] [CrossRef]
- Abatzoglou, J.T.; Williams, A.P. Impact of anthropogenic climate change on wildfire across western US forests. Proc. Nat. Acad. Sci. USA 2016, 113, 11770–11775. [Google Scholar] [CrossRef]
- Davis, K.T.; Robles, M.D.; Kemp, K.B.; Higuera, P.E.; Chapman, T.; Metlen, K.L.; Peeler, J.L.; Rodman, K.C.; Woolley, T.; Addington, R.N.; et al. Reduced fire severity offers near-term buffer to climate-driven declines in conifer resilience across the western United States. Proc. Nat. Acad. Sci. USA 2023, 120, e2208120120. [Google Scholar] [CrossRef]
- Wickham, J.; Neale, A.; Riitters, K.; Nash, M.; Dewitz, J.; Jin, S.; van Fossen, M.; Rosenbaum, D. Where forest may not return in the western United States. Ecol. Indic. 2023, 146, 109756. [Google Scholar] [CrossRef]
- Harvey, B.J.; Donato, D.C.; Turner, M.G. Drivers and trends in landscape patterns of stand-replacing fire in forests of the US Northern Rocky Mountains (1984–2010). Landsc. Ecol. 2016, 31, 2367–2383. [Google Scholar] [CrossRef]
- Tepley, A.J.; Thomann, E.; Veblen, T.T.; Perry, G.L.W.; Holz, A.; Paritsis, J.; Kitzberger, T.; Anderson-Teixeira, K.J. Influences of fire-vegetation feedbacks and post-fire recovery rates on forest landscape vulnerability to altered fire regimes. J. Ecol. 2017, 106, 1925–1940. [Google Scholar] [CrossRef]
- Baker, W.L. Transitioning western U.S. dry forests to limited committed warming with bet-hedging and natural disturbances. Ecosphere 2018, 9, e02288. [Google Scholar] [CrossRef]
- Baker, W.L. Restoring and managing low-severity fire in dry-forest landscapes of the western USA. PLoS ONE 2017, 12, e0172288. [Google Scholar] [CrossRef] [PubMed]
- NatureServe. International Ecological Classification Standard: Terrestrial Ecological Classifications; NatureServe Central Databases: Arlington, VA, USA, 2018. [Google Scholar]
- DellaSala, D.A.; Hanson, C.T. Are wildland fires increasing large patches of complex early seral forest habitat? Diversity 2019, 11, 157. [Google Scholar] [CrossRef]
- Picotte, J.J.; Bhattarai, K.; Howard, D.; Lecker, J.; Epting, J.; Quayle, B.; Benson, N.; Nelson, K. Changes to the Monitoring Trends in Burn Severity program mapping production procedures and products. Fire Ecol. 2020, 16, 16. [Google Scholar] [CrossRef]
- Kolden, C.A.; Smith, A.M.S.; Abatzoglou, J.T. Limitations and utilization of Monitoring Trends in Burn Severity products for assessing wildfire severity in the USA. Int. J. Wildland Fire 2015, 24, 1023–1028. [Google Scholar] [CrossRef]
- Parks, S.A.; Holsinger, L.M.; Voss, M.A.; Loehman, R.A.; Robinson, N.P. Mean composite fire severity metrics computed with Google Earth Engine offer improved accuracy and expanded mapping potential. Remote Sens. 2018, 10, 879. [Google Scholar] [CrossRef]
- Harvey, B.J.; Andrus, R.A.; Anderson, S.C. Incorporating biophysical gradients and uncertainty into burn severity maps in a temperate fire-prone forested region. Ecosphere 2019, 10, e02600. [Google Scholar] [CrossRef]
- Saberi, S.J.; Agne, M.C.; Harvey, B.J. Do you CBI what I see? The relationship between the Composite Burn Index and quantitative field measures of burn severity varies across gradients of forest structure. Int. J. Wildland Fire 2022, 31, 112–123. [Google Scholar] [CrossRef]
- Fryzlewicz, P. Wild binary segmentation for multiple change-point detection. Ann. Statist. 2014, 42, 2243–2281. [Google Scholar] [CrossRef]
- Sharma, S.; Swayne, D.A.; Obimbo, C. Trend analysis and change point techniques: A survey. Energy Ecol. Environ. 2016, 1, 123–130. [Google Scholar] [CrossRef]
- Kendall, M.G. Rank Correlation Methods, 2nd ed.; Hafner: New York, NY, USA, 1970. [Google Scholar]
- Baker, W.L. Are high-severity fires burning at much higher rates recently than historically in dry-forest landscapes of the western USA? PLoS ONE 2015, 10, e0136147. [Google Scholar]
- DellaSala, D.A.; Baker, B.C.; Hanson, C.T.; Ruediger, L.; Baker, W. Have western USA fire suppression and megafire active management approaches become a contemporary Sisyphus? Biol. Conserv. 2022, 268, 109499. [Google Scholar] [CrossRef]
- Turner, M.G.; Baker, W.L.; Peterson, C.J.; Peet, R.K. Factors influencing succession: Lessons from large, infrequent natural disturbances. Ecosystems 1998, 1, 511–523. [Google Scholar] [CrossRef]
- DellaSala, D.A.; Bond, M.L.; Hanson, C.T.; Hutto, R.L.; Odion, D.C. Complex early seral forests of the Sierra Nevada: What are they and how can they be managed for ecological integrity? Nat. Areas J. 2014, 34, 310–324. [Google Scholar] [CrossRef]
- Wei, M.; Song, Z.; Shu, Q.; Yang, X.; Song, Y.; Qiao, F. Revisiting the existence of the global warming slowdown during the early twenty-first century. J. Clim. 2022, 35, 1853–1871. [Google Scholar] [CrossRef]
- Intergovernmental Panel on Climate Change (IPCC). Sixth Assessment Report (AR6), Synthesis Report, Summary for Policymakers; IPCC: Geneva, Switzerland, 2023. [Google Scholar]
- Fettig, C.J.; Asaro, C.; Nowak, J.T.; Dodds, K.J.; Gahdhi, K.J.K.; Moan, J.E.; Robert, J. Trends in bark beetle impacts in North America during a period (2000–2020) of rapid environmental change. J. For. 2022, 120, 693–713. [Google Scholar] [CrossRef]
- Fettig, C.J.; Mortenson, L.A.; Bulaon, B.M.; Foulk, P.B. Tree mortality following drought in the central and southern Sierra Nevada. For. Ecol. Manag. 2019, 432, 164–178. [Google Scholar] [CrossRef]
Disclaimer/Publisher’s Note: The statements, opinions and data contained in all publications are solely those of the individual author(s) and contributor(s) and not of MDPI and/or the editor(s). MDPI and/or the editor(s) disclaim responsibility for any injury to people or property resulting from any ideas, methods, instructions or products referred to in the content. |
© 2023 by the author. Licensee MDPI, Basel, Switzerland. This article is an open access article distributed under the terms and conditions of the Creative Commons Attribution (CC BY) license (https://creativecommons.org/licenses/by/4.0/).