Article

Assessing the Hydrological Impacts of Climate Change on the Upper Benue River Basin in Nigeria: Trends, Relationships, and Mitigation Strategies

by
Andrew Ezra
1,†,
Kai Zhu
2,†,
Lóránt Dénes Dávid
3,4,*,
Barnabas Nuhu Yakubu
5,* and
Krisztian Ritter
4
1
Adamawa State Post Primary School Management Board, Yola 64101, Nigeria
2
Faculty of Resources and Environmental Science, Hubei University, Wuhan 430062, China
3
Faculty of Economics and Business, John von Neumann University, 6000 Kecskemet, Hungary
4
Institute of Rural Development and Sustainable Economy, Hungarian University of Agriculture and Life Sciences, 2100 Godollo, Hungary
5
Doctoral School of Economics and Regional Sciences, Hungarian University of Agriculture and Life Sciences, 2100 Godollo, Hungary
*
Authors to whom correspondence should be addressed.
These authors contributed equally to this work.
Climate 2023, 11(10), 198; https://doi.org/10.3390/cli11100198
Submission received: 23 August 2023 / Revised: 20 September 2023 / Accepted: 23 September 2023 / Published: 26 September 2023

Abstract

:
The impact of climate change on river systems is a multifaceted threat to the environment, affecting various aspects of ecosystems. The Upper Benue River Basin (UBRB) in Nigeria is an area of concern, as river flow and water levels are crucial for irrigation and transportation. In this study, we investigate the impact of climate change on the hydrology of the UBRB using data on rainfall, temperature, relative humidity, wind speed, river discharge, and water level. Trend, correlation, and stepwise regression analyses were conducted using Excel and SPSS 20 to analyze the data. The results indicate that the UBRB is experiencing climate change, as evidenced by annual decreases in rainfall and relative humidity and increases in maximum and minimum temperatures. Specifically, mean annual rainfall and relative humidity exhibit a negative trend, while the maximum and minimum temperature exhibit a positive trend. Furthermore, we found that rainfall and relative humidity have a significant positive relationship with river discharge and level (p < 0.01), whereas maximum temperature and wind speed have a significant negative relationship with water discharge and level. We also identified wind speed and rainfall as the critical climatic indices influencing river discharge, accounting for 21.7% of the variation in river discharge within the basin (R2 = 21.7). Based on these findings, we conclude that increases in rainfall and relative humidity will lead to significant increases in river discharge and level, while increases in wind speed and maximum temperature will decrease river discharge and level. Moreover, wind speed and rainfall are the critical climatic indices influencing river discharge, whereas relative humidity, wind speed, and rainfall are the critical climatic indices influencing water level. Thus, we recommend constructing more reservoirs (dams) to mitigate the negative trend in rainfall and encourage climate change control, such as afforestation among the population of the region. These findings have important implications for understanding the impact of climate change on river systems and developing effective strategies to mitigate its effects.

1. Introduction

Climate change has emerged as a significant global issue, drawing the attention of scholars worldwide due to its impact on the environment at both regional and global scales, as well as its relevance in fields such as agricultural planning and government policy [1,2,3]. Hydrology, an essential environmental aspect, is closely linked to climate change, and significant changes have occurred in the hydrological conditions and surface hydrology of landscapes. Stream flow regimes are mainly controlled by seasonal temperature and precipitation patterns and watershed characteristics, which are closely related to mean climate and stream flow characteristics.
Numerous studies have explored the relationship between climate change and hydrology in various river basins across Africa and other parts of the world. For instance, Mekonnen and Songcai [4] evaluated the impacts of climate change on river flows in the upper Awash sub-basin in Ethiopia and found that changes in rainfall and temperature significantly affect stream flow and surface runoff, ultimately reducing water availability in the sub-basin. Similarly, Paul et al. [5] noted that future decreases in precipitation and increases in temperature may strengthen the monsoon seasonal cycle and prolong the dry month for evapotranspiration. Roudier, Ducharne & Feyen [6] reviewed the effects of climate change on runoff in West Africa and concluded that runoff changes are closely linked to changes in rainfall and potential evapotranspiration, while Ümit et al. [7] discovered that water discharge significantly decreased in a Mediterranean mesoscale catchment due to increased evapotranspiration and reduced snow depth. Abeyou et al. [8] assessed the impact of climate change on water availability and variability in two sub-basins in the upper Blue Nile basin and found that local hydrology is significantly affected by climate change, resulting in stream flow increases of up to 64% in dry seasons and decreases of up to 19% in wet seasons. Melkamu & Zerihun [9] highlighted that changes in global temperature have resulted in alterations in rainfall amount and distribution. At the watershed level, these changes affect atmospheric evaporation, precipitation, vegetation composition and interception, stream flow characteristics, and groundwater storage and recharge. These studies provide compelling evidence that climate change poses a severe threat to water bodies.
Global warming is a significant contributing factor to changes in stream flow patterns [10]. Li et al. [11] observed that an increase in temperature leads to an increase in evaporation losses, resulting in decreased stream flow. Furthermore, an increase in atmospheric CO2 concentration and temperature affects the water balance through changes in transpiration, vegetation structure, and distribution.
It is evident from the above studies that climate change has a considerable impact on hydrology, and its effects are likely to continue if urgent mitigation and adaptation measures are not implemented. Therefore, it is crucial to continue to conduct research in this area to develop a better understanding of the complex relationship between climate change and hydrology and to inform the development of effective strategies to mitigate its adverse effects.
In Nigeria, various studies from different parts of the northern region have confirmed the presence of climate change at both micro and large scales [12,13,14]. Moreover, studies have indicated a decrease in Nigeria’s dense vegetation area from 358,534.2 km2 in 1981 to 207,812 km2 in 2010, concurrent with an increase in non-vegetal areas from 312,640.8 km2 to 474,436.4 km2 over the same period. Predictions further suggest a surge to 501,504.9 km2 by 2030, magnified by the country’s booming population and prevailing drought and desertification conditions [15,16].
However, little or no attention has been paid to the effects of climate change on water level and discharge, particularly in the Upper Benue River Basin. This highlights the need to investigate the impact of climate change on the hydrology of the Upper Benue River Basin. In this paper, we aim to achieve the following objectives:
  • Examine the trends in climatic and hydrological indices of the Upper Benue River Basin (UBRB);
  • Investigate the relationship between climatic and hydrological indices;
  • Identify the critical climatic indices that affect water discharge and level in the area.
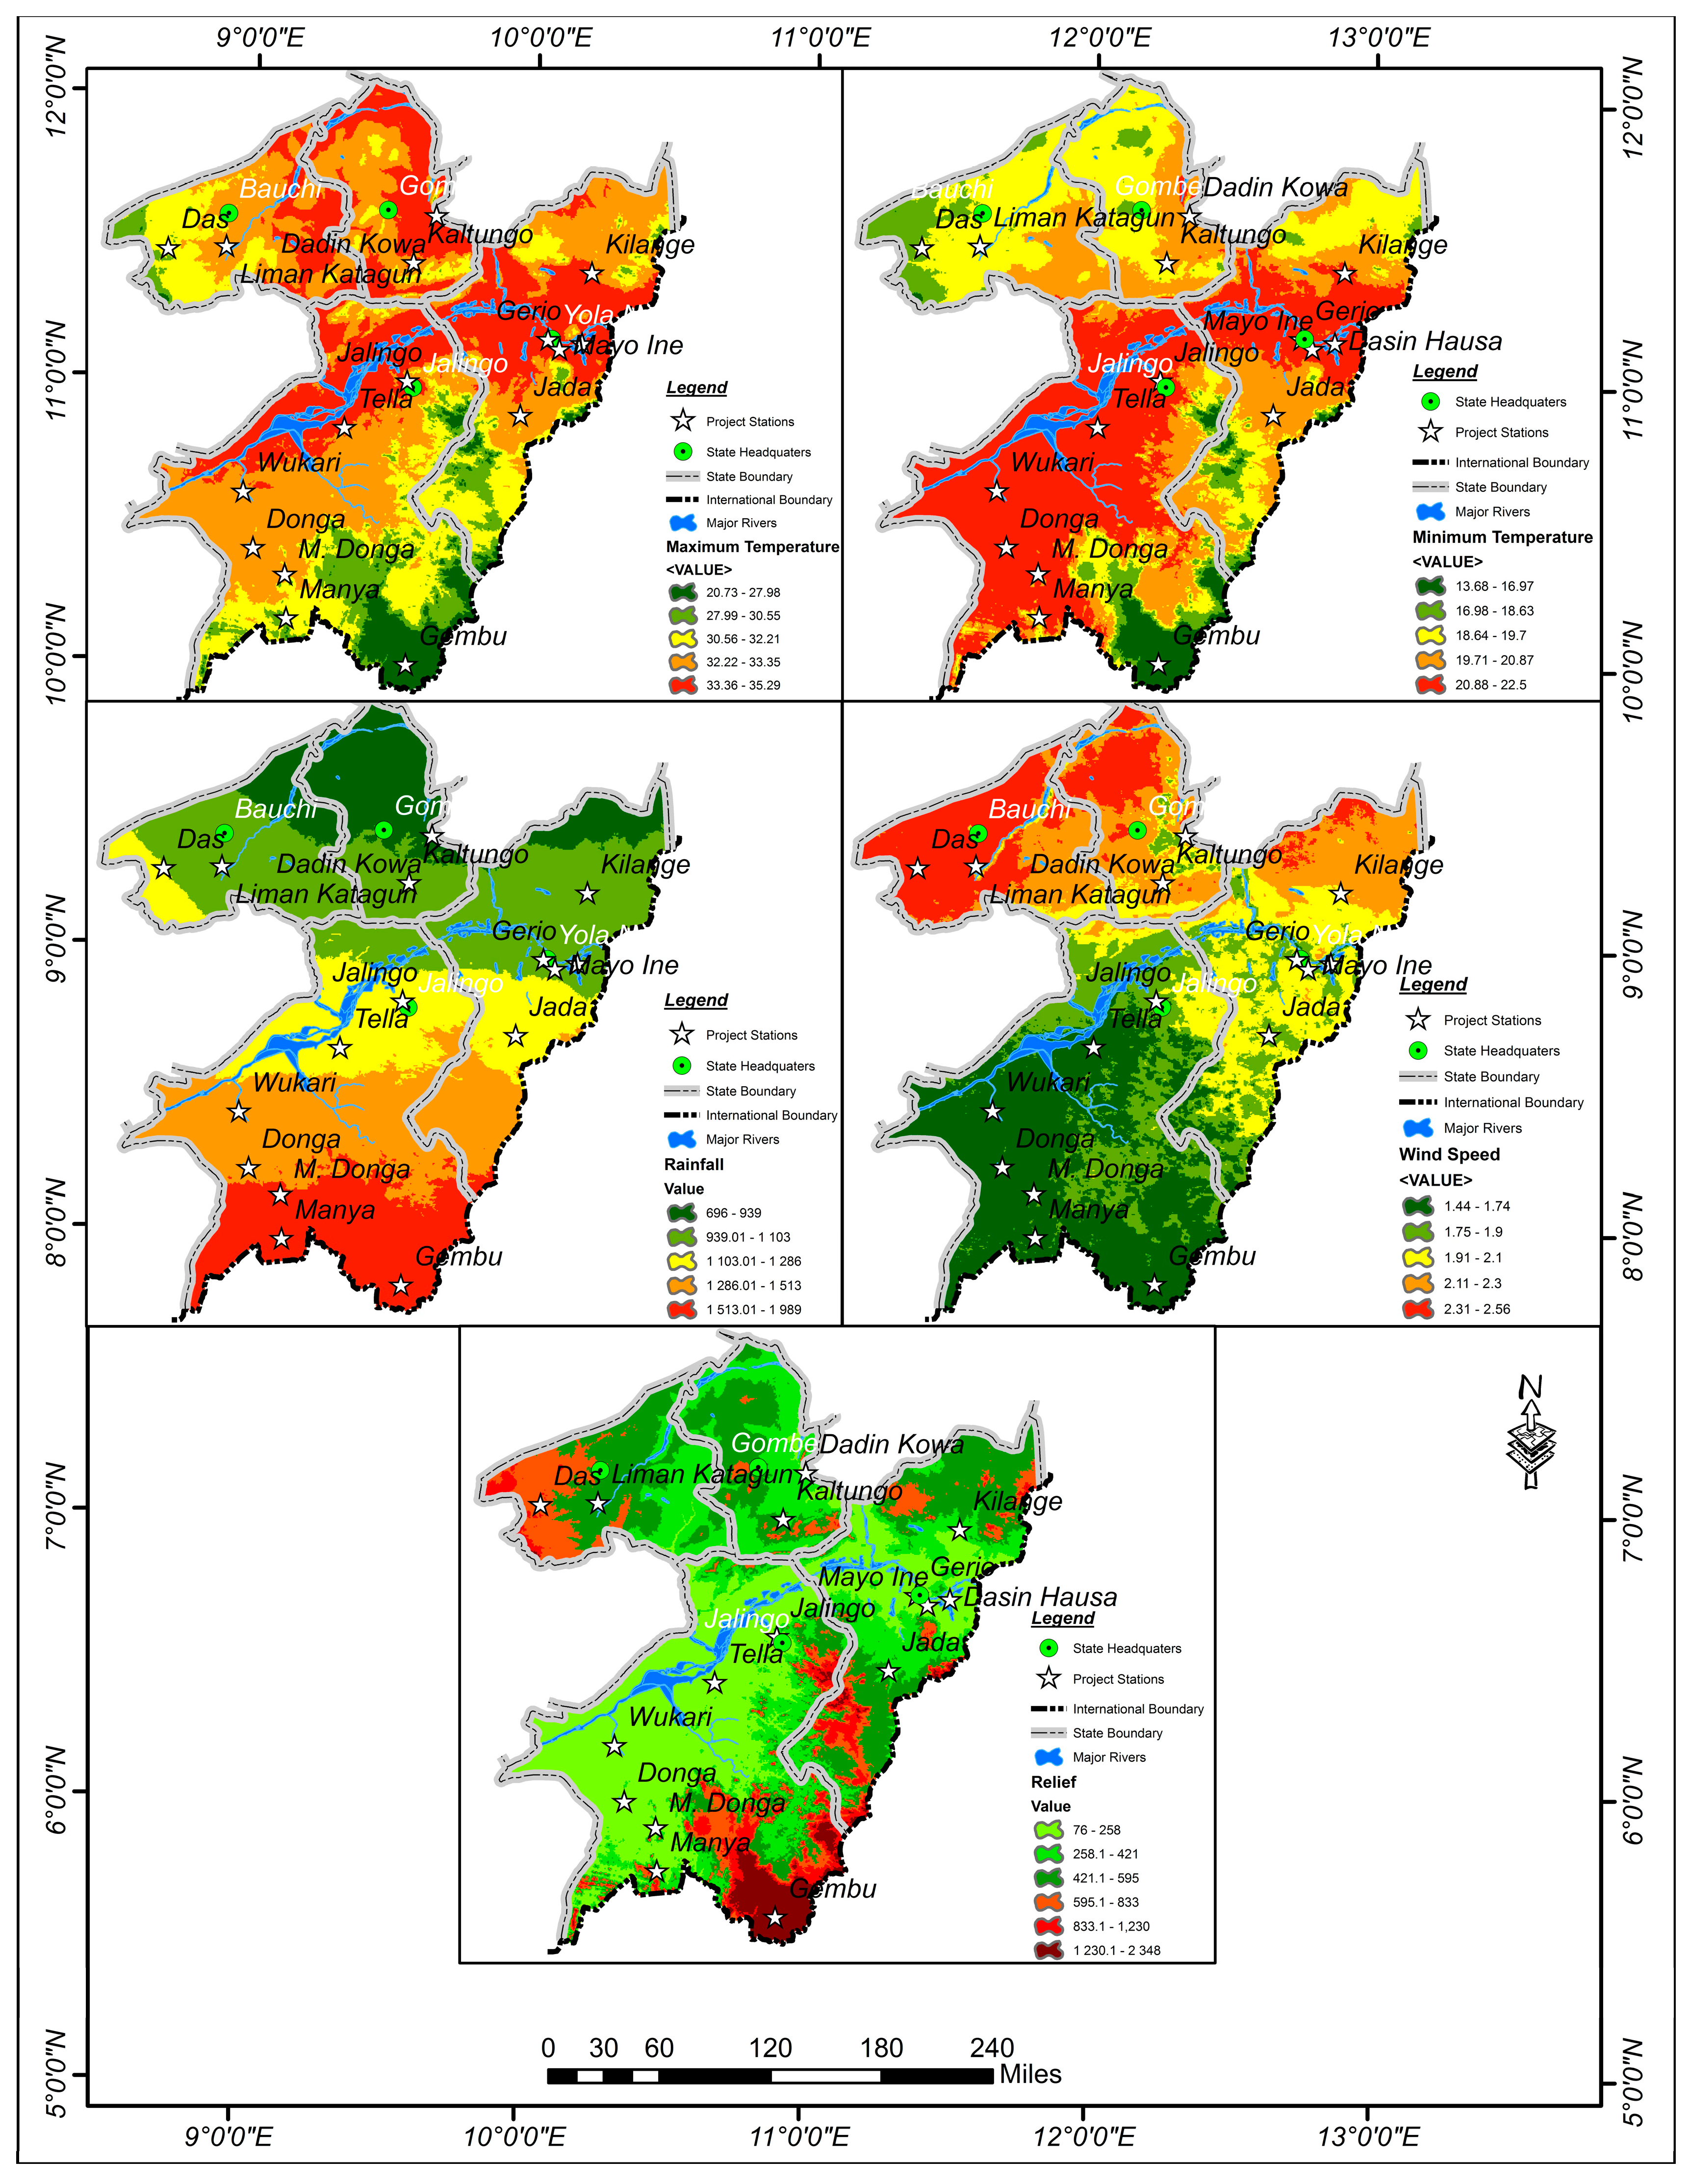
2. Study Area

The study area (Figure 1) is situated between latitude 06°02′18″ and 11°36′36′′ and longitude 08°54′32′′ and 13°29′41′′, covering a land area of 257,606 km2. Its operational area includes all the major tributaries of the Benue River upstream, encompassing the Adamawa Central and Southern Senatorial Districts, Bauchi Southern Senatorial District, and all three Senatorial Districts of Taraba and Gombe States [17]. The area is predominantly a highland region, ranging from 1000 to 1500 m above sea level, with notable peaks such as Gotel and Mambila Mountains in the southeast, Adamawa Highland and Alantika Mountains in the east, Vogel Peak and Shebshi Mountain in the central-eastern part of the basin, and Muri Hill Mountain in the northwestern part of the map. Other highlands within the area, whose altitude ranges between 300 and 750 m, include Fali and Bali Hills in the southeast, Sheno Hill in the north, and Wade Hill in the northwestern part of the area [18]. The lowland part of the area is characterized by a network of streams and rivers flowing in broad sandy valleys, with altitudes below 300 m in the Benue valley [18]. The basin is drained by one major river, the Benue River, which originates from the eastern highland of Mandara Mountain and its tributaries. The major tributaries in the basin are the Faro, Lamurde, Taraba, Suntai, and Donga Rivers in the eastern part of the basin, while other tributaries include the Gongola and Gaji Rivers in the western part of the map.
The climate of the area is influenced by a tropical marine air mass that is relatively warm and moist, originating from the Atlantic Ocean, and a relatively cool, dry, and stable tropical continental air mass, originating from the movement of the cool and dusty North-East Trades (Harmattan). The long dry, or Harmattan, season, which lasts from November to mid-March, is typically cool and misty in the morning, but the mist disappears after sunrise. During this period, grasses die off, and the leaves of some trees turn brown and fall later [18,19]. Rainfall and temperature vary across the area, influenced by latitude and altitude [12]. Significant contrasts exist between the high plateau and lowlands in terms of rainfall and temperature, with rainfall in the highland averaging approximately 1800 mm on the plateau [18]. The major soil types in the area, according to Balogun [20], are alluvial soil, vertisols, lithosols, luvisols, and ferrasols. The alluvial soil type is found on the flooded plains of rivers that run along the valleys of the Benue River and its tributaries.

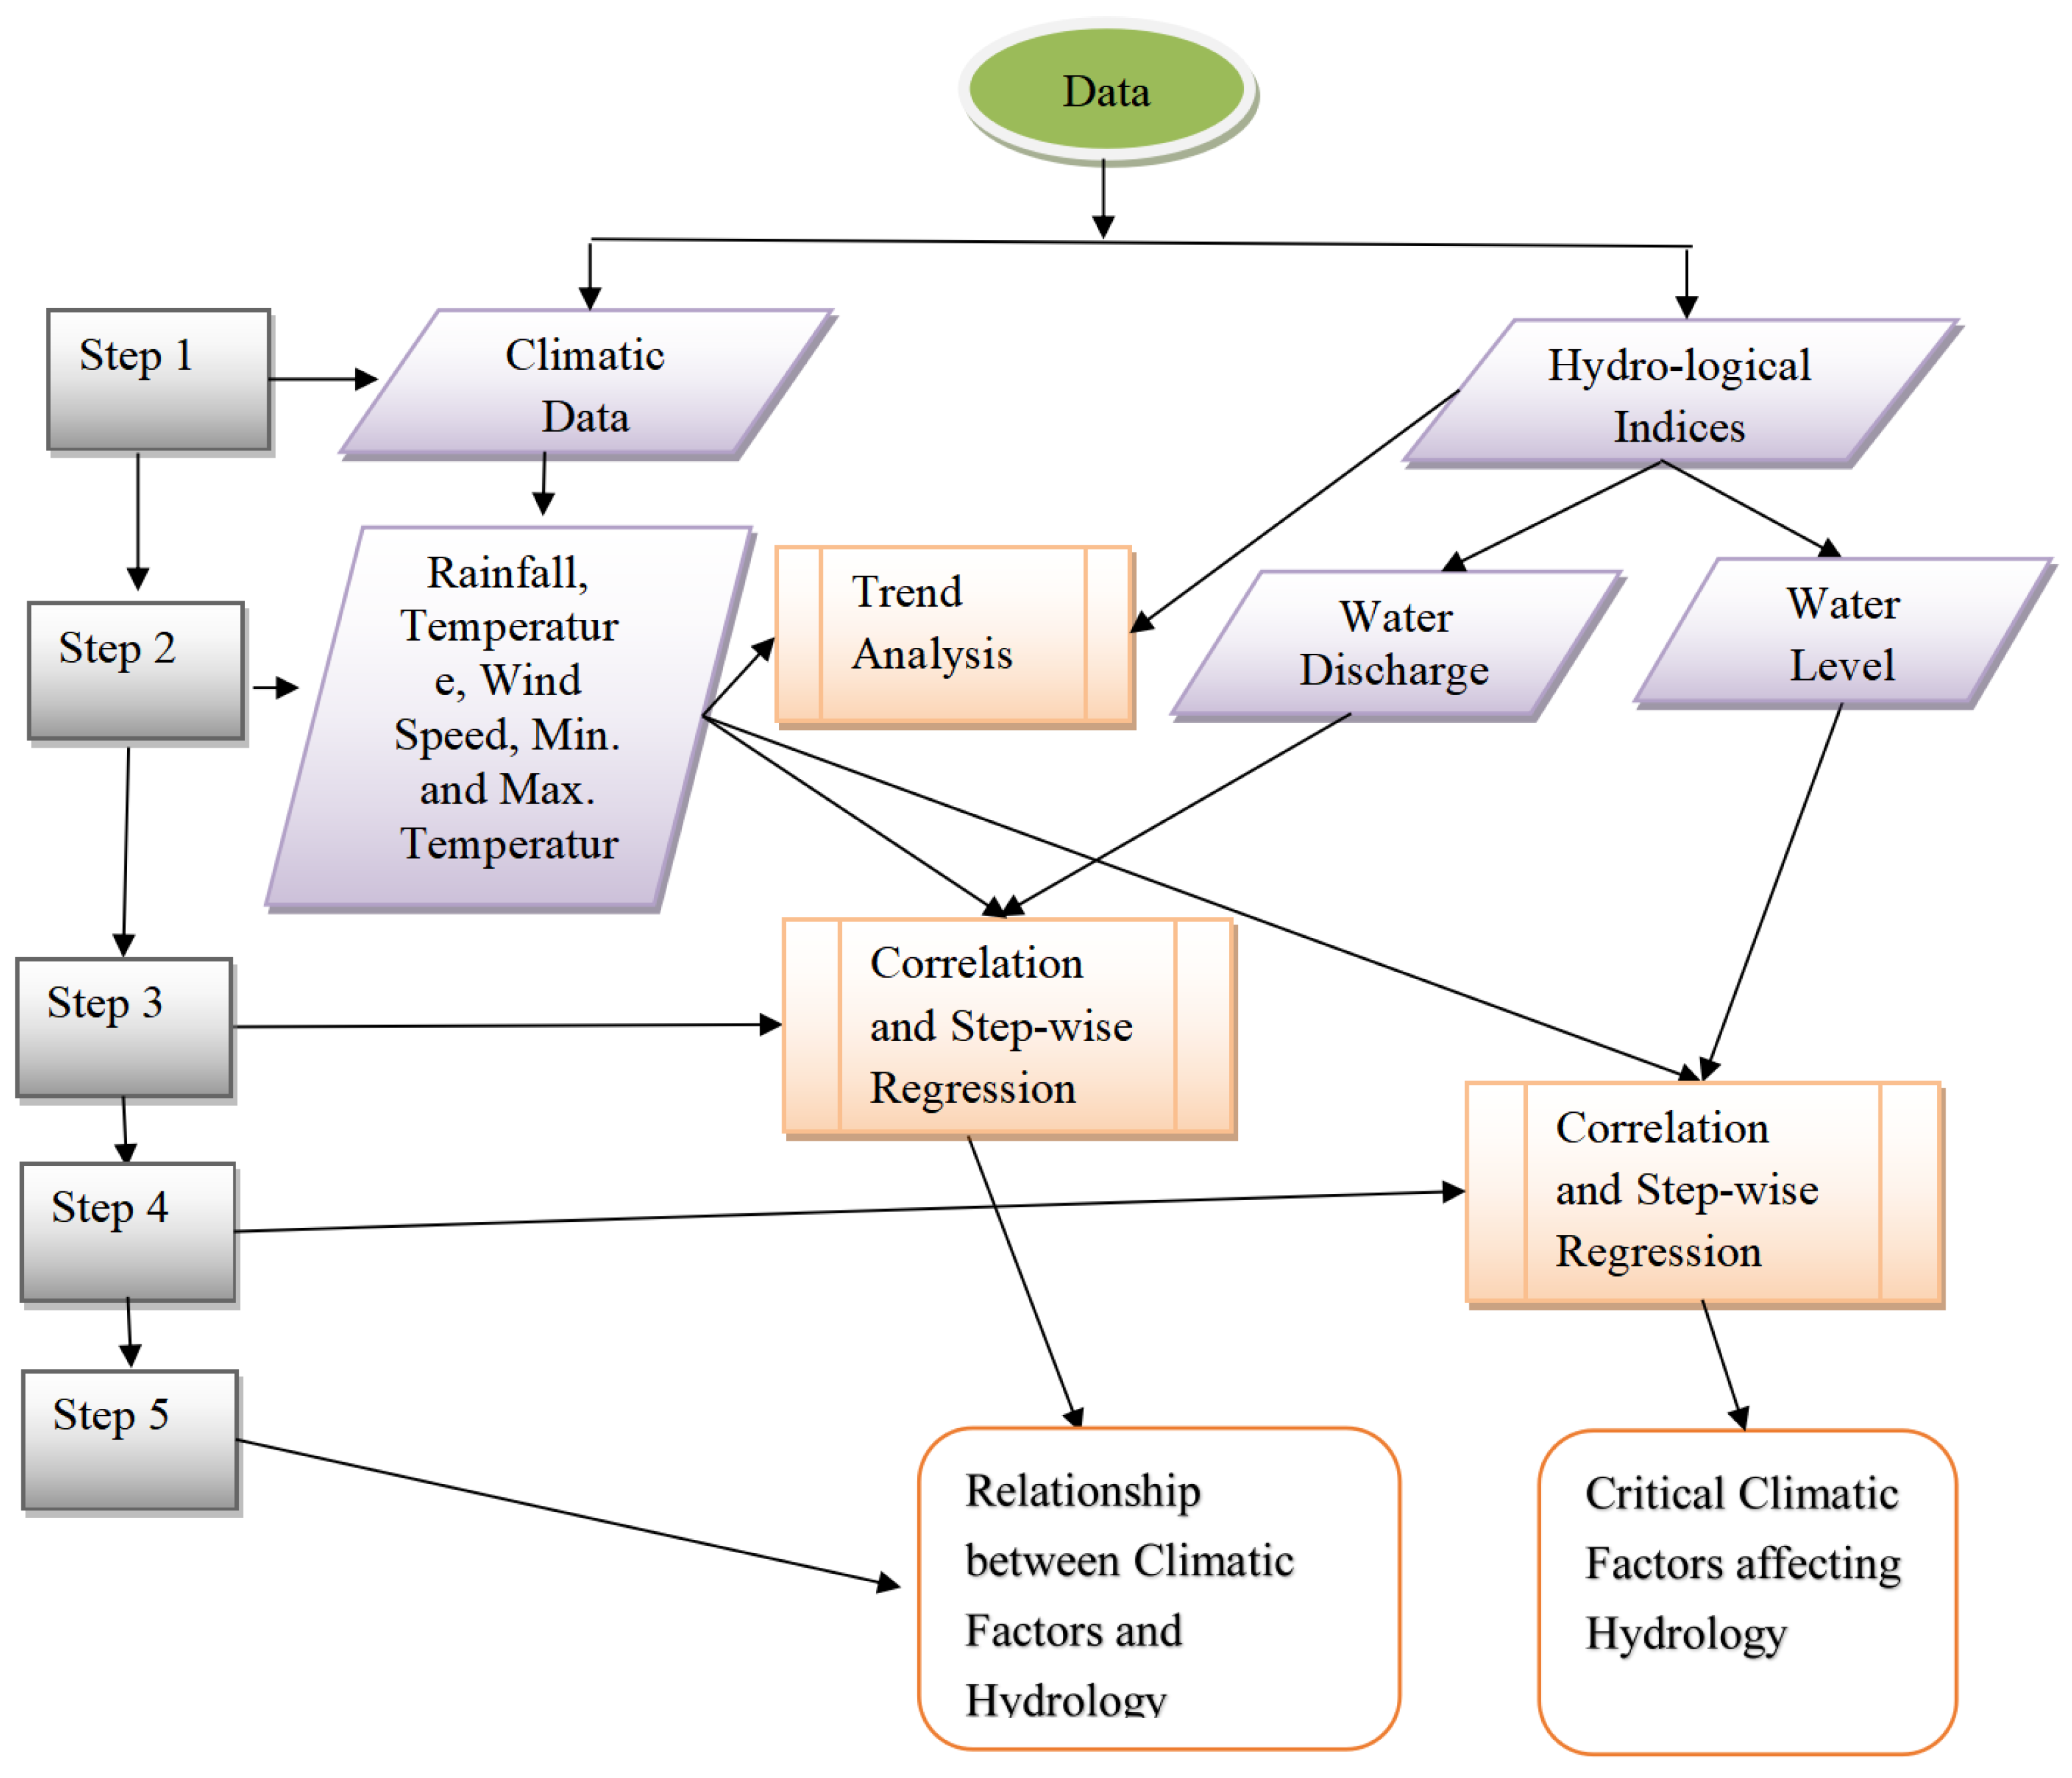
3. Materials and Methods

This study utilized various data types and sources to achieve its objectives. Climatic data, including monthly records of rainfall, relative humidity, and minimum and maximum temperatures, and hydrological data, including water discharge and water level for the period 1981 to 2019, were obtained from Nigerian meteorological stations (NiMets) at Yola Airport and the Upper Benue River Basin Development Authority (UBRBDA), Yola. The map of the study area and its physical features were extracted from Zemba et al. [21]. The data used in this study and its sources are shown in Table 1.
To ensure the accuracy and reliability of the data, requests were made to the relevant governmental agencies for the collection of climatic, discharge, and water level data from stations. The data were collected daily and summarized in monthly records. River discharge and water level were recorded in m3/s and meters, respectively, at the meteorological stations located within the study area by the staff of the Upper Benue River Basin Development Authority.
This study incorporated a regional method for climate change analysis [22], premised on the use of the entire Basin as a region, thereby recommending the regional method as the most accurate [22]. Pearson’s product moment correlation (PPMC) and stepwise regression analysis were conducted using SPSS version 20 to identify the major climatic factors affecting water discharge and level in the study area. The station-year method, suggested by Adebayo [22], Lobell & Burke [23], and Shi et al. [24], was adopted as the best and most accurate method for spatiotemporal analysis.
The technical roadmap of this study is presented in Figure 2, which outlines the various steps taken to achieve the study’s objectives. The correlation and regression models used in the analysis are presented below:
r = x y x y n x 2 x 2 n y 2 y 2 n
where r represents correlation coefficient; x and y are the hydrological indices and climatic variables, respectively.
Y= a + b1×1+ b2X2+ b3X3
where Y represents water discharge and water level; X represents the climatic variable.

4. Results and Discussion

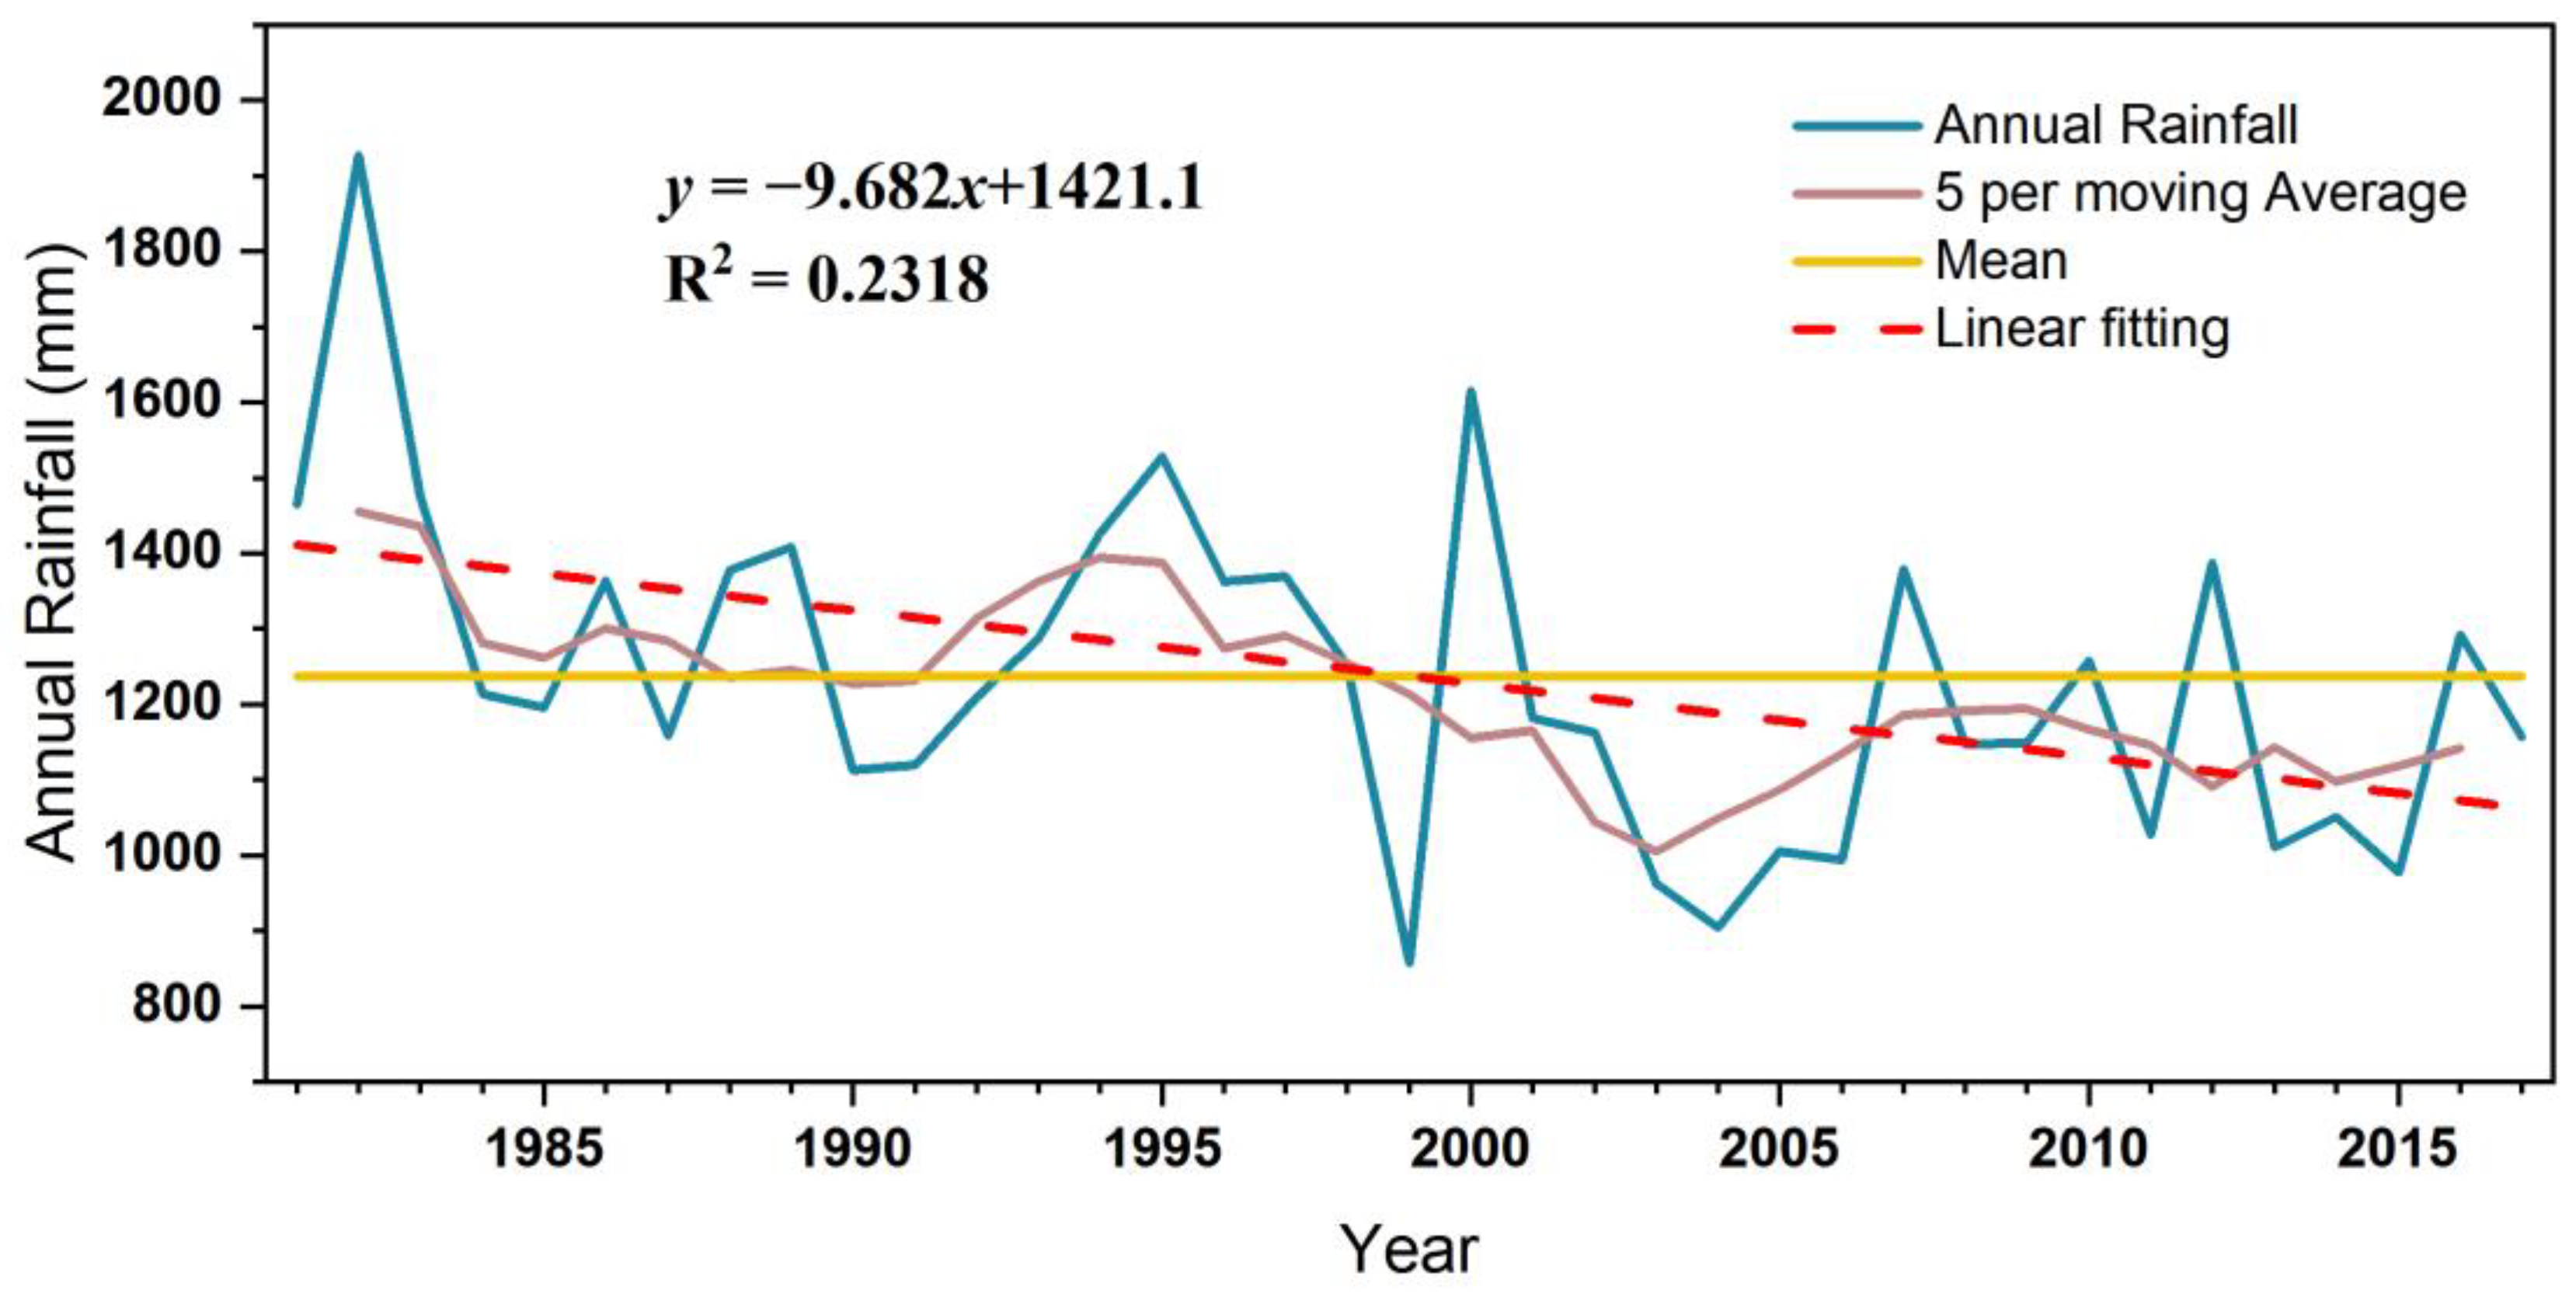
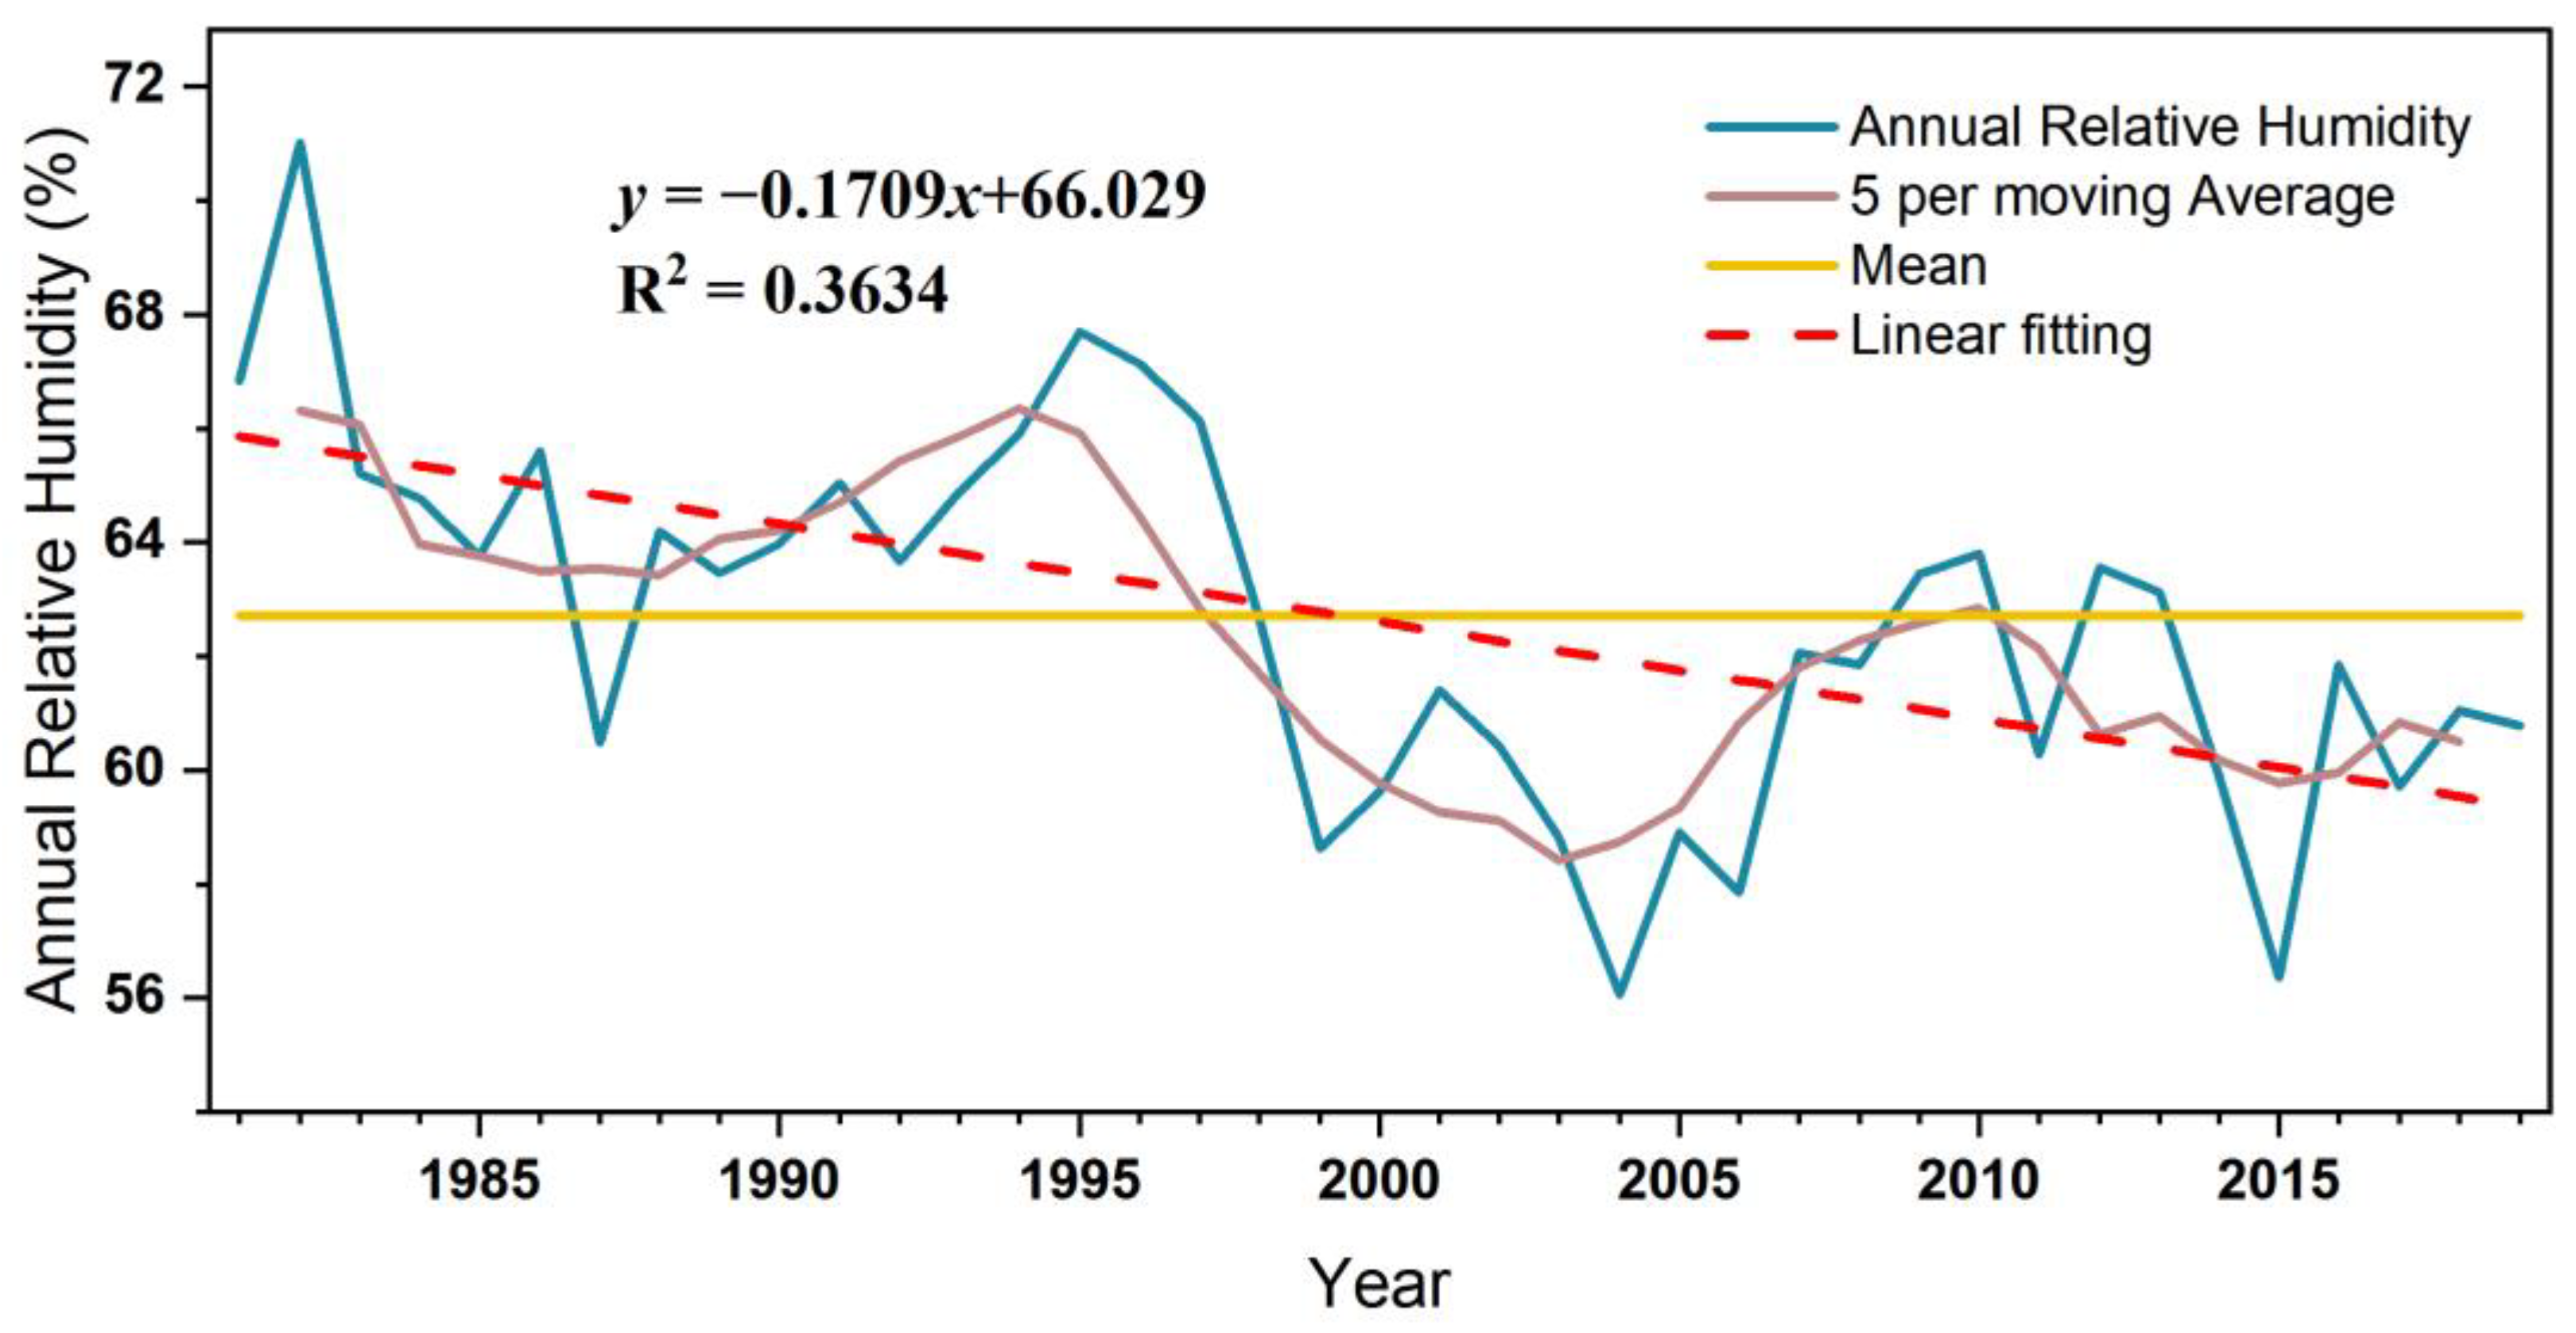
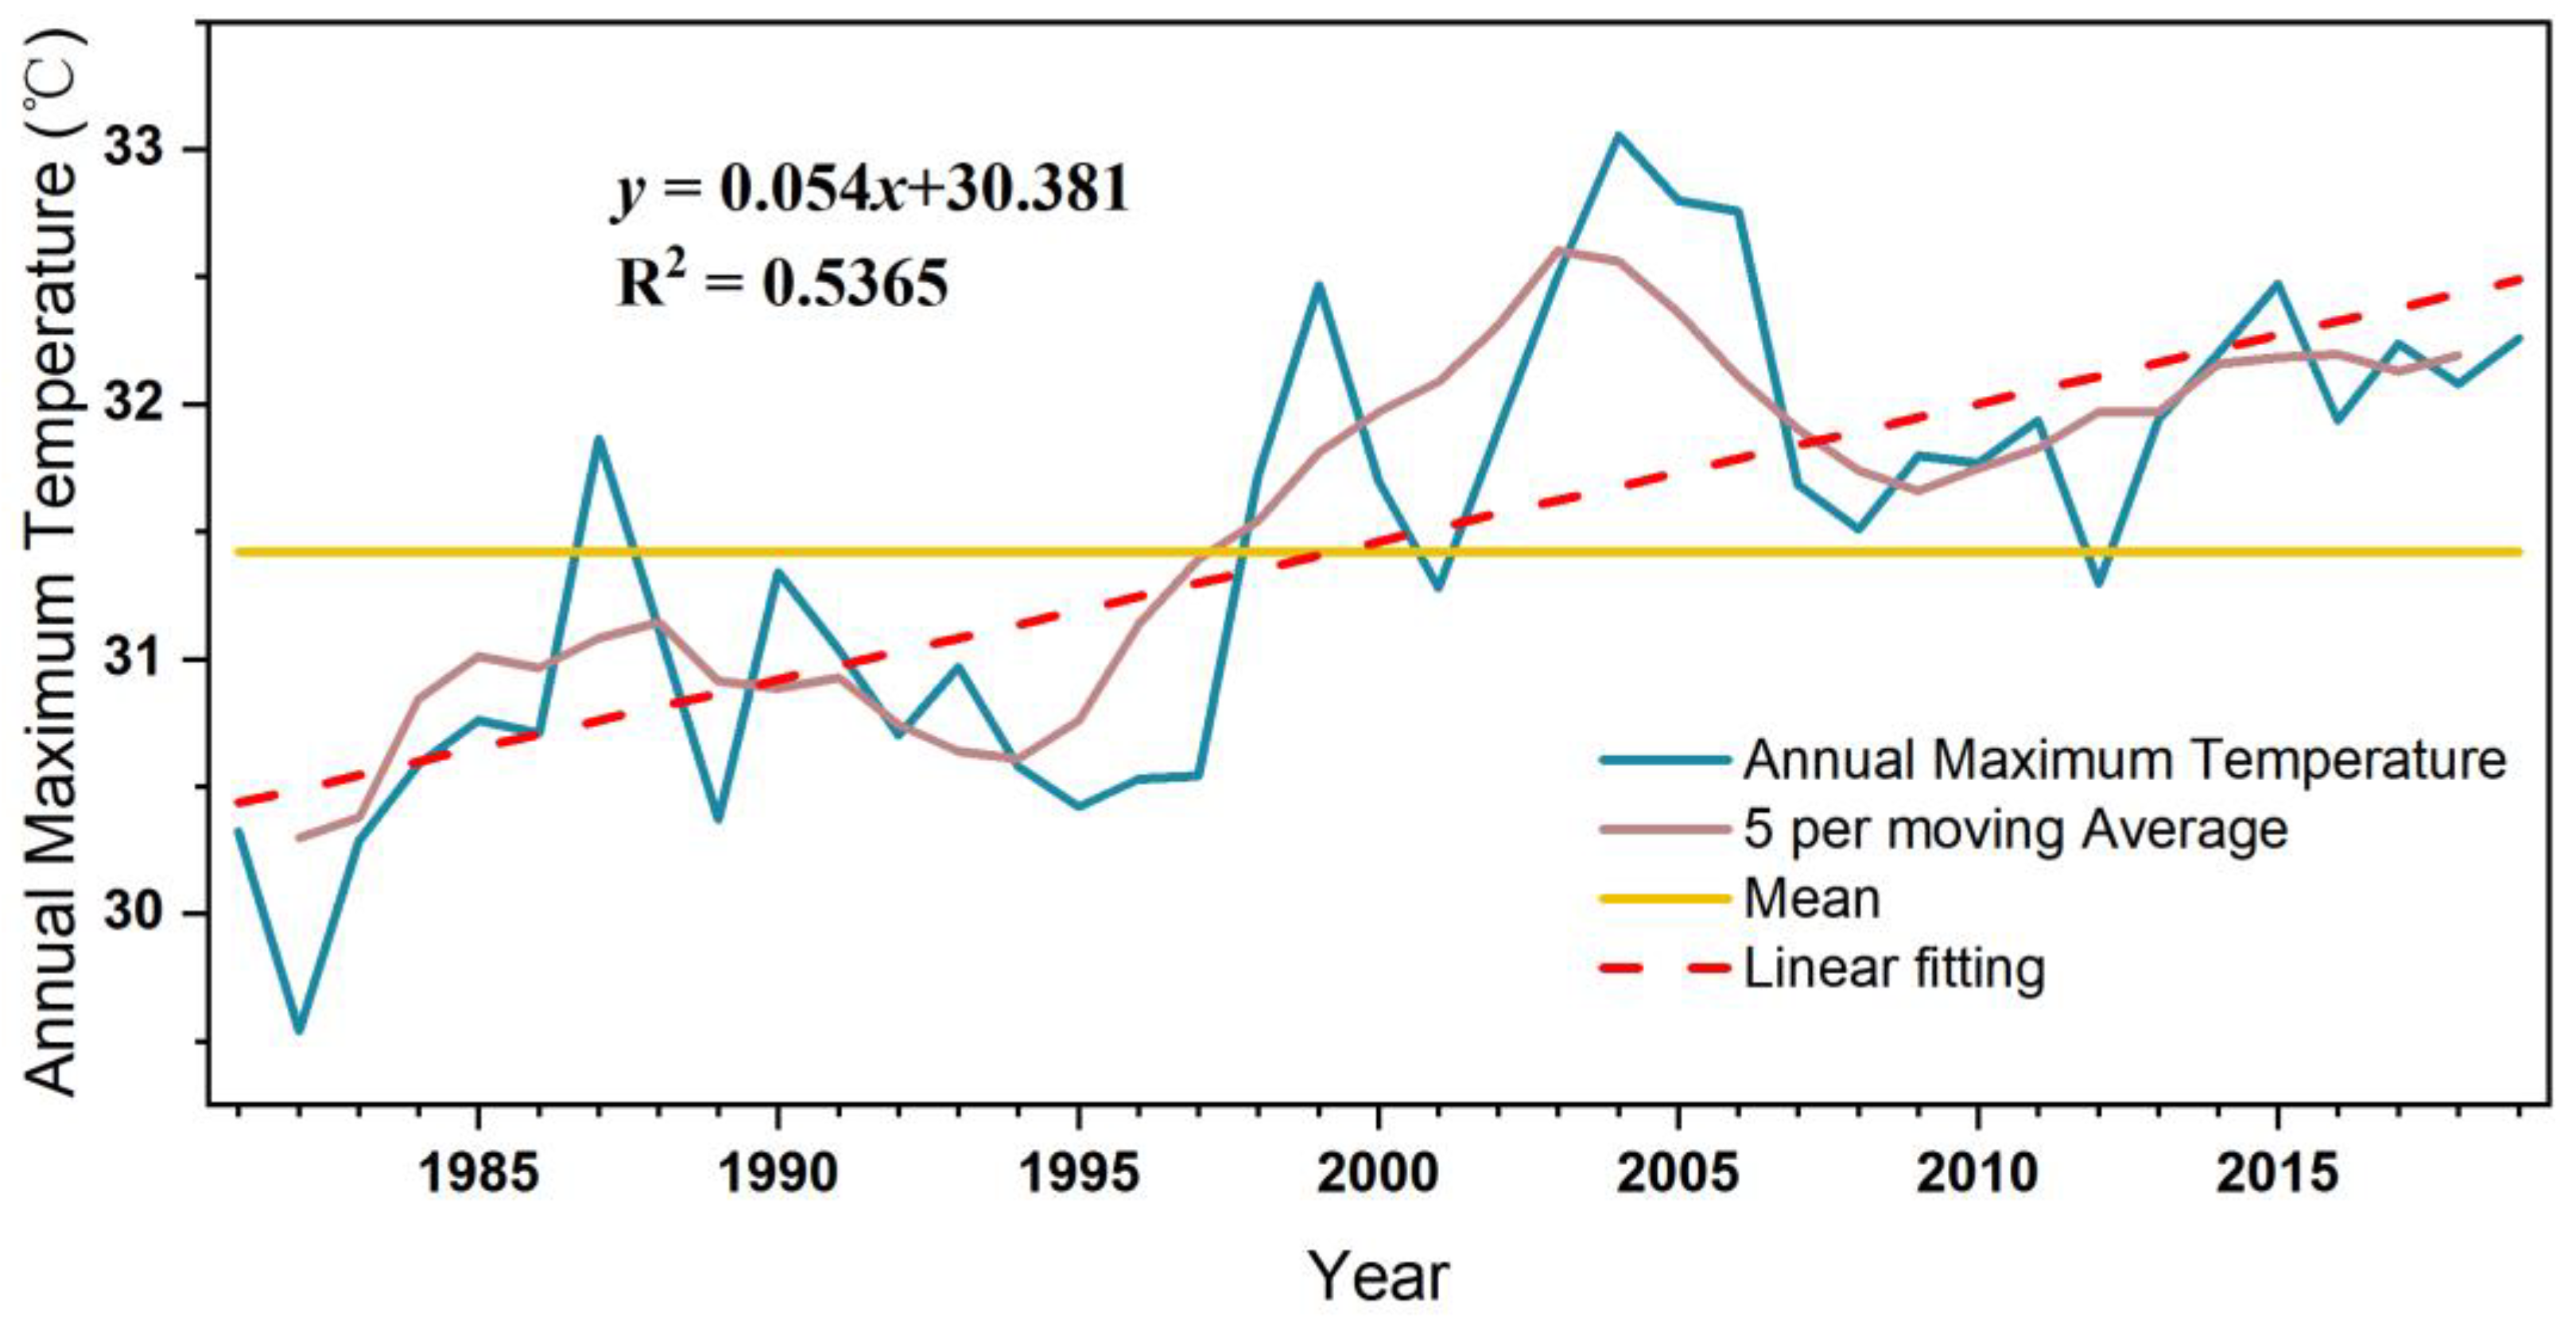
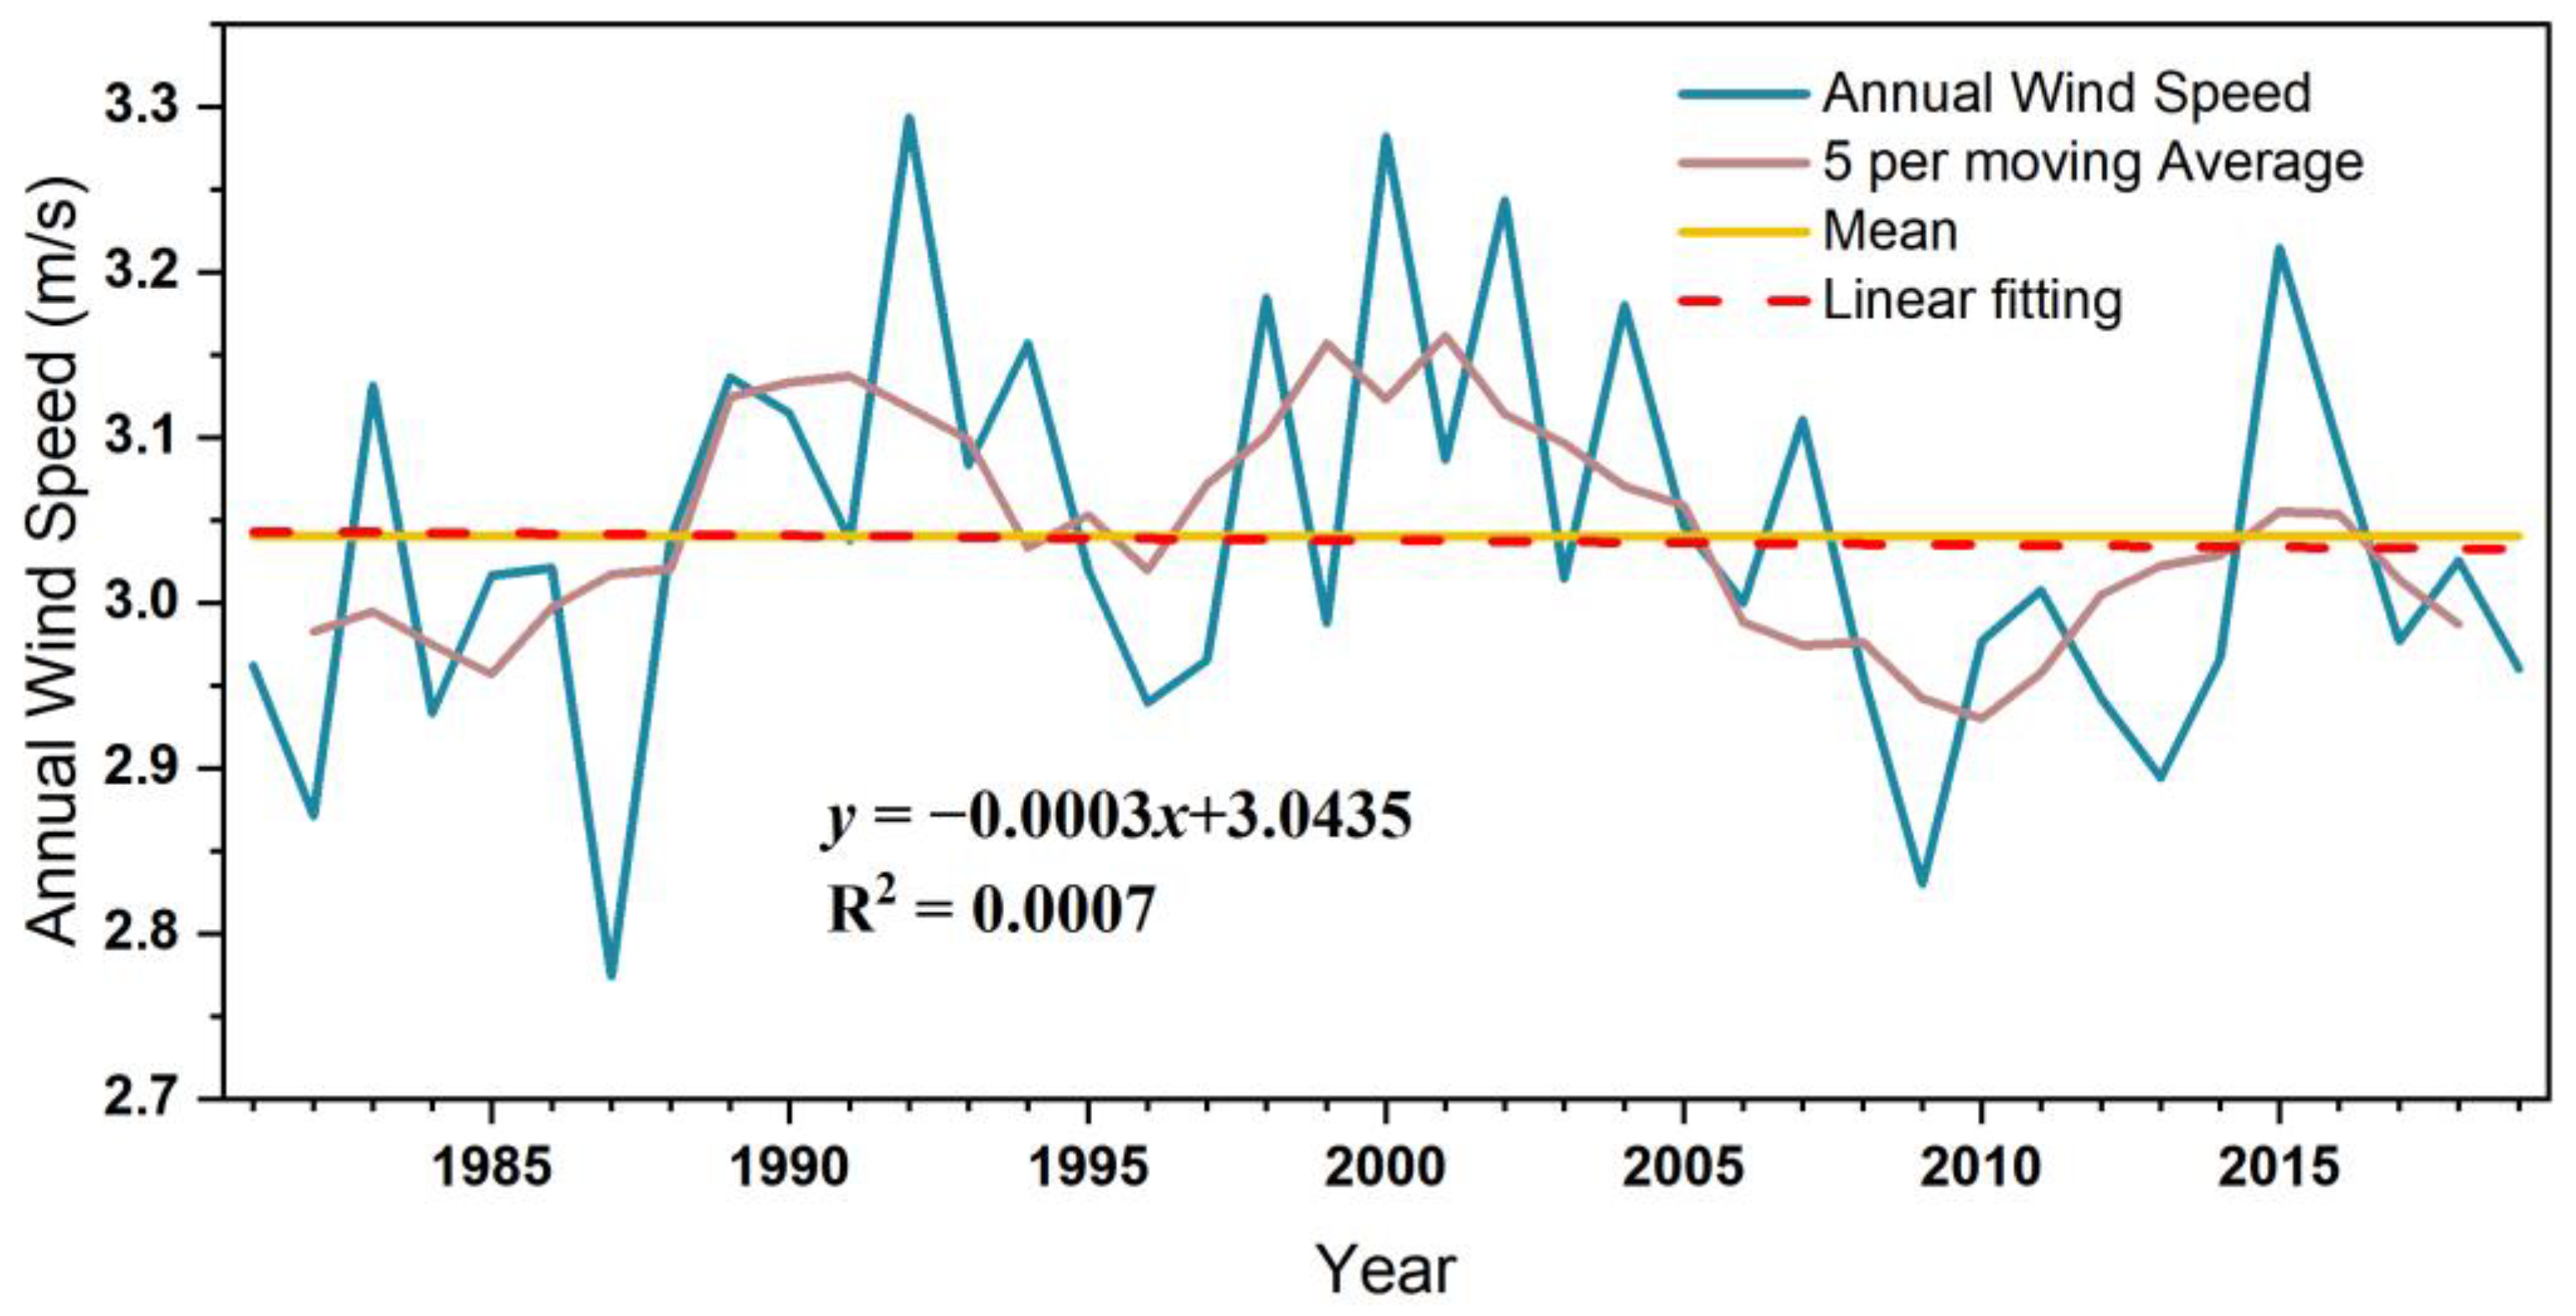
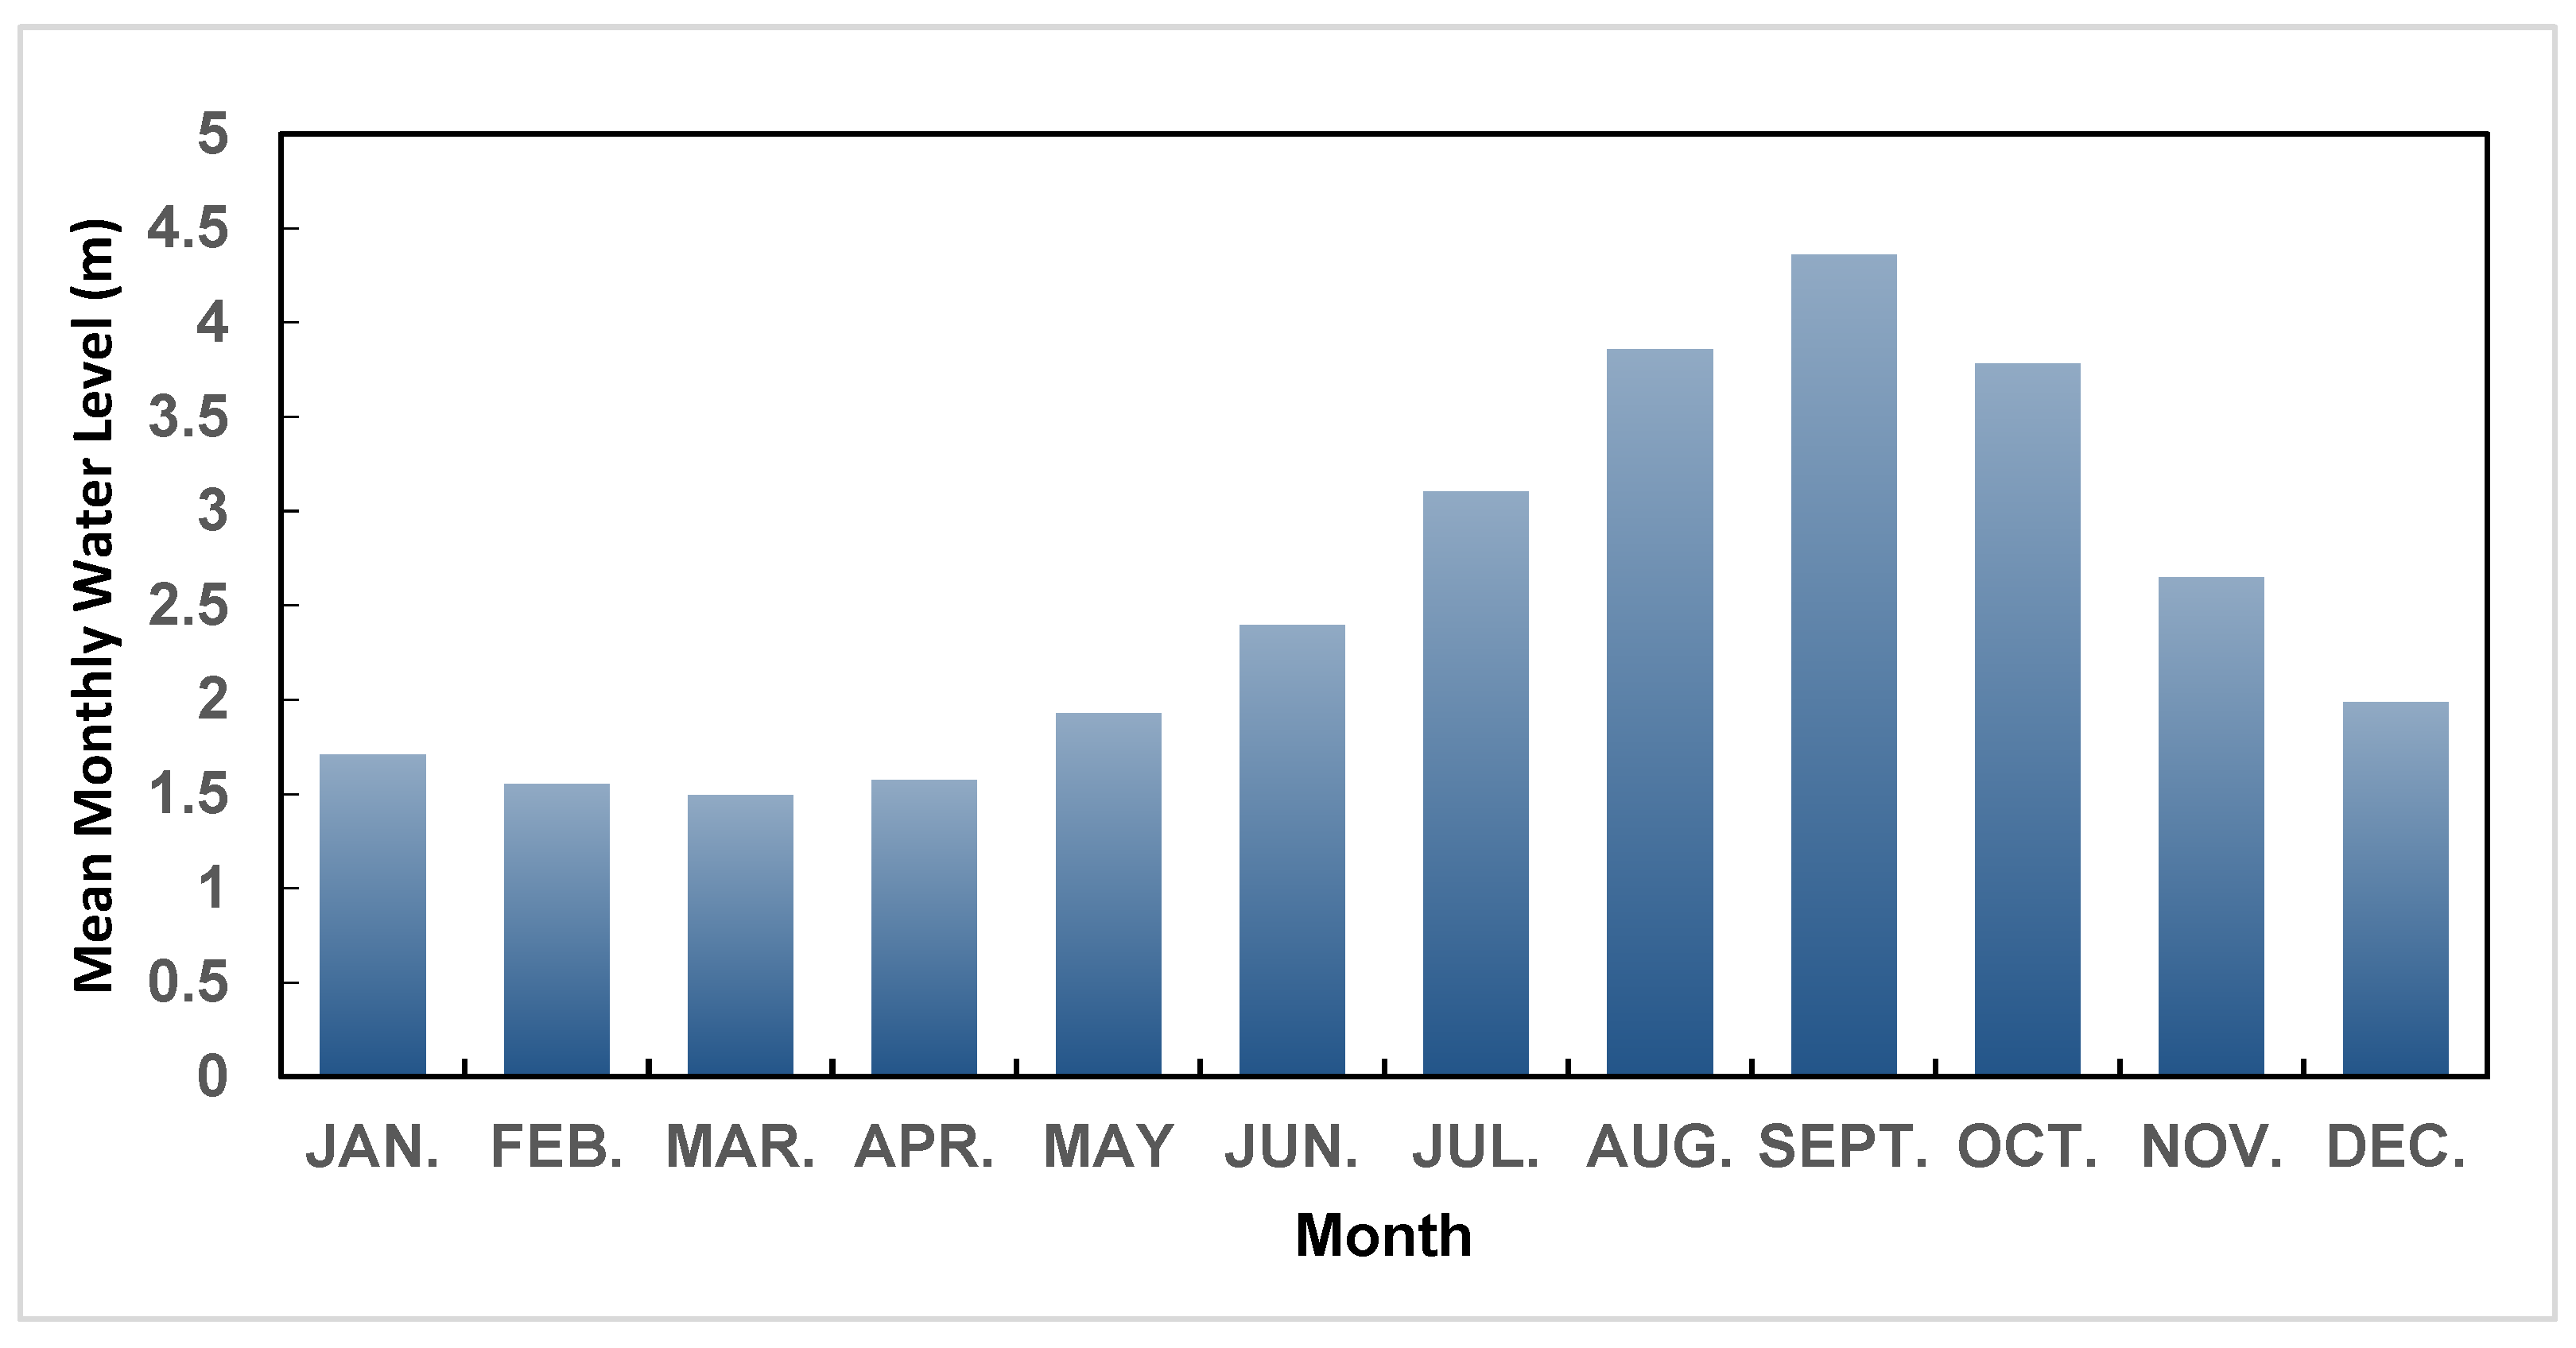
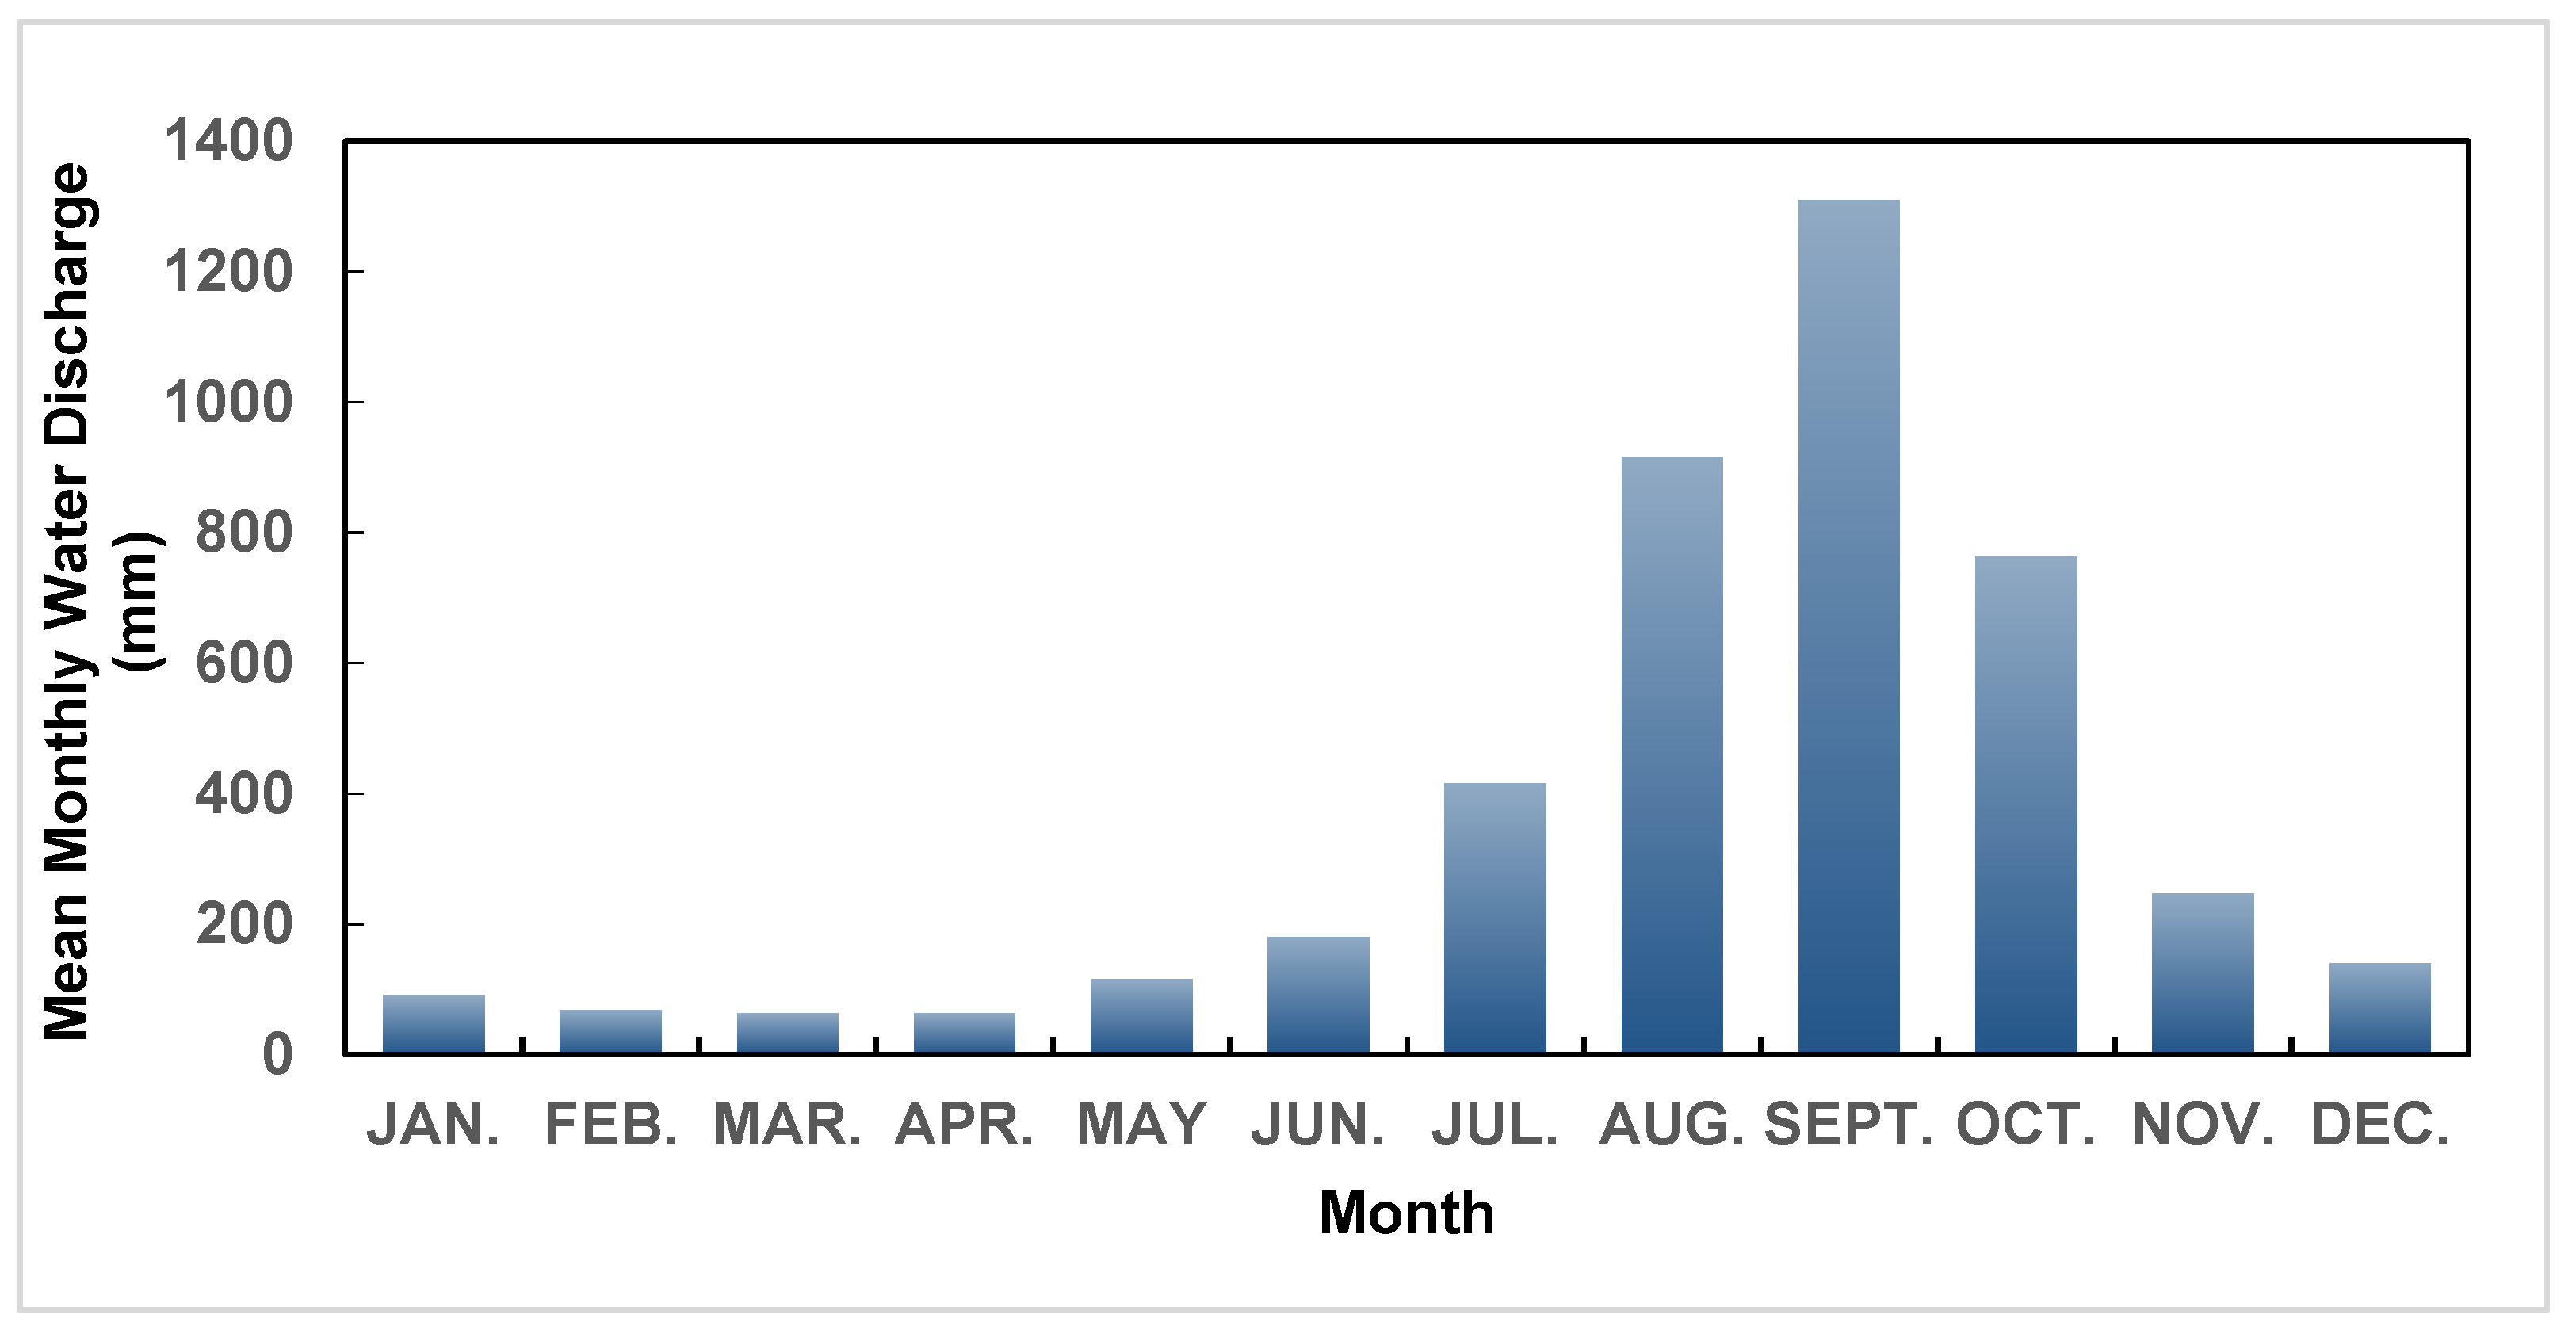
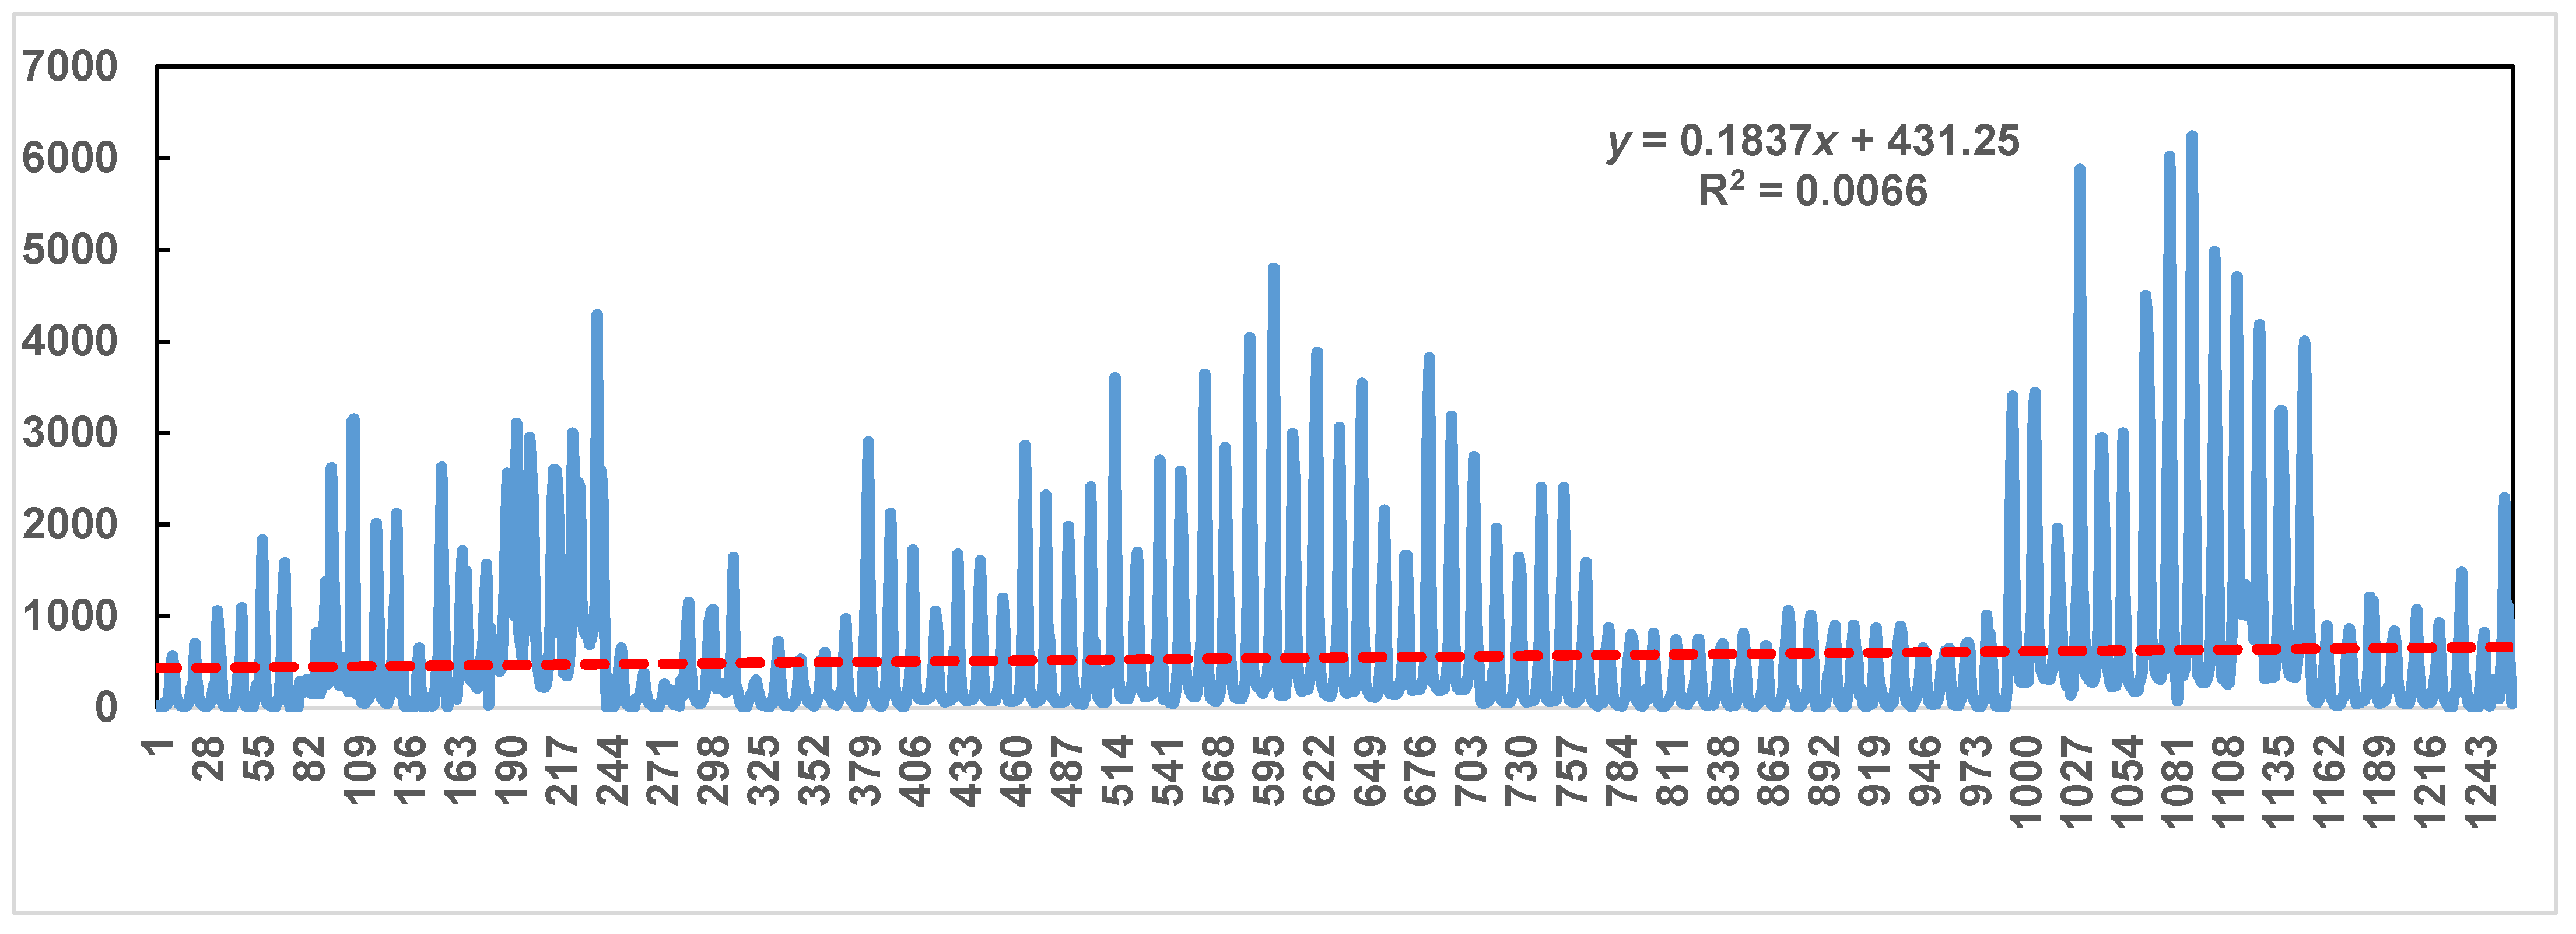
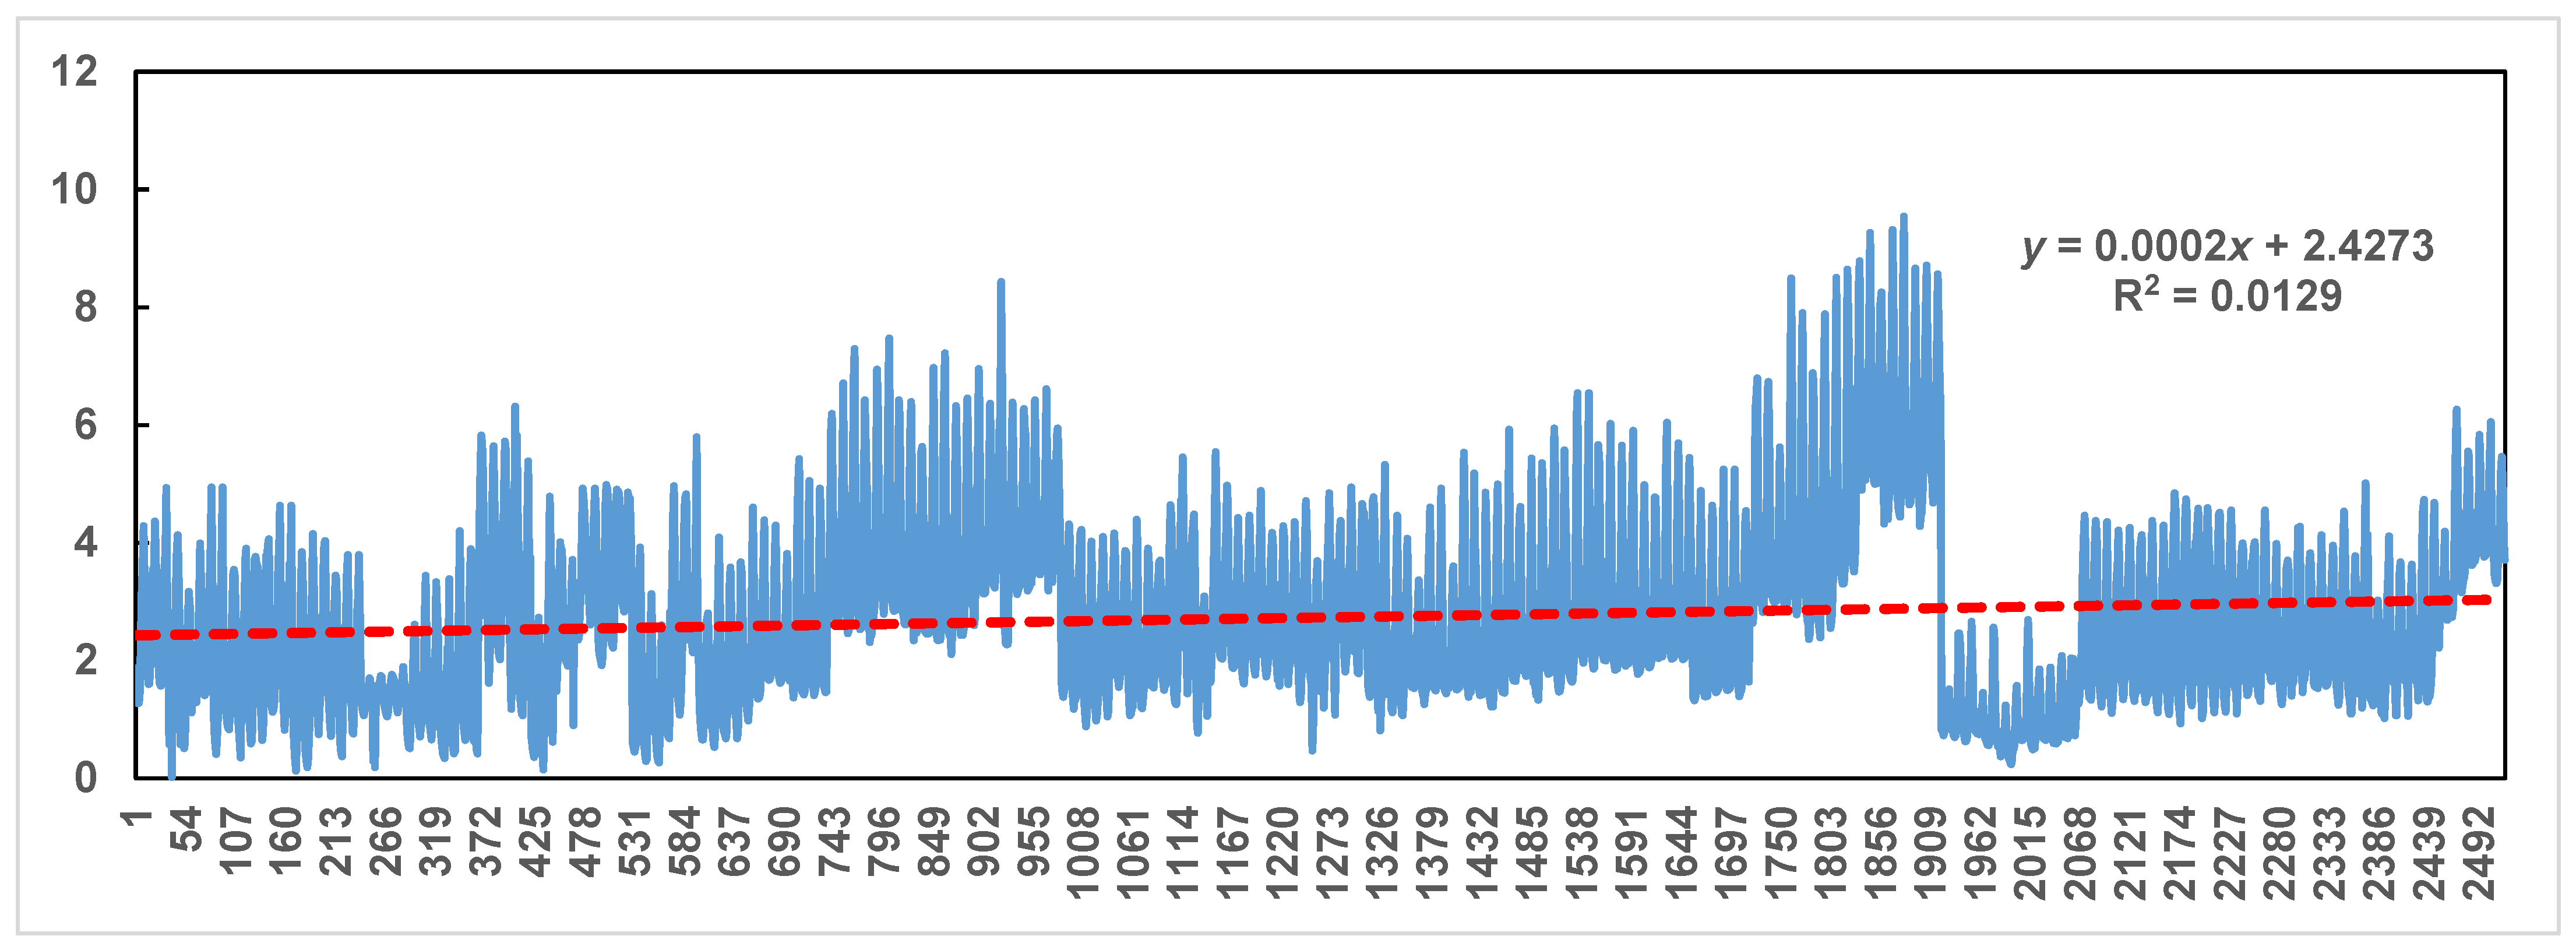
4.1. Nature and Extent of Climatic and Hydrological Trends in the Area

Figure 3, Figure 4, Figure 5, Figure 6 and Figure 7 present a comprehensive view of the climatic trend’s degree and scope within the study area. The analysis of the climatic data reveals a noticeable trend, underpinned by decreasing mean annual rainfall and relative humidity trends of −9.682 and −0.1709, respectively. The diminution of rainfall and relative humidity is alarming because these variables are primary catalysts for hydrological processes and ecosystem functionality. A downward shift in these variables suggests reduced rainfall and atmospheric moisture, potentially impacting regional water availability and agricultural productivity.
Amplifying concerns is the escalating trend in both maximum and minimum temperatures, signaling an increase in the area’s heat level. This escalation consequently spurs evaporative rates, potentially diminishing soil moisture availability and reducing stream flow. This predicament could precipitate acute water scarcity, particularly during droughts. The downward wind speed trend further complicates the scenario, possibly leading to air stagnation and elevated air pollution levels [25].
The climatic trends observed in this study mirror the findings of Melkamu & Zerihun [6] and Enete & Ebenebe [26], who also reported similar downward rainfall trends coupled with temperature rise. Conversely, this study contrasts with Ezra et al.’s [13] findings, which observed an upward rainfall trend in Taraba State. This discrepancy can be attributed to differing study periods, methodologies, and spatial scopes.
The implications of these findings are profound, as they affect water resource management and agricultural productivity in the study area. The observed climatic changes indicating a drying trend in the region could bring about more frequent and severe droughts, reduced crop yield, and water scarcity.
Mitigating climate change’s impact on regional water resources, agriculture, and livelihoods necessitates proactive measures. These measures might include creating drought-resistant crop variants, fostering water conservation, and enhancing agricultural water use efficiency.
In the pursuit of sustainable water use in the study area, strengthening water resource management practices and policy frameworks is paramount. This could involve measures to minimize water wastage, develop water storage infrastructure, and urge effective water harvesting practices.
Finally, it is essential to consider further research exploring the intricate relationships between climate change, hydrology, and agriculture within the study area. Such consideration can be indispensable in guiding the development of targeted adaptation and mitigation strategies.
The hydrological trend analysis illustrated in Figure 8, Figure 9, Figure 10 and Figure 11 demonstrates a declining trend in both water discharge and level within the study area. Analysis of the monthly trend in the hydrological indices revealed positive slope values of 0.1837 and 0.0002 for water discharge and level, respectively. These findings align with prior studies by Nur Khaliesah et al. [27], Marco et al. [28], and Santosh [29] that reported increasing trends in water levels.
This detected trend warrants concern as it suggests a potential rise in water flow, leading to potential flood risks in areas along major rivers. Furthermore, it could affect agriculture, specifically irrigation and fish farming, and may necessitate the relocation of residents. The peak annual water discharge and level were recorded in September, with mean values of 1309.39 m/s and 4.36 m, whereas the lowest values were observed in April and March, respectively. This pattern corresponds to the rainy season peak—usually in August and September—and the dry season—around March and April. During the dry season, elevated temperatures could accelerate evapotranspiration rates and reduce water levels, as observed by Ezra et al. [13].
Our findings underscore the significant implications of observed trends on areas such as water resource management, agriculture, and biodiversity conservation in the region. Narratives of decreasing water discharge point towards imminent water scarcity, which could dramatically impact regional agricultural productivity and residents’ lifestyles. Conversely, an escalating trend in water levels may precipitate flooding, posing critical threats to infrastructure and property. These developments call for sustainable water management protocols and effective interventions to mitigate the effects of climate change on hydrological processes.
The results highlight the necessity of persistent monitoring and evaluation of hydrological systems to establish informed decision-making and policy formulation. Potential measures encompass the development of water storage infrastructure, promotion of efficient water conservation practices, and adoption of drought-resistant crop varieties. These could substantively offset the water scarcity outcomes arising from decreasing water discharge. Furthermore, regulations and policies advocating sustainable water use and the protection of water resources are required.
The noted downward trend in water discharge—complemented by an elevated water level trend—is consistent with preceding studies. These phenomena have momentous implications for various sectors including water resource management, agriculture, and biodiversity conservation. The profound need for proactive measures addressing climate change’s impact on hydrological processes and for sustainable water management practices stands out. Further research is warranted to disentangle the intricate interrelationships amongst climate change, hydrology, and agriculture in the region. This could be instrumental in paving the way for strategizing targeted adaptation and mitigation approaches.

4.2. Relationship between Climatic and Hydrological Indices

Table 2 presents the results of a correlation analysis conducted between climatic and hydrological indices within the studied region. The analysis suggests substantial positive correlations between precipitation and relative humidity with water discharge and levels, identified by correlation coefficients of 0.326 and 0.342, respectively, at a significant p < 0.01 level. Correlations between climatic indices and water level also project significant positive relationships of 0.342 and 0.412, respectively, at the p < 0.01 level. These relationships demonstrate that rainfall and relative humidity directly affect water discharge and levels; increases in their distribution will result in increased river flow and vice versa. This is aligned with conclusions made by Mekonnen and Songcai [4], who have also reported positive correlations between rainfall, relative humidity, and river flow.
In contrast, the analysis results reveal significant negative relationships between maximum temperature and wind speed with water discharge and level. The correlation coefficients were −0.312 and −0.364 at p < 0.01 for water discharge, and −0.391 and −0.324 at p < 0.01 for water level, respectively. The negative relationships imply that an increase in both maximum temperature and wind speed leads to a decrease in water level. These findings are consistent with the work of Ümit et al. [7], who reported similar negative relationships between maximum temperature, wind speed, and water level.
The observed negative relationships between maximum temperature, wind speed, and water discharge and level are attributed to the fact that an increase in temperature leads to an increase in the rate of potential evapotranspiration, which reduces the amount of river flow. Similarly, high wind speeds lead to increased turbulence and mixing, promoting the transfer of heat and mass across the water–air interface, which could lead to an increase in the rate of evaporation and a corresponding decrease in water level.
The present findings provide valuable insights into the relationships between climatic and hydrological variables, which are essential for sound water resource management. The observed positive relationships between rainfall, relative humidity, and water discharge and level suggest that efforts to increase water availability in the region should focus on enhancing rainfall and relative humidity. Additionally, the observed negative relationships between maximum temperature, wind speed, and water discharge and level highlight the need for measures to mitigate the impact of climate change on hydrological processes.
The findings underscore the importance of continuous monitoring and assessment of hydro-climatic processes to inform effective water management strategies and policies. The use of remote sensing and other advanced technologies could also help in the accurate quantification of hydro-climatic variables and their relationships. Further research is necessary to understand the complex interactions between climatic and hydrological processes in the study area to inform the development of targeted adaptation and mitigation strategies.

4.3. Critical Climatic Indices Affecting Water Discharge and Level

Table 3 presents the critical climatic indices affecting river discharge and level in the study area. The analysis results revealed that wind speed and rainfall were the most significant climatic indices affecting the variation in river discharge. The model was statistically significant, with an F value of 174.142 at p < 0.01, and accounted for 21.7% of the variation in river discharge in the basin (R2 = 21.7). The observed negative impact of wind speed on water discharge suggests that an increase in wind speed would reduce the amount of water discharge by 384.814, holding all other variables constant. In contrast, a unit increase in rainfall would lead to an increase of 2.432 mm in river discharge in the basin.
The present findings provide new insights into the critical climatic indices that influence river discharge and level in the region. The observed negative impact of wind speed on water discharge highlights the need for measures to mitigate the effects of wind speed on water availability. The positive impact of rainfall on water discharge underscores the importance of enhancing rainfall in water resource management and planning. The findings contribute to the body of knowledge on hydro-climatic processes and provide a basis for developing effective water management strategies and policies in the region.
Table 4 illustrates the stepwise regression results between climatic indices and the basin’s water level. The predictive model comprised three significant predictors (F = 225.551, p < 0.01), explaining 21.1% of the variation in the basin’s water level. The model yielded significant positive T values for relative humidity (T = 6.086, p < 0.01) and rainfall (T = 5.363, p < 0.01), while wind speed presented a significant negative T value (T = −11.154, p < 0.01). This climatic contribution indicates that a unit increase in relative humidity and rainfall would escalate the water level by 0.013 m and 0.002 m, respectively. Conversely, a unit increment in wind speed would decrease the water level by 0.011 m. The low R2 value showcases a minimal contribution of climatic indices to water discharge and level. This inference accounts for the operational practices of the dams within the catchment area that regulate water release based on need, predominantly towards the rainy season’s tail end, yielding a weak correlation with water discharge and level. These discoveries accord with the studies by Piet & Robert [30] and Hossein et al. [31].
The present findings highlight the critical role of rainfall and relative humidity in influencing changes in water level [32,33,34,35]. The observed positive relationship between rainfall, relative humidity, and water level underscores the need for sustainable water management practices that prioritize the enhancement of rainfall and relative humidity. The observed negative relationship between wind speed and water level highlights the need for measures to mitigate the impact of wind speed on water availability.
Based on the findings, the Nigerian government should increase the number of reservoirs (dams) along major and minor rivers that can be used for irrigation and other activities during the dry season, as river discharge and level reduce during this time. Additionally, the authorities involved, such as the River Basin Development Authority, should encourage climate change awareness and control among the people in the area [36,37,38,39]. It would also be beneficial to encourage the diversification of occupations from fishing or irrigation to trading and rainy season farming among people along major rivers who depend on them for their day-to-day activities.
The present study provides valuable insights into the critical climatic indices that influence river discharge and level in the study area. The findings underscore the importance of continuous monitoring and assessment of hydro-climatic processes to inform effective water management strategies and policies [40,41]. The observed relationships between climatic indices and water discharge and level highlight the need for measures to mitigate the impact of climate change on hydrological processes and sustainable water management practices.

5. Conclusions and Recommendations

5.1. Evidence and Implications of Climate Change

The presented research solidifies that climate change is occurring within the evaluated basin. Consecutive annual decreases in rainfall and relative humidity alongside an upward trend in both maximum and minimum temperatures paint a clear picture of these changes. This pattern aligns with parallel trajectories of global climate change observed worldwide. Moreover, the study unveils crucial information about the area’s seasonal climate patterns, revealing a monsoon peak in September as indicated by maximum recorded water discharge and level values. The lowest values were observed in April and March. These insights offer critical information for water managers and policymakers, enabling strategic planning and efficient management of water resources.
Furthermore, the research delineated a correlation, where increases in rainfall and relative humidity result in elevations in river discharge and levels, and conversely, enhancements in wind speed and apex temperatures lead to a reduction in river discharge and levels. The crux climatic indicators influencing river discharge were wind speed and precipitation, while relative humidity, wind speed, and rainfall were the primary climatic variables affecting the water level. These outcomes align with preceding research carried out in different regions and are crucial for crafting viable water management tactics that are responsive to climate change.

5.2. Comparative Analysis and the Need for Sustainable Strategies

Subsequent research is advocated to augment climate change consciousness and adaptation among agriculturists, gauge the repercussions of climate change on crop productivity, and appraise the impacts of climate change on the socioeconomic pursuits of the regional inhabitants. Such studies could proffer invaluable perspectives on the multifaceted impacts of climate change, and inform the structuring of potent adaptation and mitigation strategies to curtail the detrimental effects of climate change on the environment and human activities. Additionally, more scrutiny is warranted to explore the underlying mechanisms of the discerned relationships between climatic indices and river discharge and level, and to develop models effectively capturing the intricate interactions between climate, hydrology, and human endeavors in the region.
To conclude, this research provides valuable insights into the impacts of climate change on hydrological processes in the study vicinity and underscores the necessity for effective water management strategies that are sensitive to climate change. However, due to data constraints and the requirement for further research to dissect the complex interactions between climate, hydrology, and human activities in the region, these findings should be construed with circumspection.

5.3. Study Limitations and Future Research Recommendations

While this study provides valuable insights, it comes with the caveat of potential data inconsistencies, primarily due to irregular data recordings and malfunctioning instruments. As such, some stations with inconsistent record-keeping practices had to be excluded. The limited number of hydrological stations due to technical and natural obstacles also posed challenges. Future studies are recommended to enhance data collection methods, expand hydrological station networks, and further investigate the intricate relationships between climate change, hydrology, and agriculture in the region. This could lead to the development of more targeted and effective adaptation and mitigation strategies.

Author Contributions

Conceptualization, A.E., K.Z. and K.R.; methodology, A.E., K.Z. and K.R.; software, A.E., K.Z. and K.R.; validation, A.E., K.Z. and K.R.; formal analysis, A.E., K.Z. and K.R.; investigation, A.E., K.Z. and K.R.; resources, L.D.D. and B.N.Y.; data curation, L.D.D. and B.N.Y.; writing—original draft preparation, A.E., K.Z. and K.R.; writing—review and editing, K.Z. and K.R.; visualization, L.D.D. and B.N.Y.; supervision, L.D.D. and B.N.Y.; project administration, L.D.D. and B.N.Y.; funding acquisition, L.D.D. and B.N.Y. All authors have read and agreed to the published version of the manuscript.

Funding

This research received no external funding.

Data Availability Statement

Data developed in this study will be made available on request to the corresponding authors.

Acknowledgments

This research was supported by the Hungarian University of Agriculture and Life Sciences and the Doctoral School of Economic and Regional Sciences (MATE), Hungary.

Conflicts of Interest

The authors declare no conflict of interest.

References

  1. Jonek-Kowalska, I. Assessing the energy security of European countries in the resource and economic context. Oeconomia Copernic. 2022, 13, 301–334. [Google Scholar] [CrossRef]
  2. Kowalska, A.; Bieniek, M. Meeting the European green deal objective of expanding organic farming. Equilibrium. Q. J. Econ. Econ. Policy 2022, 17, 607–633. [Google Scholar] [CrossRef]
  3. Zheng, M.; Feng, G.-F.; Chang, C.-P. Is green finance capable of promoting renewable energy technology? Empirical investigation for 64 economies worldwide. Oeconomia Copernic. 2023, 14, 483–510. [Google Scholar] [CrossRef]
  4. Mekonnen, H.D.; Songcai, Y. Assessment of Climate Change Impacts on River Flow Regimes in the Upstream of Awash Basin, Ethiopia: Based on IPCC Fifth Assessment Report (AR5). Clim. Change Scenar. Hydrol. 2020, 7, 98. [Google Scholar]
  5. Paul, R.M.P.; Rosane, B.L.C.; Tereza, C.G.; Cláudia, P.W.C.; Renata, G.T.; Adayana, M.Q.M.; Ana, C.F.X. Effects of Climate Change on Hydrology in the Most Relevant Mining Basin in the Eastern Legal Amazon. Water 2022, 14, 1416. [Google Scholar]
  6. Roudier, P.; Ducharne, A.; Feyen, L. Climate change impacts on runoff in West Africa: A review. Hydrol. Earth Syst. Sci. 2014, 18, 2789–2801. [Google Scholar] [CrossRef]
  7. Ümit, Y.; Cüneyt, G.; Barı¸ S., Ö.; Michael, R.; Seifeddine, J. Modelling of the Discharge Response to Climate Change under RCP8.5 Scenario in the Alata River Basin (Mersin, SE Turkey). Water 2021, 13, 483. [Google Scholar] [CrossRef]
  8. Abeyou, W.W.; Yihun, T.D.; Essayas, K.A.; Jaehak, J.; Anwar, A.A.; Thomas, G. Impact of Climate Change on Streamflow Hydrology in Headwater Catchments of the Upper Blue Nile Basin, Ethiopia. Water 2018, 10, 120. [Google Scholar] [CrossRef]
  9. Melkamu, M.; Zerihun, K. Review on Impacts of Climate Change on Watershed Hydrology. J. Environ. Earth Sci. 2018, 8, 91–99. [Google Scholar]
  10. Davidson, N.; Mariev, O.; Turkanova, S. Does income inequality matter for CO2 emissions in Russian regions? Equilibrium. Q. J. Econ. Econ. Policy 2021, 16, 533–551. [Google Scholar] [CrossRef]
  11. Li, Y.; Chen, B.M.; Wang, Z.; Peng, S. Effects of temperature change on water discharge, and sediment and nutrient loading in the lower Pearl River basin based on SWAT Modeling. Hydrol. Sci. J. 2011, 56, 68–83. [Google Scholar] [CrossRef]
  12. Ezra, A.; Martins, I.K.; Ikusemoran, M. Evaluation of Drought Pattern, Duration and Intensity in Northern Nigeria. Jalingo J. Soc. Manag. Sci. 2020, 2, 194. [Google Scholar]
  13. Ezra, A.; Umar, A.S.; Adebayo, A.A. Analysis of Agro-climatic condition in Taraba State and the Implication for Agricultural Development. Adamawa State Univ. J. Sci. Res. 2020, 8, 16–27. [Google Scholar]
  14. Adebayo, A.A.; Umar, A.S. Hydrology and Water Resources; Adebayo, A.A., Tukur, A.L., Eds.; Adamawa State in Maps; Geography Department, FUT, Yola & Paraclette Publishers: Yola, Nigeria, 2020; pp. 17–19. [Google Scholar]
  15. Olutoyin, F.; Adeyemi, O.; Oluwatola, A. Geospatial Analysis of Changes in Vegetation Cover over Nigeria. Bull. Geography. Phys. Geogr. Ser. 2017, 13, 17–27. [Google Scholar] [CrossRef]
  16. National Population Commission (NPC). Population Estimate of the Federal Republic of Nigeria, Abuja, Nigeria. In National Bureau of Statistics.; 2017. Available online: http://www.nigerianstat.gov.ng/ (accessed on 12 March 2023).
  17. Patterson, N.K.; Lane, B.A.; Sandoval-Solis, S.; Persad, G.G.; Ortiz-Partida, J.P. Projected effects of temperature and precipitation variability change on stream flow patterns using a functional flows approach. Earths Future 2022, 10, e2021EF002631. [Google Scholar] [CrossRef]
  18. Iloeje, N.P. A New Geography of Nigeria; New Revised Edition; Longman Nigeria PLC: Lagos, Nigeria, 2001; p. 200. [Google Scholar]
  19. Oyenuga, V.A. Agriculture in Nigeria; Food and Agriculture Organization of the United Nations (FAO): Rome, Italy, 1967; p. 308. [Google Scholar]
  20. Balogun, O. Nigeria Secondary School Atlas; Macmillan Publisher: Ibadan, Nigeria, 2000. [Google Scholar]
  21. Zemba, A.A.; Tukur, A.L.; Ezra, A. Basic Geographic Information on Local Government Area; Adebayo, A.A., Tukur, A.L., Zemba, A.A., Eds.; Adamawa State in Maps; Paraclete Publishers: Yola, Nigeria, 2020; pp. 6–17. [Google Scholar]
  22. Adebayo, A.A. Agro-climatic Classification of Adamawa State, Nigeria for Upland rice production. Niger. Geogr. J. N. Ser. 2000, 4, 83–97. [Google Scholar]
  23. Lobell, D.; Burke, M. On the use of statistical models to predict crop yield responses to climate change. Agric. For. Meteorol. 2010, 150, 1443–1452. [Google Scholar] [CrossRef]
  24. Shi, W.; Tao, F.; Zhang, Z. A review on statistical models for identifying climate contributions to crop yields. J. Geogr. Sci. 2013, 23, 567–576. [Google Scholar] [CrossRef]
  25. Haileyesus, B. Evaluation of Climate Change impacts on hydrology on selected catchments of Abbay Basin. Master’s Thesis, Addis Ababa University School of Post Graduate Studies, Addis Ababa, Ethiopia, 2011; pp. 60–67. [Google Scholar]
  26. Enete, I.C. Impacts of climate change on agricultural production in Enugu State, Nigeria. J. Earth Sci. Clim. Change 2014, 5, 234. [Google Scholar]
  27. Nur Khaliesah, A.M.; Nor Rohaizah, J.; Latifah Abd, M.; Mohd, H.R.; Zulfa, H.A.; Fasihah, M.Y. Application of Frequency Analysis on Peak River Discharge toward the Cumulative Floatable Litter Load at Log Boom Sungai Batu. MATEC Web Conf. 2019, 266, 02002. [Google Scholar]
  28. Marco, A.; Adriana, D.; Guillermo, J.A.; Fausto, A.C.; Ramesh, S.V.T.; Bartosz, K. Analysis of Streamflow Variability and Trends in the Meta River, Colombia. Water 2020, 12, 1451. [Google Scholar]
  29. Santosh, K.; Santosh, N.; Saurav, P.; Ted, G.; Ashok, K.S. Impacts of climate change on the flow of the transboundary Koshi River, with implications for local irrigation. Int. J. Water Resour. Dev. 2021, 37, 929–954. [Google Scholar] [CrossRef]
  30. Piet, V.; Robert, E.H. Wind Patterns, Evaporation, and Related Physical Variables in Lake Tanganyika, East Africa. J. Great Lakes Res. 2003, 29 (Suppl. 2), 48–61. [Google Scholar]
  31. Hossein, D.; Kathleen, S.; Ryan, M.T.; Tissa, I. Study of the effect of wind speed on evaporation from soil through integrated modeling of the atmospheric boundary layer and shallow subsurface. Water Resour. Res. 2014, 50, 661–680. [Google Scholar]
  32. Maskey, M.L.; Facincani, D.G.; Rallings, A.M.; Rheinheimer, D.E.; Medellín-Azuara, J.; Viers, J.H. Assessing Hydrological Alteration Caused by Climate Change and Reservoir Operations in the San Joaquin River Basin, California. Front. Environ. Sci. 2022, 10, 765426. [Google Scholar] [CrossRef]
  33. Junqiang, Y.; Yaning, C.; Xuefeng, G.; Yong, Z.; Jing, C.; Weiyi, M. Recent climate and hydrological changes in a mountain–basin system in Xinjiang, China. Earth Sci. Rev. 2022, 226, 103957. [Google Scholar]
  34. IPCC. Climate Change 2014: Synthesis Report. Contribution of Working Groups I, II and III to the Fifth Assessment Report of the Intergovernmental Panel on Climate Change; Pachauri, R.K., Meyer, L.A., Eds.; IPCC: Geneva, Switzerland, 2015. [Google Scholar]
  35. Mark, R.H.; Piret, P.; Evan, R.J. Global quantitative analyses of river discharge variability and hydrograph shape with respect to climate types. Earth Sci. Rev. 2020, 200, 102977. [Google Scholar]
  36. Paolo, T.; Giovanni, M.; Alessandro, P.; Maurizio, R. Hydrology of the Sirba River: Updating and Analysis of Discharge Time Series. Water 2019, 11, 156. [Google Scholar] [CrossRef]
  37. Anette, E.; Hannes, S.; Jens, G. Flow velocity and discharge measurement in rivers using terrestrial and UAV imagery. Hydrol. Earth Syst. Sci. 2019, 24, 1429–1445. [Google Scholar] [CrossRef]
  38. Huntington, T.G. CO2-induced suppression of transpiration cannot explain increased runoff. Hydrol. Process 2008, 22, 311–314. [Google Scholar] [CrossRef]
  39. Cheng, Y.; Zhu, K.; Zhou, Q.; El Archi, Y.; Kabil, M.; Remenyik, B.; Dávid, L.D. Tourism Ecological Efficiency and Sustainable Development in the Hanjiang River Basin: A Super-Efficiency Slacks-Based Measure Model Study. Sustainability 2023, 15, 6159. [Google Scholar] [CrossRef]
  40. Plokhikh, R.; Shokparova, D.; Fodor, G.; Berghauer, S.; Tóth, A.; Suymukhanov, U.; Zhakupova, A.; Varga, I.; Zhu, K.; Dávid, L.D. Towards Sustainable Pasture Agrolandscapes: A Landscape-Ecological-Indicative Approach to Environmental Audits and Impact Assessments. Sustainability 2023, 15, 6913. [Google Scholar] [CrossRef]
  41. Ghorbani, A.; Zhu, K.; Mousazadeh, H.; Almani, F.A.; Zangiabadi, A.; Pireh, M.; Dávid, L.D. Sustainable Behaviors Conceptualization for Forest Adventures Tours: The Case of Cloud Ocean Sites in Hyrcanian Forests Listed as UNESCO’s World Heritage Property. Forests 2023, 14, 1034. [Google Scholar] [CrossRef]
Figure 1. Hydrological stations overlaid on the mean spatial climatic maps. Source: UBRBDA (2022).
Climate 11 00198 g001
Figure 2. Flowchart of research design.
Climate 11 00198 g002
Figure 3. Annual rainfall trend. Source: computed from wind records across hydrological stations in the area, 2022.
Climate 11 00198 g003
Figure 4. Annual relative humidity trend. Source: computed from wind records across hydrological stations in the area, 2022.
Climate 11 00198 g004
Figure 5. Annual maximum temperature trend. Source: computed from wind records across hydrological stations in the area, 2022.
Climate 11 00198 g005
Figure 6. Annual minimum temperature trend. Source: computed from wind records across hydrological stations in the area, 2022.
Climate 11 00198 g006
Figure 7. Annual wind speed trend. Source: computed from wind records across hydrological stations in the area, 2022.
Climate 11 00198 g007
Figure 8. Mean monthly water level (m). Source: computed from water level records across the hydrological stations in the area, 2022.
Climate 11 00198 g008
Figure 9. Mean monthly water discharge (mm). Source: computed from water level records across the hydrological stations in the area, 2022.
Climate 11 00198 g009
Figure 10. Trend of mean monthly water discharge. Source: computed from water discharge records in the area, 2022.
Climate 11 00198 g010
Figure 11. Trend of mean monthly water level. Source: computed from water level records across the hydrological stations in the area, 2022.
Climate 11 00198 g011
Table 1. Data types and sources.
Data TypeData SourceUnits
RainfallNiMet, UBRBDAmm
Relative humidityNiMet, UBRBDA%
Maximum temperatureNiMet, UBRBDA°C
Minimum temperatureNiMet, UBRBDA°C
Water dischargeUBRBDAm3/s
Water levelUBRBDAm
Table 2. Relationship between climatic and hydrological indices.
DischargeWater Level
Rainfall0.326 **0.367 **
Relative humidity0.342 **0.412 **
Minimum temperature0.111 **0.105 **
Maximum temperature−0.312 **−0.391 **
Wind speed−0.364 **−0.324 **
** Correlation is significant at the 0.01 level. Source: calculated from water discharge and climatic variables, 2022.
Table 3. Stepwise regression results between water discharge and climatic variables.
PredictorsCoefSE CoefTR2 (%)F Value
Constant1386.03887.68515.807 **
Wind speed−384.81428.837−13.345 **13.2192.129 **
Rainfall2.4320.20911.645 **21.7174.142 **
** Significant at the 0.01 level. Water discharge = 1386.038 − 384.814 wind speed + 2.432 rainfall. Source: Calculated from water discharge and climatic variables, 2022.
Table 4. Stepwise regression results between water level and climatic variables.
PredictorsCoefSE CoefTR2 (%)F Value
Constant2.9590.17916.496 **
Relative humidity0.0130.0026.086 **17.0514.315 **
Wind speed−0.4610.041−11.154 **20.3320.410 **
Rainfall0.0020.0005.363 **21.2225.551 **
** Significant at the 0.01 level. Water level = 2.959 + 0.013 relative humidity—0.461 wind speed + 0.002 rainfall. Source: Calculated from water discharge and climatic variables, 2022.
Disclaimer/Publisher’s Note: The statements, opinions and data contained in all publications are solely those of the individual author(s) and contributor(s) and not of MDPI and/or the editor(s). MDPI and/or the editor(s) disclaim responsibility for any injury to people or property resulting from any ideas, methods, instructions or products referred to in the content.

