Article

Stalagmite-Inferred Climate in the Western Mediterranean during the Roman Warm Period

1
High-Precision Mass Spectrometry and Environment Change Laboratory (HISPEC), Department of Geosciences, National Taiwan University, Taipei 10617, Taiwan
2
Research Center for Future Earth, National Taiwan University, Taipei 10617, Taiwan
3
CEPAM—Cultures et Environnements Préhistoire, Antiquité, Moyen Âge, CNRS, Université Côte d’Azur, 06300 Nice, France
4
Laboratoire Géoazur, OCA, CNRS, IRD, Université Côte d’Azur, 06560 Valbonne, France
5
HNHP, UMR 7194, MNHN, CNRS, UPMC, UPVD, Sorbonne Universités, 75013 Paris, France
6
Musée de Préhistoire, 06690 Tourrette-Levens, France
7
Department of Earth Sciences, National Taiwan Normal University, Taipei 11677, Taiwan
8
Department of Civilizations and Forms of Knowledge, University of Pisa, Via dei Mille 19, 56126 Pisa, Italy
9
Archaeological Superintendency of Liguria, Via Balbi 10, 16126 Genova, Italy
10
Toirano Cave, Piazzale D. Maineri 1, 17055 Toirano, Italy
*
Author to whom correspondence should be addressed.
Climate 2022, 10(7), 93; https://doi.org/10.3390/cli10070093
Submission received: 2 June 2022 / Revised: 20 June 2022 / Accepted: 22 June 2022 / Published: 23 June 2022

Abstract

:
The circum-Mediterranean region is the cradle of ancient civilizations that had their roots in the Holocene. Climate change has been considered a key element that contributed to their rise or fall. The Roman Warm Period (RWP), 200 B.C. to 400 A.D., was the warmest period in Europe during the last two thousand years. Hydroclimatic change at the end of the RWP has been suggested as a possible influence on the stability of the Roman political regime and the eventual collapse of the Roman Empire in 476 A.D. A lack of precise proxy records hampers our understanding of hydroclimatic variability over the RWP. Here we present a stalagmite-based climate record from 550 ± 10 B.C. to 950 ± 7 A.D. (2σ) from northern Italy, which reveals a climatic trend of warming and increased humidity throughout the RWP. By comparison with other proxy records in Europe and the circum-Mediterranean region, we argue that the warm, humid climate in southern Europe could be linked to the multi-centennial warming of the Mediterranean Sea. Our record further suggests a century-long rapid drying trend from the early-4th to early-5th century, followed by a 100-year-long drought event, which could have influenced the fall of the Roman Empire.

1. Introduction

Climate change has widely affected society, ecosystems, and agriculture [1]. Today, the circum-Mediterranean region, with over 500 million inhabitants, has been threatened by severe drought and extreme climate, including floods, heat waves, and cold spells [2,3,4]. Such climate changes have been proposed as significant factors in the stability of ancient civilizations [5,6,7]. For example, the well-known 4.2-k dry event (4.2 thousand years ago) may have induced the collapse of the Old Kingdom and Akkadian Empire [8,9]. Increasing climate variability at ~0 A.D. has been suggested as a trigger of the Celtic Expansion and Roman Conquest [6]. Human societies have been forced to adapt to severe and unstable hydroclimatic conditions, with consequent climate-driven famine, warfare, diseases and/or political collapse [10]. Complete and detailed paleoclimate records provide a means to investigate human responses to past climate change.
The Roman warm period (RWP), from ~200 B.C. to 400 A.D, is one of the warmest periods in the late Holocene [11,12]. This period was characterized by a warm, humid climate across Europe [13,14,15,16,17,18]. One recent study [19] even suggested that the average temperature in the RWP was 2 °C higher than the average temperature over the last century in the western Mediterranean. Although the RWP could be a regional warming event and limited in Europe and the North Atlantic region, to understand the RWP is essential for ancient European societal changes. Hampered by a lack of precisely dated records, the detailed climate variability in the circum-Mediterranean realm in the RWP remains unclear.
Here we present a well-dated stalagmite-based record of climate from the Bàsura cave of northern Italy, from 2500 to 500 years ago (yr BP, relative to 1950 A.D.). We used stalagmite carbon isotopes as a climate proxy and built an absolute age model with U-Th dating techniques. Our records show that precipitation in this region progressively increased over the RWP. A century-long shift to a dryer climate at the end of the RWP possibly contributed to the collapse of the Roman Empire in 476 A.D.

2. Material and Methods

2.1. Cave and Regional Settings

Bàsura cave (44°08′ N, 8°12′ E, Figure 1) is located in Toirano, northern Italy, 186 m above sea level [20] and 4.3 km from the coast of the Ligurian Sea. The cave has one natural entrance and another artificial tunnel connected to Santa Lucia cave. It features an 890 m-long passage with 10–20 m thick cave ceiling. Genoa (44°42′ N, 8°85′ E), 60 km northeast of the cave, has a large regional meteorological station. The station is only several km far from the coast and could share a similar climate feature with the cave, supported by high degrees of similarity of Genoa precipitation data and regional precipitation patterns (Supplementary Materials, Figure S1). Local observatory temperature and precipitation data used in this study were from this station. The region features a Mediterranean-type climate, with hot–dry summers and wet–temperate winters. Observational data of the Global Network of Isotopes in Precipitation-International Atomic Energy Agency (GNIP-IAEA) during 1961–1995 A.D. from the Genoa station show an annual temperature of 14.5 ± 1.2 °C (n = 29, 1σ) and an annual rainfall of 886 ± 106 mm (n = 35, 1σ). More than 70% of the precipitation is contributed during the rainy season between September and February. The average temperature in the Bàsura cave is 15.6 °C, and the relative humidity is 97–100% [21].

2.2. Samples, U-Th Dating and Isotope Measurements

One candle-shaped aragonitic stalagmite, BA14-1, was collected from Bàsura cave. This stalagmite is 160 mm in length with no visible hiatuses. Detailed sample figures (Supplementary Materials, Figure S2A) and scanning electron microscope images are presented in Hu et al. (2022) [21]. A depth interval at 6.5–80.5 mm from the top was used in this study. About 0.02–0.05 g subsamples from thirty-five layers were U-Th dated. Subsamples were drilled for U-Th chemistry, which was performed on class-100 benches in the class-10000 clean room at the High-Precision Mass Spectrometry and Environment Change Laboratory (HISPEC), Department of Geosciences, National Taiwan University (NTU) [29,30]. U and Th isotopic compositions were measured on a multiple collector inductively coupled plasma mass spectrometer, Thermo-Fisher Neptune, linked with a dry sample introduction system, Cetec Aridus [31]. An assumed initial atomic 230Th/232Th ratio of 4 ± 2 × 10⁻⁶ was used for correcting U-Th ages. Reported uncertainties in the U-Th isotope data and calculated ages are given at a two-sigma (2σ) uncertainty level, or two standard deviations from the mean (2σm). Based on the StalAge depth-age model (Supplementary Materials, Figure S2B) [21,32], this segment covers a time period from 550 ± 10 B.C. to 950 ± 7 A.D., including the RWP from 200 B.C. to 400 A.D.
A total of 286 powdered subsamples, 50–100 μg each, were drilled from BA14-1 in intervals of 6.5–80.5 mm from the top for stable isotope analyses. Measurements of stable carbon isotopes were performed on a Micromass IsoPrime IRMS at the Stable Isotope Laboratory, Department of Earth Sciences, National Taiwan Normal University. The stable isotope data are reported in per mil (‰), relative to Vienna Pee Dee Belemnite (VPDB) and calibrated with two international standards, the National Bureau of Standards 19 (NBS-19) and IAEA-CO-1. The one-sigma external precision (1σ) for the δ13C analyses is ± 0.06‰ based on long-term measurements of NBS-19, IAEA-CO-1, and one in-house marble standard. The measured value for IAEA-CO-1 is 2.45 ± 0.06‰, consistent with the certificated value of 2.49 ± 0.03‰. The measured value for NBS-19 is 1.94 ± 0.06‰, consistent with the certificated value of 1.95‰.

3. Results and Discussion

3.1. Carbon Isotope Results

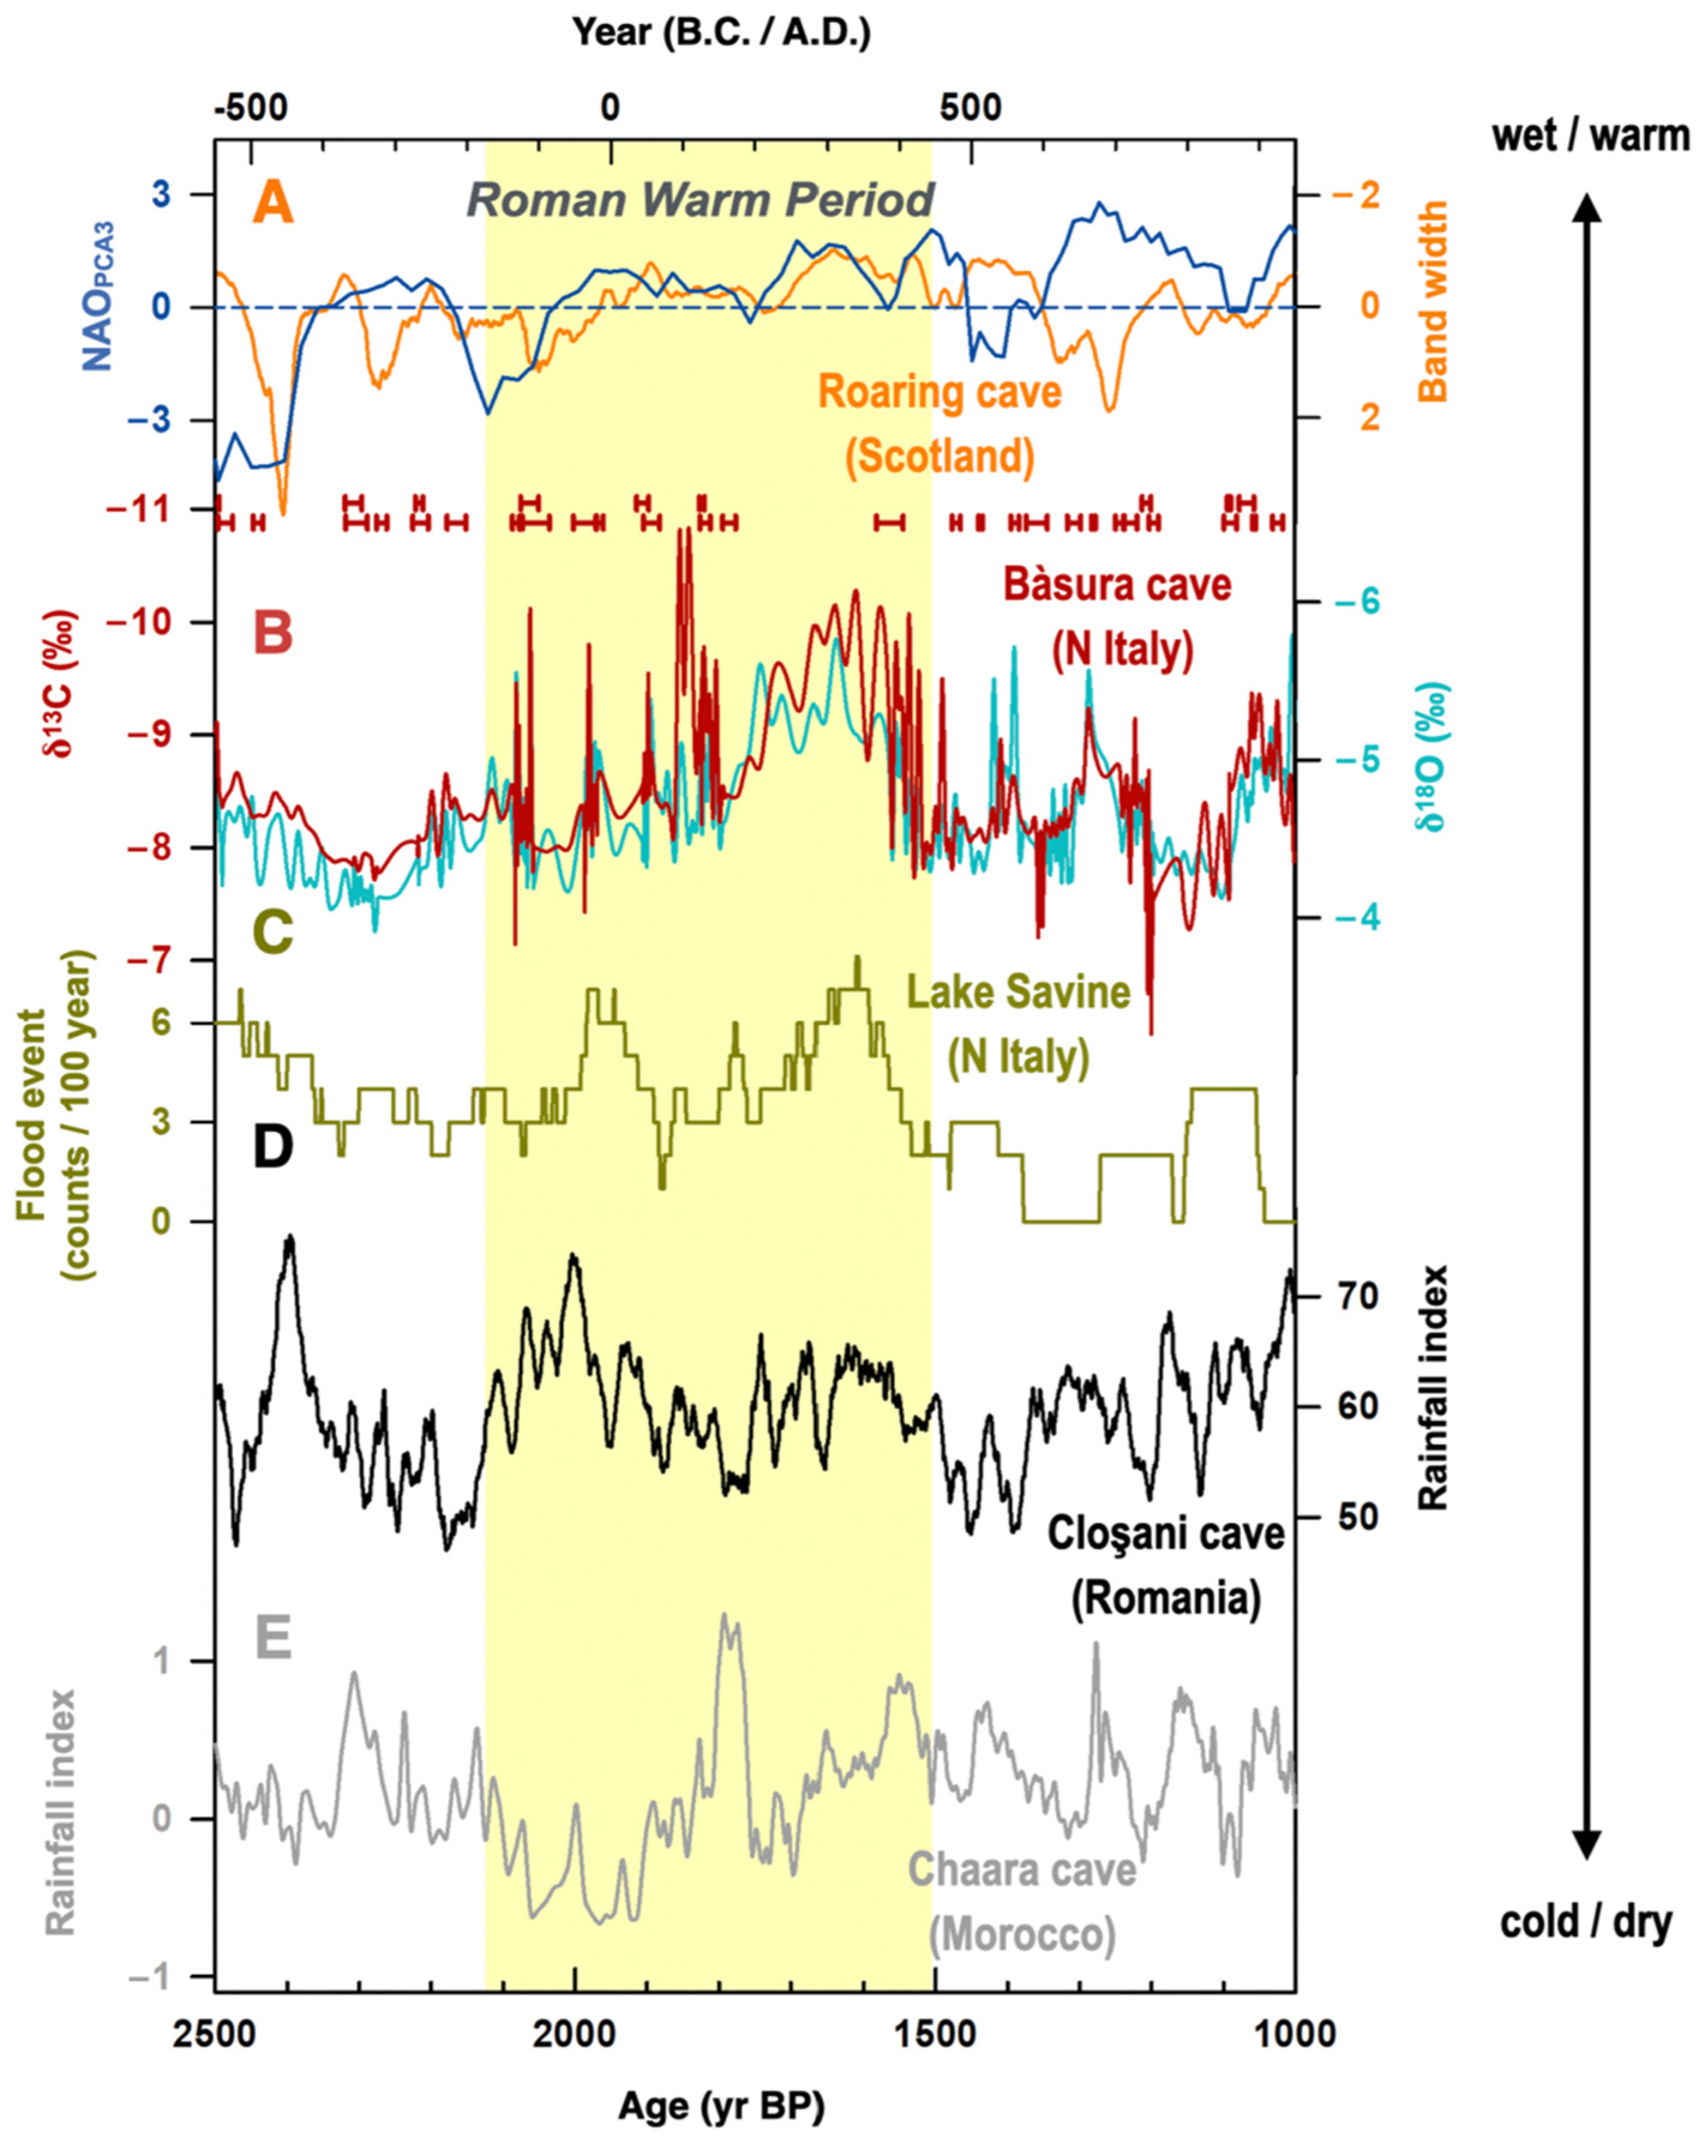
The δ13C results from stalagmite BA14-1 are given in Supplementary Materials, Table S1. This record (Figure 2B), from 550 ± 10 B.C. to 950 ± 7 A.D. (2500 to 1000 yr BP), varies from −11 to −5‰ (Figure 2B). It features stable δ13C values hovering around −9 to −7‰ at 550–200 B.C. and a multi-centennial decreasing trend from −8 to −10‰, between the onset of the RWP in 200 B.C. and its end in 400 A.D. A 100 yr interval featuring a rapid δ13C increase, from −10 to −8‰, occurred from 341 ± 14 to 432 ± 17 A.D. This was followed by a high-δ13C period that persisted until 526 ± 4 A.D., and subsequent centennial-scale δ13C oscillations ranging from −6 to −9‰ were observed after that (Figure 2B).

3.2. Interpretation of Carbon Isotope Variations

The Hendy test [34] on BA14-1 shows two-sigma variability of ±0.08–0.21‰ in δ18O and no correlation between δ18O and δ13C for coeval subsamples of the same growth layers, suggesting negligible kinetic isotope fractionation [21]. Further duplication tests [35] also indicated that this stalagmite was deposited with insignificant kinetic isotope effects so that the δ13C values reflect environmental factors [21]. When stalagmites form under or close to isotopic equilibrium, the carbonate δ13C mainly reflects the isotopic composition of soil CO2, which is inherited from the atmosphere and through soil respiration [36]. The variation of stalagmite δ13C could hence be controlled by bedrock, vegetation productivity, soil activity, and cave pCO2 [37,38,39]. During carbonate precipitation, temperature-controlled water-calcite fractionation may also affect the δ13C values preserved in the stalagmites [37].
Various vegetation types modulate soil CO2 isotopic compositions via different photosynthesis pathways [40]. For example, previous studies suggest that C3 and C4 plants may lead to δ13C values in cave calcite in the range of −6 to −14‰ and +2 to −6‰, respectively [39,40,41]. Considering the reported calcite-aragonite offsets of 1.1–2.3‰ [38], the values of aragonitic BA14-1 δ13C ranging from −6 to −11‰, are equivalent to calcitic carbon isotopic compositions of ~−7 to −13‰, well within the predicted C3-type carbon δ13C range (−6 to −14‰). This result agrees with previous studies, which suggest that C3-type plants dominate the vegetation surrounding Bàsura cave in modern times [42]. However, vegetation changes are not likely to control BA14-1 δ13C variations during the late Holocene since this region has been persistently dominated by C3-type plants, even in glacial times [21,43,44].
Under warm or humid conditions, dense vegetation coverage atop the cave and enhanced soil biological activity could lead to negative values in soil δ13C [45]. Meanwhile, increased precipitation could enhance the drip water and infiltration rates, with a reduction in drip water CO2 degassing and more negative speleothem δ13C values [37,39,42], and vice versa. Prior carbonate precipitation (PCP) [46,47] is an additional factor affecting stalagmite δ13C values. PCP is defined as the carbonate precipitation from seepage water before it drips into the cave. The process involves CO2 degassing along the percolation flow path, which favors carbonate precipitation with light carbon isotopes in the cave ceiling, leading to relatively high δ13C values in the remaining water body [39,46,47]. Under a dry (wet) condition, long (short) infiltration residence times enable (depress) PCP, enriching (depleting) the aqueous solution and stalagmite in 13C.
For the reasons above, a warm and humid climate could promote soil activity and vegetation cover, reduce PCP in the epikarst, and decrease stalagmite δ13C values in the cave. The negative (positive) BA14-1 δ13C value could hence register a humid and warm (cold and dry) climate in this region. This argument can be supported by the covariation of BA14-1 δ18O and δ13C time series (Figure 2B). Stalagmite δ18O at the Bàsura cave is dominated by both the amount effect and the source effect [21]. The amount effect describes the negative correlation between δ18O values and precipitation amount. The source effect means that more (less) moisture sources from the remote Atlantic Ocean with low δ18O values, compared to the regional Mediterranean Sea, could reduce (elevate) stalagmite δ18O. Hence, a negative δ18O shift reflects strong precipitation or dominant Atlantic-sourced moisture carried by the westerly winds. In the Mediterranean region, the control of δ13C and δ18O covariation has been suggested to be mainly hydroclimatic, e.g., [42,44,48] since high precipitation can decrease δ13C by promoting soil activity and vegetation respiration, and δ18O by the amount effect. A degree of similarity (r = 0.53, n = 286, p < 0.05) between BA14-1 δ13C and δ18O data supports that stalagmite δ13C variations document precipitation changes, with high (low) precipitation corresponding to low (high) δ13C values.

3.3. Hydroclimate Changes during the Roman Warm Period

From the onset of the RWP at 200 B.C., both BA14-1 δ13C and δ18O express a multi-centennial decreasing trend until 350 A.D. This trend indicates increasing precipitation during this 550 yr interval in northern Italy (Figure 2B). It is similar to the reduced growth rates (bandwidth) recorded in Scotland stalagmites (Figure 2A) [22], which suggests a shift towards a more humid climate. Flood event records from Lake Savine (Figure 2C; [23]), northern Italy, display two intervals with over six flooding events per 100 years centered at 50 B.C. and 350 A.D. (Figure 2C) [23]. The two periods with intense flooding events are in accord with high stalagmite-based precipitation index values in Romania (Figure 2D) [24], which also shows periods with relatively high precipitation at 50 B.C. and 350 A.D. While at the first half of the RWP, from 200 B.C. to 100 A.D., BA14-1 δ13C and δ18O do not suggest strong precipitation as the records from Lake Savine (Figure 2C) [23] and Romania (Figure 2D) [24] do, at the second half of the RWP at 100–400 A.D., all records (Figure 2B–D) reveal that southern Europe could have experienced a wet climate, especially at the late stage of the RWP centered at 350 A.D. The overall 550 yr humid pattern from 200 B.C. to 350 A.D. can also be supported by records from central Italy (Supplementary Materials, Figure S3B,C) [16,18] and the Dead Sea (Figure S3D) [17]. The stalagmite δ13C from central Italy [16] shows a negative excursion during the whole RWP (Figure S3B), suggesting a warm and humid climate. The composite lake level records (Figure S3C) reveal a highstand at the second-half of the RWP at ~350 A.D. [18]. The lake level record from the Dead Sea suggested relatively high lake levels during the RWP compared to those in pre-RWP. Combined with our record (Figure S3A), this evidence suggests that the RWP featured a humid climate in the Mediterranean realm.
North Atlantic Oscillation (NAO) variation has been widely used to understand precipitation changes over Europe on different geological time scales, e.g., [28,49]. At a positive (negative) phase of the NAO, increased (decreased) pressure contrast between the Azores High and the Icelandic Low results in poleward (equatorial) migrations of the westerlies over the North Atlantic, bringing in strong precipitation in northern Europe (southern Europe and the Mediterranean region) [49]. However, the reconstructed NAO index [22,33] suggests that the NAO shifted from a negative state to a positive condition during the RWP (Figure 1A). The reconstructed NAO index increased from −3 at the beginning of the RWP at 200 B.C., to 0 at 100 B.C.
From 100 B.C. to the end of the RWP at 400 A.D., the reconstructed NAO index, fluctuating between 0 and 2, features two peaks of 1 and 2 at 0 and 300 A.D., respectively (Figure 2A). Most of the RWP was dominated by an NAO-positive phase. A positive NAO-state, associated with enhanced Azores High and Icelandic Low, should force poleward shifts of the westerlies and result in drought conditions in southern Europe. Hence, the humid conditions reflected by Bàsura stalagmite records and other archives in southern Europe (Figure 2B–D) cannot be attributed to the NAO phase.
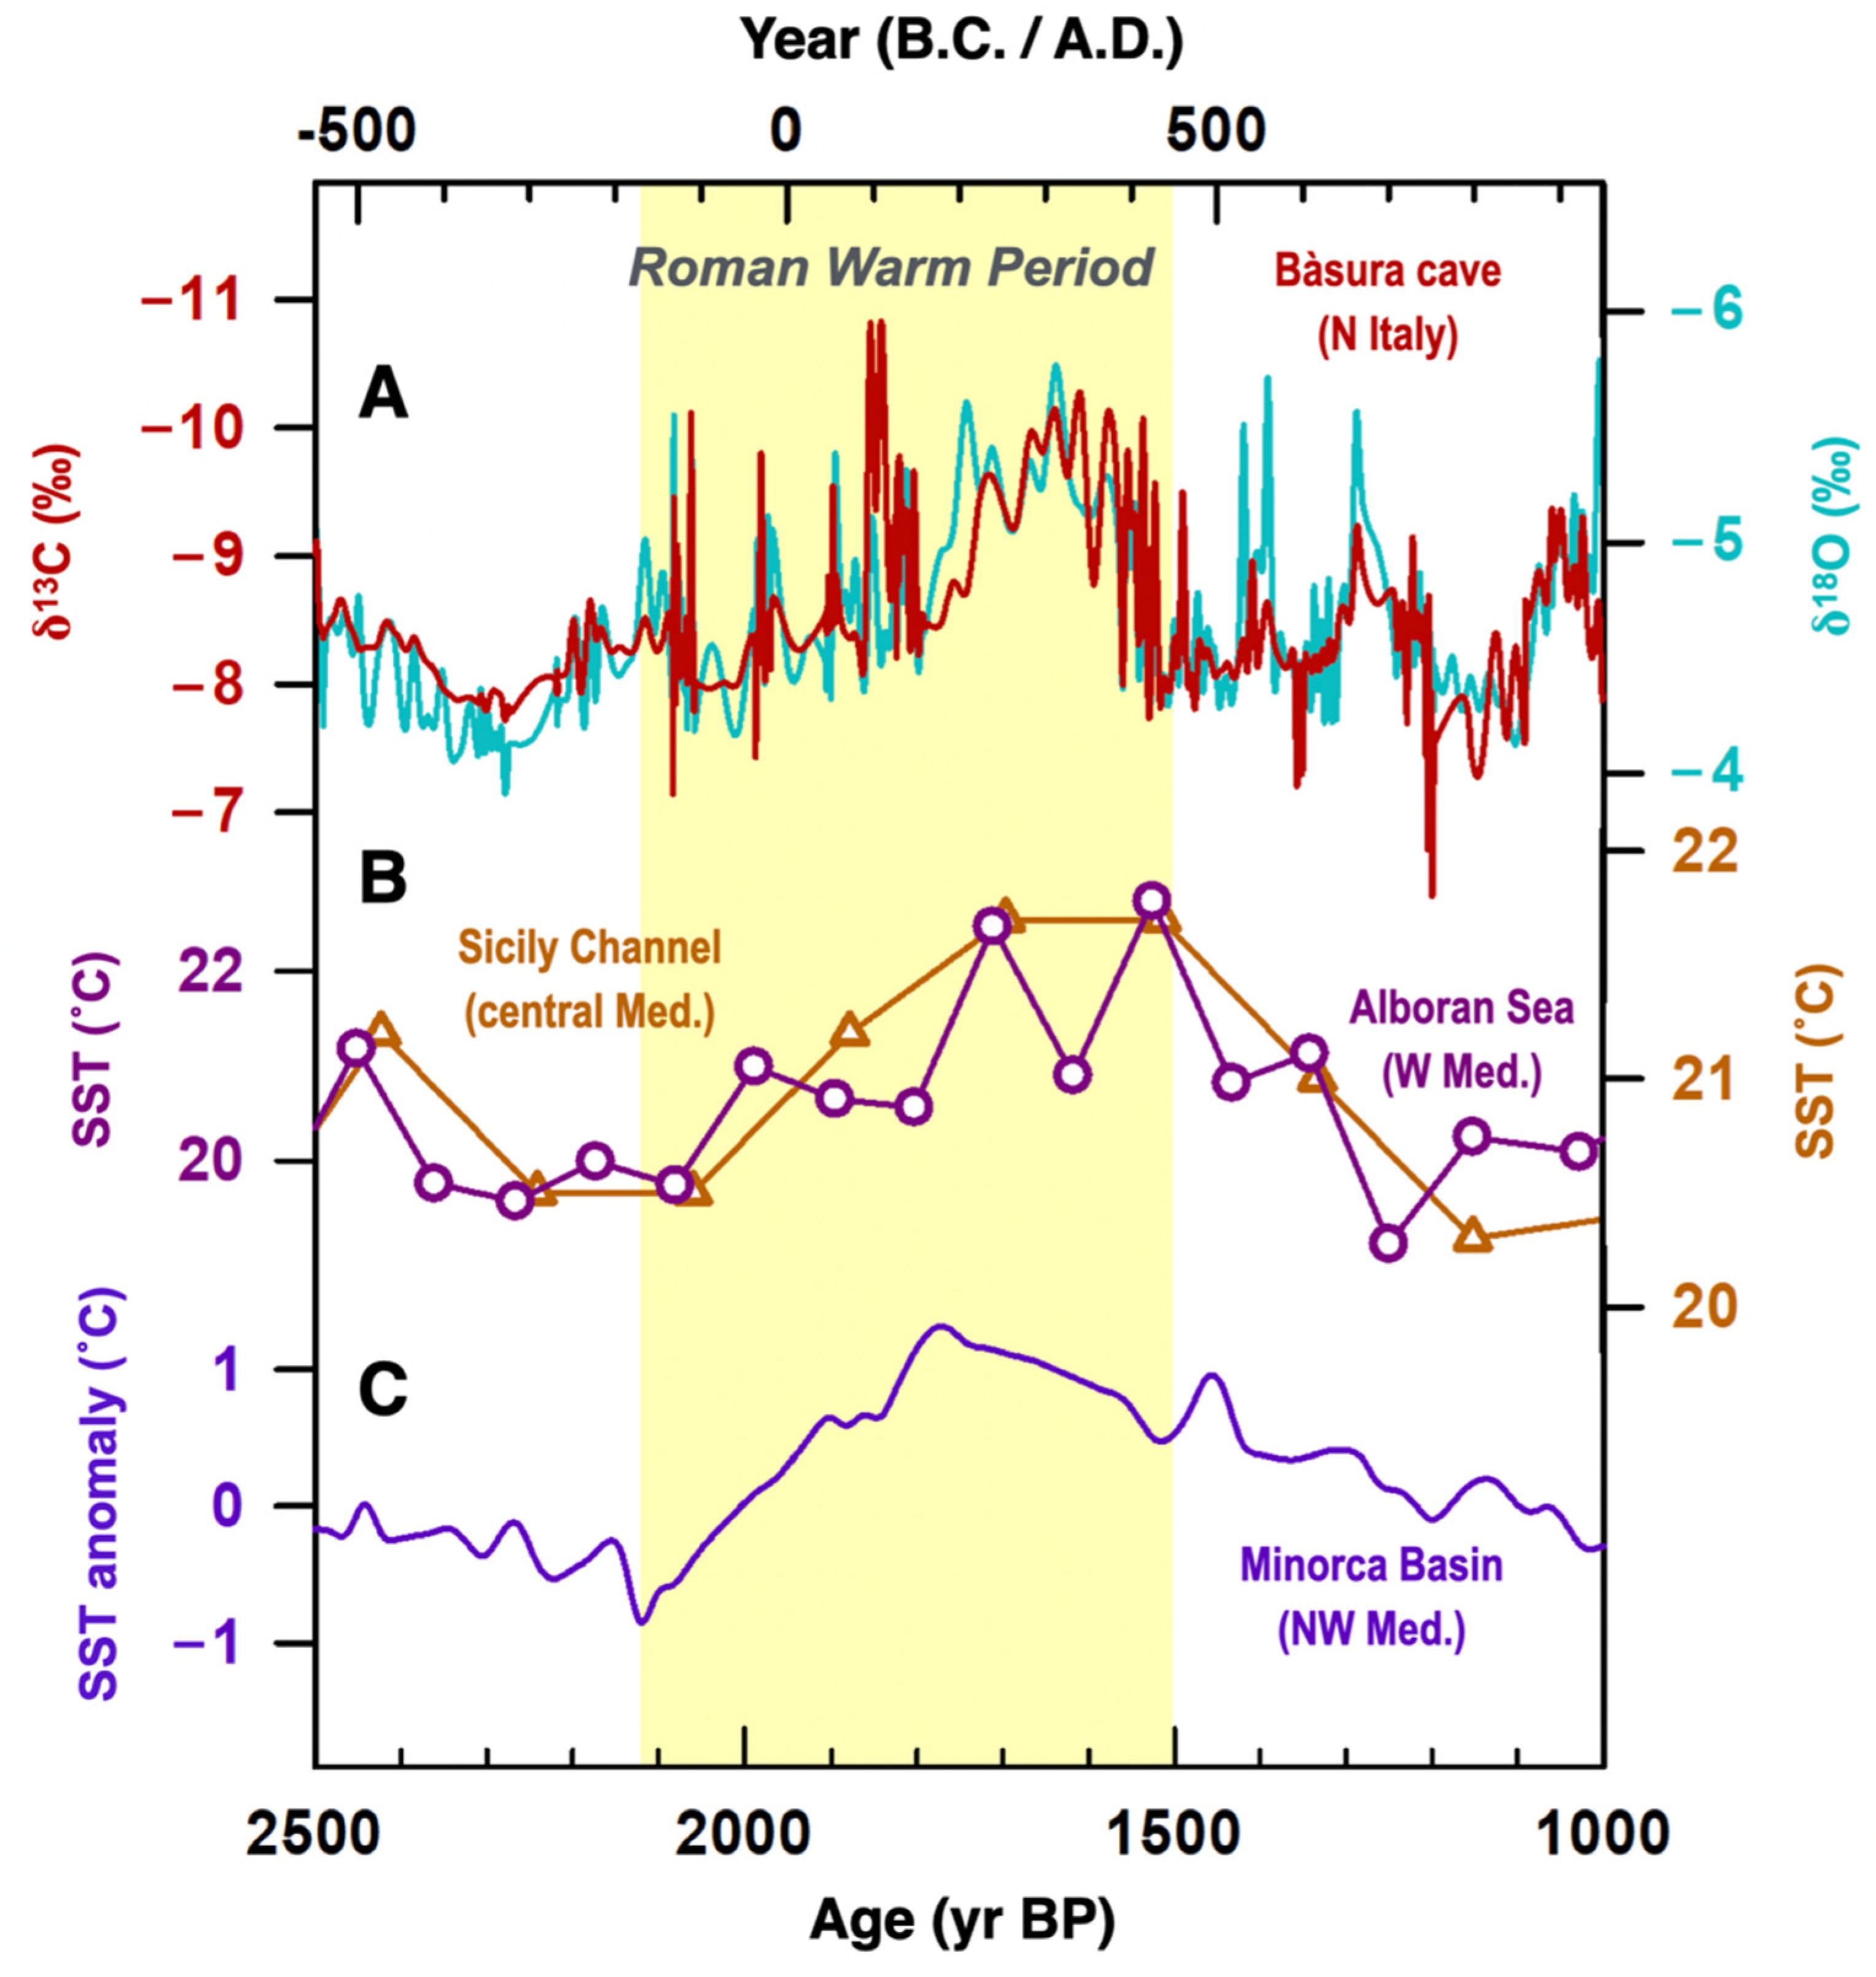
Bàsura stalagmite-inferred precipitation increases in southern Europe during the RWP (Figure 3A) coincide with multi-centennial warming registered in sea surface temperature (SST) records in the Mediterranean Sea (Figure 3B,C). Sediment SST records from the Alboran Sea in the western Mediterranean (TTR17-434G, Figure 3B; [25]), the Sicily Channel of the central Mediterranean (SW104-ND11; Figure 3B; [19]) and the Minorca Basin from the northwestern Mediterranean (MINMC06 and HER-MC-MR3; Figure 3C; [27]) all suggest a clear warming trend from 200 B.C. to 200 A.D. and a plateau at 200–400 A.D. This 200-yr high SST in the Mediterranean Sea could increase the land-sea temperature contrast in autumn and winter, and enhance frontal rains along the Mediterranean borderland [50,51]. The warm Mediterranean Sea could also promote Mediterranean-origin cyclogenesis [19,52], which brings strong precipitation over northern Italy. Even in northern Africa, the stalagmite-based rainfall index from Morocco shows that regional precipitation increased from 0 to 400 A.D. (Figure 2E; [28), consistent with the observations at Bàsura (Figure 2B). Accordingly, centennial-scale humid conditions in southern Europe could be attributed to warm Mediterranean seawater, instead of the NAO state.
Rapid positive δ13C and δ18O shifts in the precisely dated Bàsura records (Figure 2B) reveal a dramatic drop from 341 ± 14 to 432 ± 17 A.D. This 100-yr precipitation decrease is also documented at Lake Savine (Figure 2C) and in Romania (Figure 2D). The agreement indicates a large-scale century-long hydroclimate shift at the end of the RWP. Bàsura isotopic records also show a centennial-scale drought lasting from 432 ± 17 to 526 ± 4 A.D. The drying trend from 341 ± 14 to 432 ± 17 A.D. and the following 100-yr drought might be a factor that contributed to the collapse of the Roman Empire in 476 A.D [6,13].

4. Conclusions

We present a 1500 yr stalagmite proxy hydroclimate record from Bàsura cave, northern Italy from 550 B.C. to 950 A.D., covering the RWP from 200 B.C. to 400 A.D. Our results show that during the RWP, southern Europe experienced a warm and humid climate. A concurrent warming trend observed in Mediterranean SST records suggests that an increased land-sea temperature contrast and increasing cyclones could be possible factors contributing to multi-centennial wet conditions in southern Europe during the RWP. A succession involving a rapid 100-yr drying shift from 341 ± 14 to 432 ± 17 A.D. and a 100-yr drought event from 432 ± 17 to 526 ± 4 A.D. are observed in the Bàsura stalagmite proxy record and other natural archives. A dramatic hydroclimate change from wet to dry conditions from 341 ± 14 to 432 ± 17 A.D. may have influenced the collapse of the Roman Empire in 476 A.D.

Supplementary Materials

The following are available online at https://www.mdpi.com/article/10.3390/cli10070093/s1, Figure S1: Correlation map. Correlation analysis between Genoa precipitation data and regional precipitation patterns during rainy seasons (September–February) in 1950–2008 A.D. (Data from E-OBS 25.0e, [53]). Color-shades indicate the correlation coefficients (p < 0.1), Figure S2: Photograph of stalagmite BA14-1 and age model. (A) Photograph of stalagmite BA14-1. The brown rectangle marks the section used in this study (6.5–80.5 mm from the top). The blue and red lines indicate the position for isotope analysis, U-Th dates. (B) StalAge-based age model [32] of BA14-1 during 6.5–80.5 mm from the top. The red line indicates the mean age and black lines denote 2-sigma age limits, Figure S3: Comparison among Mediterranean proxy records. (A) Bàsura δ13C (red) and δ18O (tiffany blue). (B) δ13C records from Corchia cave, central Italy [18]. (C) composite lake level records from central Italy [16]. (D) Dead Sea level [17]. The yellow bar denotes the Roman Warm Period, Table S1: Data of stable isotopes of BA14-1.

Author Contributions

C.-C.S. directed this project; H.-M.H. and C.-C.S. designed research; C.-C.S., H.-M.H., E.S., M.Z., V.M. and P.V. conducted field surveys and collected speleothems; H.-M.H. and H.-S.M. analyzed data; H.-M.H. and C.-C.S. prepared the draft and interpretations. All authors have read and agreed to the published version of the manuscript.

Funding

This research was funded by Science Vanguard Research Program of the Ministry of Science and Technology, Taiwan, ROC [110-2123-M-002-009], the Higher Education Sprout Project of the Ministry of Education, Taiwan, ROC [111L901001 and 110L8907], and the National Taiwan University [109L8926].

Institutional Review Board Statement

Not applicable.

Informed Consent Statement

Not applicable.

Data Availability Statement

Isotope data can be found at the Zenodo repository (10.5281/zenodo.6669426).

Acknowledgments

We thank G.S. Burr of the Research Center for Future Earth, National Taiwan University, for his constructive suggestions. Constructive and comprehensive reviews by two anonymous reviewers significantly improved this manuscript.

Conflicts of Interest

Authors declare no competing interest.

References

  1. Giorgi, F. Climate change hot-spots. Geophys. Res. Lett. 2006, 33, L08707. [Google Scholar] [CrossRef]
  2. Screen, J.A.; Simmonds, I. Caution needed when linking weather extremes to amplified planetary waves. Proc. Natl. Acad. Sci. USA 2013, 110, E2327. [Google Scholar] [CrossRef] [Green Version]
  3. Mahlstein, I.; Daniel, J.S.; Solomon, S. Pace of shifts in climate regions increases with global temperature. Nat. Clim. Chang. 2013, 3, 739–743. [Google Scholar] [CrossRef]
  4. Stadtherr, L.; Coumou, D.; Petoukhov, V.; Petri, S.; Rahmstorf, S. Record Balkan floods of 2014 linked to planetary wave resonance. Sci. Adv. 2016, 2, 012009. [Google Scholar] [CrossRef] [Green Version]
  5. DeMenocal, P. Cultural responses to climate change during the late Holocene. Science 2001, 292, 667–674. [Google Scholar] [CrossRef]
  6. Büntgen, U.; Tegel, W.; Nicolussi, K.; McCormick, M.; Frank, D.; Trouet, V.; Kaplan, J.O.; Herzig, F.; Heussner, K.-U.; Wanner, H.; et al. 2500 years of European climate variability and human susceptibility. Science 2011, 331, 578–582. [Google Scholar] [CrossRef] [Green Version]
  7. Bar-Matthews, M.; Ayalon, A. Mid-Holocene climate variations revealed by high-resolution speleothem records from Soreq Cave, Israel and their correlation with cultural changes. Holocene 2011, 21, 163–171. [Google Scholar] [CrossRef]
  8. Cullen, H.M.; de Menocal, P.B.; Hemming, S.; Brown, F.H.; Guilderson, T.; Sirocko, F. Climate change and the collapse of the Akkadian empire: Evidence from the deep sea. Geology 2000, 28, 379–382. [Google Scholar] [CrossRef] [Green Version]
  9. Drysdale, R.; Zanchetta, G.; Hellstrom, J.; Maas, R.; Fallick, A.; Pickett, M.; Cartwright, I.; Piccini, L. Late Holocene drought responsible for the collapse of Old World civilizations is recorded in an Italian cave flowstone. Geology 2006, 34, 101–104. [Google Scholar] [CrossRef] [Green Version]
  10. Kaniewski, D.; van Campo, E.; Guiot, J.; le Burel, S.; Otto, T.; Baeteman, C. Environmental roots of the Late Bronze Age crisis. PLoS ONE 2013, 8, e71004. [Google Scholar] [CrossRef] [Green Version]
  11. Lamb, H.H. Climate: Present, Past and Future—V.2: Climatic History and the Future; Methuen: London, UK; Barnes and Noble: New York, NY, USA, 1977; p. 837. [Google Scholar]
  12. Patterson, W.P.; Dietrich, K.A.; Holmden, C.; Andrews, J.T. Two millennia of North Atlantic seasonality and implications for Norse colonies. Proc. Natl. Acad. Sci. USA 2010, 107, 5306–5310. [Google Scholar] [CrossRef] [PubMed] [Green Version]
  13. McCormick, M.; Büntgen, U.; Cane, M.A.; Cook, E.R.; Harper, K.; Huybers, P.; Litt, T.; Manning, S.W.; Mayewski, P.A.; More, A.F.M.; et al. Climate change during and after the Roman Empire: Reconstructing the past from scientific and historical evidence. J. Interdiscip. Hist. 2012, 43, 169–220. [Google Scholar] [CrossRef] [Green Version]
  14. Frisia, S.; Borsato, A.; Spötl, C.; Villa, I.M.; Cucchi, F. Climate variability in the SE Alps of Italy over the past 17,000 years reconstructed from a stalagmite record. Boreas 2005, 34, 445–455. [Google Scholar] [CrossRef]
  15. Esper, J.; Frank, D.C.; Timonen, M.; Zorita, E.; Wilson, R.J.S.; Luterbacher, J.; Holzkämper, S.; Fischer, N.; Wagner, S.; Nievergelt, D.; et al. Orbital forcing of tree-ring data. Nat. Clim. Chang. 2012, 2, 862–866. [Google Scholar] [CrossRef]
  16. Magny, M.; de Beaulieu, J.-L.; Drescher-Schneider, R.; Vannière, B.; Walter-Simonnet, A.-V.; Miras, Y.; Millet, L.; Bossuet, G.; Peyron, O.; Brugiapaglia, E.; et al. Holocene climate changes in the central Mediterranean as recorded by lake-level fluctuations at Lake Accesa (Tuscany, Italy). Quat. Sci. Rev. 2007, 26, 1736–1758. [Google Scholar] [CrossRef]
  17. Migowski, C.; Stein, M.; Prasad, S.; Negendank, J.F.W.; Agnon, A. Holocene climate variability and cultural evolution in the Near East from the Dead Sea sedimentary record. Quat. Res. 2006, 66, 421–431. [Google Scholar] [CrossRef]
  18. Zanchetta, G.; Drysdale, R.N.; Hellstrom, J.C.; Fallick, A.E.; Isola, I.; Gagan, M.K.; Pareschi, M.T. Enhanced rainfall in the Western Mediterranean during deposition of sapropel S1: Stalagmite evidence from Corchia cave (Central Italy). Quat. Sci. Rev. 2007, 26, 279–286. [Google Scholar] [CrossRef] [Green Version]
  19. Margaritelli, G.; Cacho, I.; Català, A.; Barra, M.; Bellucci, L.G.; Lubritto, C.; Rettori, R.; Lirer, F. Persistent warm Mediterranean surface waters during the Roman period. Sci. Rep. 2020, 10, 10431. [Google Scholar] [CrossRef]
  20. Paolo, C.; Romano, M.; Salvador, I.; Avanzini, M. Reviewing the upper Pleistocene human footprints from the ‘Sala dei Misteri’ in the Grotta della Bàsura (Toirano, northern Italy) cave: An integrated morphometric and morpho-classificatory approach. Quat. Sci. Rev. 2017, 169, 50–64. [Google Scholar] [CrossRef]
  21. Hu, H.-M.; Trouet, V.; Spötl, C.; Tsai, H.-C.; Chien, W.-Y.; Sung, W.-H.; Michel, V.; Yu, J.-Y.; Valensi, P.; Jiang, X.; et al. Tracking the Westerly Wind Directions over Europe since the Middle Holocene. Sci. Adv. 2022; Submitted for Publication. [Google Scholar]
  22. Baker, A.C.; Hellstrom, J.; Kelly, B.F.J.; Mariethoz, G.; Trouet, V. A composite annual-resolution stalagmite record of North Atlantic climate over the last three millennia. Sci. Rep. 2015, 5, 10307. [Google Scholar] [CrossRef] [Green Version]
  23. Sabatier, P.; Bruno, W.; Francesco, F.G.; Fanny, M.; Jérôme, P.; Anne-Lise, D.; Adeline, B.; Wentao, C.; Cécile, P.; Jean-Louis, R.; et al. 6-kyr record of flood frequency and intensity in the western Mediterranean Alps—Interplay of solar and temperature forcing. Quat. Sci. Rev. 2017, 170, 121–135. [Google Scholar] [CrossRef]
  24. Warken, S.F.; Fohlmeister, J.; Schröder-Ritzrau, A.; Constantin, S.; Spötl, C.; Gerdes, A.; Esper, J.; Frank, N.; Arps, J.; Terente, M.; et al. Reconstruction of late Holocene autumn/winter precipitation variability in SW Romania from a high-resolution speleothem trace element record. Earth Planet. Sci. Lett. 2018, 499, 122–133. [Google Scholar] [CrossRef]
  25. Rodrigo-Gámiz, M.; Martínez-Ruiz, F.; Rampen, S.W.; Schouten, S.; Sinninghe Damsté, J.S. Sea surface temperature variations in the western Mediterranean Sea over the last 20 kyr: A dual-organic proxy (UK’37 and LDI) approach. Paleoceanography 2014, 29, 87–98. [Google Scholar] [CrossRef] [Green Version]
  26. Miglietta, M.M.; Moscatello, A.; Conte, D.; Mannarini, G.; Lacorata, G.; Rotunno, R. Numerical analysis of a Mediterranean “hurricane” over south-eastern Italy: Sensitivity experiments to sea surface temperature. Atmos. Res. 2011, 101, 412–426. [Google Scholar] [CrossRef]
  27. Cisneros, C.; de Caballero, E. Paleoclimate Reconstruction during MIS 5a Based on a Speleothem from Nerja Cave, Málaga, South Spain. Nat. Sci. 2013, 5, 533–540. [Google Scholar]
  28. Ait Brahim, Y.; Wassenburg, J.A.; Sha, L.; Cruz, F.W.; Deininger, M.; Sifeddine, A.; Bouchaou, L.; Spötl, C.; Edwards, R.L.; Cheng, H. North Atlantic ice-rafting, ocean and atmospheric circulation during the Holocene: Insights from western Mediterranean speleothems. Geophys. Res. Lett. 2019, 46, 7614–7623. [Google Scholar] [CrossRef]
  29. Shen, C.-C.; Cheng, H.; Edwards, R.L.; Moran, S.B.; Edmonds, H.N.; Hoff, J.A.; Thomas, R.B. Measurement of attogram quantities of 231Pa in dissolved and particulate fractions of seawater by isotope dilution thermal ionization mass spectroscopy. Anal. Chem. 2003, 75, 1075–1079. [Google Scholar] [CrossRef]
  30. Shen, C.-C.; Li, K.-S.; Sieh, K.; Natawidjaja, D.; Cheng, H.; Wang, X.; Edwards, R.L.; Lam, D.D.; Hsieh, Y.-T.; Fan, T.-Y.; et al. Variation of initial 230Th/232Th and limits of high precision U–Th dating of shallow-water corals. Geochim. Cosmochim. Acta 2008, 72, 4201–4223. [Google Scholar] [CrossRef]
  31. Shen, C.-C.; Wu, C.-C.; Cheng, H.; Lawrence, E.R.; Hsieh, Y.-T.; Gallet, S.; Chang, C.-C.; Li, T.-Y.; Lam, D.D.; Kano, A.; et al. High-precision and high-resolution carbonate 230Th dating by MC-ICP-MS with SEM protocols. Geochim. Cosmochim. Acta 2012, 99, 71–86. [Google Scholar] [CrossRef]
  32. Scholz, D.; Hoffmann, D.L. StalAge—An algorithm designed for construction of speleothem age models. Quat. Geochronol. 2011, 6, 369–382. [Google Scholar] [CrossRef]
  33. Olsen, J.; Anderson, N.J.; Knudsen, M.F. Variability of the North Atlantic Oscillation over the past 5200 years. Nat. Geosci. 2012, 5, 808–812. [Google Scholar] [CrossRef]
  34. Hendy, C. The isotopic geochemistry of speleothems—I. The calculation of the effects of different modes of formation on the isotopic composition of speleothems and their applicability as palaeoclimatic indicators. Geochim. Cosmochim. Acta 1971, 35, 801–824. [Google Scholar] [CrossRef]
  35. Dorale, J.A.; Liu, Z. Limitations of Hendy test criteria in judging the paleoclimatic suitability of speleothems and the need for replication. J. Cave Karst Stud. 2009, 71, 73–80. [Google Scholar]
  36. Amundson, R.; Stern, L.; Baisden, T.; Wang, Y. The isotopic composition of soil and soil-respired CO2. Geoderma 1998, 82, 83–114. [Google Scholar] [CrossRef]
  37. Fohlmeister, J.; Voarintsoa, N.R.G.; Lechleitner, F.A.; Boyd, M.; Brandtstätter, S.; Jacobson, M.J.; Oster, J.L. Main controls on the stable carbon isotope composition of speleothems. Geochim. Cosmochim. Acta 2020, 279, 67–87. [Google Scholar] [CrossRef]
  38. Fohlmeister, J.; Arps, J.; Spötl, C.; Schröder-Ritzrau, A.; Plessen, B.; Günter, C.; Frank, N.; Trüssel, M. Carbon and oxygen isotope fractionation in the water-calcite-aragonite system. Geochim. Cosmochim. Acta 2018, 235, 127–139. [Google Scholar] [CrossRef] [Green Version]
  39. Baker, A.; Ito, E.; Smart, P.L.; McEwan, R.F. Elevated and variable values of 13C in speleothems in a British cave system. Chem. Geol. 1997, 136, 263–270. [Google Scholar] [CrossRef]
  40. McDermott, F. Palaeo-climate reconstruction from stable isotope variations in speleothems: A review. Quat. Sci. Rev. 2004, 23, 901–918. [Google Scholar] [CrossRef]
  41. Rudzka, D.; McDermott, F.; Baldini, L.M.; Fleitmann, D.; Moreno, A.; Stoll, H. The coupled δ13C-radiocarbon systematics of three Late Glacial/early Holocene speleothems; insights into soil and cave processes at climatic transitions. Geochim. Cosmochim. Acta 2011, 75, 4321–4339. [Google Scholar] [CrossRef]
  42. Columbu, A.; Audra, P.; Gázquez, F.; D’Angeli, I.M.; Bigot, J.Y.; Koltai, G.; Chiesa, R.; Yu, T.-L.; Hu, H.-M.; Shen, C.-C.; et al. Hypogenic speleogenesis, late stage epigenic overprinting and condensation-corrosion in a complex cave system in relation to landscape evolution (Toirano, Liguria, Italy). Geomorphology 2021, 376, 107561. [Google Scholar] [CrossRef]
  43. Genty, D.; Blamart, D.; Ghaleb, B.; Plagnes, V.; Causse, C.; Bakalowicz, M.; Zouari, K.; Chkir, N.; Hellstrom, J.; Wainer, K.; et al. Timing and dynamics of the last deglaciation from European and North African δ13C stalagmite profiles—comparison with Chinese and South Hemisphere stalagmites. Quat. Sci. Rev. 2006, 25, 2118–2142. [Google Scholar] [CrossRef]
  44. Columbu, A.; Sauro, F.; Lundberg, J.; Drysdale, R.; de Waele, J. Palaeoenvironmental changes recorded by speleothems of the southern Alps (Piani Eterni, Belluno, Italy) during four interglacial to glacial climate transitions. Quat. Sci. Rev. 2018, 197, 319–335. [Google Scholar] [CrossRef]
  45. Breecker, D.O.; Payne, A.E.; Quade, J.; Banner, J.L.; Ball, C.E.; Meyer, K.W.; Cowan, B.D. The sources and sinks of CO2 in caves under mixed woodland and grassland vegetation. Geochim. Cosmochim. Acta 2012, 96, 230–246. [Google Scholar] [CrossRef]
  46. Fairchild, I.J.; Smith, C.L.; Baker, A.; Fuller, L.; Spötl, C.; Mattey, D.; McDermott, F. Modification and preservation of environmental signals in speleothems. Earth-Sci. Rev. 2006, 75, 105–153. [Google Scholar] [CrossRef] [Green Version]
  47. Fairchild, I.J.; McMillan, E.A. Speleothems as indicators of wet and dry periods. Int. J. Speleol. 2007, 36, 69–74. [Google Scholar] [CrossRef] [Green Version]
  48. Regattieri, E.; Zanchetta, G.; Isola, I.; Zanella, E.; Drysdale, R.N.; Hellstrom, J.C.; Zerboni, A.; Dallai, L.; Tema, E.; Lanci, L.; et al. Holocene Critical Zone dynamics in an Alpine catchment inferred from a speleothem multiproxy record: Disentangling climate and human influences. Sci. Rep. 2019, 9, 17829. [Google Scholar] [CrossRef] [Green Version]
  49. Hurrell, J.W.; Deser, C. North Atlantic climate variability: The role of the North Atlantic Oscillation. J. Mar. Syst. 2009, 78, 28–41. [Google Scholar] [CrossRef]
  50. Collins, M.; Knutti, R.; Arblaster, J.; Dufresne, J.; Fichefet, T.; Friedlingstein, P.; Gao, X.; Gutowski, W.; Johns, T.; Krinner, G.; et al. Long-term Climate Change: Projections, Commitments and Irreversibility. In Climate Change 2013 the Physical Science Basis: Working Group I Contribution to the Fifth Assessment Report of the Intergovernmental Panel on Climate Change, January 2014 ; Cambridge University Press: Cambridge, UK; New York, NY, USA, 2013. [Google Scholar]
  51. Pastor, F.; Valiente, J.A.; Palau, J.L. Sea surface temperature in the Mediterranean: Trends and spatial patterns (1982–2016). Pure Appl. Geophys. 2018, 175, 4017–4029. [Google Scholar] [CrossRef] [Green Version]
  52. Volosciuk, C.; Maraun, D.; Semenov, V.A.; Tilinina, N.; Gulev, S.K.; Latif, M. Rising Mediterranean sea surface temperatures amplify extreme summer precipitation in central Europe. Sci. Rep. 2016, 6, 32450. [Google Scholar] [CrossRef] [Green Version]
  53. Cornes, R.; van der Schrier, G.; van den Besselaar, E.J.M.; Jones, P.D. An Ensemble Version of the E-OBS Temperature and Precipitation Datasets. J. Geophys. Res. Atmos. 2018, 123, 9391–9409. [Google Scholar] [CrossRef] [Green Version]
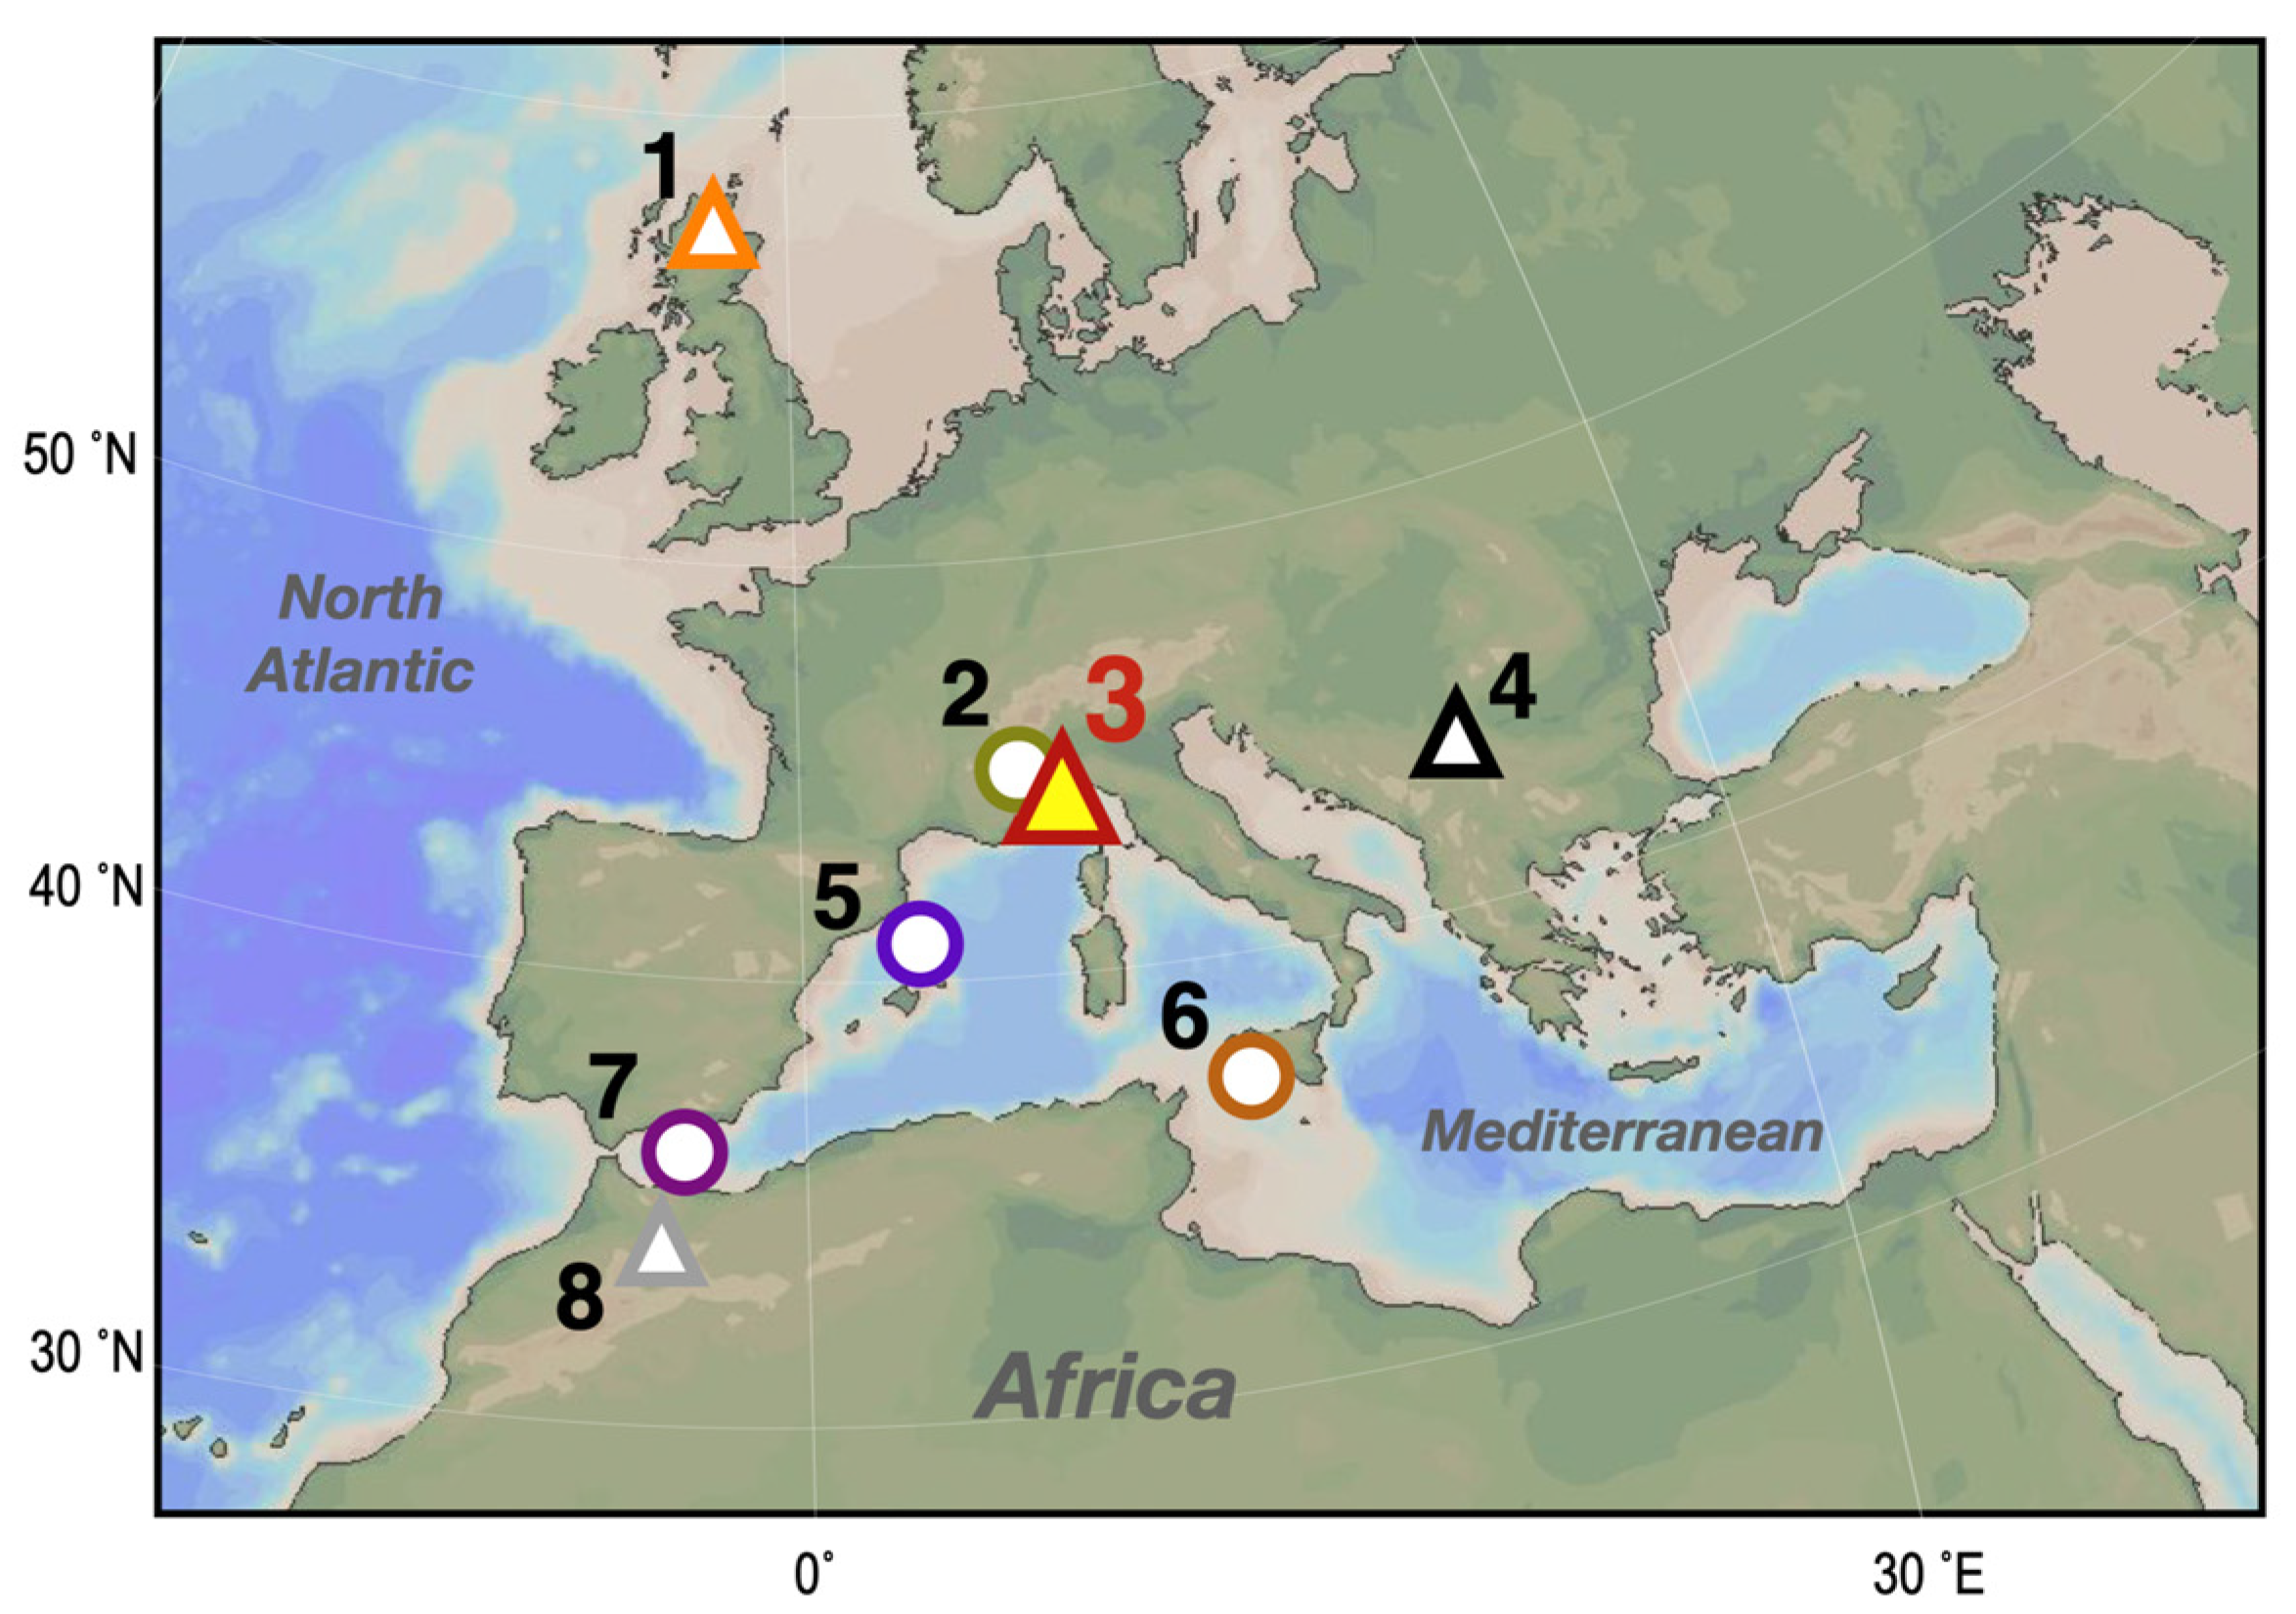
Figure 1. Locations of Bàsura cave and other cited terrestrial and marine sites. Triangles denote caves, and circles denote other terrestrial and marine sedimentary sites: (1) Roaring cave, Scotland [22]; (2) Lake Savine [23]; (3) Bàsura cave, northern Italy (this study); (4) Cloşani cave, Romania [24]; (5) Marine sediment core TTR17-434G, Alboran Sea [25]; (6) Marine sediment core SW104-ND11, Sicily Channel [26]; (7) Marine sediment cores MINMC06 and HER-MC-MR3, Minorca Basin [27]; (8) Chaara cave, Morroco [28]. The map was generated using Ocean Data View.
Climate 10 00093 g001
Figure 2. Proxy-inferred hydroclimate records during the Roman warm period. (A) Stalagmite band-width records from Roaring cave (orange, [22]) and a paleo North Atlantic Oscillation (NAO) index reconstructed from Greenland (blue, [33]). (B) BA14-1 δ13C (dark red) and δ18O (tiffany blue). Horizontal error bars indicate U-Th ages with 2-sigma errors. (C) A flood event record from Lake Savine [23]. (D) Stalagmite-based precipitation index from Cloşani cave [24]. (E) Stalagmite-based precipitation index from Chaara cave [28]. The yellow bar indicates the interval of the Roman Warm Period from 200 B.C. to 400 A.D.
Climate 10 00093 g002
Figure 3. Comparison of Basura proxy and marine records in the Mediterranean Sea. (A) Basura BA14-1 δ13C (dark red) and δ18O (tiffany blue) records. (B) Sea surface temperature (SST) records. Brown: SW104-ND11, Sicily Channel [19]. Dark purple: TTR17-434G, Alboran Sea [25]. (C) SST anomaly record from MINMC06 and HER-MC-MR3, Minorca Basin [27]. The yellow bar indicates the interval of the Roman warm period from 200 B.C. to 400 A.D.
Climate 10 00093 g003
Publisher’s Note: MDPI stays neutral with regard to jurisdictional claims in published maps and institutional affiliations.