
Changing Air Quality and the Ozone Weekend Effect during the COVID-19 Pandemic in Toronto, Ontario, Canada


Abstract
1. Introduction
1.1. Background
1.2. Human Health Impacts of Ozone Exposure
1.3. Research Objective
- How did the restrictions imposed by the provincial government impact the magnitude of primary pollutants, NO and NO2, compared to the levels detected in the previous 10 years?
- Through the well-documented ozone weekend effect, how was the secondary pollutant O3 impacted during the first wave as a result of changes in NO and NO2, also in comparison to the previous 10 years?
2. Data and Methods
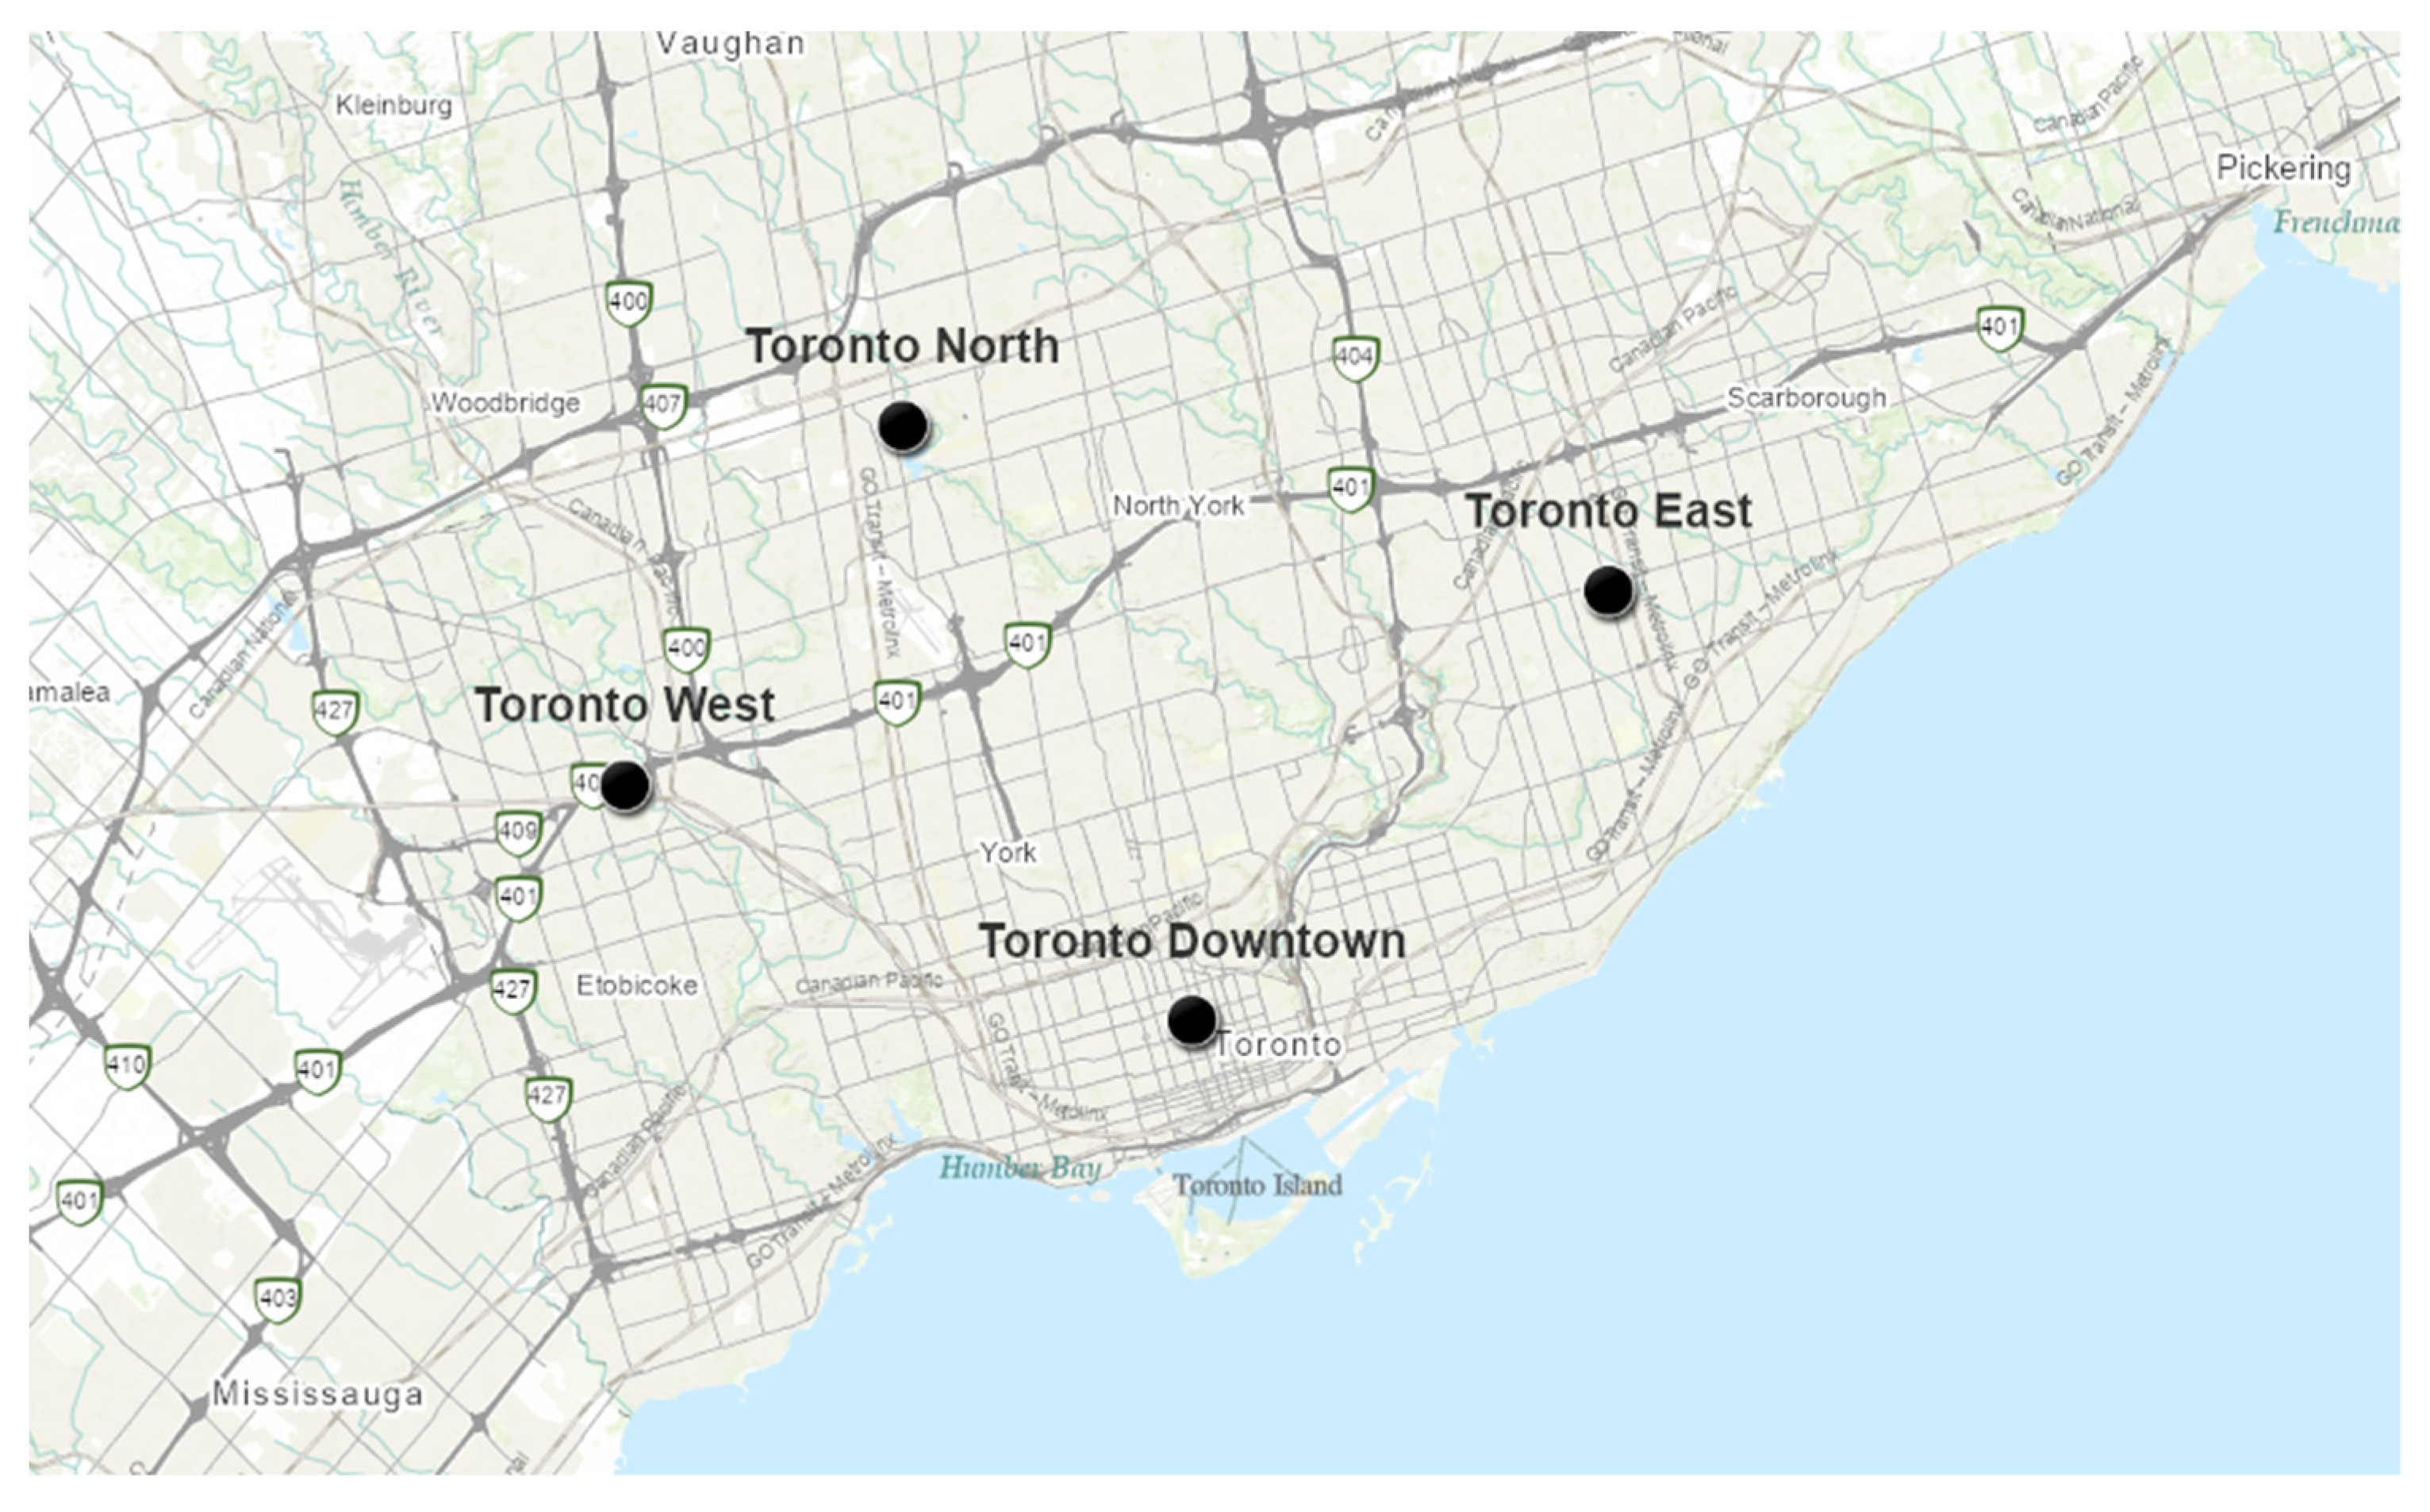
2.1. Data
2.2. Method
2.2.1. Climatology and Baseline
2.2.2. Data Ranking
2.2.3. Fisher Exact Test
3. Results
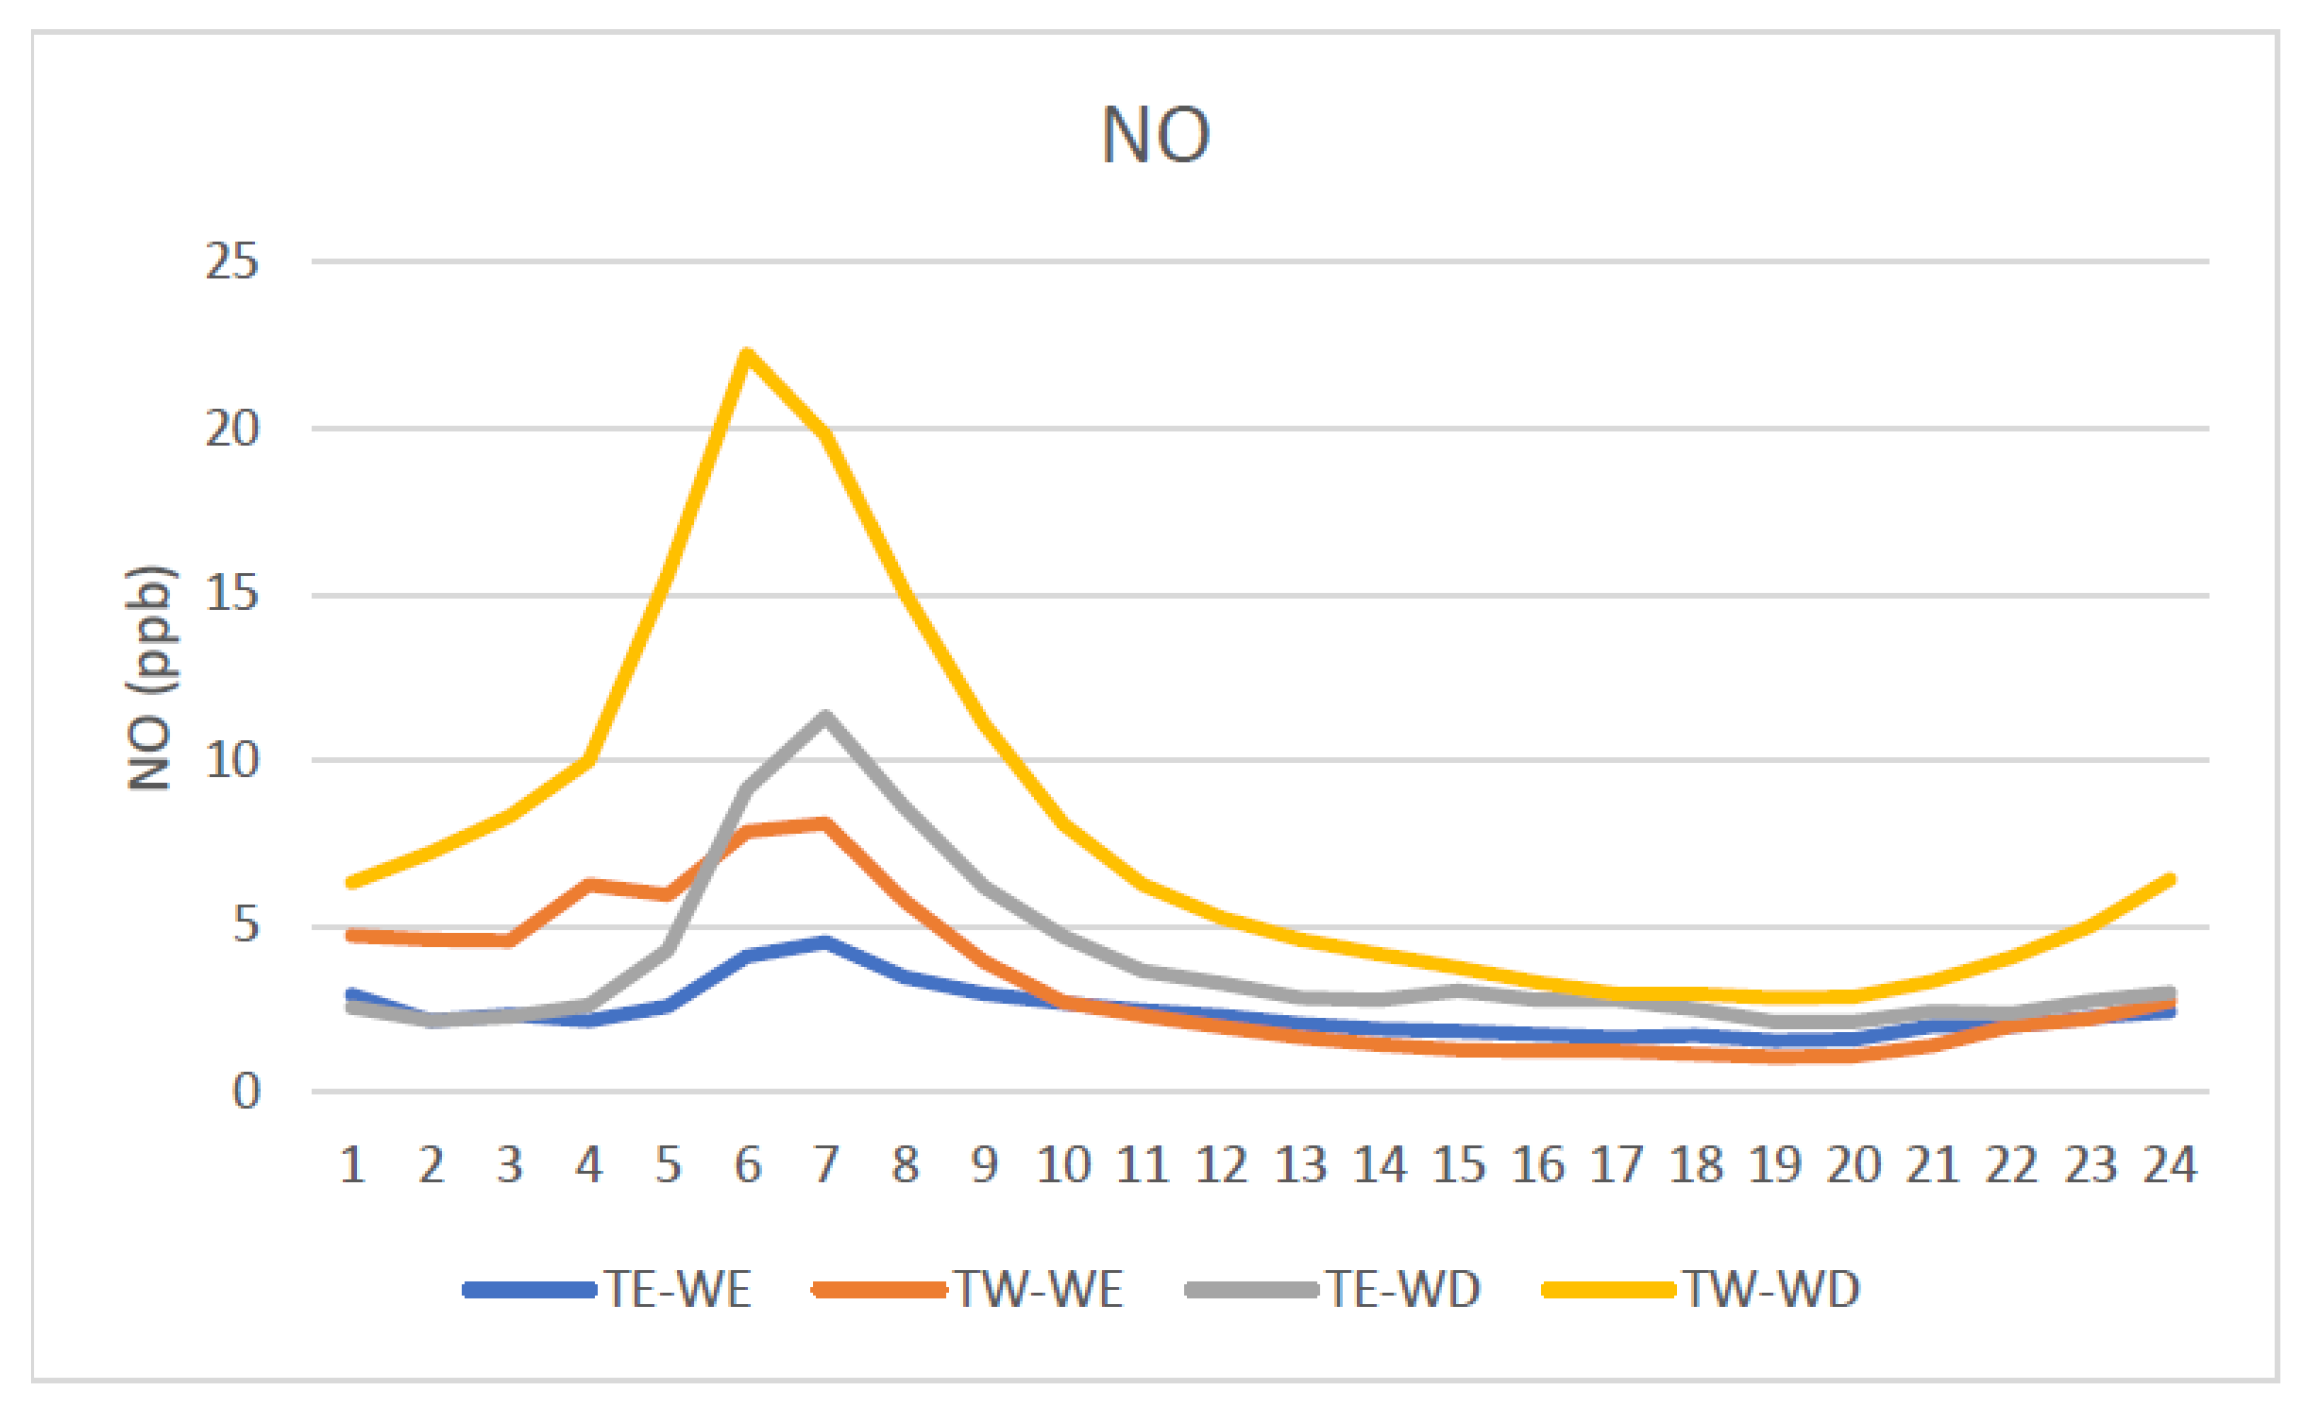
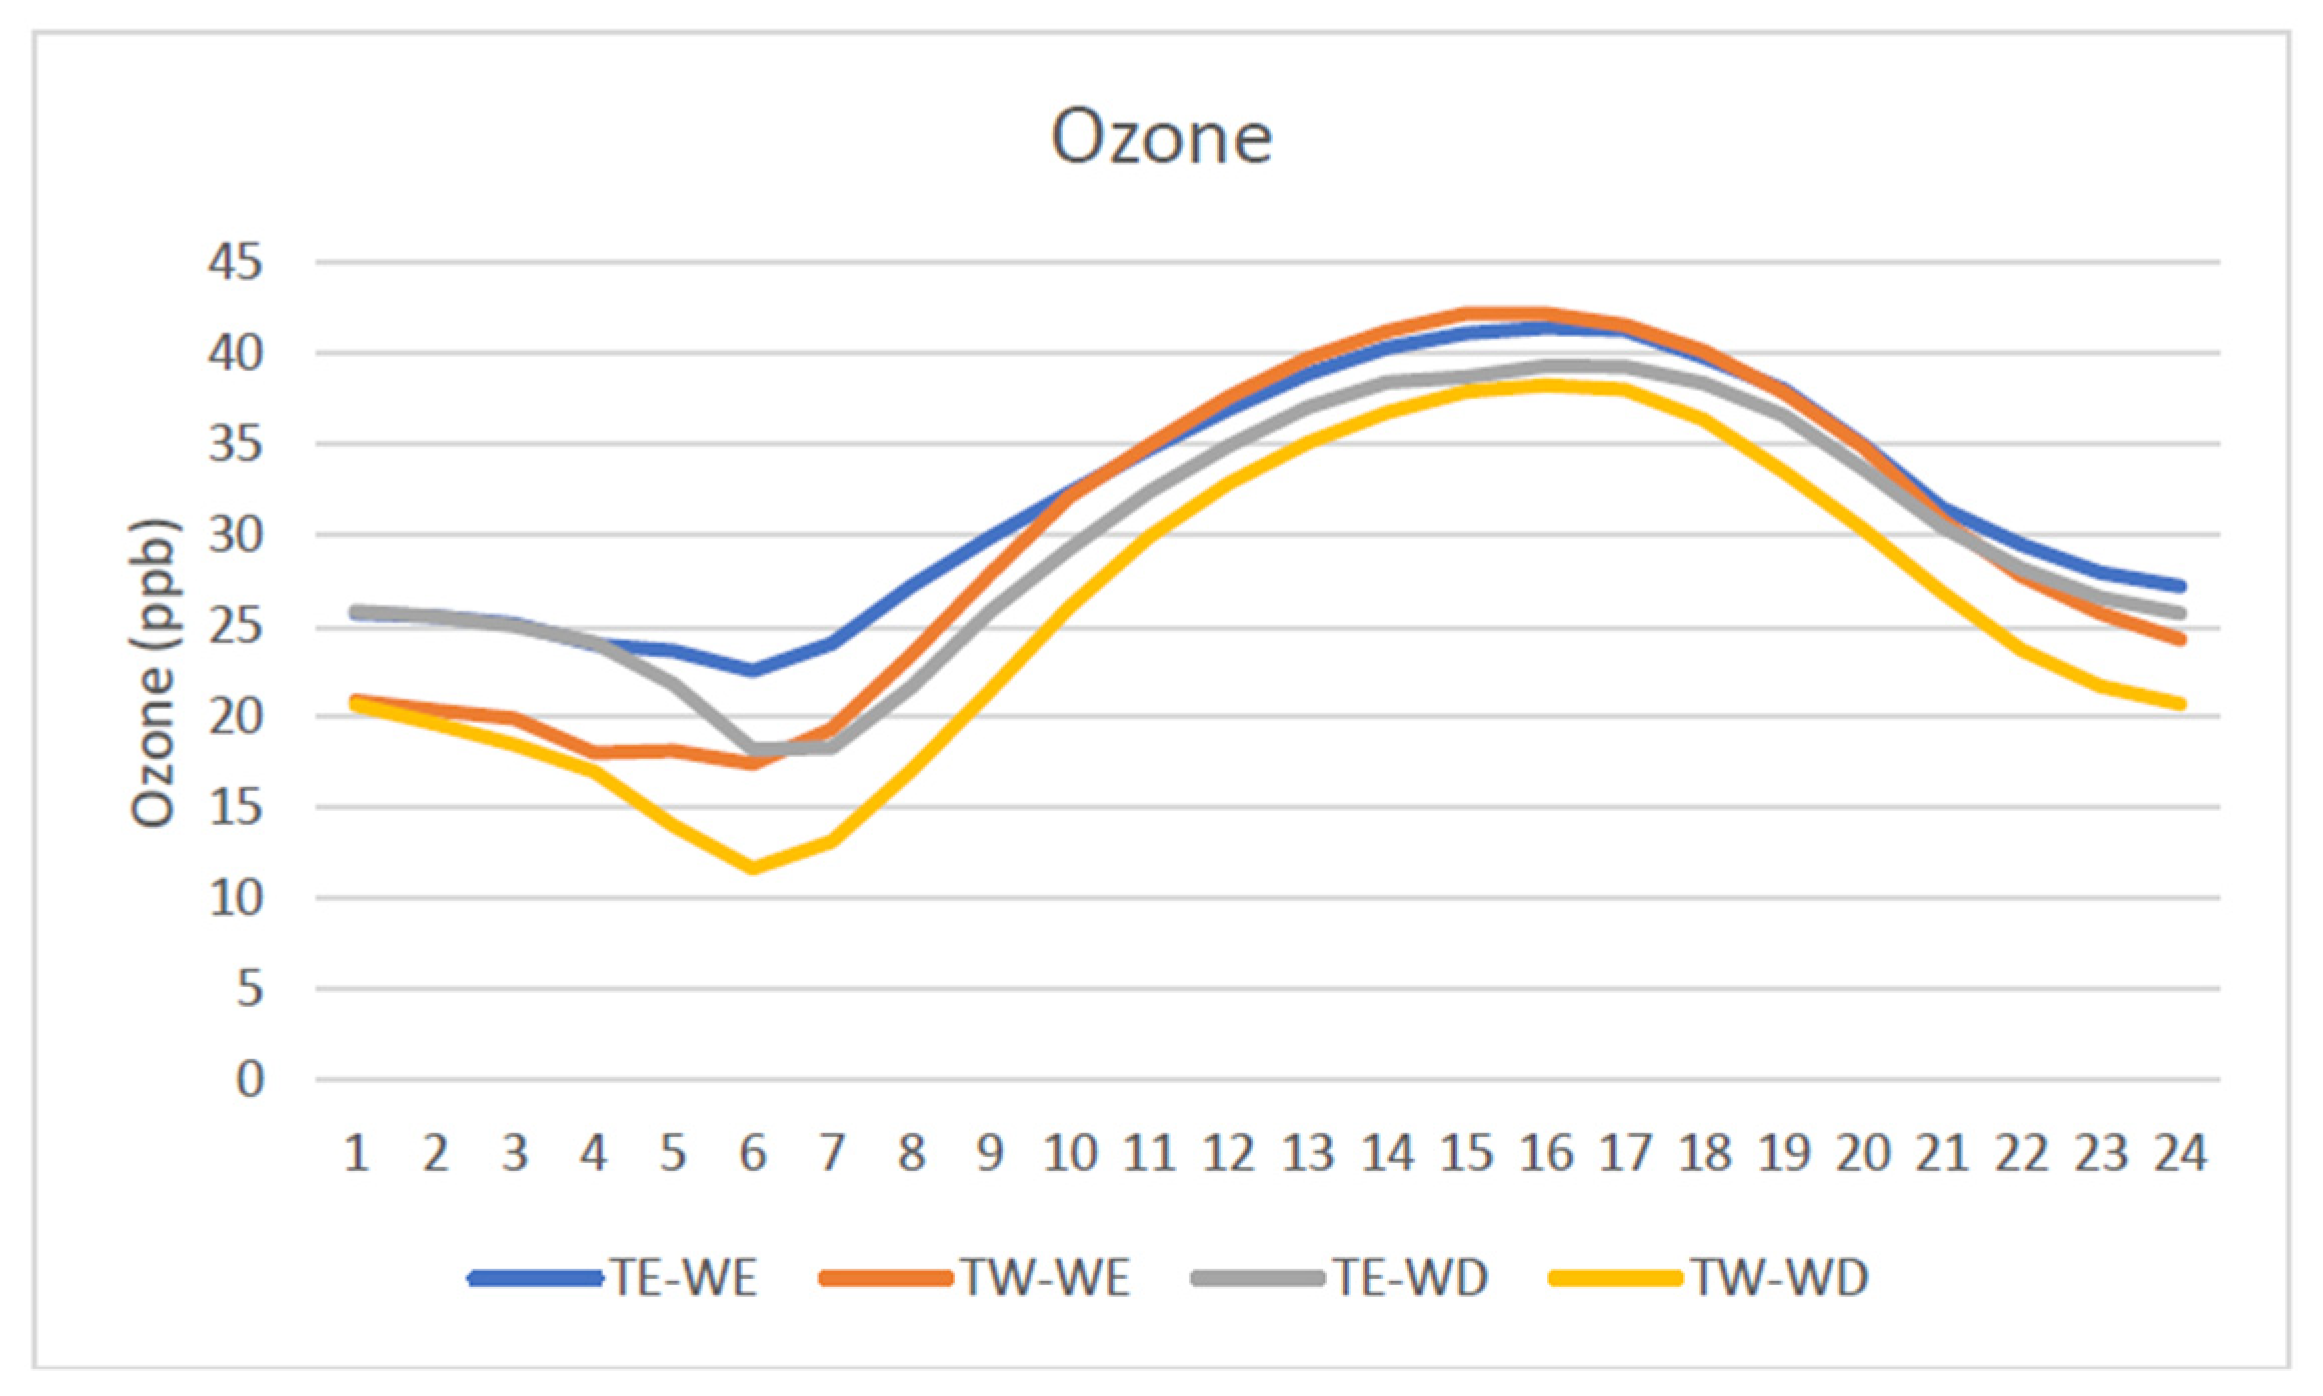
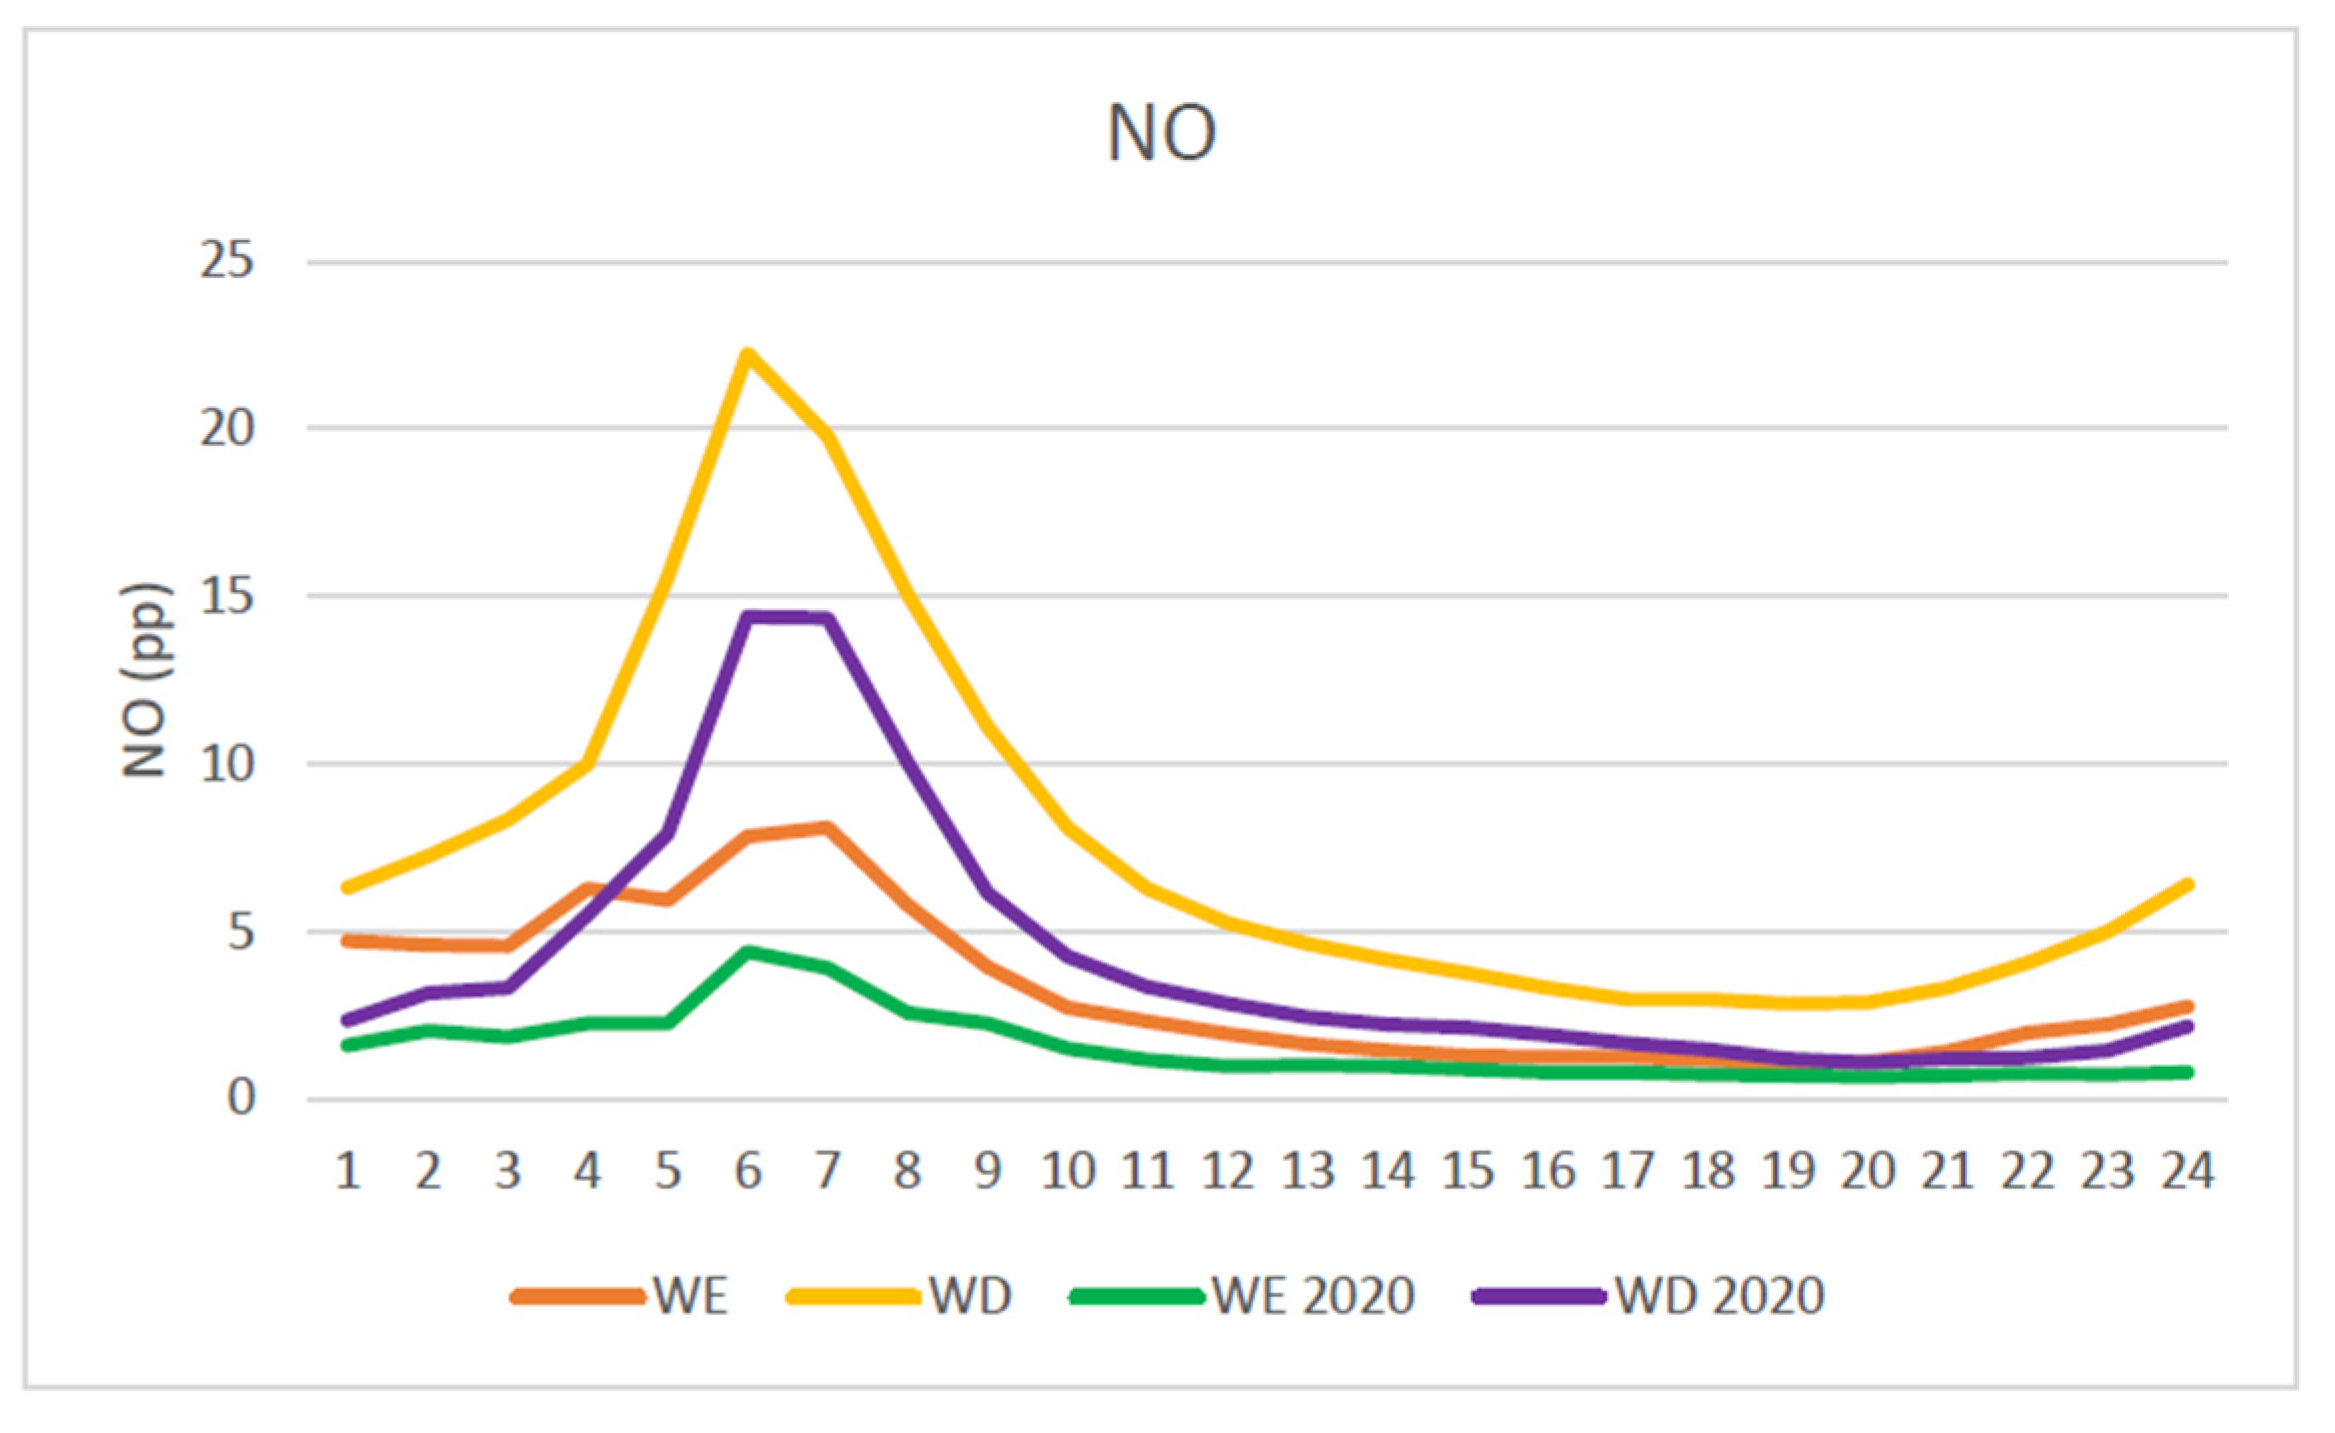
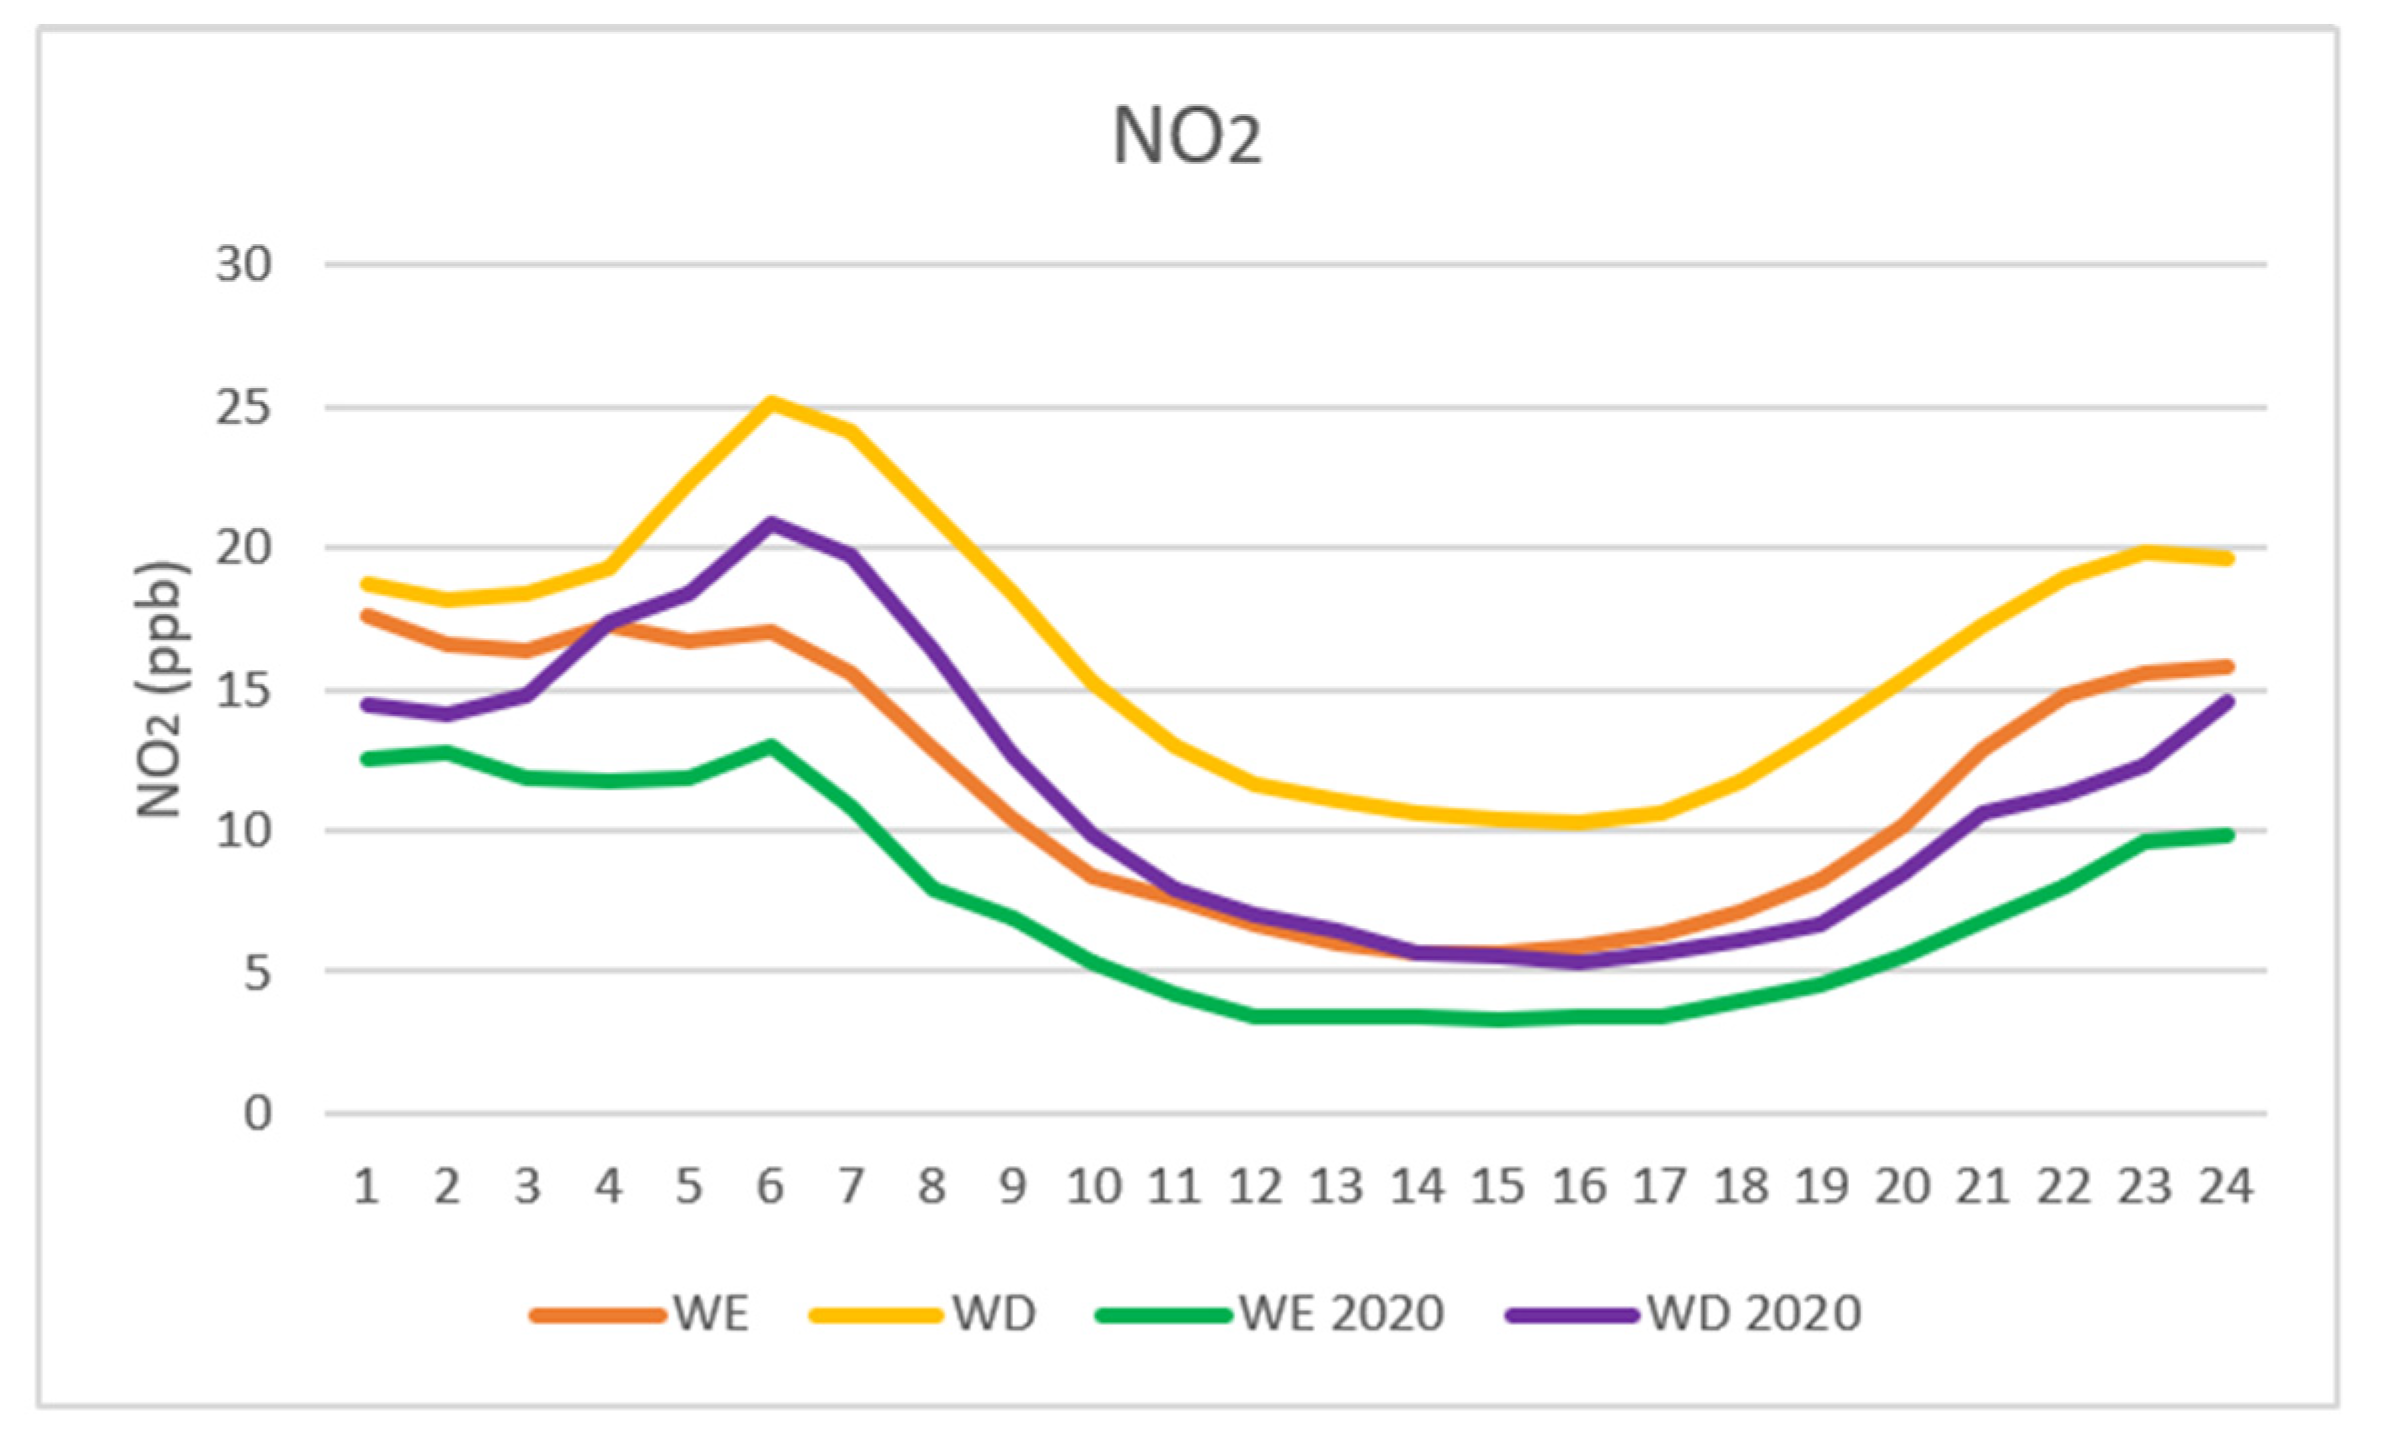
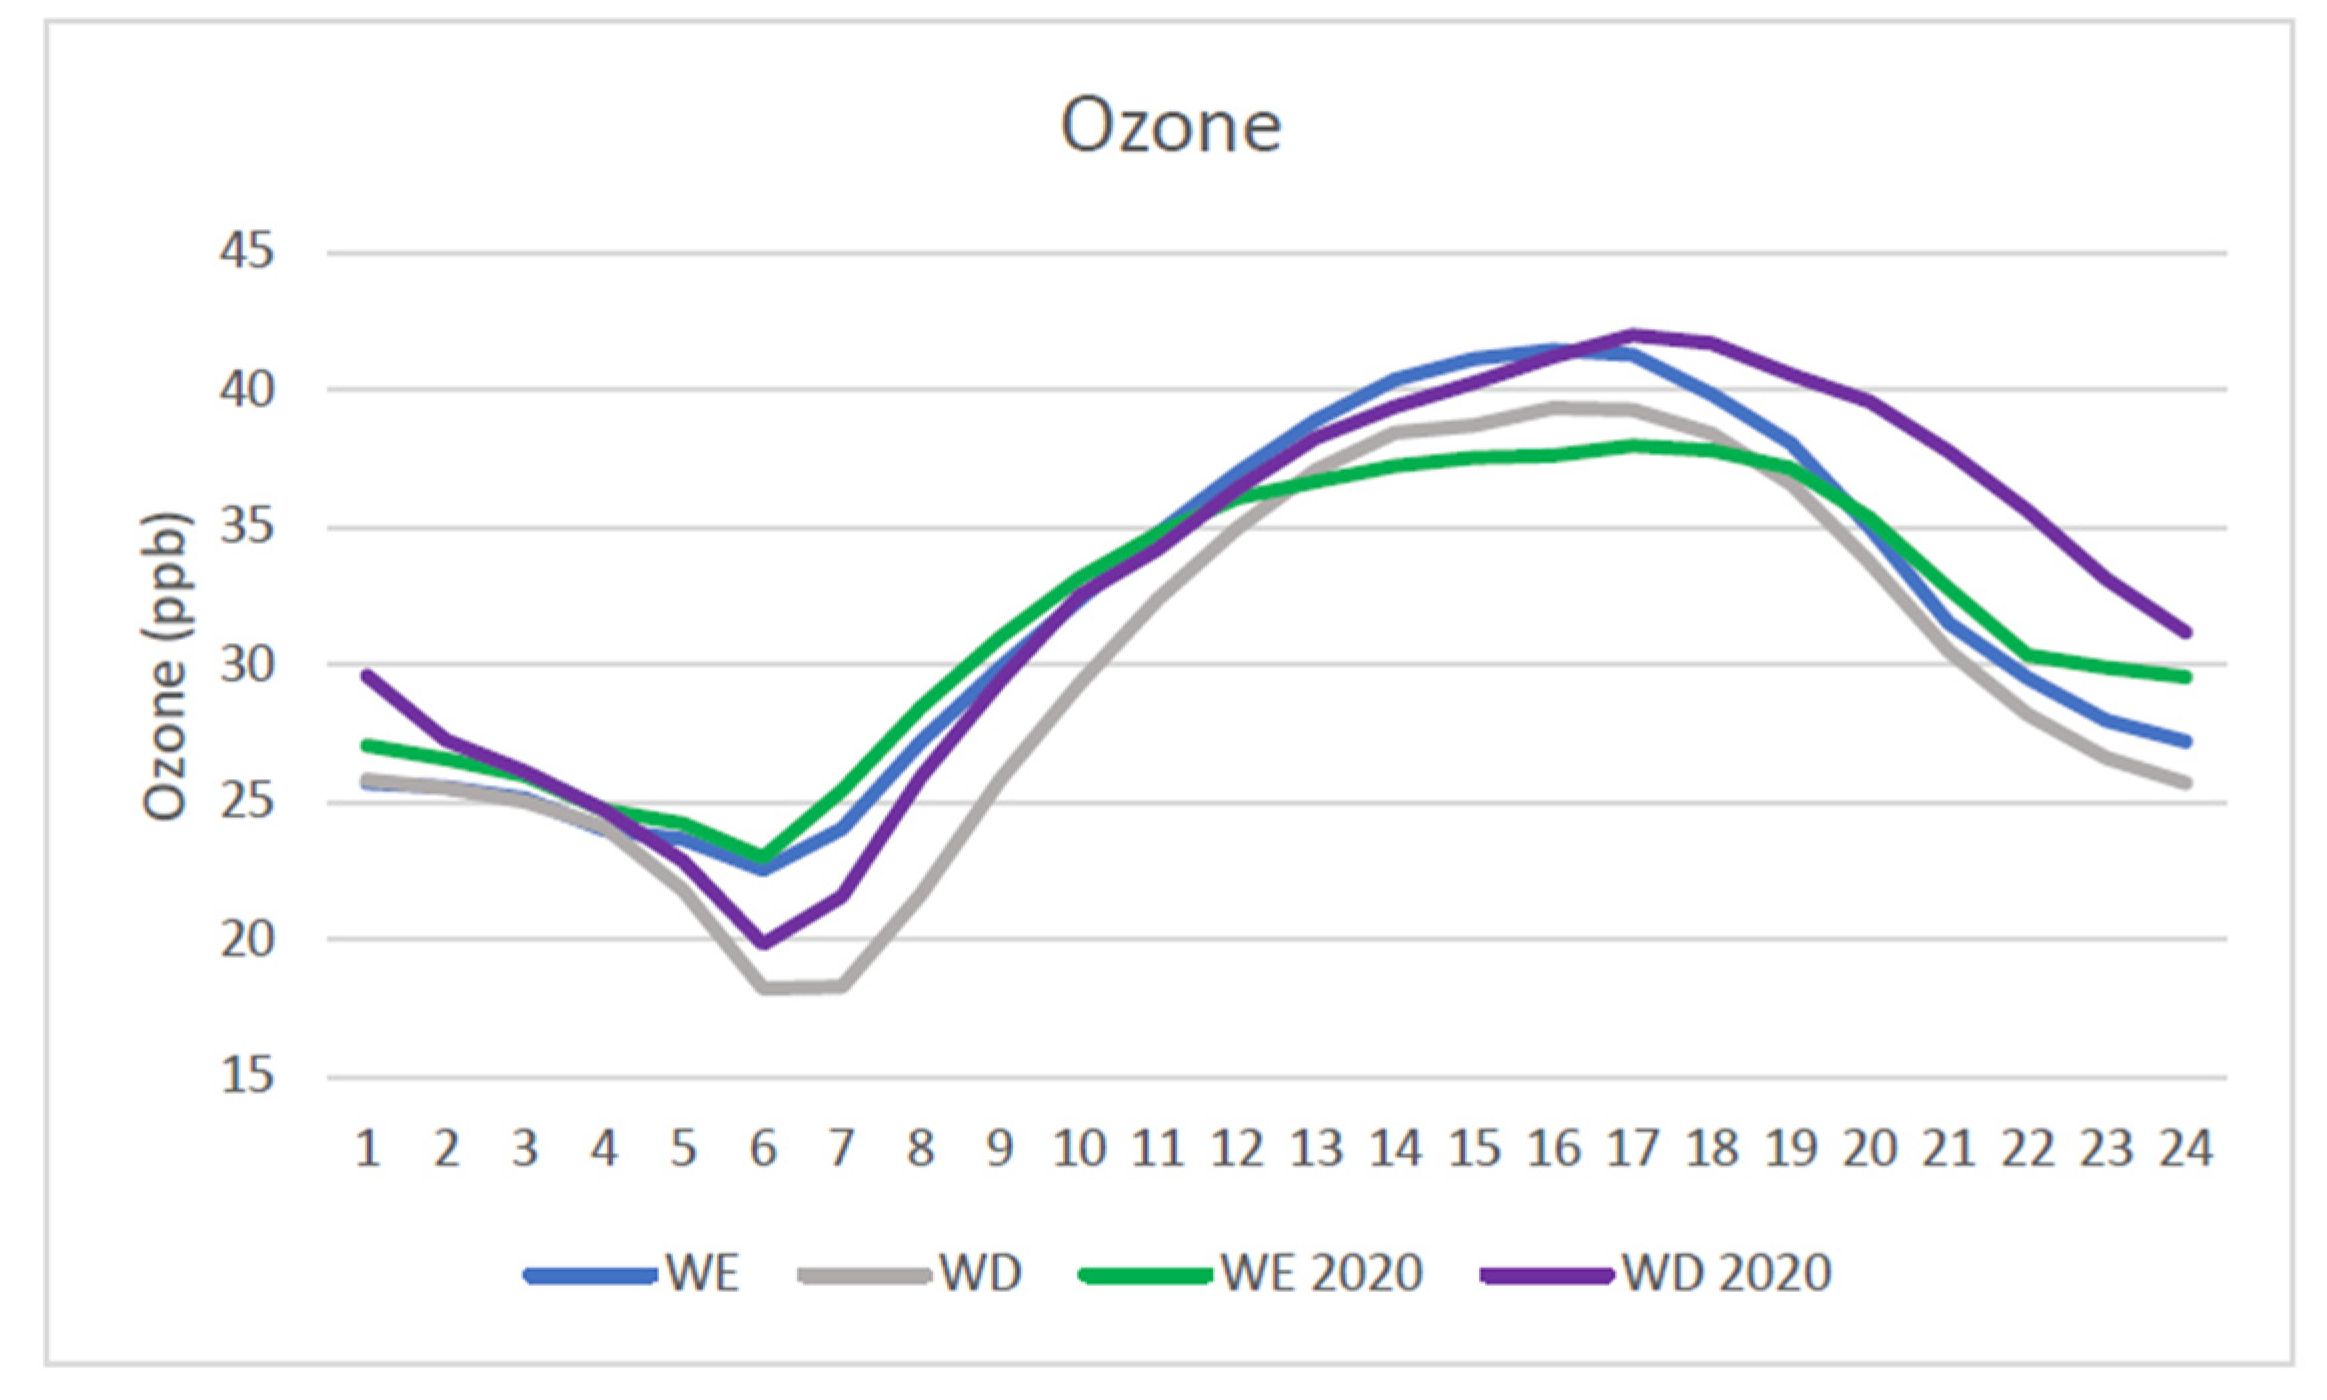
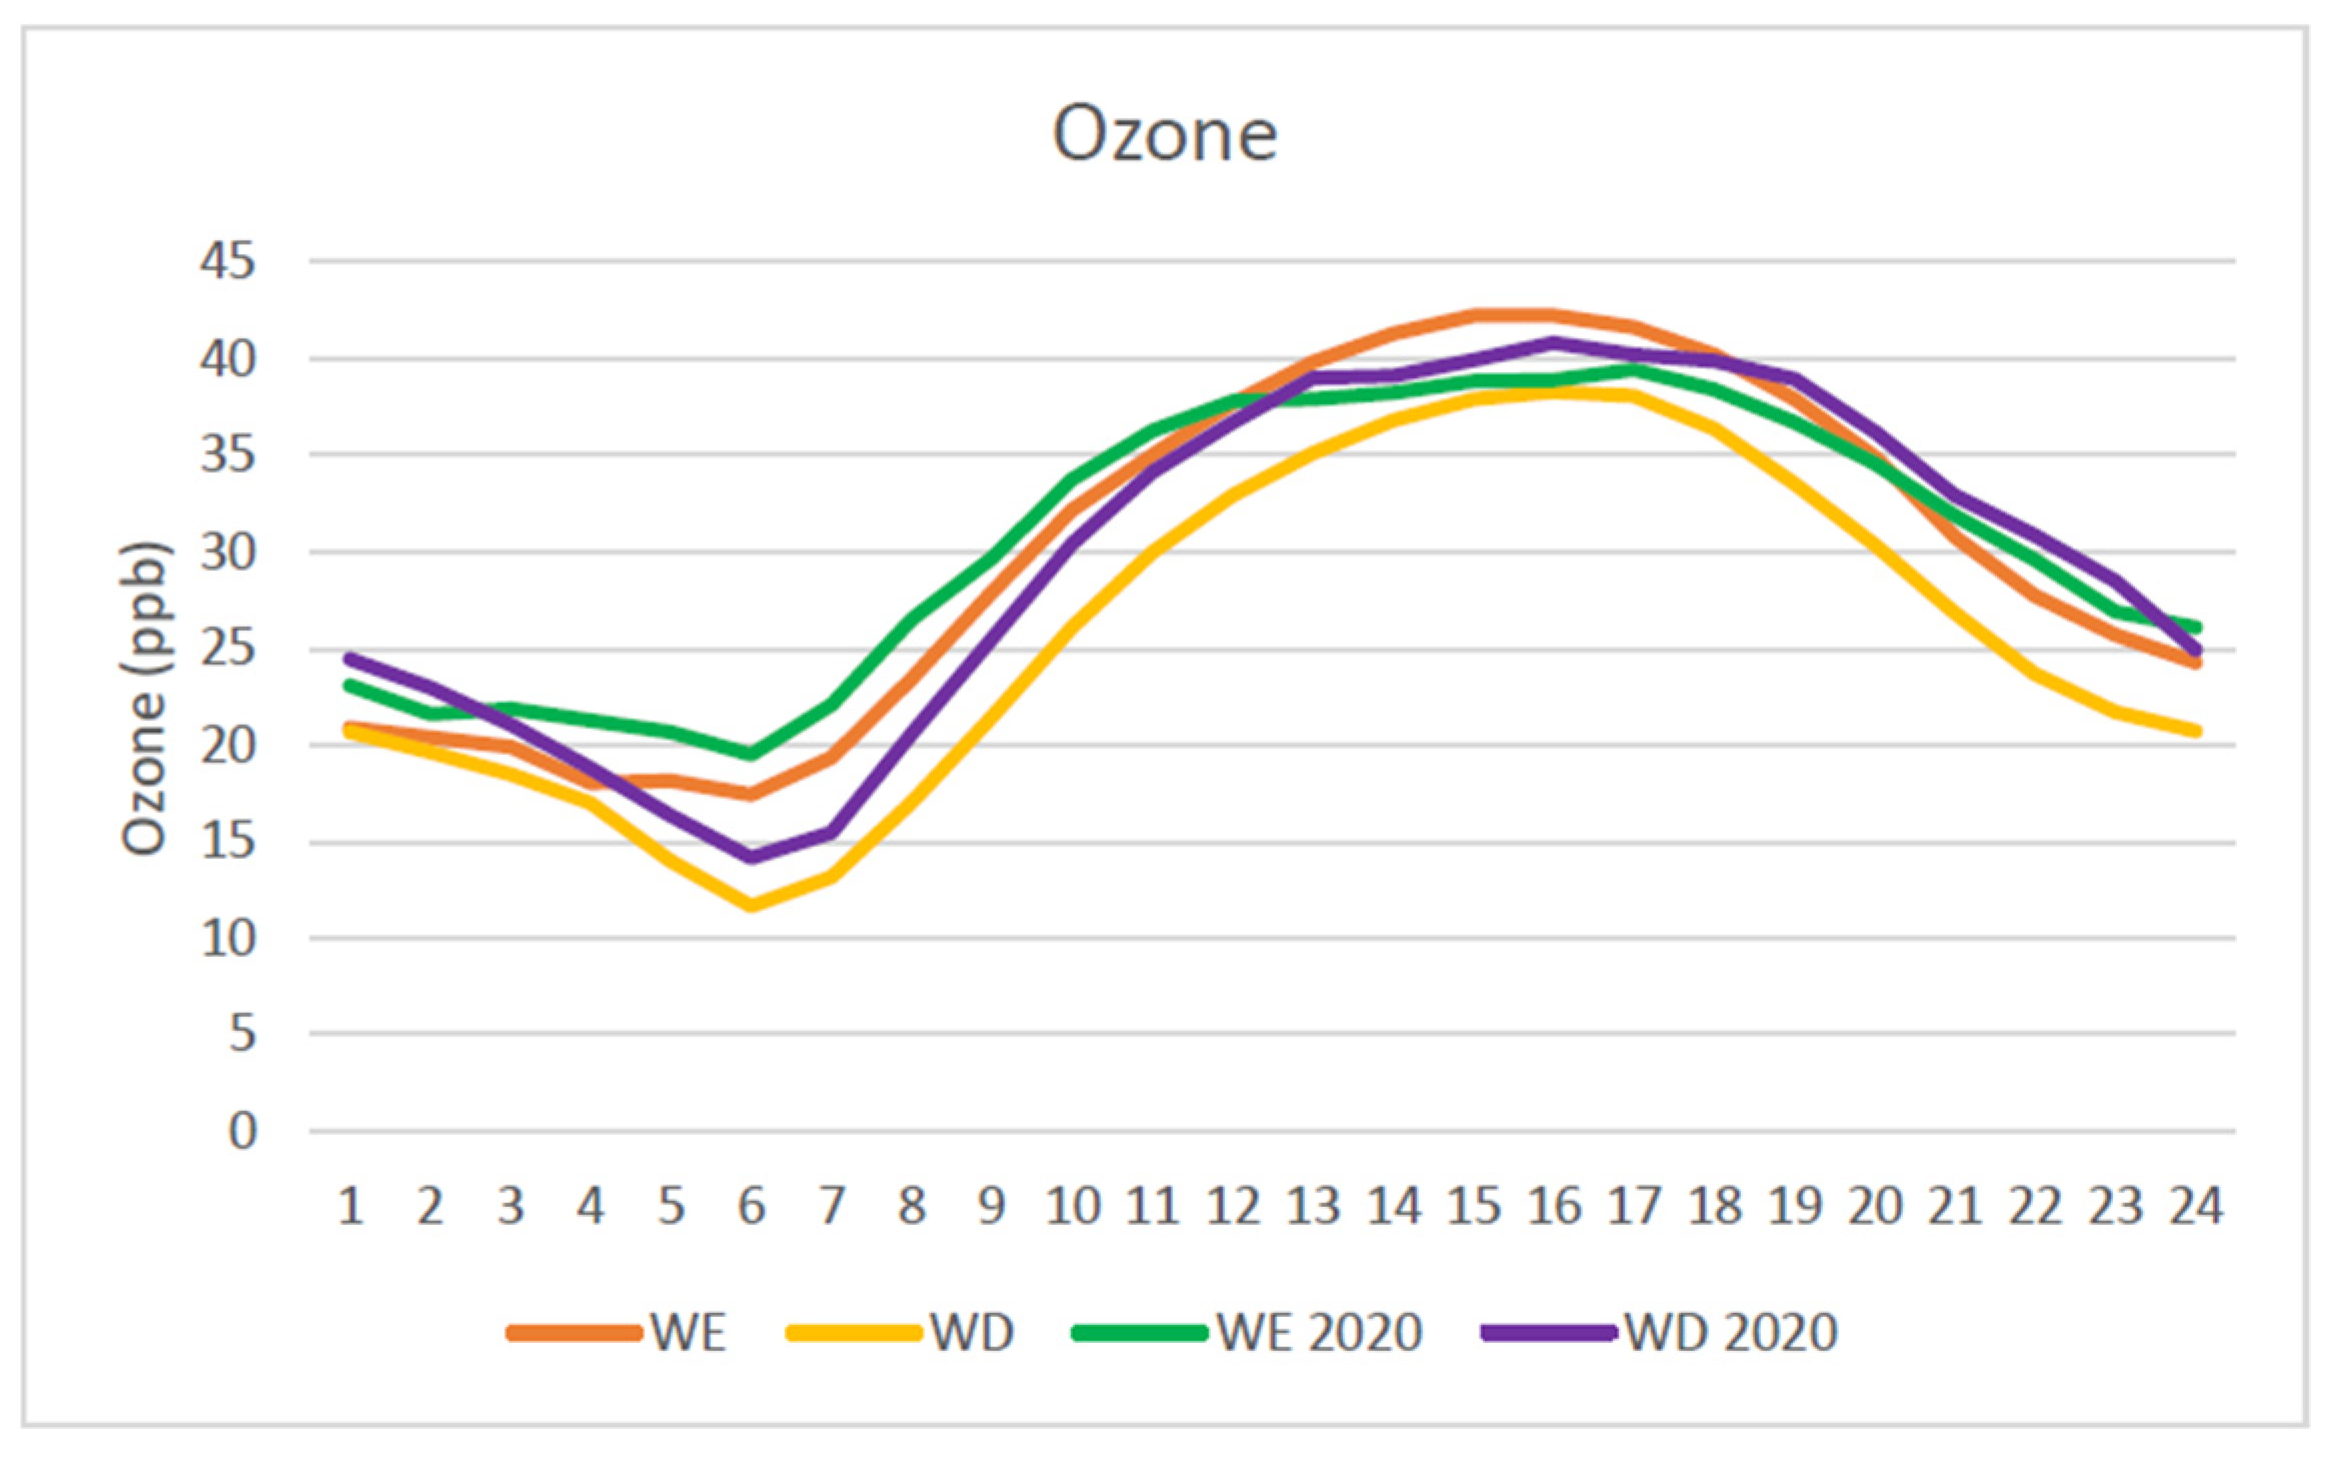
3.1. Baseline 2010–2019
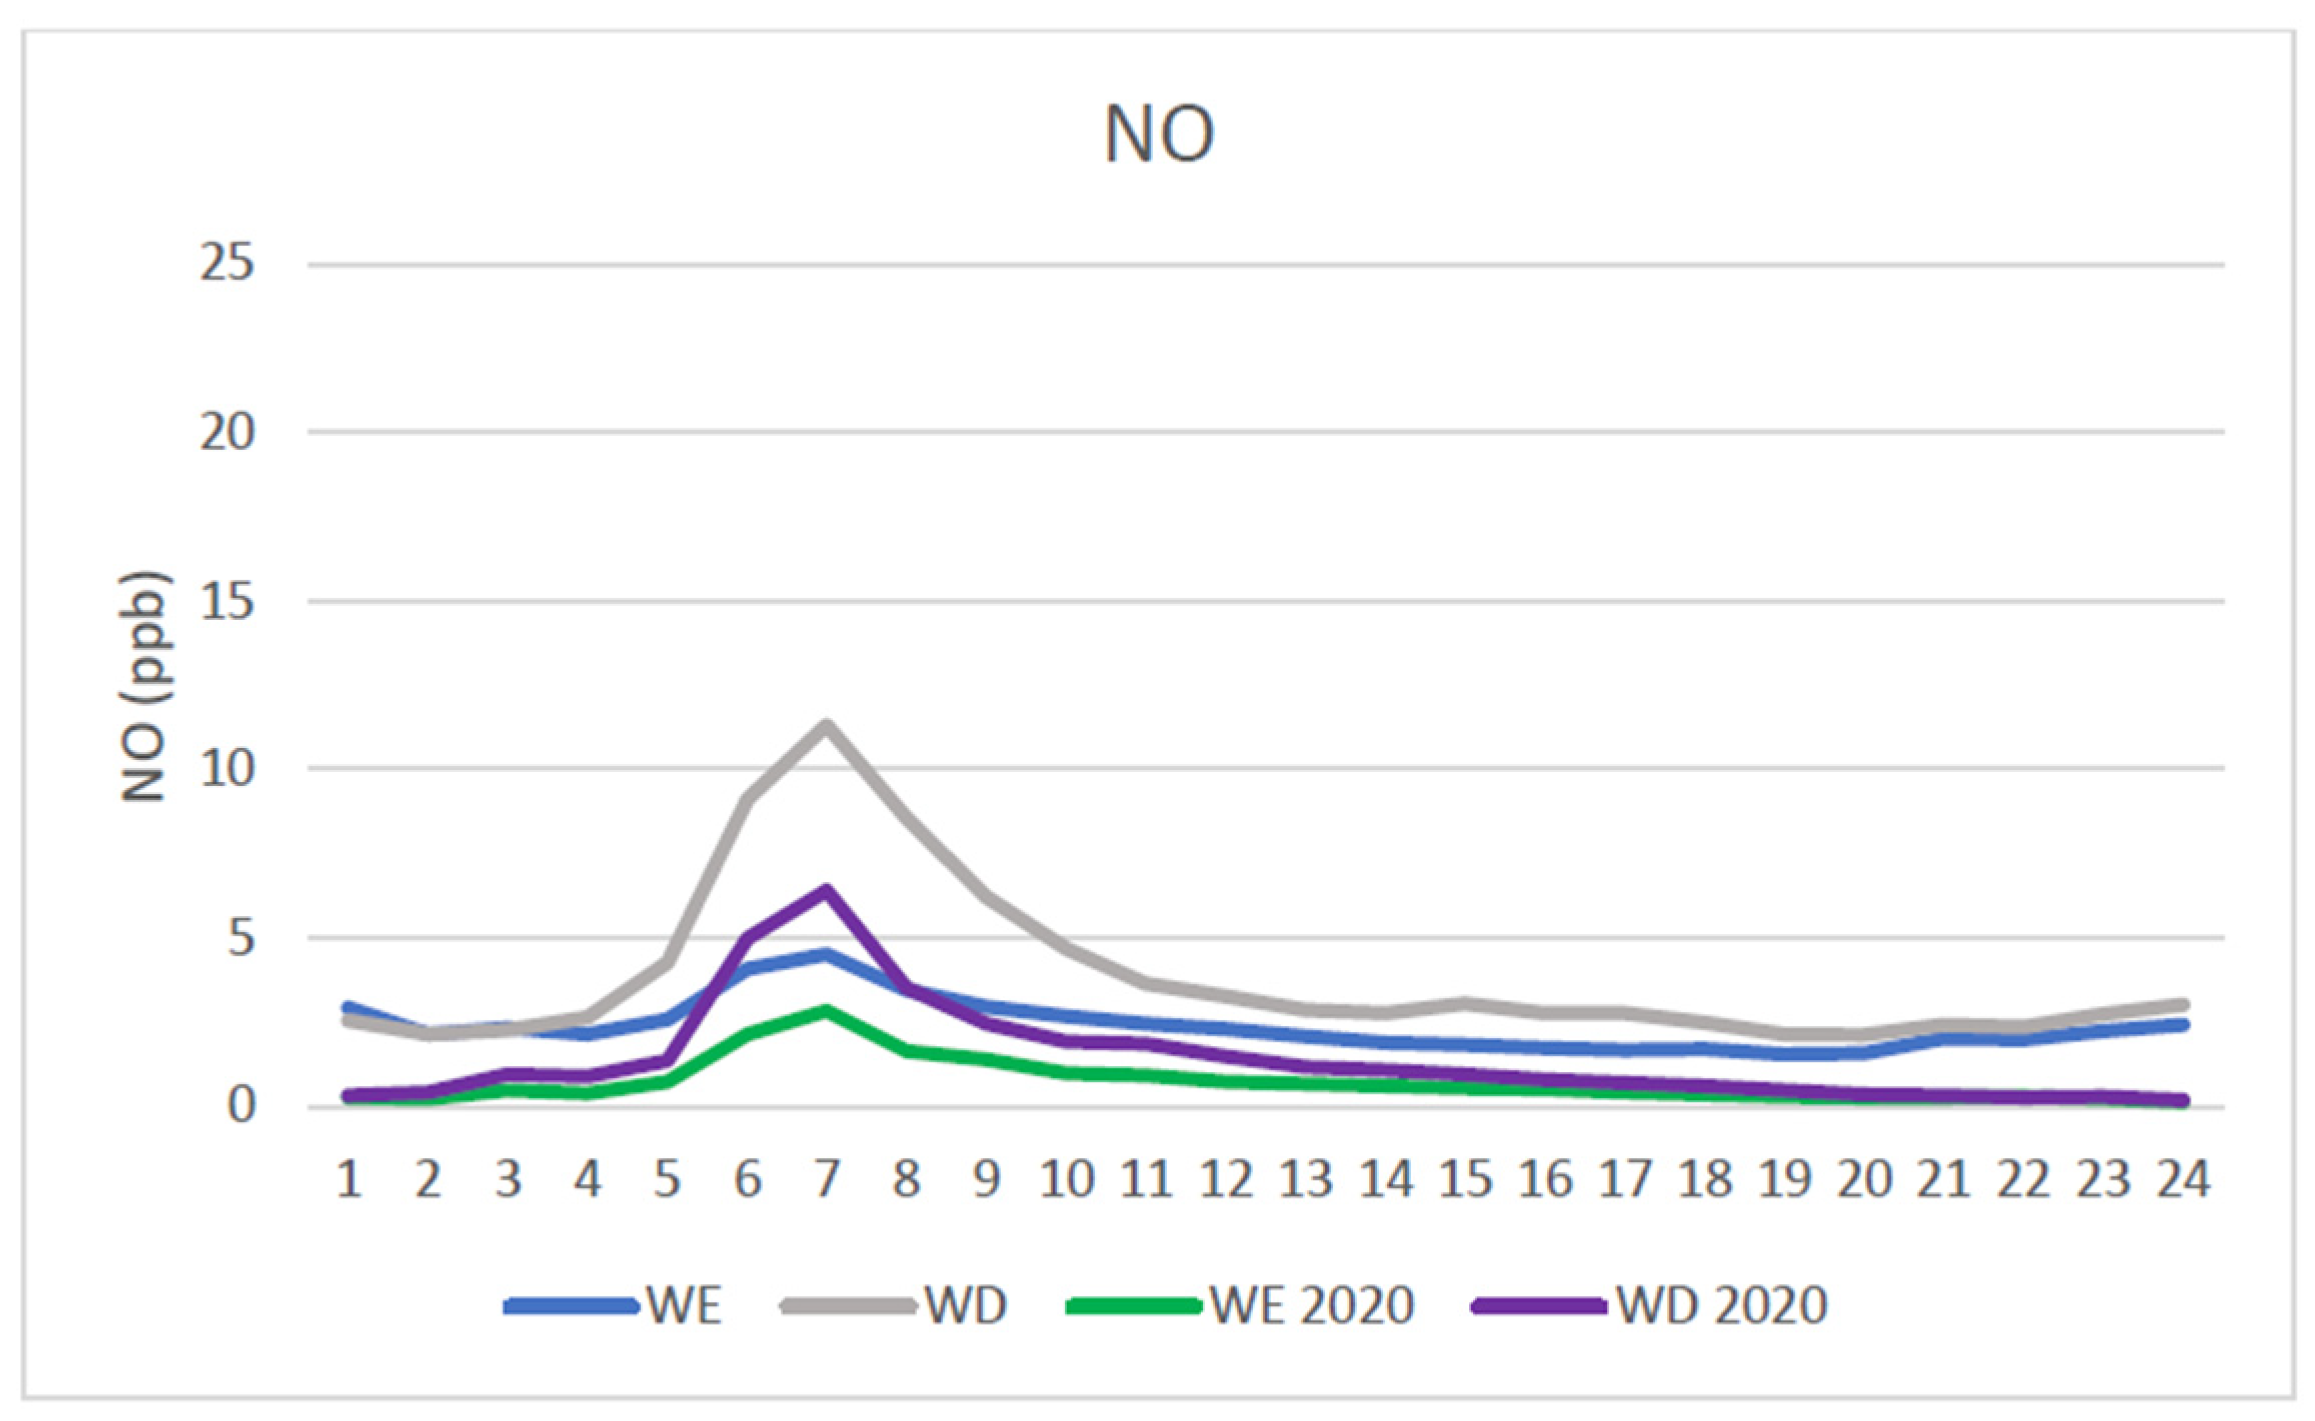
3.2. 2020 Data
3.3. Ranking Analysis
3.4. Fisher’s Exact Test
4. Discussion
5. Conclusions
Author Contributions
Funding
Institutional Review Board Statement
Informed Consent Statement
Data Availability Statement
Conflicts of Interest
References
- Menut, L.; Bessagnet, B.; Siour, G.; Mailler, S.; Pennel, R.; Cholakian, A. Impact of lockdown measures to combat Covid-19 on air quality over western Europe. Sci. Total Environ. 2020, 741, 140426. [Google Scholar] [CrossRef] [PubMed]
- Shi, X.; Brasseur, G.P. The response in air quality to the reduction of Chinese economic activities during the COVID-19 outbreak. Geophys. Res. Lett. 2020, 47, e2020GL088070. [Google Scholar] [CrossRef] [PubMed]
- Dutheil, F.; Baker, J.S.; Navel, V. COVID-19 as a factor influencing air pollution? Environ. Pollut. 2020, 263, 114466. [Google Scholar] [CrossRef] [PubMed]
- Bao, R.; Zhang, A. Does lockdown reduce air pollution? Evidence from 44 cities in northern China. Sci. Total Environ. 2020, 731, 139052. [Google Scholar] [CrossRef]
- Krecl, P.; Targino, A.C.; Oukawa, G.Y.; Cassino Junior, R.P. Drop in urban air pollution from COVID-19 pandemic: Policy implications for the megacity of São Paulo. Environ. Pollut. 2020, 265, 114883. [Google Scholar] [CrossRef] [PubMed]
- Rodríguez-Urrego, D.; Rodríguez-Urrego, L. Air quality during the COVID-19: PM2.5 analysis in the 50 most polluted capital cities in the world. Environ. Pollut. 2020, 266, 115042. [Google Scholar] [CrossRef]
- Kerimray, A.; Baimatova, N.; Ibragimova, O.P.; Bukenov, B.; Kenessov, B.; Plotitsyn, P.; Karaca, F. Assessing air quality changes in large cities during COVID-19 lockdowns: The impacts of traffic-free urban conditions in Almaty, Kazakhstan. Sci. Total Environ. 2020, 730, 139179. [Google Scholar] [CrossRef]
- Li, L.; Li, Q.; Huang, L.; Wang, Q.; Zhu, A.; Xu, J.; Liu, Z.; Li, H.; Shi, L.; Li, R.; et al. Air quality changes during the COVID-19 lockdown over the Yangtze River Delta Region: An insight into the impact of human activity pattern changes on air pollution variation. Sci. Total Environ. 2020, 732, 139282. [Google Scholar] [CrossRef]
- Burnett, R.T.; Brook, J.R.; Yung, W.T.; Dales, R.E.; Krewski, D. Association between ozone and hospitalization for respiratory diseases in 16 Canadian cities. Environ. Res. 1997, 72, 24–31. [Google Scholar] [CrossRef]
- Huryn, S.M.; Gough, W.A. Impact of urbanization on the ozone weekday/weekend effect in Southern Ontario, Canada. Urban Clim. 2014, 8, 11–20. [Google Scholar] [CrossRef]
- Murphy, J.G.; Day, D.A.; Cleary, P.A.; Wooldridge, P.J.; Millet, D.B.; Goldstein, A.H.; Cohen, R.C. The weekend effect within and downwind of Sacramento: Part 1. Observations of ozone, nitrogen oxides and VOC reactivity. Atmos. Chem. Phys. Discuss. 2006, 6, 11427–11464. [Google Scholar] [CrossRef]
- Murphy, J.G.; Day, D.A.; Cleary, P.A.; Wooldridge, P.J.; Millet, D.B.; Goldstein, A.H.; Cohen, R.C. The weekend effect within and downwind of Sacramento: Part 2. Observational evidence for chemical and dynamical contributions. Atmos. Chem. Phys. Discuss. 2006, 6, 11971–12019. [Google Scholar]
- Geddes, J.A.; Murphy, J.G.; Wang, D.K. Long term changes in nitrogen oxides and volatile organic compounds in Toronto and the challenges facing local ozone control. Atmos. Environ. 2009, 43, 3407–3415. [Google Scholar] [CrossRef]
- Beekmann, M.; Vautard, R. A modelling study of photochemical regimes over Europe: Robustness and variability. Atmos. Chem. Phys. 2010, 10, 10067–10084. [Google Scholar] [CrossRef]
- Pusede, S.E.; Cohen, R.C. On the observed response of ozone to NOx and VOC reactivity reductions in San Joaquin Valley California 1995-present. Atmos. Chem. Phys. 2012, 12, 8323–8339. [Google Scholar] [CrossRef]
- Markakis, K.; Valari, M.; Colette, A.; Sanchez, O.; Perrussel, O.; Honore, C.; Vautard, R.; Klimont, Z.; Rao, S. Air-quality in the mid-21st century for the city of Paris under two climate scenarios; from regional to local scale. Atmos. Chem. Phys. 2014, 14, 95–136. [Google Scholar] [CrossRef][Green Version]
- Karl, T.; Graus, M.; Striednig, M.; Lamprecht, C.; Hammerle, A.; Wohlfahrt, G.; Held, A.; von der Heyden, L.; Deventer, M.J.; Krismer, A.; et al. Urban eddy covariance measurements reveal significant missing NOx emissions in Central Europe. Sci. Rep. 2017, 7, 2536. [Google Scholar] [CrossRef] [PubMed]
- Sicard, P.; Paoletti, E.; Agathokleous, E.; Araminiene, V.; Proietti, C.; Coulibaly, F.; DeMarco, A. Ozone weekend effect in cities: Deep insights for urban air pollution control. Environ. Res. 2020, 191, 110193. [Google Scholar] [CrossRef]
- Tang, G.; Wang, Y.; Li, X.; Ji, D.; Hsu, S.; Gao, X. Spatial-temporal variations in surface ozone in Northern China as observed during 2009–2010 and possible implications for future air quality control strategies. Atmos. Chem. Phys. 2012, 12, 2757–2776. [Google Scholar] [CrossRef]
- Xue, L.K.; Wang, T.; Gao, J.; Ding, A.J.; Zhou, X.H.; Blake, D.R.; Wang, X.F.; Saunders, S.M.; Fan, S.J.; Zuo, H.C.; et al. Ground-level ozone in four Chinese cities: Precursors, regional transport and heterogeneous processes. Atmos. Chem. Phys. 2014, 14, 13175–13188. [Google Scholar] [CrossRef]
- Brancher, M. Increased ozone pollution alongside reduced nitrogen dioxide concentrations during Vienna’s first COVID-19 lockdown: Significance for air quality management. Environ. Pollut. 2021, 284, 117193. [Google Scholar] [CrossRef] [PubMed]
- Cleveland, W.S.; Graedel, T.E.; Kleiner, B.; Warmer, J.L. Sunday and workday variations in the photochemical air pollution in New Jersey and New York. Science 1974, 186, 1037–1038. [Google Scholar] [CrossRef] [PubMed]
- Lebron, F. A comparison of weekend weekday ozone and hydrocarbon concentrations in the Baltimore Washington Metropolitan Area. Atmos. Environ. 1975, 9, 861–863. [Google Scholar] [CrossRef]
- Elkus, B.; Wilson, K.R. Photochemical air pollution: Weekend–weekday differences. Atmos. Environ. 1977, 11, 509–515. [Google Scholar] [CrossRef]
- Karl, T.R. Day of the week variations of photochemical pollutants in the St. Louis area. Atmos. Environ. 1978, 12, 1657–1667. [Google Scholar] [CrossRef]
- Beaney, G.; Gough, W.A. The influence of tropospheric ozone on the air temperature of the city of Toronto, Ontario, Canada. Atmos. Environ. 2002, 36, 2319–2325. [Google Scholar] [CrossRef]
- Sadanaga, Y.; Shibata, S.; Hamana, M.; Takenaka, N.; Bandow, H. Weekday/weekend differences of ozone and its precursors in urban areas of Japan, focusing on nitrogen oxides and hydrocarbons. Atmos. Environ. 2008, 42, 4708–4723. [Google Scholar] [CrossRef]
- Pudasainee, D.; Sapkota, B.; Bhatnagar, A.; Kim, S.H.; Seo, Y.C. Influence of weekdays, weekends, and bandhas on surface ozone in Kathmandu valley. Atmos. Res. 2010, 95, 150–156. [Google Scholar] [CrossRef]
- Pires, M. Ozone weekend effect analysis in three European urban areas. CLEAN-Soil Air Water 2012, 40, 790–797. [Google Scholar] [CrossRef]
- Castell-Balaguer, N.; Téllez, L.; Mantilla, E. Daily, seasonal and monthly variations in ozone levels recorded at the Turia river basin in Valencia (Eastern Spain). Environ. Sci. Pollut. Res. 2012, 19, 3461–3480. [Google Scholar] [CrossRef]
- Im, U.; Incecik, S.; Guler, M.; Tek, A.; Topcu, S.; Unal, Y.S.; Yenigun, O.; Kindap, T.; Odman, M.T.; Tayanç, M. Analysis of surface ozone and nitrogen oxides at urban, semi-rural and rural sites in Istanbul, Turkey. Sci. Total Environ. 2013, 443, 920–931. [Google Scholar] [CrossRef] [PubMed]
- Wolf, G.T.; Kalhbaum, D.F.; Heuss, J.M. The vanishing ozone weekday/weekend effect. J. Air Waste Manag. Assoc. 2013, 63, 292–299. [Google Scholar] [CrossRef] [PubMed]
- Wang, Z.S.; Li, Y.T.; Chen, T.; Zhang, D.W.; Sun, F.; Sun, R.W.; Dong, X.; Sun, N.D.; Pan, L.B. Temporal and spatial distribution characteristics of ozone in Beijing. Huan Jing Ke Xue 2014, 35, 4446–4453. [Google Scholar] [PubMed]
- Szep, R.; Matyas, L.; Keresztes, R.; Ghimpusan, M. Tropospheric ozone concentrations-seasonal and daily analysis and its association with NO and NO2 as a function of NOx in Ciuc depression—Romania. Rev. Chim. 2016, 67, 205–213. [Google Scholar]
- Yao, X.; Lau, N.T.; Chan, C.K.; Fang, M. The use of tunnel concentration profile data to determine the ratio of NO2/NOx directly emitted from vehicles. Atmos. Chem. Phys. Discuss. 2005, 5, 12723–12740. [Google Scholar]
- Adams, M.D. Air pollution in Ontario, Canada during the COVID-19 state of emergency. Sci. Total Environ. 2020, 742, 140516. [Google Scholar] [CrossRef] [PubMed]
- Adam, M.G.; Tran, P.T.M.; Balasubramanian, R. Air quality changes in cities during the COVID-19 lockdown: A critical review. Atmos. Res. 2021, 264, 105823. [Google Scholar] [CrossRef] [PubMed]
- Dantas, G.; Siciliano, B.; França, B.B.; da Silva, C.M.; Arbilla, G. The impact of COVID-19 partial lockdown on the air quality of the city of Rio de Janeiro, Brazil. Sci. Total Environ. 2020, 729, 139085. [Google Scholar] [CrossRef]
- Grange, S.K.; Lee, J.D.; Drysdale, W.S.; Lewis, A.C.; Hueglin, C.; Emmenegger, L.; Carslaw, D.C. COVID-19 lockdowns highlight a risk of increasing ozone pollution in European urban areas. Atmos. Chem. Phys. 2021, 21, 4169–4185. [Google Scholar] [CrossRef]
- Keller, C.A.; Evans, M.J.; Knowland, K.E.; Hasenkopf, C.A.; Modekurty, S.; Lucchesi, R.A.; Oda, T.; Franca, B.B.; Mandarino, F.C.; Díaz Suarez, M.V.; et al. Global impact of COVID-19 restrictions on the atmospheric concentrations of nitrogen dioxide and ozone. Atmos. Chem. Phys. 2021, 21, 3555–3592. [Google Scholar] [CrossRef]
- Lovri, M.; Pavlovi, K.; Vukovi, M.; Grange, S.K.; Haberl, M.; Kern, R. Understanding the true effects of the COVID-19 lockdown on air pollution by means of machine learning. Environ. Pollut. 2021, 274, 115900. [Google Scholar] [CrossRef]
- Luo, J.; Qin, G.; Cheng, J. Ozone pollution mitigation in Guangxi (south China) driven by meteorology and anthropogenic emissions during the COVID-19. Environ. Pollut. 2020, 272, 115927. [Google Scholar] [CrossRef]
- Miyazaki, K.; Bowman, K.; Sekiya, T.; Jiang, Z.; Chen, X.; Eskes, H.; Ru, M.; Zhang, Y.; Shindell, D. Air quality response in China linked to the 2019 novel Coronavirus (COVID-19) lockdown. Geophys. Res. Lett. 2020, 47, e2020GL089252. [Google Scholar] [CrossRef] [PubMed]
- Ordonez, C.; Garrido-Perez, J.M.; García-Herrera, R. Early spring near-surface ozone in Europe during the COVID-19 shutdown: Meteorological effects outweigh emission changes. Sci. Total Environ. 2020, 747, 141322. [Google Scholar] [CrossRef] [PubMed]
- Qi, J.; Mo, Z.; Yuan, B.; Huang, S.; Huangfu, Y.; Wang, Z.; Li, X.; Yang, S.; Wang, W.; Zhao, Y.; et al. An observation approach in evaluation of ozone production to precursor changes during the COVID-19 lockdown. Atmos. Environ. 2021, 262, 118618. [Google Scholar] [CrossRef] [PubMed]
- Sicard, P.; De Marco, A.; Agathokleous, E.; Feng, Z.; Xu, X.; Paoletti, E.; Rodriguez, J.J.D.; Calatayud, V. Amplified ozone pollution in cities during the COVID-19 lockdown. Sci. Total Environ. 2020, 735, 139542. [Google Scholar] [CrossRef]
- Siciliano, B.; Dantas, G.; Cleyton, M.; Arbilla, G. Increased ozone levels during the COVID-19 lockdown: Analysis for the city of Rio de Janeiro, Brazil. Sci. Total Environ. 2020, 737, 139765. [Google Scholar] [CrossRef]
- Singh, V.; Singh, S.; Biswal, A.; Kesarkar, A.P.; Mor, S.; Ravindra, K. Diurnal and temporal changes in air pollution during COVID-19 strict lockdown over different regions of India. Environ. Pollut. 2020, 266, 115368. [Google Scholar] [CrossRef]
- Soni, M.; Ojha, N.; Girach, I. Impact of COVID-19 lockdown on surface ozone build-up at an urban site in western India based on photochemical box modelling. Curr. Sci. 2021, 120, 376–381. [Google Scholar] [CrossRef]
- Trebrewal, K.; Venkataraman, C. COVID-19 lockdown closures of emissions sources in India: Lessons for air quality and climate policy. J. Environ. Manag. 2022, 302, 114079. [Google Scholar] [CrossRef]
- Conticini, E.; Frediani, B.; Caro, D. Can atmospheric pollution be considered a co-factor in extremely high level of SARS-CoV-2 lethality in Northern Italy? Environ. Pollut. 2020, 261, 114465. [Google Scholar] [CrossRef] [PubMed]
- Fattorini, D.; Regoli, F. Role of the chronic air pollution levels in the Covid-19 outbreak risk in Italy. Environ. Pollut. 2020, 264, 114732. [Google Scholar] [CrossRef] [PubMed]
- Delnevo, G.; Mirri, S.; Roccetti, M. Particulate matter and COVID-19 disease diffusion in Emilia-Romagna (Italy). Already a cold case? Computation 2020, 8, 59. [Google Scholar] [CrossRef]
- Zhu, Y.; Xie, J.; Huang, F.; Cao, L. Association between short-term exposure to air pollution and COVID-19 infection: Evidence from China. Sci. Total Environ. 2020, 727, 138704. [Google Scholar] [CrossRef]
- Brauer, M.; Reynolds, C.; Hystad, P. Traffic-related air pollution and health in Canada. CMAJ 2013, 185, 1557–1558. [Google Scholar] [CrossRef]
- Follinsbee, L.J. Human Health Effects of Air Pollution. Environ. Health Perspect. 1992, 100, 45–56. [Google Scholar] [CrossRef]
- Lippmann, M. Health Effects of Ozone: A Critical Review. JAPCA 1989, 39, 672–695. [Google Scholar] [CrossRef]
- Health Canada. Health Impacts of Air Pollution in Canada: Estimates of Premature Deaths and Nonfatal Outcomes—2021 Report. ISBN 978-0-660-37331-7. Available online: https://www.canada.ca/en/health-canada/services/publications/healthy-living/2021-health-effects-indoor-air-pollution.html (accessed on 20 January 2022).
- Kampa, M.; Castanas, E. Human health effects of air pollution. Environ. Pollut. 2008, 151, 362–367. [Google Scholar] [CrossRef]
- Nuvolone, D.; Petri, D.; Voller, F. The effects of ozone on human health. Environ. Sci. Pollut. Res. 2018, 25, 8074–8088. [Google Scholar] [CrossRef]
- Kumar, A.; Gough, W.; Yap, D. Weekend/weekday effect for tropospheric ozone events in Ontario, Canada. CMOS Bull. 1999, 27, 3–7. [Google Scholar]
- Leung, K.H.Y.; Arnillas, C.A.; Cheng, V.Y.S.; Gough, W.A.; Arhonditsis, G.B. Seasonality patterns and distinctive signature of latitude and population on ozone concentrations in Southern Ontario, Canada. Atmos. Environ. 2021, 246, 118077. [Google Scholar] [CrossRef]


| NO | 2010–2019 Baseline | 2020 | % Difference |
|---|---|---|---|
| TE-WE | 2.38 | 0.72 | −69.7 |
| TW-WE | 3.21 | 1.51 | −53.1 |
| TE-WD | 3.84 | 1.41 | −63.4 |
| TW-WD | 7.56 | 4.07 | −46.2 |
| NO2 | 2010–2019 Baseline | 2020 | % Difference |
|---|---|---|---|
| TE-WE | 14.06 | 5.53 | −60.7 |
| TW-WE | 11.55 | 7.41 | −35.8 |
| TE-WD | 14.98 | 7.29 | −51.3 |
| TW-WD | 16.45 | 11.35 | −31.0 |
| Ozone | 2010–2019 Baseline | 2020 | % Difference |
|---|---|---|---|
| TE-WE | 31.83 | 31.68 | −0.49 |
| TW-WE | 29.96 | 30.49 | 1.76 |
| TE-WD | 29.82 | 32.95 | 10.52 |
| TW-WD | 25.89 | 29.66 | 14.56 |
| WD | TE | TW |
|---|---|---|
| NO | 11 | 11 |
| NO2 | 11 | 11 |
| O3 | 1 | 1 |
| WE | TE | TW |
|---|---|---|
| NO | 11 | 11 |
| NO2 | 11 | 11 |
| O3 | 6 | 6 |
| WD | TE | TW |
|---|---|---|
| NO | 23 | 16 |
| NO2 | 18 | 18 |
| O3 | 12 | 18 |
| WE | TE | TW |
|---|---|---|
| NO | 21 | 9 |
| NO2 | 21 | 17 |
| O3 | 1 | 1 |
Publisher’s Note: MDPI stays neutral with regard to jurisdictional claims in published maps and institutional affiliations. |
© 2022 by the authors. Licensee MDPI, Basel, Switzerland. This article is an open access article distributed under the terms and conditions of the Creative Commons Attribution (CC BY) license (https://creativecommons.org/licenses/by/4.0/).
Share and Cite
Gough, W.A.; Anderson, V. Changing Air Quality and the Ozone Weekend Effect during the COVID-19 Pandemic in Toronto, Ontario, Canada. Climate 2022, 10, 41. https://doi.org/10.3390/cli10030041
Gough WA, Anderson V. Changing Air Quality and the Ozone Weekend Effect during the COVID-19 Pandemic in Toronto, Ontario, Canada. Climate. 2022; 10(3):41. https://doi.org/10.3390/cli10030041
Chicago/Turabian StyleGough, William A., and Vidya Anderson. 2022. "Changing Air Quality and the Ozone Weekend Effect during the COVID-19 Pandemic in Toronto, Ontario, Canada" Climate 10, no. 3: 41. https://doi.org/10.3390/cli10030041
APA StyleGough, W. A., & Anderson, V. (2022). Changing Air Quality and the Ozone Weekend Effect during the COVID-19 Pandemic in Toronto, Ontario, Canada. Climate, 10(3), 41. https://doi.org/10.3390/cli10030041