
Carbon Dynamics in Rewetted Tropical Peat Swamp Forests

Abstract
:1. Introduction
2. Methods
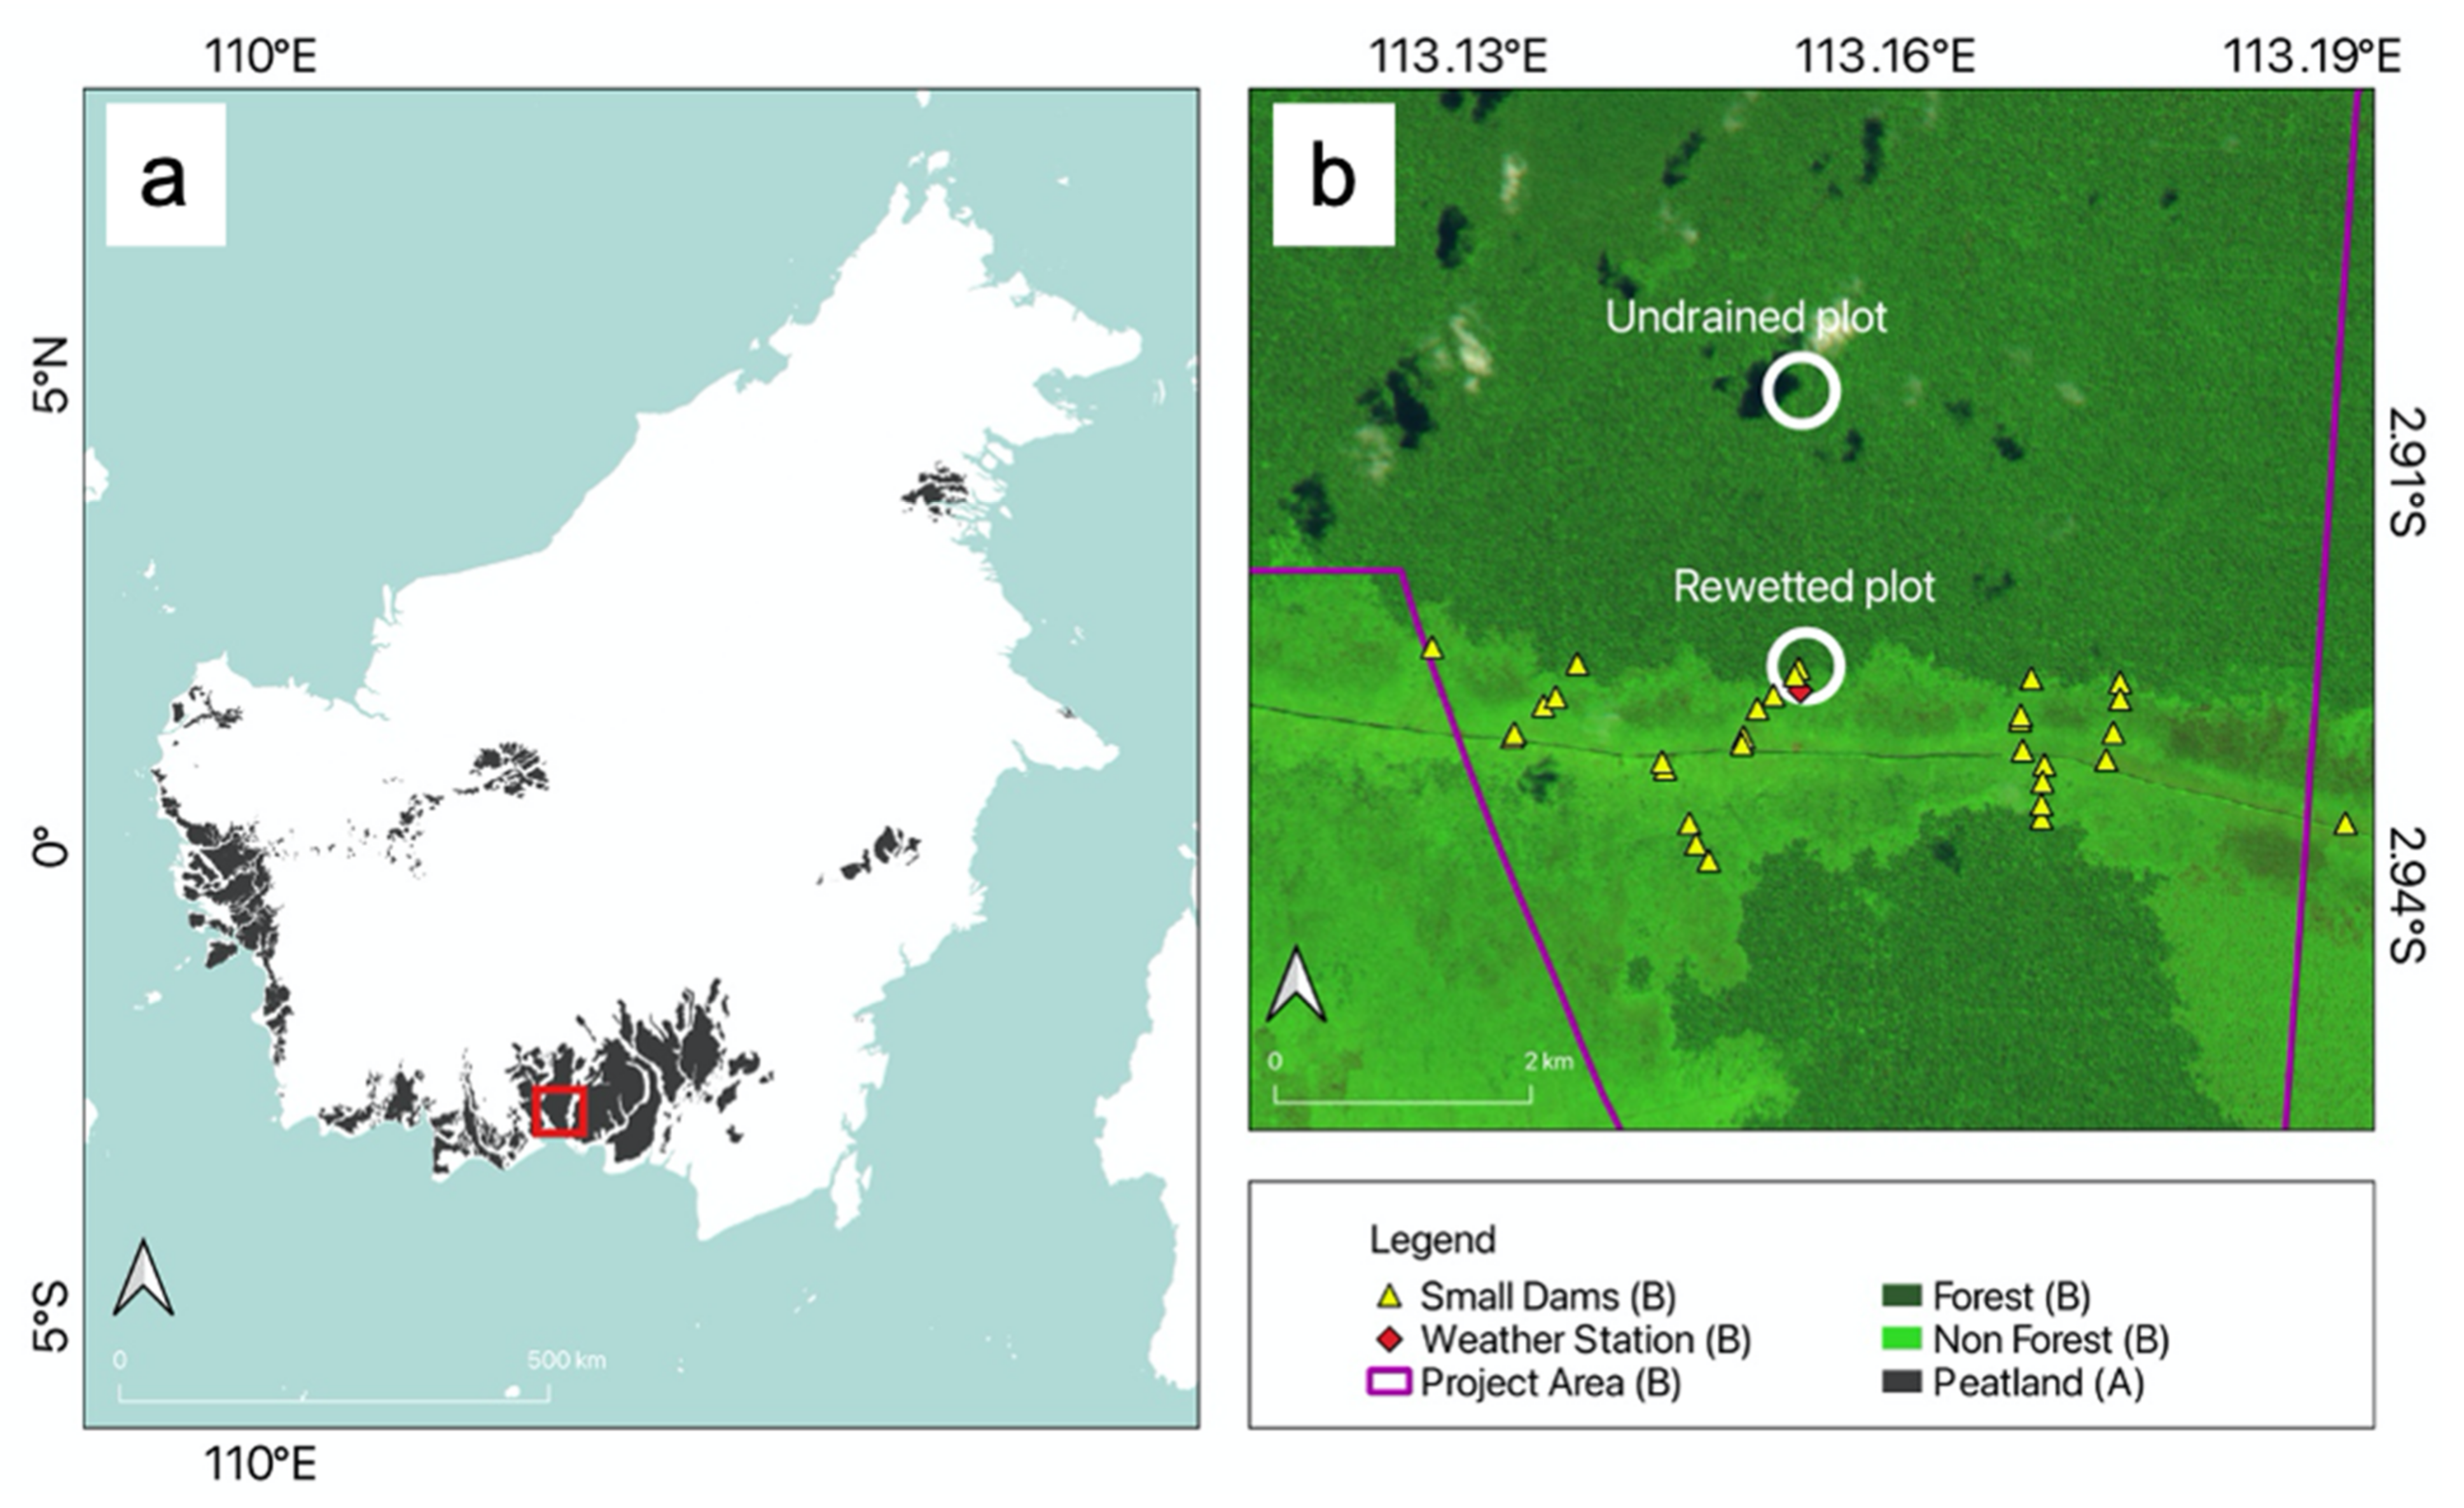
2.1. Study Sites
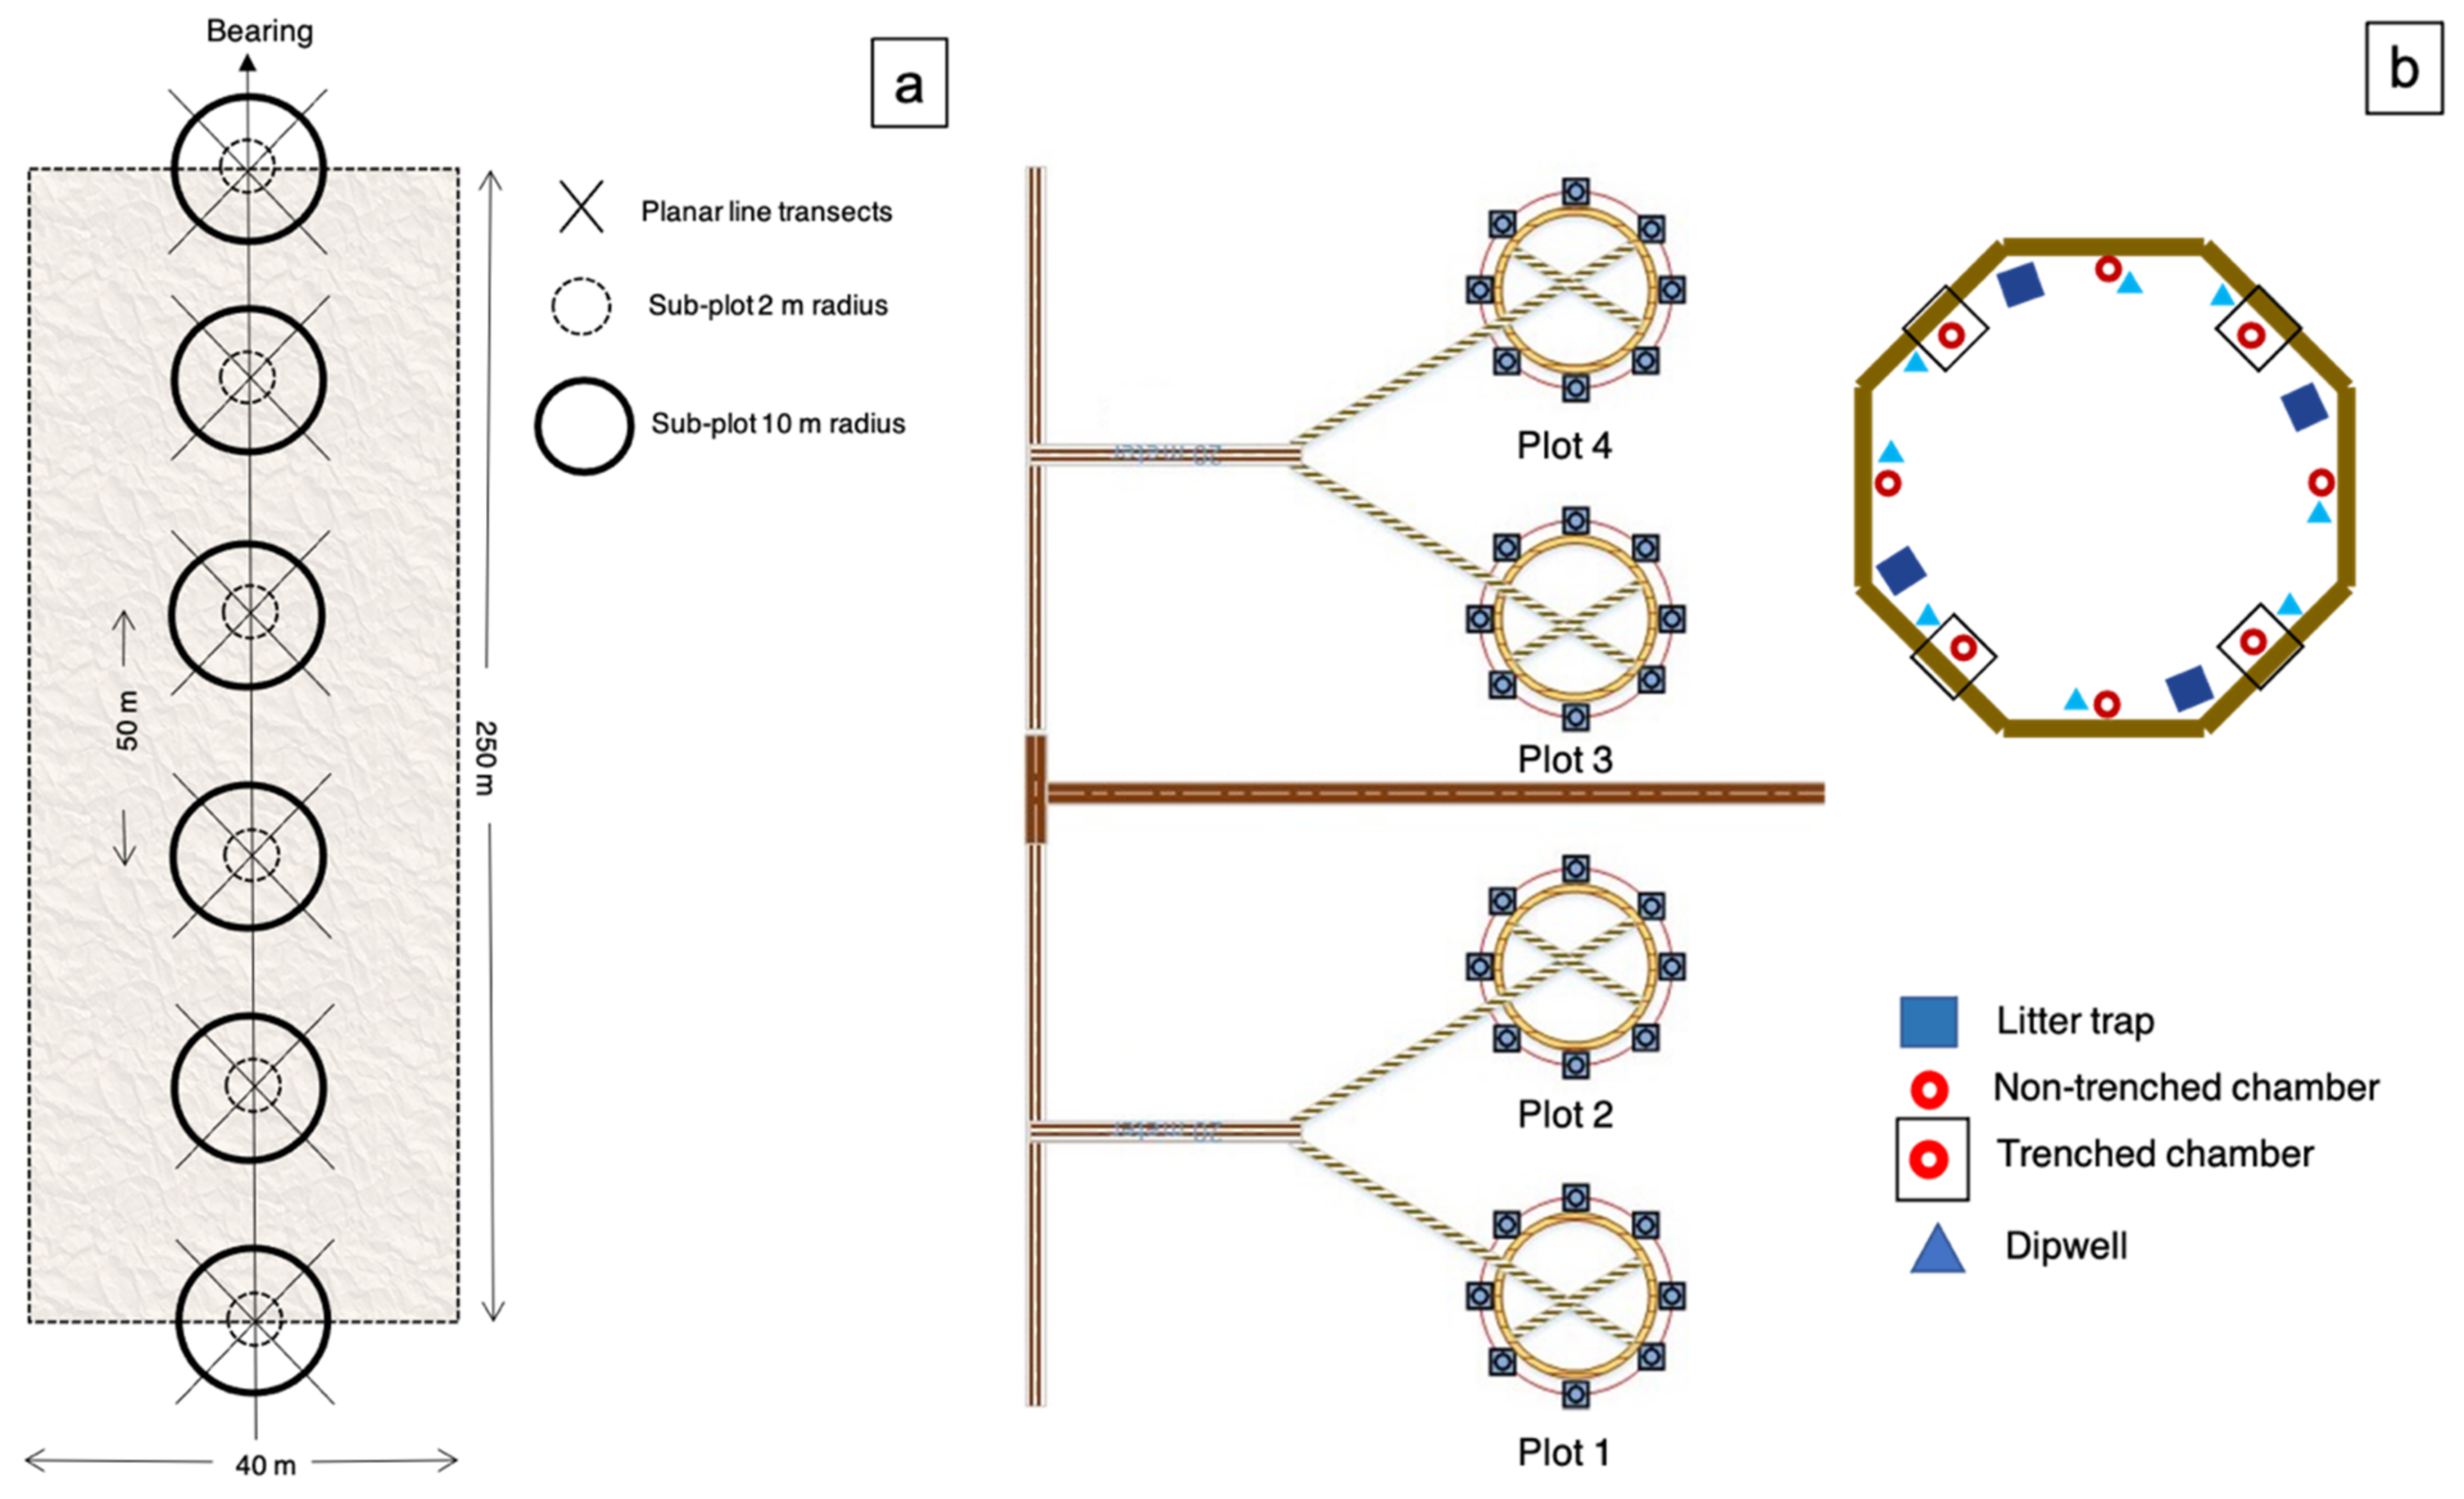
2.2. Carbon Stock and Forest Composition Field Sampling
2.3. Litterfall
2.4. Heterotrophic Component of Soil Respiration (Rh) and Methane Emission
2.5. DOC and POC
2.6. Ground Water Level (GWL)
2.7. Statistical Analysis
3. Results
3.1. Biophysical Properties and Carbon Stock
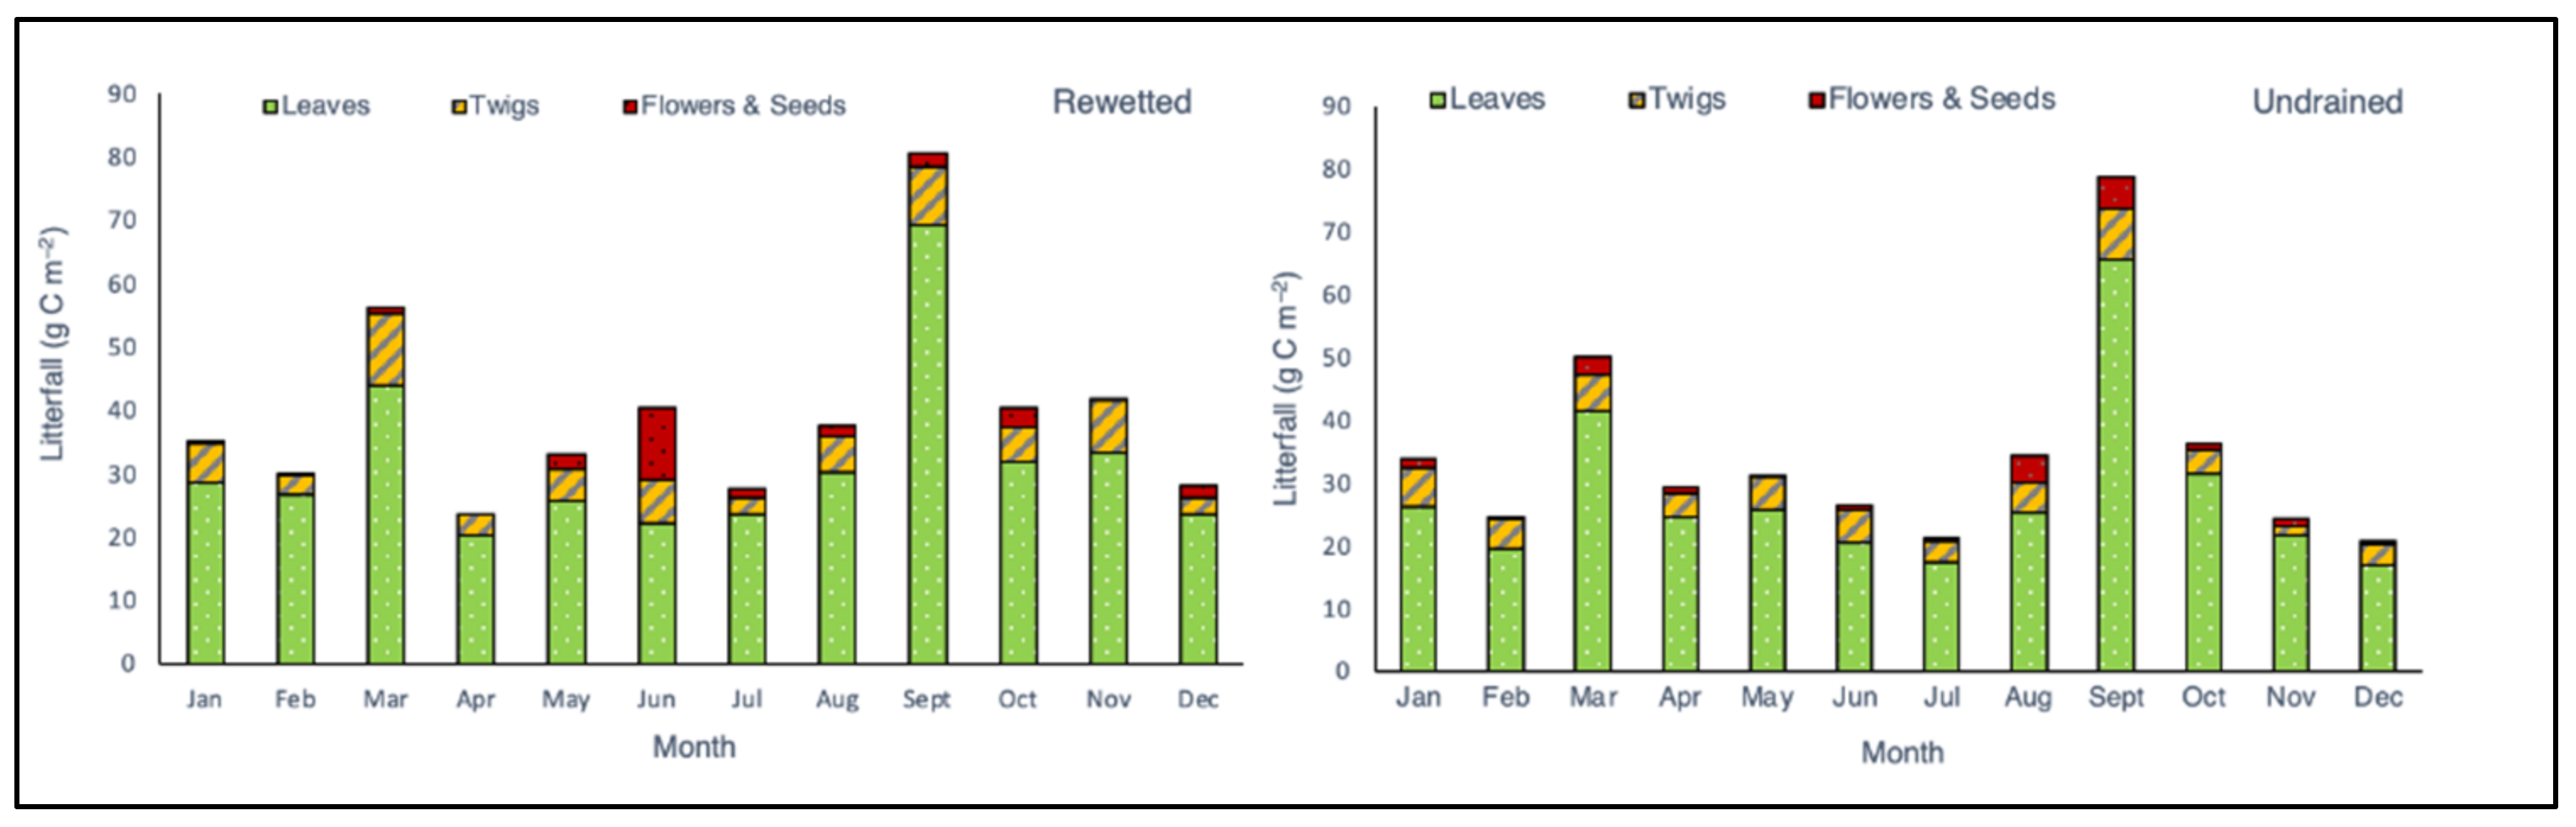
3.2. Litterfall Production
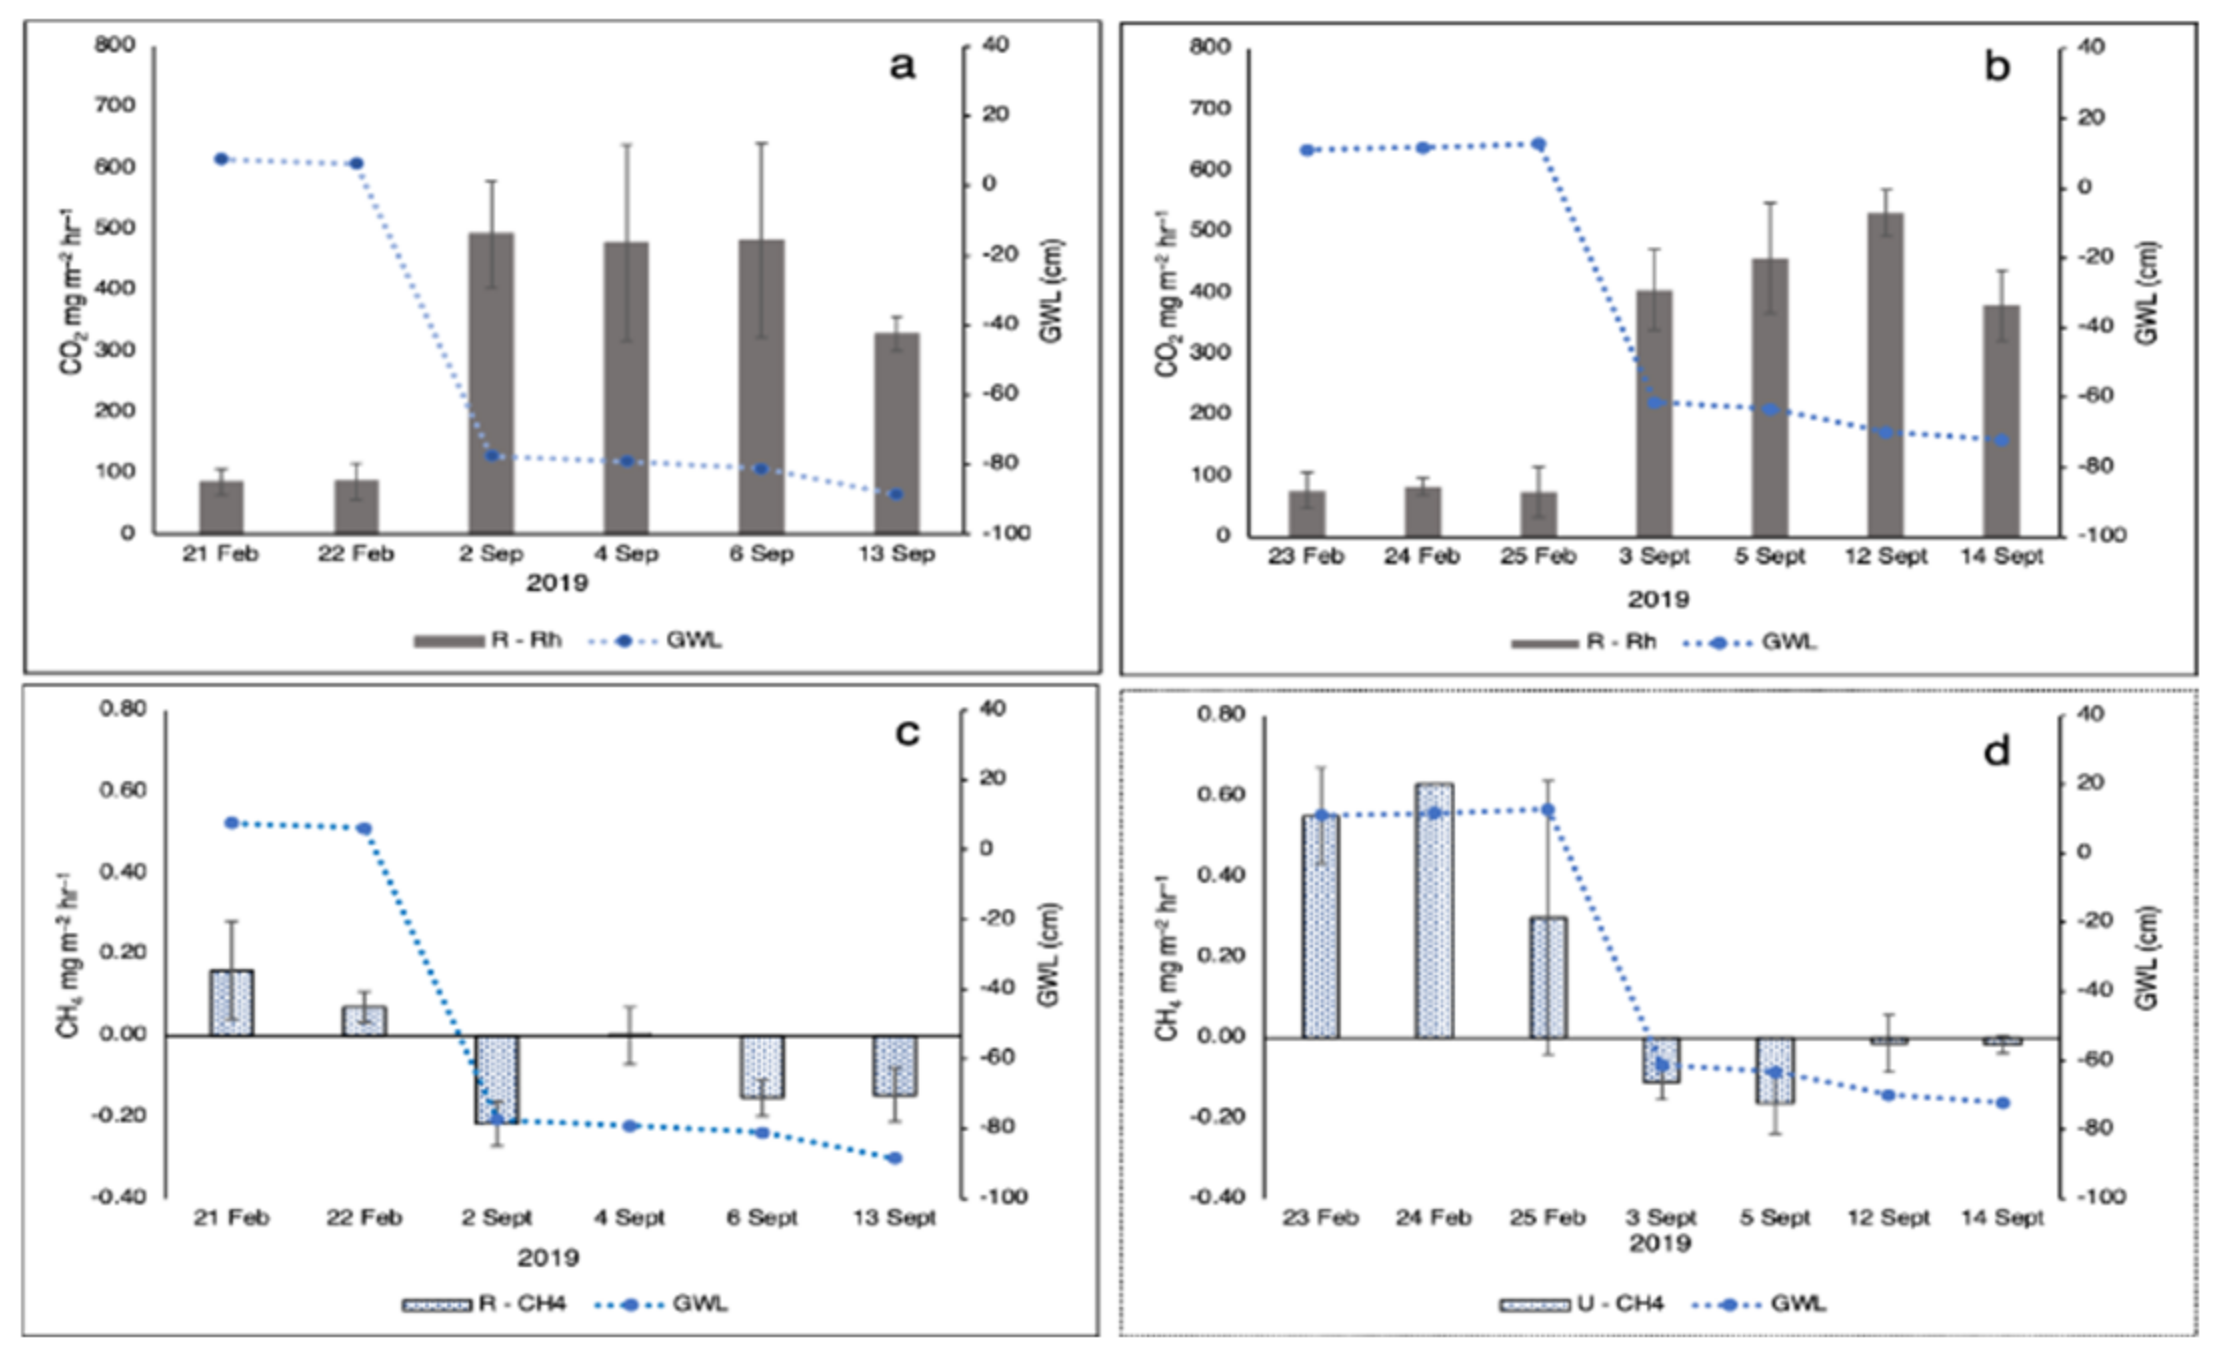
3.3. Heterotrophic Respiration (Rh), CH4 Emission, and DOC
4. Discussion
4.1. Carbon Stock and Peat Properties in Rewetted Tropical PSFs
4.2. Effect of Rewetting Intervention on Rh, CH4 Emission, and DOC
4.3. Effect of Rewetting on Litter Productions
5. Conclusions
Supplementary Materials
Author Contributions
Funding
Data Availability Statement
Acknowledgments
Conflicts of Interest
References
- Chaudhary, N.; Westermann, S.; Lamba, S.; Shurpali, N.; Sannel, A.B.K.; Schurgers, G.; Miller, P.A.; Smith, B. Modelling past and future peatland carbon dynamics across the pan-Arctic. Glob. Chang. Biol. 2020, 26, 4119–4133. [Google Scholar] [CrossRef] [PubMed] [Green Version]
- Heimann, M.; Reichstein, M. Nature; Nature Publishing Group: London, UK, 2008; pp. 289–292. [Google Scholar]
- Miettinen, J.; Hooijer, A.; Vernimmen, R.; Liew, S.C.; Page, S.E. From carbon sink to carbon source: Extensive peat oxidation in insular Southeast Asia since 1990. Environ. Res. Lett. 2017, 12, 024014. [Google Scholar] [CrossRef]
- Warren, M.; Frolking, S.; Dai, Z.; Kurnianto, S. Impacts of land use, restoration, and climate change on tropical peat carbon stocks in the twenty-first century: Implications for climate mitigation. Mitig. Adapt. Strateg. Glob. Chang. 2017, 22, 1041–1061. [Google Scholar] [CrossRef] [PubMed] [Green Version]
- Hirano, T.; Segah, H.; Harada, T.; Limin, S.; June, T.; Hirata, R.; Osaki, M. Carbon dioxide balance of a tropical peat swamp forest in Kalimantan, Indonesia. Glob. Chang. Biol. 2007, 13, 412–425. [Google Scholar] [CrossRef]
- Nugent, K.A.; Strachan, I.B.; Roulet, N.T.; Strack, M.; Frolking, S.; Helbig, M. Prompt active restoration of peatlands substantially reduces climate impact. Environ. Res. Lett. 2019, 14, 124030. [Google Scholar] [CrossRef]
- Leifeld, J.; Menichetti, L. The underappreciated potential of peatlands in global climate change mitigation strategies. Nat. Commun. 2018, 9, 5336. [Google Scholar] [CrossRef] [Green Version]
- Haddaway, N.R.; Burden, A.; Evans, C.D.; Healey, J.R.; Jones, D.L.; Dalrymple, S.E.; Pullin, A.S. Evaluating effects of land management on greenhouse gas fluxes and carbon balances in boreo-temperate lowland peatland systems. Environ. Evid. 2014, 3, 5. [Google Scholar] [CrossRef] [Green Version]
- Jauhiainen, J.; Page, S.; Vasander, H. Greenhouse gas dynamics in degraded and restored tropical peatlands. Mires Peat 2016, 17, 1–12. [Google Scholar] [CrossRef]
- Wilson, D.; Blain, D.; Cowenberg, J.; Evans, C.D.; Murdiyarso, D.; Page, S.E.; Renou-Wilson, F.; Rieley, J.O.; Sirin, A.; Strack, M.; et al. Greenhouse gas emission factors associated with rewetting of organic soils. Mires Peat 2016, 17, 1–28. [Google Scholar] [CrossRef]
- Limpens, J.; Berendse, F.; Blodau, C.; Canadel, J.G.; Freeman, C.; Holden, J.; Roulet, N.; Rydin, H.; Schaepman-Strub, G. Erratum: Peatlands and the carbon cycle: From local processes to global implications a synthesis. Biogeosciences 2008, 5, 1739. [Google Scholar] [CrossRef] [Green Version]
- Chimner, R.A.; Cooper, D.J.; Wurster, F.C.; Rochefort, L. An overview of peatland restoration in North America: Where are we after 25 years? Restor. Ecol. 2017, 25, 283–292. [Google Scholar] [CrossRef]
- Giesen, W.; Sari, E.N.N. Tropical Peatland Restoration Report: The Indonesian Case; Millenium Challenge Account: Jakarta, Indonesia, 2018. [Google Scholar]
- Sutikno, S.; Nasrul, B.; Gunawan, H.; Jayadi, R.; Rinaldi; Saputra, E.; Yamamoto, K. The effectiveness of canal blocking for hydrological restoration in tropical peatland. In Proceedings of the MATEC Web of Conferences, Bali, Indonesia, 24–25 October 2019; Volume 276, pp. 1–7. [Google Scholar]
- Lazcano, C.; Deol, A.S.; Brummell, M.E.; Strack, M. Interactive effects of vegetation and water table depth on belowground C and N mobilization and greenhouse gas emissions in a restored peatland. Plant Soil 2020, 448, 299–313. [Google Scholar] [CrossRef]
- Kitson, E.; Bell, N.G.A. The Response of Microbial Communities to Peatland Drainage and Rewetting. A Review. Front. Microbiol. 2020, 11, 582812. [Google Scholar] [CrossRef] [PubMed]
- Nurulita, Y.; Adetutu, E.M.; Gunawan, H.; Zul, D.; Ball, A.S. Restoration of tropical peat soils: The application of soil microbiology for monitoring the success of the restoration process. Agric. Ecosyst. Environ. 2016, 216, 293–303. [Google Scholar] [CrossRef]
- Negassa, W.; Acksel, A.; Eckhardt, K.U.; Regier, T.; Leinweber, P. Soil organic matter characteristics in drained and rewetted peatlands of northern Germany: Chemical and spectroscopic analyses. Geoderma 2019, 353, 468–481. [Google Scholar] [CrossRef]
- Liu, H.; Price, J.; Rezanezhad, F.; Lennartz, B. Centennial-Scale Shifts in Hydrophysical Properties of Peat Induced by Drainage. Water Resour. Res. 2020, 56. [Google Scholar] [CrossRef]
- Xu, S.; Liu, X.; Li, X.; Tian, C. Soil organic carbon changes following wetland restoration: A global meta-analysis. Geoderma 2019, 353, 89–96. [Google Scholar] [CrossRef]
- Urbanová, Z.; Bárta, J. Recovery of methanogenic community and its activity in long-term drained peatlands after rewetting. Ecol. Eng. 2020, 150, 105852. [Google Scholar] [CrossRef]
- Urbanová, Z.; Picek, T.; Hájek, T.; Bufková, I.; Tuittila, E.S. Vegetation and carbon gas dynamics under a changed hydrological regime in central European peatlands. Plant Ecol. Divers. 2012, 5, 89–103. [Google Scholar] [CrossRef]
- Green, S.M.; Baird, A.J.; Holden, J.; Reed, D.; Birch, K.; Jones, P. An experimental study on the response of blanket bog vegetation and water tables to ditch blocking. Wetl. Ecol. Manag. 2017, 25, 703–716. [Google Scholar] [CrossRef]
- Negassa, W.; Baum, C.; Schlichting, A.; Müller, J.; Leinweber, P. Small-scale spatial variability of soil chemical and biochemical properties in a rewetted degraded Peatland. Front. Environ. Sci. 2019, 7, 116. [Google Scholar] [CrossRef] [Green Version]
- Zhong, Y.; Jiang, M.; Middleton, B.A. Effects of water level alteration on carbon cycling in peatlands. Ecosyst. Health Sustain. 2020, 6, 1806113. [Google Scholar] [CrossRef]
- Upton, A.; Vane, C.H.; Girkin, N.; Turner, B.L.; Sjögersten, S. Does litter input determine carbon storage and peat organic chemistry in tropical peatlands? Geoderma 2018, 326, 76–87. [Google Scholar] [CrossRef]
- Lyons, C.L.; Lindo, Z. Above- and belowground community linkages in boreal peatlands. Plant Ecol. 2020, 221, 615–632. [Google Scholar] [CrossRef]
- Munir, T.M.; Xu, B.; Perkins, M.; Strack, M. Responses of carbon dioxide flux and plant biomass to water table drawdown in a treed peatland in Northern Alberta: A climate change perspective. Biogeosciences 2014, 11, 807–820. [Google Scholar] [CrossRef] [Green Version]
- Moore, S.; Gauci, V.; Evans, C.D.; Page, S.E. Fluvial organic carbon losses from a Bornean blackwater river. Biogeosciences 2011, 8, 901–909. [Google Scholar] [CrossRef] [Green Version]
- Moore, S.; Evans, C.D.; Page, S.E.; Garnett, M.H.; Jones, T.G.; Freeman, C.; Hooijer, A.; Wiltshire, A.J.; Limin, S.H.; Gauci, V. Deep instability of deforested tropical peatlands revealed by fluvial organic carbon fluxes. Nature 2013, 493, 660–663. [Google Scholar] [CrossRef] [Green Version]
- Kurnianto, S.; Warren, M.; Talbot, J.; Kauffman, B.; Murdiyarso, D.; Frolking, S. Carbon accumulation of tropical peatlands over millennia: A modeling approach. Glob. Chang. Biol. 2015, 21, 431–444. [Google Scholar] [CrossRef]
- Swenson, M.M.; Regan, S.; Bremmers, D.T.H.; Lawless, J.; Saunders, M.; Gill, L.W. Carbon balance of a restored and cutover raised bog: Implications for restoration and comparison to global trends. Biogeosciences 2019, 16, 713–731. [Google Scholar] [CrossRef] [Green Version]
- Peacock, M.; Gauci, V.; Baird, A.J.; Burden, A.; Chapman, P.J.; Cumming, A.; Evans, J.G.; Grayson, R.P.; Holden, J.; Kaduk, J.; et al. The full carbon balance of a rewetted cropland fen and a conservation-managed fen. Agric. Ecosyst. Environ. 2019, 269, 1–12. [Google Scholar] [CrossRef]
- Strack, M.; Zuback, Y.C.A. Annual carbon balance of a peatland 10 yr following restoration. Biogeosciences 2013, 10, 2885–2896. [Google Scholar] [CrossRef] [Green Version]
- Darusman, T.; Lestari, D.P.; Arriyadi, D. Management Practice and Restoration of the Peat Swamp Forest in Katingan-Mentaya, Indonesia. In Tropical Peatland Eco-Management; Osaki, M., Tsuji, N., Foead, N., Rieley, J., Eds.; Springer: Singapore, 2021; pp. 381–409. ISBN 978-981-33-4654-3. [Google Scholar]
- Novita, N.; Kauffman, J.B.; Hergoualc’h, K.; Murdiyarso, D.; Tryanto, D.H.; Jupesta, J. Carbon stocks from peat swamp forest and oil palm plantation in central kalimantan, indonesia. In Climate Change Research, Policy and Actions in Indonesia; Springer International Publishing: Berlin/Heidelberg, Germany, 2021; pp. 203–227. ISBN 9783030555368. [Google Scholar]
- Kauffman, J.B.; Arifanti, V.; Basuki, I.; Kurnianto, S.; Novita, N.; Murdiyarso, D.; Donato, D.; Warren, M. Protocols for the Measurement, Monitoring, and Reporting of Structure, Biomass, Carbon Stocks and Greenhouse Gas Emissions in Tropical Peat Swamp Forests; Center for International Forestry Research (CIFOR): Bogor, Indonesia, 2016. [Google Scholar]
- Suwarna, U.; Elias, E.; Darusman, D.; Istomo, I. Estimation of Total Carbon Stocks in Soil and Vegetation of Tropical Peat Forest in Indonesia. J. Manaj. Hutan Trop. J. Trop. For. Manag. 2012, 18, 118–128. [Google Scholar] [CrossRef] [Green Version]
- Yu, Z.C. Northern peatland carbon stocks and dynamics: A review. Biogeosciences 2012, 9, 4071–4085. [Google Scholar] [CrossRef] [Green Version]
- Djufri, D.; Wardiah, W.; Muchlisin, Z.A. Plants diversity of the deforested peat-swamp forest of Tripa, Indonesia. Biodiversitas 2016, 17, 372–376. [Google Scholar] [CrossRef]
- Kalima, T.; Denny, D. Komposisi Jenis Dan Struktur Hutan Rawa Gambut Taman Nasional Sebangau, Kalimantan Tengah. J. Penelit. Hutan Dan Konserv. Alam 2019, 16, 51–72. [Google Scholar] [CrossRef]
- Laiho, R.; Vasander, H.; Penttilä, T.; Laine, J. Dynamics of plant-mediated organic matter and nutrient cycling following water-level drawdown in boreal peatlands. Global Biogeochem. Cycles 2003, 17, 1–11. [Google Scholar] [CrossRef]
- Chimner, R.A.; Ewel, K.C. A tropical freshwater wetland: II. Production, decomposition, and peat formation. Wetl. Ecol. Manag. 2005, 13, 671–684. [Google Scholar] [CrossRef]
- Pihlatie, M.K.; Christiansen, J.R.; Aaltonen, H.; Korhonen, J.F.J.; Nordbo, A.; Rasilo, T.; Benanti, G.; Giebels, M.; Helmy, M.; Sheehy, J.; et al. Comparison of static chambers to measure CH4 emissions from soils. Agric. For. Meteorol. 2013, 171–172, 124–136. [Google Scholar] [CrossRef] [Green Version]
- Epron, D. Separating autotrophic and heterotrophic components of soil respiration: Lessons learned from trenching and related root-exclusion experiments. In Soil Carbon Dynamics: An Integrated Methodology; Kutsch, W.L., Bahn, M., Heinemeyer, A., Eds.; Cambridge University Press: Cambridge, UK, 2010; pp. 157–168. ISBN 9780511711794. [Google Scholar]
- Ishikura, K.; Hirata, R.; Hirano, T.; Okimoto, Y.; Wong, G.X.; Melling, L.; Aeries, E.B.; Kiew, F.; Lo, K.S.; Musin, K.K.; et al. Carbon Dioxide and Methane Emissions from Peat Soil in an Undrained Tropical Peat Swamp Forest. Ecosystems 2019, 22, 1852–1868. [Google Scholar] [CrossRef]
- Jungkunst, H.F.; Flessa, H.; Scherber, C.; Fiedler, S. Groundwater level controls CO2, N2O and CH4 fluxes of three different hydromorphic soil types of a temperate forest ecosystem. Soil Biol. Biochem. 2008, 40, 2047–2054. [Google Scholar] [CrossRef]
- Ferraz-Almeida, R.; Spokas, K.A.; De Oliveira, R.C. Columns and Detectors Recommended in Gas Chromatography to Measure Greenhouse Emission and O2 Uptake in Soil: A Review. Commun. Soil Sci. Plant Anal. 2020, 51, 582–594. [Google Scholar] [CrossRef]
- Yang, M.; Yu, G.; He, N.; Grace, J.; Wang, Q.; Zhou, Y. A Method for Estimating Annual Cumulative Soil/Ecosystem Respiration and CH4 Flux from Sporadic Data Collected Using the Chamber Method. Atmosphere 2019, 10, 623. [Google Scholar] [CrossRef] [Green Version]
- Nuriman, M.; Anshari, G.Z. Metode Alternatif Memperkirakan Konsentrasi Karbon Organik Terlarut dalam Air Saluran Drainase dan Tanah Gambut. J. Tanah Dan Iklim 2015, 39, 64. [Google Scholar] [CrossRef]
- Wallace, B.; Purcell, M.; Furlong, J. Total organic carbon analysis as a precursor to disinfection byproducts in potable water: Oxidation technique considerations. J. Environ. Monit. 2002, 4, 35–42. [Google Scholar] [CrossRef] [PubMed]
- Yupi, H.M.; Inoue, T.; Bathgate, J.; Putra, R. Concentrations, loads and yields of organic carbon from two tropical peat swamp forest streams in Riau province, Sumatra, Indonesia. Mires Peat 2016, 18, 1–15. [Google Scholar] [CrossRef]
- Page, S.E.; Rieley, J.O.; Shotyk, W.; Weiss, D. Interdependence of peat and vegetation in a tropical peat swamp forest. Philos. Trans. R. Soc. B Biol. Sci. 1999, 354, 1885–1887. [Google Scholar] [CrossRef]
- Sulistiyanto, Y. Nutrient Dynamics in Different Sub-Types of Peat Swamp Forest in Central Kalimantan, Indonesia; University of Notttingham: Nottingham, UK, 2004. [Google Scholar]
- Saragi-Sasmito, M.F.; Murdiyarso, D.; June, T.; Sasmito, S.D. Carbon stocks, emissions, and aboveground productivity in restored secondary tropical peat swamp forests. Mitig. Adapt. Strateg. Glob. Chang. 2019, 24, 521–533. [Google Scholar] [CrossRef] [Green Version]
- Hergoualc’H, K.; Verchot, L.V. Stocks and fluxes of carbon associated with land use change in Southeast Asian tropical peatlands: A review. Global Biogeochem. Cycles 2011, 25. [Google Scholar] [CrossRef] [Green Version]
- Hergoualc’h, K.; Hendry, D.T.; Murdiyarso, D.; Verchot, L.V. Total and heterotrophic soil respiration in a swamp forest and oil palm plantations on peat in Central Kalimantan, Indonesia. Biogeochemistry 2017, 135, 203–220. [Google Scholar] [CrossRef] [Green Version]
- Itoh, M.; Okimoto, Y.; Hirano, T.; Kusin, K. Factors affecting oxidative peat decomposition due to land use in tropical peat swamp forests in Indonesia. Sci. Total Environ. 2017, 609, 906–915. [Google Scholar] [CrossRef] [Green Version]
- Murdiyarso, D.; Saragi-Sasmito, M.F.; Rustini, A. Greenhouse gas emissions in restored secondary tropical peat swamp forests. Mitig. Adapt. Strateg. Glob. Chang. 2019, 24, 507–520. [Google Scholar] [CrossRef]
- Wakhid, N.; Hirano, T.; Okimoto, Y.; Nurzakiah, S.; Nursyamsi, D. Soil carbon dioxide emissions from a rubber plantation on tropical peat. Sci. Total Environ. 2017, 581–582, 857–865. [Google Scholar] [CrossRef] [Green Version]
- Manning, F.C.; Kho, L.K.; Hill, T.C.; Cornulier, T.; Teh, Y.A. Carbon Emissions From Oil Palm Plantations on Peat Soil. Front. For. Glob. Chang. 2019, 2. [Google Scholar] [CrossRef] [Green Version]
- Gandois, L.; Cobb, A.R.; Hei, I.C.; Lim, L.B.L.; Salim, K.A.; Harvey, C.F. Impact of deforestation on solid and dissolved organic matter characteristics of tropical peat forests: Implications for carbon release. Biogeochemistry 2013, 114, 183–199. [Google Scholar] [CrossRef] [Green Version]
- Yule, C.M.; Gomez, L.N. Leaf litter decomposition in a tropical peat swamp forest in Peninsular Malaysia. Wetl. Ecol. Manag. 2009, 17, 231–241. [Google Scholar] [CrossRef]
- Evans, C.D.; Renou-Wilson, F.; Strack, M. The role of waterborne carbon in the greenhouse gas balance of drained and re-wetted peatlands. Aquat. Sci. 2016, 78, 573–590. [Google Scholar] [CrossRef]
- Khasanah, N.; van Noordwijk, M. Subsidence and carbon dioxide emissions in a smallholder peatland mosaic in Sumatra, Indonesia. Mitig. Adapt. Strateg. Glob. Chang. 2019, 24, 147–163. [Google Scholar] [CrossRef] [Green Version]
- Anshari, G.Z.; Gusmayanti, E.; Novita, N. The use of subsidence to estimate carbon loss from deforested and drained tropical peatlands in Indonesia. Forests 2021, 12, 732. [Google Scholar] [CrossRef]
- Wösten, J.H.M.; Ismail, A.B.; Van Wijk, A.L.M. Peat subsidence and its practical implications: A case study in Malaysia. Geoderma 1997, 78, 25–36. [Google Scholar] [CrossRef]
- Astiani, D.; Mujiman; Rafiastanto, A. Forest type diversity on carbon stocks: Cases of recent land cover conditions of tropical lowland, swamp, and peatland forests in West Kalimantan, Indonesia. Biodiversitas 2017, 18, 137–144. [Google Scholar] [CrossRef]
- Manuri, S.; Brack, C.; Nugroho, N.P.; Hergoualc’h, K.; Novita, N.; Dotzauer, H.; Verchot, L.; Putra, C.A.S.; Widyasari, E. Tree biomass equations for tropical peat swamp forest ecosystems in Indonesia. For. Ecol. Manage. 2014, 334, 241–253. [Google Scholar] [CrossRef]
- Kanzler, M.; Böhm, C.; Freese, D. The development of soil organic carbon under young black locust (Robinia pseudoacacia L.) trees at a post-mining landscape in eastern Germany. New For. 2021, 52, 47–68. [Google Scholar] [CrossRef] [Green Version]
- Bader, C.; Müller, M.; Schulin, R.; Leifeld, J. Peat decomposability in managed organic soils in relation to land-use, organic matter composition and temperature. Biogeosci. Discuss. 2017, 1–28. [Google Scholar] [CrossRef] [Green Version]
- Couwenberg, J.; Dommain, R.; Joosten, H. Greenhouse gas fluxes from tropical peatlands in south-east Asia. Glob. Chang. Biol. 2009, 16, 1715–1732. [Google Scholar] [CrossRef]
- Hatano, R. Impact of land use change on greenhouse gases emissions in peatland: A review. Int. Agrophysics 2019, 33, 167–173. [Google Scholar] [CrossRef]
- Hirano, T.; Jauhiainen, J.; Inoue, T.; Takahashi, H. Controls on the carbon balance of tropical peatlands. Ecosystems 2009, 12, 873–887. [Google Scholar] [CrossRef]
- Ishikura, K.; Yamada, H.; Toma, Y.; Takakai, F.; Morishita, T.; Darung, U.; Limin, A.; Limin, S.H.; Hatano, R. Effect of groundwater level fluctuation on soil respiration rate of tropical peatland in Central Kalimantan, Indonesia. Soil Sci. Plant Nutr. 2017, 63, 1–13. [Google Scholar] [CrossRef] [Green Version]
- Carlson, K.M.; Goodman, L.K.; May-Tobin, C.C. Modeling relationships between water table depth and peat soil carbon loss in Southeast Asian plantations. Environ. Res. Lett. 2015, 10, 074006. [Google Scholar] [CrossRef]
- Prananto, J.A.; Minasny, B.; Comeau, L.P.; Rudiyanto, R.; Grace, P. Drainage increases CO2 and N2O emissions from tropical peat soils. Glob. Chang. Biol. 2020, 26, 4583–4600. [Google Scholar] [CrossRef]
- Waddington, J.M.; Day, S.M. Methane emissions from a peatland following restoration. J. Geophys. Res. Biogeosci. 2007, 112, 1–11. [Google Scholar] [CrossRef]
- Strack, M.; Zuback, Y.; Mccarter, C.; Price, J. Changes in dissolved organic carbon quality in soils and discharge 10 years after peatland restoration. J. Hydrol. 2015, 527, 345–354. [Google Scholar] [CrossRef]
- Hughes, S.; Reynolds, B.; Brittain, S.A.; Hudson, J.A.; Freeman, C. a naturally drained gully mire. Soil Use Manag. 1998, 14, 248–251. [Google Scholar] [CrossRef]
- Glatzel, S.; Kalbitz, K.; Dalva, M.; Moore, T. Dissolved organic matter properties and their relationship to carbon dioxide efflux from restored peat bogs. Geoderma 2003, 113, 397–411. [Google Scholar] [CrossRef]
- Wallage, Z.E.; Holden, J.; McDonald, A.T. Drain blocking: An effective treatment for reducing dissolved organic carbon loss and water discolouration in a drained peatland. Sci. Total Environ. 2006, 367, 811–821. [Google Scholar] [CrossRef]
- Laiho, R.; Minkkinen, K.; Anttila, J.; Vávřová, P.; Penttilä, T. Dynamics of litterfall and decomposition in peatland forests: Towards reliable carbon balance estimation? Wastewater Treat. Plant Dyn. Manag. Constr. Nat. Wetl. 2008, 1, 53–64. [Google Scholar] [CrossRef]
- Kuzyakov, Y.; Domanski, G. Carbon input by plants into the soil. Review. J. Plant Nutr. Soil Sci. 2000, 163, 421–431. [Google Scholar] [CrossRef]
- Sayer, E.J.; Powers, J.S.; Tanner, E.V.J. Increased litterfall in tropical forests boosts the transfer of soil CO2 to the atmosphere. PLoS ONE 2007, 2, e1299. [Google Scholar] [CrossRef] [Green Version]
- Basile-Doelsch, I.; Balesdent, J.; Pellerin, S. Reviews and syntheses: The mechanisms underlying carbon storage in soil. Biogeosciences 2020, 17, 5223–5242. [Google Scholar] [CrossRef]


| a | Properties | Rewetted Site | Undrained Site |
|---|---|---|---|
| 1 | Number of plots (sub-plot) | 4 (24) | 4 (24) |
| 2 | Annual mean GWL (cm) (January–December 2019) a | −22 ± 1.6 | −12 ± 1.5 |
| 3 | Peat depth (cm) a | 396.7 ± 3.5 | 434.6 ± 5.4 |
| 4 | Peat bulk density (g/cm3) a | 0.073 ± 0.014 | 0.071 ± 0.006 |
| 5 | Carbon content in peat (%) a | 51.2 ± 1.7 | 52.7 ± 0.8 |
| 6 | Nitrogen content in peat (%) b | 2.8 ± 0.03 | 2.3 ± 0.09 |
| 7 | C/N ratio b | 19.1 ± 0.6 | 25.4 ± 1.5 |
| 8 | Number of species b | 53 | 78 |
| 9 | Tree Density—DBH 5–49.9 cm (tree/ha)a | 1266 ± 38 | 1369 ± 127 |
| 10 | Tree density—DBH > 50 cm (tree/ha)a | 5 ± 1 | 8 ± 2 |
| 11 | Basal area—DBH 5–49.9 cm (m2/ha) a | 22.0 ± 1.7 | 21.4 ± 2.5 |
| 12 | Basal area—DBH > 50 cm (m2/ha) a | 1.4 ± 0.3 | 1.8 ± 0.6 |
| 13 | Total aboveground carbon (Mg C ha−1) a | 146.3 ± 30.3 | 158.1 ± 28.8 |
| 14 | Total belowground carbon (Mg C ha−1) a | 1720.5 ± 65.0 | 1948.2 ± 196.0 |
| 15 | Soil organic carbon (Mg C ha−1) a | 1685 ± 61.1 | 1912.5 ± 190.2 |
| 16 | Total carbon stock (Mg C ha−1) a | 1866.7 ± 87.7 | 2106.2 ± 214.3 |
Publisher’s Note: MDPI stays neutral with regard to jurisdictional claims in published maps and institutional affiliations. |
© 2022 by the authors. Licensee MDPI, Basel, Switzerland. This article is an open access article distributed under the terms and conditions of the Creative Commons Attribution (CC BY) license (https://creativecommons.org/licenses/by/4.0/).
Share and Cite
Darusman, T.; Murdiyarso, D.; Impron, I.; Chaniago, I.A.; Lestari, D.P. Carbon Dynamics in Rewetted Tropical Peat Swamp Forests. Climate 2022, 10, 35. https://doi.org/10.3390/cli10030035
Darusman T, Murdiyarso D, Impron I, Chaniago IA, Lestari DP. Carbon Dynamics in Rewetted Tropical Peat Swamp Forests. Climate. 2022; 10(3):35. https://doi.org/10.3390/cli10030035
Chicago/Turabian StyleDarusman, Taryono, Daniel Murdiyarso, Impron Impron, Iswandi Anas Chaniago, and Dwi Puji Lestari. 2022. "Carbon Dynamics in Rewetted Tropical Peat Swamp Forests" Climate 10, no. 3: 35. https://doi.org/10.3390/cli10030035
APA StyleDarusman, T., Murdiyarso, D., Impron, I., Chaniago, I. A., & Lestari, D. P. (2022). Carbon Dynamics in Rewetted Tropical Peat Swamp Forests. Climate, 10(3), 35. https://doi.org/10.3390/cli10030035