Abstract
In this study, we provide a Bayesian estimation method for the unconditional quantile regression model based on the Re-centered Influence Function (RIF). The method makes use of the dichotomous structure of the RIF and estimates a non-linear probability model by a logistic regression using a Gibbs within a Metropolis-Hastings sampler. This approach performs better in the presence of heavy-tailed distributions. Applied to a nationally-representative household survey, the Senegal Poverty Monitoring Report (2005), the results show that the change in the rate of returns to education across quantiles is substantially lower at the primary level.
JEL Classification:
C11; C14; C52
1. Introduction
Introduced by (), quantile regression models have been increasingly used in empirical labor market studies1 to parsimoniously describe the entire distribution of an outcome variable. To overcome some limitations2 of conditional quantile regression models, () propose the Re-centered Influence Function (RIF)-regression. This regression evaluates the impact of changes in the distribution of covariates on the quantiles of the marginal distribution of the dependent variable. The two-step estimation of the RIF-regression requires first an estimation of the density of the RIF function. A “classical” approach consists of estimating independently the RIF and the regression coefficients (see ). This approach does not take into account the uncertainty related to the first step of estimation. () provide a Bayesian estimation of the RIF-regression where they consider sequentially the two-steps of estimation by estimating the density function of the outcome variable by a mixture of normal distributions. While being consistent3 in the presence of heavy tails, their approach makes the underlying restrictive hypothesis of linearity. However, the estimated RIF function is a binary dependent variable; the linearity and the normality assumptions are strong and may lead sometimes to predicted probabilities that are negative or greater than one. In this study, we implement a Bayesian estimation method for the RIF-regression by considering the dichotomous structure of the RIF function. The method consists of running a logistic-regression where coefficients are estimated by the Metropolis-Hastings sampler using Gibbs output in the first step of estimation.
Since the collective agreement in April 2000 to place education at the heart of the development priorities for eradicating extreme poverty, the last two decades have seen a large increase in the enrollment rate of primary education in most developing countries, responding also to the second priority of the Millennium Development Goals (MDGs), “primary education for all”. While education is increasingly acknowledged as an important dimension of poverty reduction, there remains some challenges in measuring its return, for example on a household’s welfare. Studies emphasizing the role of education on poverty reduction have recently exploded, and regression analysis relying on both household surveys and cross-country data has been widely used in this literature. These regressions, using reduced-form equations, generally provide a simple, but partial framework for examining the marginal effect of education on a household’s income4. Since the distribution of income is generally skewed to the right, the mean regression models do not provide complete and meaningful information, and then, the analysis of each point of the distribution is of particular interest to assess changes at these different points.
The proposed approach is employed in the empirical analysis to measure the return to education and to address the extent to which the rate of the marginal effect of primary education on a household’s income changes across quantiles compared with those of higher education.
The investment in primary education devotes the largest budget allocation in developing countries to fulfill development priorities (; ). In Senegal, the enrollment rate in primary school has climbed from 54 percent in 1994 to 70 percent in 2001 and 82.5 percent in 2005, accompanied by an increase in the female enrollment rate and the rural sectors enrollment rate5. However, the ’s report reveals that 78.51% of Senegalese youth aged 15–19 dropped out before finishing lower secondary school.
The empirical analysis of this paper uses the data from a nationally-representative survey: the Senegal Poverty Monitoring Report (ESPS, 2005) conducted by the National Agency of Statistics and Demography (ANSD)6. This survey is largely used by empirical studies, government monitoring reports, institutional strategic documents and in poverty reduction strategies papers (PRSPs) in Senegal7.
This study applies the RIF-regression method in a Mincer8 equation type, to primarily investigate the changes in the return to education across quantiles.
The empirical results primarily demonstrate evidence from the heterogeneous pattern of changes in the rate of return to education across quantiles. The rate of change in the return to primary education does not vary much between the lower and the upper quantiles (0.50, 0.75, 0.90) compared to those to secondary and tertiary education. This result supports findings showing that in countries that rapidly expand access to primary education, the returns to primary education fall, while returns to higher education rise (; ).
The paper is organized as follows: Section 2 presents the RIF-regression and the different estimation methods employed. It implements a Bayesian RIF-logit estimation by a Gibbs-Metropolis-Hastings sampler. Section 3 describes the data. Section 4 discusses the empirical results. Section 5 concludes and discusses some policy implications.
2. Unconditional Quantile Regression Models
We consider the following quantile regression model:
where , are independent observations, being the single-response variable and being the known covariates. represents the unknown regression parameters, and , are the error terms, which are supposed to be independent and identically distributed. The -th quantile of is assumed equal to zero, .
2.1. RIF-Regression Models
() developed an unconditional quantile regression method based on the Re-centered Influence Function (RIF) to evaluate the marginal impact of changes in the distribution of the explanatory variables on the quantiles of the marginal distribution of the dependent variable.
The Influence Function (IF) studies how a change in the distribution of covariates affects a distributional statistic , where F is a class of distribution functions. It is defined as:
where is a perturbation distribution, which puts a mass of one at any point y and is a mixture model. () consider the -th quantile, as the distributional statistics , and show that the can be expressed as:
where is the density of the variable of interest, Y. A convenient property of is that . () define the Re-centered Influence Function (RIF) as . For quantiles, the can be expressed in the following convenient way:
where and .
The RIF-regression model consists of regressing the function RIF given in (3) on a set of covariates X.
2.2. Bayesian Estimation of the RIF-Regression
Running the two-step estimation of the RIF-regression remains a challenging problem. The “classical” approach consists of estimating independently the influence function by kernel estimation and the regression coefficients (see ). However, the kernel density estimation in the first step may lead to unreliable inference in the presence of heavy-tailed distributions as theoretically shown by () and empirically evidenced by (). The Bayesian estimation method of the RIF consists of choosing a mixture representation for the density function by solving a data augmentation problem by a Gibbs sampler and then estimating the regression coefficients. A first MCMC algorithm, which combines the two steps of estimation in a sequential process in linear RIF-regression, was suggested by (). However, the estimated RIF function is a binary dependent variable; the linearity and the normality assumptions are strong and may lead sometimes to predicted probabilities that are negative or greater than one. Following the dichotomous structure of the RIF in (3), a non-linear model can be estimated using a logistic (probit) regression. We take the opportunity of this requirement to introduce a hybrid MCMC method, which is called a Gibbs within a Metropolis-Hastings algorithm.
The conditional expectation of the RIF is expressed as:
Since in (4) is linear on , the average marginal effect of covariates is given by:
where with are the mixture parameters estimated by the Gibbs sampler. The average marginal effect can be consistently estimated by a logit regression considering the dummy variable that is regressed on to derive the RIF-regression coefficients, . A Bayesian estimation of a logit regression can be done by a Metropolis-Hastings sampler where the starting values are derived from the estimation of the regression coefficients in a linear probability model.
The average marginal effect from a logit model will be consistent only if:
where is the cumulative distribution function of a logistic distribution.
The likelihood of the sample is then given by:
For a given prior , the posterior distribution is:
The Gibbs sampler is difficult to implement since conjugate priors do not exist because the logistic likelihood function does not belong to the exponential family. Therefore, we consider a Metropolis-Hastings sampler, which can be tuned only with the likelihood function under a flat prior on .
The proposed approach for the RIF-logit developed is a Gibbs within a Metropolis-Hastings sampler algorithm, as it first requires the use of the Gibbs sampler to estimate the mixture of lognormal densities9 for .
Gibbs within a Metropolis-Hastings sampler algorithm.
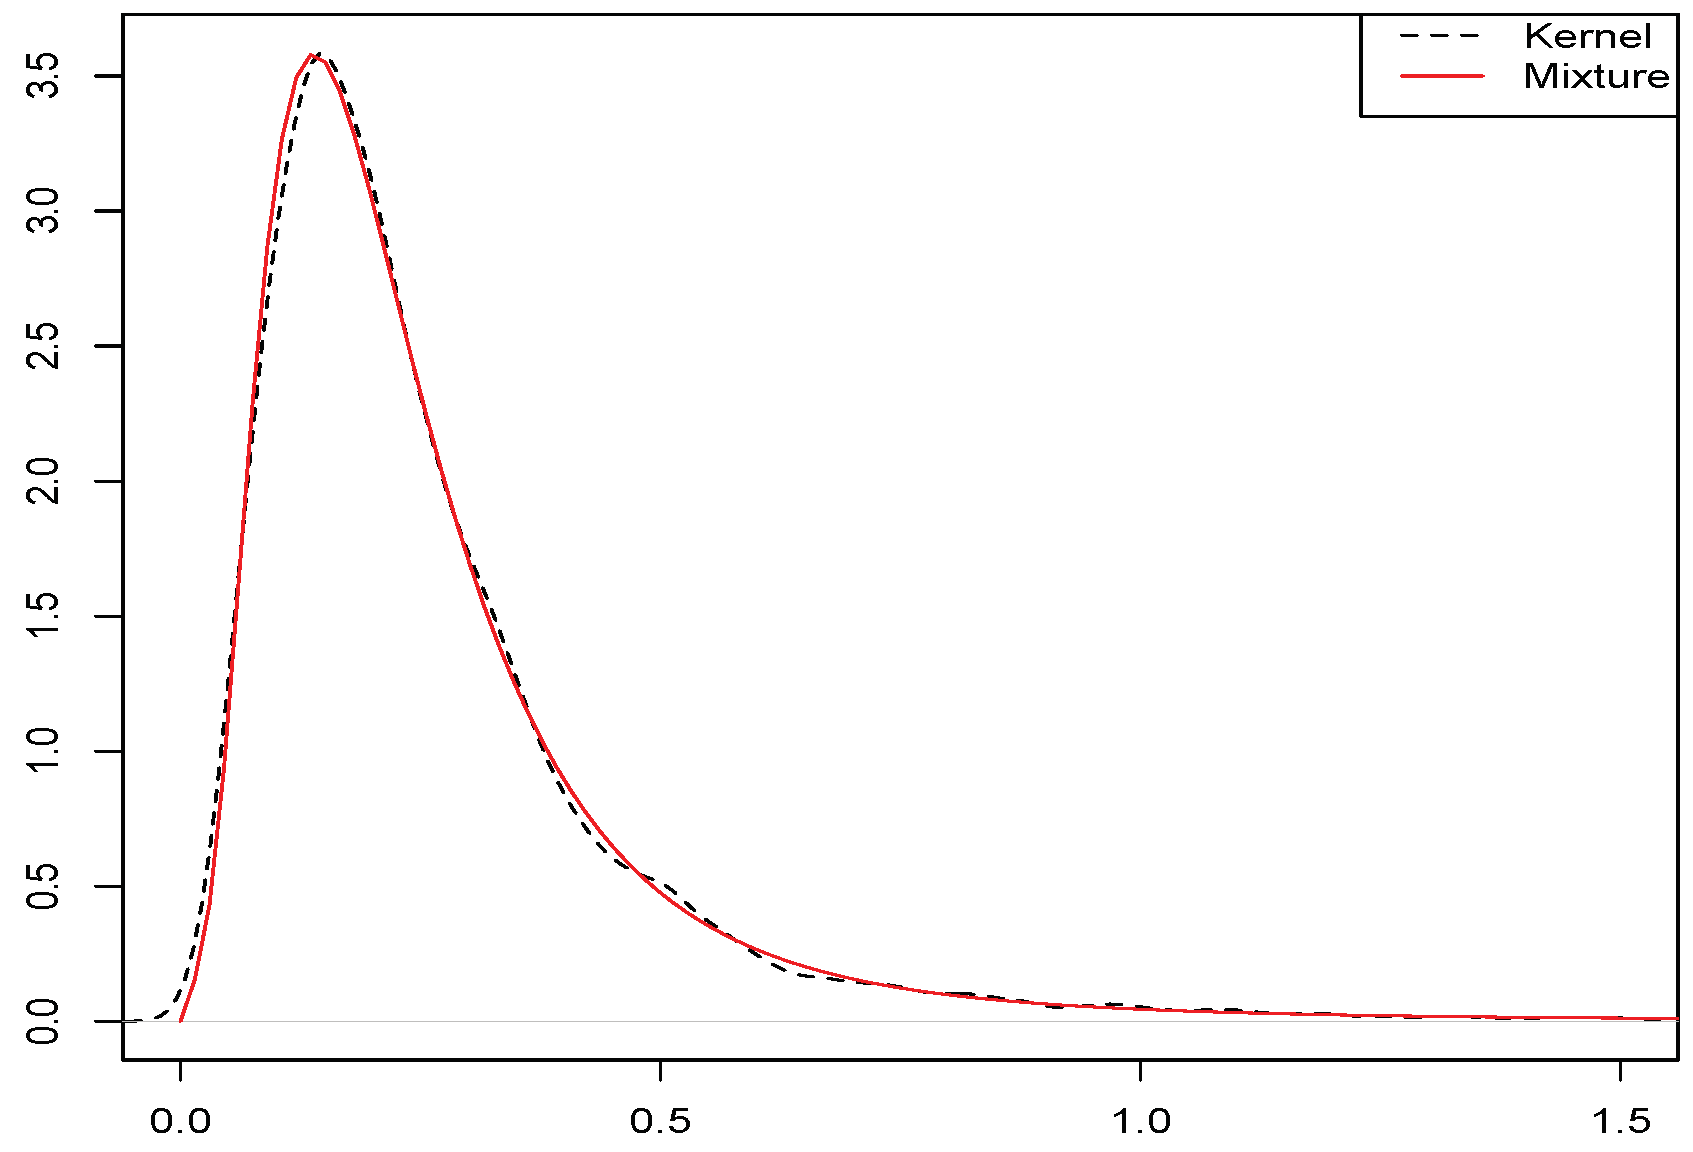
- Estimate the density function of y by Gibbs sampling to obtain
- Initialization: run a linear probability model to set , and compute .
- Iteration: for
- Generate
- Compute the acceptance probability
- With probability , set otherwise
- Compute
- Average to obtain the estimates of the RIF-regression coefficient, .
Without any prior information, the flat prior on can be considered, . For comparison purposes, we will consider Zellner’s non-informative G-prior:
We can notice that the RIF-logit estimation approach makes assumptions about the functional forms of the in (4). () suggest the nonparametric-RIF (NP-RIF) regression method based on polynomial series approximations and show that RIF-logit regression yields estimates very close to the fully-nonparametric estimator. However, the choice of the nonparametric estimator is not crucial in large samples as discussed by (); if the domain is unbounded, the polynomial series would also poorly approximate the tails.
3. Empirical Analysis
3.1. Data and Descriptive Statistics
The Senegal Poverty Monitoring Report (ESPS, 2005) is a nationally-representative survey conducted by the National Agency of Statistics and Demography. The survey is constructed to provide information related to the evaluation of poverty and to the assessment of the impact of public policies. The ESPS sample covers 13,500 of households of all social classes and from all geographical areas of residence.
Table 1 reports descriptive statistics concerning the characteristics of households and information on the head of the household. It shows that two-thirds of household-heads are illiterate, around 13 percent have reached primary education, 9 percent a secondary education level and less than 5 percent a tertiary level and equivalent. Senegalese families are often extended, nine persons per household on average, and more than half are between 40 and 65 years old. About 80 percent of household-heads are employed (self-employed or salaried). More details on the descriptive statistics of these data are given in the summary reports of the two surveys published by the National Agency of Demography ().

Table 1.
Characteristics of heads of households.
The estimation of a given equivalence scale relies on a particular consumption model, which is rather restrictive and therefore may lead to identification problems. The usual practice consists of using the per capita income, dividing the household income by the household size. That is what we use in this study referring to () and () and empirical work by the World Bank with ().
3.2. Real Consumption Expenditure Per Capita Distribution
We consider the annual real consumption expenditure as an indicator of permanent income. The consumption expenditures are expressed in CFA francs.10 The WAEMU11 Harmonized Consumer Prices Index (HCPI) was respectively 10.94 in 2001 and 11.3 in 2005, revealing a small inflation rate of 0.036 points. The total consumption expenditures in the survey are already deflated by sectors using the national Consumer Prices Index (CPI). The differences in weight in CPI between urban and rural sectors nicely reflect the consumption expenditure structure. In fact, foods are typically less expensive in the rural sectors, and urban households are more likely to consume higher quality goods, which increases their consumption expenditures. The total consumption expenditure in the sample is the sum of food and non-food expenditures, with self-consumption added.
Table 2 presents the distribution of the real annual consumption expenditure per capita.

Table 2.
Real annual consumption expenditure per capita.
The sample reveals that the largest part of the Senegalese household’s consumption expenditure is on food (45.6%) and housing (20%); the remainder of the budget is mostly used to cover the clothing expenditure, health and items expenditure.
Since the distribution of the consumption expenditure is often skewed to the left, we impose a restriction on the form of the distribution. We estimate the density function by a mixture of normals using a Gibbs sampler. Figure 1 presents the estimation of the real consumption expenditure per capita by a mixture of two lognormal distributions.

Figure 1.
Mixture of two lognormal densities.
4. Empirical Application
In the RIF-regression models, we consider a Mincer type model where the logarithm of the consumption expenditure per capita is the dependent variable. We estimate returns to education at different levels by converting the continuous years of the schooling variable into three dummy variables referring to the completion of the main schooling cycles12. This return to education refers to the marginal effect of the level of education on the household’s consumption expenditure per capita.
We consider the following set of covariates: primary, secondary and tertiary as dummies, which refer to the level of education of the head of household; age and its square13 refer to the age of the heads of household; the dummy female refers to a female headed-household; the dummy married refers to a married household’s head; the dummy rural is the rural geographical area of residence. We restrict the estimations to five quantiles (0.10, 0.25, 0.50, 0.75, 0.90).
In this case, the RIF-regression allows us to evaluate the marginal effect of the changes in the distribution of covariates on the quantiles of the marginal distribution of the total consumption expenditure per capita.
Table 3 and Table 4 report the RIF-regression estimates. They show the marginal effects of different covariates on the household’s expenditure consumption per capita and their changes across the five quantiles. The regression coefficients are estimated by the hybrid MCMC RIF-estimation methods developed in this paper. The density function of the dependent variable (log of the expenditure consumption per capita) is estimated by a mixture of normal distributions.

Table 3.
Bayesian RIF estimates on the log-income without using prior . RIF, Re-centered Influence Function.

Table 4.
Bayesian RIF estimates on the log-income.
Returns to education: For both estimations, the marginal effect of education monotonically increases with the level of education and with quantiles. The rate of change in the returns to education across quantiles provides evidence of significant differences between the bottom and the top of the distribution. For all educational attainment levels, the marginal effects and their rate of change are significantly larger for upper quantiles (0.5, 0.75, 0.90), especially the secondary and the tertiary levels. The marginal effects of the secondary and tertiary education largely dominate the upper part of the distribution. The primary education is significant for all quantiles except the lowest 10 percent; its return increases from the first quartile to the third quartile and then slightly decreases for the highest quantiles. The rate of change in the return to primary education is small and much lower than those to secondary and tertiary educations (see also Table A1 in Appendix A). This result is in line with findings showing that in countries that rapidly expand access to primary education, the returns to primary education fall, while returns to higher education rise (see for instance ; ). In contrast, “primary education continues to be the number one investment priority in developing countries” ().
Including age-square, the results show an overall negative effect of age on the household consumption expenditure. Its marginal effect monotonically increases across the first four quantiles and is not significant for the 90th quantile. On average, an additional year of age decreases the household consumption expenditure (in log) by approximately (0.667 0.395 0.294 0.243), respectively. For each of the quantiles (0.10, 0.25, 0.5, 0.75), these marginal effects also increase with age14.
The marginal effects of the household’s size monotonically decrease, and their rates of change across quantiles are higher for upper quantiles. Living in rural areas has a negative and significant effect on the consumption expenditures for all quantiles. Senegal’s rural economy is largely agricultural, which is seasonal. The marginal effects of living in rural ares are comparatively higher than the other effects of covariates for poor households. Indeed, the urban labor force is more skilled and earns higher wages than the rural labor force.
5. Conclusions and Policy Implications
In this study, we provide a Bayesian estimation method for the unconditional quantile regression model based on the Re-centered Influence Function (RIF). The method makes use of the dichotomous structure of the RIF and estimates a non-linear probability model by a logistic regression using a Gibbs within a Metropolis-Hastings sampler. This approach performs better in the presence of heavy-tailed distributions. Applied to a nationally-representative household survey, the Senegal Poverty Monitoring Report (2005), the empirical results primarily show evidence from the heterogeneous pattern of changes in the rate of returns to education across quantiles and across the different levels of education. The marginal effects of education monotonically increase and are comparatively higher for upper quantiles (0.50, 0.75, 0.90). The return to primary education does not vary much across quantiles compared with those to secondary and tertiary education.
In most developing countries, promoting education is not only for development policy and for eradicating poverty, but it is also an argument to attract institutional financing and other forms of aid from donors. Senegal witnessed one of the largest increases in the achievement of the second priority of the MDGs. The rate of primary education in Senegal climbed from 54 percent in 1994 to over 82 percent in 2005. In Senegal, as well as in most developing countries, the quality of education in public schools has deteriorated following the increase of enrollment rates. The growing number of primary schools has partially contributed to the literacy and encouraged the education of girls. In contrast, the growing number of public primary schools disadvantages children from low-income families due to the lack of educational resources.
Author Contributions
The authors have contributed equally to this work.
Acknowledgments
We gratefully acknowledge the financial support from the MultiRisk project (ANR-16-CE26-0015) managed by the French ANR. We thank the referees for their constructive comments that have helped to improve the paper.
Conflicts of Interest
The authors declare no conflict of interest.
Appendix A. Comparison with Conditional Quantile Regression Model
Table A1 presents the estimation results of the conditional quantile regression using Gibbs sampling15. The results are in line with those provided by the RIF-regression. The rate of change in the return to primary education does not vary much between the lower and the upper quantiles compared with those to secondary and tertiary education.

Table A1.
Bayesian conditional quantile regression using Gibbs sampling.
Table A1.
Bayesian conditional quantile regression using Gibbs sampling.
Lowest | Lower Middle | Median | Upper Middle | Highest | |
---|---|---|---|---|---|
0.10 | 0.25 | 0.50 | 0.75 | 0.90 | |
Intercept | |||||
primary | |||||
secondary | |||||
tertiary | |||||
age | |||||
age2 | |||||
size | |||||
female | |||||
rural | |||||
married |
The age variable was divided by 100. age2 represents the square of age. Standard errors are indicated in parentheses. Bold figures correspond to posterior means for which 0 is contained in a 95% HPD interval.
References
- ANSD. 2007. ANSD, Enquête de Suivi de la Pauvreté au Sénégal, ESPS. Technical Report. Dakar: Agence Nationale de la Statistique et de la Démographie (ANSD). [Google Scholar]
- Bahadur, R. R., and Leonard J. Savage. 1956. The Nonexistence of Certain Statistical Procedures in Nonparametric Problems. Annals of Statistics 27: 1115–22. [Google Scholar] [CrossRef]
- Boccanfuso, Dorothée, Bernard Decaluwé, and Luc Savard. 2008. Poverty, income distribution and CGE micro-simulation modeling: Does the functional form of distribution matter? Journal of Economic Inequality 6: 149–84. [Google Scholar] [CrossRef]
- Boccanfuso, Dorothée, Antonio Estache, and Luc Savard. 2009. A macro-micro analysis of the effects of electricity reform in Senegal on poverty and distribution. Journal of Development Studies 45: 351–68. [Google Scholar] [CrossRef]
- Buchinsky, Moshe. 1994. Changes in the U.S. Wage Structure 1963–1987: An application of Quantile Regression. Econometrica 62: 405–58. [Google Scholar] [CrossRef]
- Chamberlain, Gary. 1994. Quantile Regression Censoring and the Structure Of Wages. In Advances in Econometrics. Edited by Sims Christopher. Oxford: Cambridge University Press. [Google Scholar]
- Davidson, Russell. 2012. Statistical inference in the presence of heavy tails. Econometrics Journal 15: C31–53. [Google Scholar] [CrossRef]
- Deaton, Angus. 1997. The Analysis of Household Surveys. Baltimore and London: The John Hopkins University Press. [Google Scholar]
- Deaton, Angus, and John Muellbauer. 1980. An Almost Ideal Demand System. The American Economic Review 70: 312–26. [Google Scholar]
- Delaunay, Karine. 2012. Education in Senegal: Inequality in Development. Discussion Paper 397. Marseille, France: Institution de Recherche Pour le Development (IRD). [Google Scholar]
- Diawara, Barassou. 2012. Schooling and Assets Ownership. Modern Economy 3: 126–38. [Google Scholar] [CrossRef]
- DSRP. 2005. Document de Stratégie de Réduction de la Pauvreté (2003–2005). Ministère de l’Économie et des Finances du Sénégal, Unité de Coordination et de Suivi de la politique Economique; Technical Report. DSRP. Available online: http://www.bameinfopol.info/IMG/pdf/DSRP.pdf (accessed on 2 May 2017).
- Firpo, Sergio, Nicole M. Fortin, and Thomas Lemieux. 2009. Unconditional Quantile Regressions. Econometrica 77: 953–73. [Google Scholar]
- IMF. 2007. Republic of Senegal: Poverty Reduction Strategy Paper. Technical Report 07/316. Washington: International Monetary Fund, IMF. [Google Scholar]
- Koenker, Roger, and Gilbert Bassett. 1978. Regression Quantiles. Econometrica 46: 33–50. [Google Scholar] [CrossRef]
- Kozumi, Hideo, and Genya Kobayashi. 2011. Gibbs sampling methods for Bayesian quantile regression. Journal of Statistical Computation and Simulation 81: 1565–78. [Google Scholar] [CrossRef]
- Lubrano, Michel, and Abdoul Aziz J. Ndoye. 2014. Bayesian Unconditional Quantile Regression: An Analysis of Recent Expansions in Wage Structure and Earnings Inequality in the US 1992–2009. Scottish Journal of Political Economy 61: 129–53. [Google Scholar] [CrossRef]
- Lubrano, Michel, and Abdoul Aziz J. Ndoye. 2016. Income inequality decomposition using a finite mixture of log-normal distributions: A Bayesian approach. Computational Statistics & Data Analysis 100: 830–46. [Google Scholar] [CrossRef]
- Machado, José A. F., and José Mata. 2001. Earning functions in Portugal 1982–1994: Evidence from quantile regressions. Empirical Economics 26: 115–34. [Google Scholar] [CrossRef]
- Marin, Jean-Michel, and Christian P. Robert. 2001. Bayesian Core: A Practical Approach to Computational Bayesian Statistics. New York: Springer-Verlag Inc. [Google Scholar]
- Mincer, Jacob. 1974. Schooling, Experience and Earnings. New York: The Natural Bureau of Economic Research. [Google Scholar]
- Newey, Whitney K. 1994. The Asymptotic Variance of Semiparametric Estimators. Econometrica 62: 1349–82. [Google Scholar] [CrossRef]
- Psacharopoulos, George. 1994. Returns to investment in education: A global update. World Development 22: 325–43. [Google Scholar] [CrossRef]
- Psacharopoulos, George, and Harry A. Patrinos. 2002. Returns to Investment in Education: A Further Update. Policy Research Working paper 2881. Washington, DC, USA: Education Sector Unit, World Bank. [Google Scholar]
- Ravallion, Martin. 2001. Growth, Inequality and Poverty: Looking beyond Averages. Washington: Development Research Group, World Bank. [Google Scholar]
- Yang, Yunwen, Huixia J. Wang, and Xuming He. 2016. Posterior Inference in Bayesian Quantile Regression with Asymmetric Laplace Likelihood. International Statistical Review 84: 327–44. [Google Scholar] [CrossRef]
- Yu, Keming, and Rana A. Moyeed. 2001. Bayesian quantile regression. Statistics & Probability Letters 84: 437–47. [Google Scholar]
1 | (; ; ). |
2 | Unlike conditional means, conditional quantiles do not average up to their unconditional population counterparts. |
3 | Mixture models provide flexible extensions of parametric models, and the Bayesian approach takes into account the uncertainty related to the first step of the estimation. |
4 | The consumption expenditure is considered as an indicator of a household’s income. |
5 | Source: published reports and papers; see for instance (; ). These ratios correspond to the number of students formally registered in primary school. |
6 | ESPS, “Enquête Suivie de la Pauvreté au Sénégal”, 2005–2006; ANSD, “Agence National de la Statistique et de la Démographie”. |
7 | Among the studies using the ESPS datasets, we can cite (); (); (), among others, and the national and institutional reports: ; ; . |
8 | The standard () earnings equation linearly regresses the log of wage on the year of education and the quadratic function of labor market experience. |
9 | The Gibbs sampler for the mixture of lognormal densities was developed in (); see also () for the mixture of normal distributions. |
10 | CFA (Communauté Financière Africaine (African Financial Community)). CFA franc had a fixed exchange rate with the Euro (1 euro = 656 CFA) in 2013. |
11 | West African Economic and Monetary Union. |
12 | Primary education corresponds to 6 years or less, secondary between 7 and 13 years and tertiary more than 13 years. |
13 | We consider the quadratic function of age to capture the fact that on-the-job training investments decline over time in a standard life-cycle human capital model. This quadratic form of age is implied by a model in which investments decline linearly over time. |
14 | Considering the three age values (30, 50, 65)/100, the following marginal effects for the four quantiles are (−0.679 −0.402 −0.300 −0.2482); (−0.667 −0.395 −0.294 −0.243) and (−0.658 −0.390 −0.290 −0.239), respectively. |
15 | Details of Bayesian inference for quantile regression based on Gibbs sampling can be found in: ; ; . |
© 2018 by the authors. Licensee MDPI, Basel, Switzerland. This article is an open access article distributed under the terms and conditions of the Creative Commons Attribution (CC BY) license (http://creativecommons.org/licenses/by/4.0/).