Article

An Overview of Modified Semiparametric Memory Estimation Methods

Institute of Statistics, Faculty of Economics and Management, Leibniz University Hannover, D-30167 Hannover, Germany
*
Author to whom correspondence should be addressed.
Econometrics 2018, 6(1), 13; https://doi.org/10.3390/econometrics6010013
Submission received: 13 December 2017 / Revised: 6 February 2018 / Accepted: 22 February 2018 / Published: 12 March 2018

Abstract

:
Several modified estimation methods of the memory parameter have been introduced in the past years. They aim to decrease the upward bias of the memory parameter in cases of low frequency contaminations or an additive noise component, especially in situations with a short-memory process being contaminated. In this paper, we provide an overview and compare the performance of nine semiparametric estimation methods. Among them are two standard methods, four modified approaches to account for low frequency contaminations and three procedures developed for perturbed fractional processes. We conduct an extensive Monte Carlo study for a variety of parameter constellations and several DGPs. Furthermore, an empirical application of the log-absolute return series of the S&P 500 shows that the estimation results combined with a long-memory test indicate a spurious long-memory process.

1. Introduction

Over the last decades, the long memory literature focusses on an effect called spurious long memory. This effect is characterized by a contaminated short-memory process exhibiting the typical properties of a long-memory process, such as a hyperbolically decaying autocorrelation function and an unbounded spectral density at the origin. Several types of contamination exist and we follow the classification of Hou and Perron (2014). We distinguish between short-run and additive noise components which influence the bias and efficiency of the standard estimator in finite samples. Further, low frequency contaminations modeled by time trends and level shifts can cause inconsistent estimators and are a source of the aforementioned spurious long memory (cf. Diebold and Inoue 2001; Granger and Hyung 2004). Haldrup and Nielsen (2007) present strongly biased standard estimators for contaminated processes in their simulation study and emphasize the need of modified estimators. Besides the theoretical effects of low frequency contaminations, McCloskey and Perron (2013) emphasize the relevance to macroeconomic and financial applications.
Motivated by these findings, several modified estimation methods of the memory parameter have been developed. In this survey paper, we concentrate on semiparametric estimation methods and do not consider the literature of fully parametric estimation techniques, such as McCloskey (2013) or McCloskey and Hill (2017). Further, we omit semiparametric Fourier- and wavelet-based estimation approaches and refer to a survey paper by Faÿ et al. (2009).
Generally, all modified estimation methods aim to decrease the upward bias of the memory parameter in cases of low frequency contaminations or an additive noise component, especially in situations with a short-memory process being contaminated. Several types of modifications have been proposed in the literature and we compare the effects of a trimmed periodogram and an adjusted spectral density. The order of the periodogram differs from a typical long-memory process to a contaminated process. Therefore, by adding or replacing components of the original spectral density, a so-called pseudo-spectral density function is modeled (e.g., Hou and Perron 2014). Alternatively, trimming the lower frequencies of a periodogram removes the high peak of the periodogram that is caused by the contamination. A common drawback of the modified estimators is the bias-variance trade-off which means that a bias reduction is combined with an increased variance.
To our knowledge, this is the first survey paper on semiparametric estimation methods of the memory parameter considering several types of contaminated processes. Usually, authors of modified estimation methods compare the results to the original non-modified estimation method. However, a comparison between different modified estimation methods would be of great interest. Further, the simulation studies of the modified estimation procedures are often limited to a few data generating processes (DGPs) and to a small set of parameter constellations, except for Hou and Perron (2014). We contribute to this literature by providing an extensive Monte Carlo study for a variety of parameter constellations and several DGPs. Additionally, we review the performance of the estimation methods for perturbed fractional processes since the general idea is closely related to an additive noise component as it has been considered by Hou and Perron (2014).
The idea of the paper is to give an overview of different estimation methods of pure and contaminated short and long-memory processes and to compare them under several scenarios. We aim to provide some user-guidelines in the end or a recommendation on which method should be preferred or which one is performing most stable across the wide setup in the simulation study. In the following, we briefly introduce the estimation methods. Two widespread semiparametric estimation methods are considered for pure long-memory processes, the log-periodogram estimator (also known as GPH estimator) of Geweke and Porter-Hudak (1983) and the local Whittle estimation approach of Kuensch (1987). In this survey paper, we compare the modified estimators of Smith (2005), Iacone (2010), McCloskey and Perron (2013) and Hou and Perron (2014). Smith (2005) develops a biased corrected version of the log-periodogram estimator by adding an additional regressor to the ordinary least squares regression equation. The trimming technique of Iacone (2010) is based on the local Whittle estimator, whereas McCloskey and Perron (2013) use the GPH estimator. As stated by Yamamoto and Perron (2013), the high peaks in the periodogram at low frequencies induced by the level shifts or trends are robustly removed by the trimming procedure of McCloskey and Perron (2013) and Iacone (2010). Modifying the estimator of Kuensch (1987) by adding a term to the spectral density that considers the contaminated process results in the estimator of Hou and Perron (2014).
In addition to the modified estimation methods of the memory parameter, we consider three estimation methods for perturbed fractional processes. In contrast to a pure fractional process, the short-run dynamics and long-run behavior of a perturbed fractional process are no longer driven by the same innovation. As defined in Frederiksen et al. (2012), a perturbed fractional process can be expressed by a signal-plus-noise model with the signal process being a long-memory process, which is perturbed by an additive noise term. We focus on local Whittle based estimators for perturbed fractional processes and refer to Sun and Phillips (2003) or Arteche (2006) for contributions based on the log-periodogram estimator.
Extending this survey paper by the estimators of Andrews and Sun (2004), Hurvich et al. (2005) and Frederiksen et al. (2012) we are considering an additive noise component as well as short-run effects as another form of contamination. All three estimation methods modify the form of the spectral density. Andrews and Sun (2004) replace a constant term in the spectral density by a polynomial structure to model the short-run dynamics. Hurvich et al. (2005) extend the estimator of Hurvich and Ray (2003) that is adding an additional term for capturing the effect of the noise term to the low frequency behavior of the spectral density. The estimator of Frederiksen et al. (2012) models the short-run dynamics as well as the influence of an additive noise component by a polynomial and allows for serial dependence in the noise term, in contrast to Frederiksen and Nielsen (2008).
According to our Monte Carlo results, we conclude to use either the estimator of Iacone (2010) or Hou and Perron (2014) in cases of low frequency contaminations. Although the estimator of McCloskey and Perron (2013) yields comparable estimation results, it suffers from a higher variance. The performance of the estimator of Smith (2005) in cases of high short-run dynamics or perturbation is comparable to the standard perturbation methods, although the estimator has originally been developed for low frequency contamination. However, in the latter situation, the estimator is no alternative to its competitors. Furthermore, the estimator of Hurvich et al. (2005) and Frederiksen et al. (2012) yield almost identical findings, which are in most situations better than the results of Andrews and Sun (2004). Based on the Monte Carlo results, we recommend applying the low frequency estimators when it is unclear whether a low frequency contamination or a perturbed fractional process is present.
Three out of the seven modified semiparametric estimators that we consider have been applied to empirical data in the original paper, such as the Dow Jones Industrial Average or the S&P 500 series. Smith (2005) and Frederiksen et al. (2012) find upward biased estimator suggesting a long-memory process, whereas McCloskey and Perron (2013) find evidence for a spurious long-memory process. In an empirical application, we apply the methods robust to perturbation as well as to low frequency contaminations to daily log-absolute returns of the S&P 500 which gives us additional insights which of these effects if not both are of relevance in our data set. We conclude that the analyzed time series follows rather a spurious long-memory process than a perturbed fractional process. This finding is further supported by a test of Qu (2011) that rejects the null hypothesis of a true long-memory process at the 1% significance level.
The structure of the paper is as follows. In the next section, we introduce a variety of modified semiparametric estimation methods of the memory parameter. In Section 3, we analyze the small sample performance of the different estimation approaches in a Monte Carlo study. Section 4 presents the empirical application and Section 5 concludes. Supplementary Materials with detailed Monte Carlo results are provided on the authors webpages.

2. Semiparametric Estimation Methods

In this section, we introduce several concepts of standard and modified estimation methods. We start with general long-memory definitions and briefly review the two standard estimation methods. An overview of modified local Whittle and log-periodogram estimation methods follows which have been designed to capture low frequency contaminations and to reduce the bias of the standard methods. Afterwards, we consider approaches which focus on perturbed fractional processes and therefore account for short-run and additive noise effects.

2.1. The Model and Standard Estimation Methods

A pure long-memory process is typically modeled as an A R F I M A ( p , d , q ) process which has been developed by Granger and Joyeux (1980) and Hosking (1981). It is defined as
Φ ( L ) ( 1 L ) d y t = Θ ( L ) ϵ t ,
where ϵ t i i d ( 0 , σ ϵ 2 ) , Φ ( L ) and Θ ( L ) are the autoregressive and moving average polynomials, respectively, with all roots lying outside the unit circle. The order of fractional integration is given by d, L denotes the backshift operator and ( 1 L ) d = j = 0 Γ ( j d ) L j Γ ( d ) Γ ( j + 1 ) with the Gamma function Γ ( z ) . The interval 0 < d < 1 / 2 implies long memory and short memory exists for d = 0 with an exponentially decaying autocorrelation function and a bounded spectral density function for zero frequencies. The process is stationary and invertible for the interval 1 / 2 < d < 1 / 2 as well as mean reverting for d < 1 . Typically, a long-memory process is defined by not summable autocovariances, k = | γ ( k ) | = . Further, the spectral density function of a stationary A R F I M A process is given by f ( λ ) = G λ 2 d for frequency λ close to the origin and a slowly varying function G (cf. Doukhan et al. 2002).
In the following, we introduce the data generating process with a constant term c and y t being a short or long-memory process,
x t = c + y t + A u t + B w t .
The low frequency contamination and additive noise component are captured by u t and w t , where A is a dummy variable which is 1 if we include low frequency contaminations in the DGP and zero otherwise. The dummy variable B is its respective equivalent for a possible perturbation process. We consider several types of low frequency contamination, among them are a sinus time trend and randomly (non-)stationary as well as deterministic level shifts. The perturbation process is captured by different forms of ARMA processes with varying coefficients and variances of the error term. The explicit structure of u t and w t will be discussed in Section 3 in more detail. The two standard estimation methods are designed for a process of the form x t = y t . The four estimators especially designed for low frequency components consider the data generating process x t = y t + u t , except for Smith (2005) who excludes the short-memory process in y t . Additionally, Hou and Perron (2014) extend the process to x t = y t + u t + w t with w t being a zero mean white noise process with variance σ w 2 . The three estimators developed for perturbed fractional processes are exhibiting the following DGP structure x t = y t + w t with w t being an A R M A process. Finally, a joint definition of the periodogram for the individual processes in Equation (1) with I v ( λ ) = ( 2 π T ) 1 | t = 1 T v t exp ( i t λ ) | 2 with v = x , y , u and T being the sample size is provided by Hou and Perron (2014).
Before we compare the modified estimation methods, we briefly summarize the properties of two most commonly applied semiparametric estimation procedures of Geweke and Porter-Hudak (1983) and Kuensch (1987). They serve as benchmark approaches, since the modified versions should generally produce a smaller bias in the presence of contaminations. Further, the efficiency loss of the modified versions in situations without contaminations can be illustrated by comparing their performance to the standard methods. Geweke and Porter-Hudak (1983) propose the log-periodogram estimator as one of the earliest estimator for a semiparametric model. The GPH estimator is based on a regression model which is obtained by replacing the spectral density of a process by the logarithm of its periodogram,
log I y ( λ j ) = c + d X j + e j , λ j = 2 π j / T , j = 1 , , m ,
with a constant term c and an error term e j . The explanatory variable is given by X j = log ( 2 2 cos ( λ j ) ) with the bandwidth parameter m and the Fourier frequency λ j . Minimizing the sum of squared residuals of the above regression model with respect to the slope coefficient yield
d ^ G P H = 1 2 j = 1 m Y j Y ¯ log I y ( λ j ) j = 1 m Y j Y ¯ 2 ,
with Y j = log | 1 exp ( i λ j ) | = log | 2 sin ( λ j / 2 ) | and Y ¯ = 1 / m j = 1 m Y j . Robinson (1995) shows that the asymptotic distribution equals m ( d ^ G P H d ) d N 0 , π 2 24 for d ( 1 / 2 , 1 / 2 ) . For the following asymptotic properties of the different estimation methods we assume the stationary interval of the memory parameter, if not stated differently. The local Whittle method of Kuensch (1987), also known as the Gaussian semiparametric estimation method, is often applied in the literature. The estimator is based on the local Whittle likelihood function
Q ( G , d ) = 1 m j = 1 m log ( G λ j 2 d ) + I y ( λ j ) G λ j 2 d ,
with j = 1 , , T / 2 . Minimizing Q ( G , d ) with respect to G leads to the profiled likelihood function
R ( d ) = log 1 m j = 1 m λ j 2 d I y ( λ j ) 2 d m j = 1 m log λ j .
The local Whittle estimator is given by d ^ L W = arg min d R ( d ) and converges to a normal distribution according to m ( d ^ L W d ) d N 0 , 1 4 .

2.2. Modified Log-Periodogram Estimator of Smith (2005)

The form of the spectral density is influenced by low frequency contaminations, however, standard estimation methods are not considering this change and biased estimators emerge. Smith (2005) introduces a modified log-periodogram estimator. For rare level shifts, the part of the adjusted spectral density that is mainly responsible for the high bias of the standard GPH method equals log ( p 2 + λ 2 ) . Since the level shift probability p is unknown an estimate p T = k m / T is introduced with k > 0 . The estimation approach considers the new form of the spectral density with p T by including the above component of the adjusted spectral density as a regressor in Equation (2). The regression model of the log-periodogram estimator is extended by the additional regressor to
log I x ( λ j ) = c + d X j + τ Z j + e j ,
with X j as defined above and Z j = log ( k m / T ) 2 + λ j 2 . The modified log-periodogram estimator is given by
d ^ S M I = ( X ˜ M X ˜ ) 1 X ˜ M log I x ( λ j ) ,
with X ˜ = X X ¯ , the annihilator matrix M = I P = I Z ˜ ( Z ˜ Z ˜ ) 1 Z ˜ with P denoting the projection matrix and Z ˜ = Z Z ¯ . Simulation studies of Smith (2005) recommends to set k = 3 . The limiting distribution is similar to the log-periodogram distribution with m ( d ^ S M I d ) d N 0 , π 2 24 z k . However, the bias reduction implicates a variance increase which is captured by the scale factor z k , with z 3 = 0.31 for k=3.

2.3. Modified Local Whittle Estimator of Iacone (2010)

In contrast to modifying the form of the spectral density, Iacone (2010) proposes a trimmed version of the Gaussian semiparametric estimator of Kuensch (1987). The idea of the procedure is to balance the frequencies of the periodogram. On the one hand, enough frequencies should be considered so that the stationary A R F I M A process dominates in this region and on the other hand lower frequencies for which the contamination component is most influential should be excluded. Therefore, a trimming parameter l is introduced to the local Whittle likelihood function and the loss function in Equation (3) can be rewritten as,
R ( d ) = log 1 m l + 1 j = l m λ j 2 d I x ( λ j ) 2 d m l + 1 j = l m log λ j .
The modified local Whittle estimator is given by d ^ I A C = arg min d R ( d ) and by setting l = 1 the local Whittle estimator is obtained. In general, the trimming and bandwidth parameter need to be set to l = m a x { 1 , K l T α } and m = m a x { l + 1 , K m T β } with 0 α < β < 1 for some K l , K m ( 0 , ) and 1 l < m T / 2 . Under certain assumptions of the trimming and bandwidth parameter, the estimator of Iacone (2010) follows the limiting distribution of the local Whittle estimator without an inflated variance caused by the trimming technique, m ( d ^ I A C d ) d N 0 , 1 4 .

2.4. Modified Log-Periodogram Estimator of McCloskey and Perron (2013)

In addition to Smith (2005), who introduces a biased correction form of the GPH estimator, McCloskey and Perron (2013) provide a trimmed version of the popular log-periodogram estimator of Geweke and Porter-Hudak (1983). One major difference between these two estimation methods is the restriction on the process. The modified GPH estimator of Smith (2005) is designed for a short-memory process, whereas McCloskey and Perron (2013) extend their estimator to short or long-memory processes. The standard log-periodogram regression from Equation (2) is adjusted by the trimming parameter l and given by
log I x ( λ j ) = c + d X j + e j ,
with j = l , , m . Applying the ordinary least squares method, the modified GPH estimator can be expressed as
d ^ M C P = 1 2 j = l m Y j Y ¯ log I x ( λ j ) j = l m Y j Y ¯ 2 ,
with Y j = log | 1 exp ( i λ j ) | and Y ¯ = ( m l + 1 ) 1 j = l m Y j . In addition to the general requirements on the trimming and bandwidth parameter mentioned above for the previous estimator, McCloskey and Perron (2013) constrained the trimming parameter to a strictly positive α value. Further, an additional condition on the two user-chosen parameters is expressed by ( m log m ) / T + ( l log 2 m ) / m + ( T 1 2 d log 4 m ) / ( l 2 2 d ) 0 as T . To satisfy this condition α is restricted to certain values depending on the memory parameter. For the interval of particular interest, 0 d < 1 / 2 , the exponent of the trimming parameter needs to be set to α = 1 / 2 + ε with ε > 0 . The optimal choice of the upper and lower bound of the sum in (4) is crucial for this estimation method.
Under restrictive assumptions concerning the trimming and bandwidth parameter, the limiting distribution of the trimmed GPH estimator shows no efficiency loss in cases of low frequency contaminations so that m ( d ^ M C P d ) d N 0 , π 2 24 is still valid. However, in the absence of a contamination component, the variance increases and, compared to the trimmed estimator of Iacone (2010), the variance increase is sometimes extremely high.

2.5. Modified Local Whittle Estimator of Hou and Perron (2014)

This approach considers the new form of the approximated spectral density when low frequency contaminations are present. In contrast to Iacone (2010) and McCloskey and Perron (2013), this method considers all data and no trimming technique is required. Adding the new term G u λ 2 / T to the standard form of the spectral density, a so-called pseudo spectral density can be written as
f x ( λ ) = G λ 2 d + G u λ 2 / T = G ( λ 2 d + ( G u / G ) λ 2 / T ) = G ( λ 2 d + θ u λ 2 / T ) ,
where θ u is the signal-to-noise ratio. The new parameter θ u controls the influence of contaminations at low frequencies. The pseudo spectral density aims to provide a good approximation of the true spectral density in the existence of low frequency contaminations. The pseudo likelihood function is given by
Q ( G , d , θ u ) = 1 m j = 1 m log f x ( λ j ) + I x ( λ j ) f x ( λ j )
and the modified local Whittle estimator is defined as d ^ H P = arg min d , θ u R ( d , θ u ) for d ( 1 / 2 , 1 ) and θ u ( 0 , ) with
R ( d , θ u ) = log 1 m j = 1 m I x ( λ j ) λ j 2 d + θ u λ j 2 / T + 1 m j = 1 m log λ j 2 d + θ u λ j 2 / T .
In the absence of low frequency contamination, the form of the pseudo likelihood function in Equation (5) reduces to the standard local Whittle likelihood function. Hence, no asymptotic efficiency loss exists with m ( d ^ H P d ) d N 0 , 1 4 for d [ 0 , 1 / 2 ) . In contrast to the aforementioned authors, Hou and Perron (2014) are the first who provide an extension to account for additive noise and short-memory effects. The modifications are based on the concepts of Andrews and Sun (2004), Hurvich et al. (2005) and Frederiksen et al. (2012) which follow in the next subsections.

2.6. Local Polynomial Whittle Estimator of Andrews and Sun (2004)

In addition to the modified estimation methods of the memory parameter, we consider three estimation methods for perturbed fractional processes. Arteche (2004) shows that when the local Whittle and log-periodogram estimator are applied to perturbed fractional processes they are biased but remain consistent and asymptotical normal. Therefore, several estimation methods have been developed to account for the perturbation. The following three estimation methods modify the local Whittle estimator of Kuensch (1987).
In contrast to a pure fractional process, the short-run dynamics and long-run behavior of a perturbed fractional process are no longer driven by the same innovation. As defined in Frederiksen et al. (2012), a perturbed fractional process can be expressed by a signal-plus-noise model with the signal process being a long-memory process, which is perturbed by an additive noise term. Following the authors, we use an ARMA process for the perturbation process.
The estimation method of Andrews and Sun (2004) adjusts the form of the spectral density by providing a polynomial structure. For frequencies close to the origin the term log G can be approximated by log G γ ( θ s , λ ) with the polynomial γ ( θ s , λ ) = k = 1 r θ k λ 2 k . This leads to the following form of the spectral density f ( λ ) = G λ 2 d = G λ 2 d exp ( γ ( θ s , λ ) ) and the resulting estimator is known as local polynomial Whittle (LPW). The log-likelihood function of the estimator is given by
Q ( G , d , θ s ) = 1 m j = 1 m log G λ j 2 d exp ( γ ( θ s , λ j ) ) + I x ( λ j ) G λ j 2 d exp ( γ ( θ s , λ j ) ) ,
where γ ( θ s , λ j ) = k = 1 r θ k λ j 2 k and θ s = ( θ 1 , , θ r ) . The local polynomial Whittle estimator is defined as d ^ L P W = arg min d , θ s R ( d , θ s ) and θ s will be in a set of R with
R ( d , θ s ) = log 1 m j = 1 m λ j 2 d I x ( λ j ) exp ( γ ( θ s , λ j ) ) 2 d m j = 1 m log λ j 1 m j = 1 m γ ( θ s , λ j ) + 1 ,
and, by setting θ s = 0 in Equation (6), the standard local Whittle estimator is obtained. The polynomial degree r influences on the one hand the variance and on the other hand the convergence rate of the estimator. We are more interested in a reduced variance than in a convergence rate close to a parametric one. Therefore, we choose a small polynomial degree and set r = 1 .
The variance of the LPW estimator increases by a constant c r that depends on the polynomial degree r since a polynomial structure of the spectral density is considered. The asymptotic properties can be summarized by m ( d ^ L P W d ) d N 0 , c r 4 where the constant term in the variance is increasing with r and equals c 1 = 9 / 4 for r = 1 .

2.7. Local Whittle with Noise Estimator of Hurvich et al. (2005)

Hurvich et al. (2005) suggest to replace the constant component G in the spectral density by a more complex function G ( 1 + h ( d , θ ρ , λ ) ) . We focus on the following parameterizations of h ( d , θ ρ , λ ) = θ ρ λ 2 d . The local Whittle with noise (LWN) estimator of Hurvich et al. (2005) is nested in the estimator of Frederiksen et al. (2012) and the additional parameter θ ρ is labeled according to them. The above parameterization of h ( d , θ ρ , λ ) excludes serial correlation between the noise term and the long-memory process, unlike the method of Frederiksen et al. (2012). With the improved form of the spectral density and the additional parameter θ ρ , the log-likelihood function equals
Q ( G , d , θ ρ ) = j = 1 m log G λ j 2 d ( 1 + h ( d , θ ρ , λ j ) ) + I x ( λ j ) G λ j 2 d ( 1 + h ( d , θ ρ , λ j ) ) .
Minimizing Q ( G , d , θ ρ ) with respect to G leads to the profiled likelihood function
R ( d , θ ρ ) = log 1 m j = 1 m I x ( λ j ) λ j 2 d 1 + h ( d , θ ρ , λ j ) 2 d m j = 1 m log λ j ( 1 + h ( d , θ ρ , λ j ) ) .
The LWN estimator is defined as d ^ L W N = arg min d , θ ρ R ( d , θ ρ ) for d ( 0 , 1 ) and θ ρ ( 0 , ) . The standard local Whittle estimator is obtained in the case of h ( d , θ ρ , λ ) = 0 . An important difference to the previously introduced estimation methods is the domain of the memory parameter since the short-memory case is explicitly not allowed, instead d is supposed to be greater than zero. Allowing for no correlation between the signal and noise process, the variance of the LWN estimator is depending on d with d ( 0 , 3 / 4 ) , so that the limiting distribution is expressed by m ( d ^ L W N d ) d N 0 , ( 1 + d ) 2 16 d 2 .

2.8. Local Polynomial Whittle with Noise Estimator of Frederiksen et al. (2012)

Frederiksen et al. (2012) combine the approaches of Andrews and Sun (2004) and Hurvich et al. (2005) to create a new estimation method, the so-called local polynomial Whittle with noise (LPWN) estimator. In contrast to Hurvich et al. (2005), the spectral density of the LPWN estimator is locally approximated by polynomials instead of a constant near the zero frequency. Furthermore, this procedure differs from the aforementioned methods, since it considers the correlation between the signal and the noise process. Therefore, two polynomials are introduced that capture the noise, r w , and short-memory effects r y . Frederiksen et al. (2012) propose the following approximation of the spectral density f x ( λ j ) G λ 2 d h ( d , θ , λ ) . The LPWN estimator assumes an additional functional form of the spectral density that is expressed by
h ( d , θ , λ ) = exp h y ( θ y , λ ) + θ ρ λ 2 d exp h w ( θ w , λ )
with θ = θ y , θ ρ , θ w and by setting h ( d , θ , λ ) = 1 the spectral density of the local Whittle estimator is obtained. The exponents in Equation (7) exhibit the polynomial structure of the earlier introduced estimator of Andrews and Sun (2004) with h a ( θ a , λ ) = k = 1 r a θ a , k 2 k where a = y , w and h a ( θ a , λ ) = 0 for r a = 0 . Additionally, by setting both polynomials r y and r w to zero the LWN estimator of Hurvich et al. (2005) is obtained with h ( d , θ , λ ) = 1 + θ ρ λ 2 d . Further, the authors distinguish between three different types of LPWN( r y , r w ) estimators, the LPWN(0,1), LPWN(1,0) and LPWN(1,1). The LPWN estimator is obtained by d ^ L P W N = arg min d , θ R ( d , θ ) for d ( 0 , 1 ) and θ ( R y × ( 0 , ) × R w ) with the objective function
R ( d , θ ) = log 1 m j = 1 m λ j 2 d I x ( λ j ) h ( d , θ , λ j ) 2 d m j = 1 m log λ j + 1 m j = 1 m log h ( d , θ , λ j ) .
The polynomials increase the asymptotic variance of m ( d ^ L P W N d ) by a multiplicative constant depending only on d and not on the parameters θ , with d ( 0 , 3 / 4 ) . The LPWN estimator is normally distributed with a zero mean and exhibits a more complex form of the variance compared to the aforementioned methods, which can be found in Frederiksen et al. (2012).

3. Monte Carlo Analysis

This section analyzes the performance of the previously presented estimators under different scenarios. First, we introduce the Monte Carlo setup with different kind of DGPs and parameter settings for the estimation methods. Afterwards, we present the simulation results by focusing on the bias and root mean squared error (RMSE) of the estimators.

3.1. Monte Carlo Setup

We compare the performance of the estimation methods under nine different DGPs, which are given in Table 1. The DGP types are obtained by adapting parts of the Monte Carlo structure provided by Qu (2011), Frederiksen et al. (2012) and Hou and Perron (2014). The process y t is modeled by an ARFIMA (1,d,0) with ( 1 α y L ) ( 1 L ) d y t = ε t , where ε t is a zero mean white noise process if not otherwise defined. We standardize the ARFIMA process by its own standard deviation and consider the following values of the autoregressive and persistence coefficient with d = 0.0, 0.2, 0.4, 0.6 and α y = 0.0, 0.3, 0.6. By choosing d = 0.6 , we violate against the stationarity assumption for a variety of estimators to check the robustness in the case of non-stationarity. The sample size is set to T = 256, 512, 1024, 4096 and the results are based on 1000 Monte Carlo replications.
In the following, we provide further information on the different types of DGPs given in Table 1. Unreported simulation results of a linear trend as contamination show almost no difference to the performance of a sinus trend and are therefore omitted. The components π t and η t of the random level shift (RLS) processes are mutually independent and the shift probability equals p = 10 / T . For the deterministic level shift process, we consider five shifts at fixed user-chosen dates with c i = 2 , 2 , 4 , 2 , 1 , 2 for i = 1 , , 6 and T i / T τ i with 0 < τ 1 < < τ 5 < 1 . DGPs 7 and 8 are especially designed for the perturbed fractional estimation methods. The ARMA(0,0) process is basically an additive white noise process with a large variance. Unreported simulation results of an ARMA(1,0) process with α w = 0.6 are showing no clear pattern and recommendations are hard to formulate. Therefore, we omit the results and instead consider the ARMA(0,1) process. The last DGP combines the two groups of contaminations with a low frequency component, in the form of a stationary RLS, and an additive noise term as a perturbation contamination.
Following Frederiksen et al. (2012), we set the noise-to-signal ratio equal to five and by rearranging the noise-to-signal ratio the variance of the ARFIMA (1,d,0) process is obtained by
σ ε 2 = ( 1 α y ) 2 · ( 1 + β w ) 2 ( 1 α w ) 2 5 .
We conduct the simulation study for all three forms of the LPWN estimator of Frederiksen et al. (2012). The bias and RMSE results of the three different types are very similar, especially the LPWN(0,1) and LPWN(1,0) show no significant difference. For the Monte Carlo study and the empirical example, we present the results of the LPWN(1,1) since we are varying the autoregressive coefficient for every DGP and also analyze several noise structures as perturbation. In general, we follow the commonly used parameter settings in the literature to reflect the empirical findings in the financial volatility. For all estimation methods, we choose the following values of the bandwidth m = T δ with δ = 0.60 , 0.70 , 0.79 . The additional parameter of Smith (2005) is set to k = 3 . To satisfy the trimming and bandwidth condition of Iacone (2010), we choose m = 0.9 T δ and l = 0.2 T δ 0.05 . We consider the adaptive procedure of McCloskey and Perron (2013), since this extension exhibits a smaller variance. The first step of the adaptive method, i = 1 , applies the setting of the trimmed GPH estimator with l = K l T 1 / 2 + ε . For the next iterations, i > 1 , the trimming changes to l = K l T ( 1 2 d ^ i 1 ) / ( 2 2 d ^ i 1 ) + ε with d ^ as a consistent estimator of d. Two different convergence criteria are used, either the procedure stops as | d ^ i d ^ i 1 | < 0.01 or when i > 9 with the final value of d ^ . We set K l = 1 and ε = 0.03 for the estimator of McCloskey and Perron (2013) and the GPH estimator is used as starting value. The numerical optimization of the Monte Carlo study is based on R using the L-BFGS-B algorithm developed by Byrd et al. (1995).

3.2. Monte Carlo Results
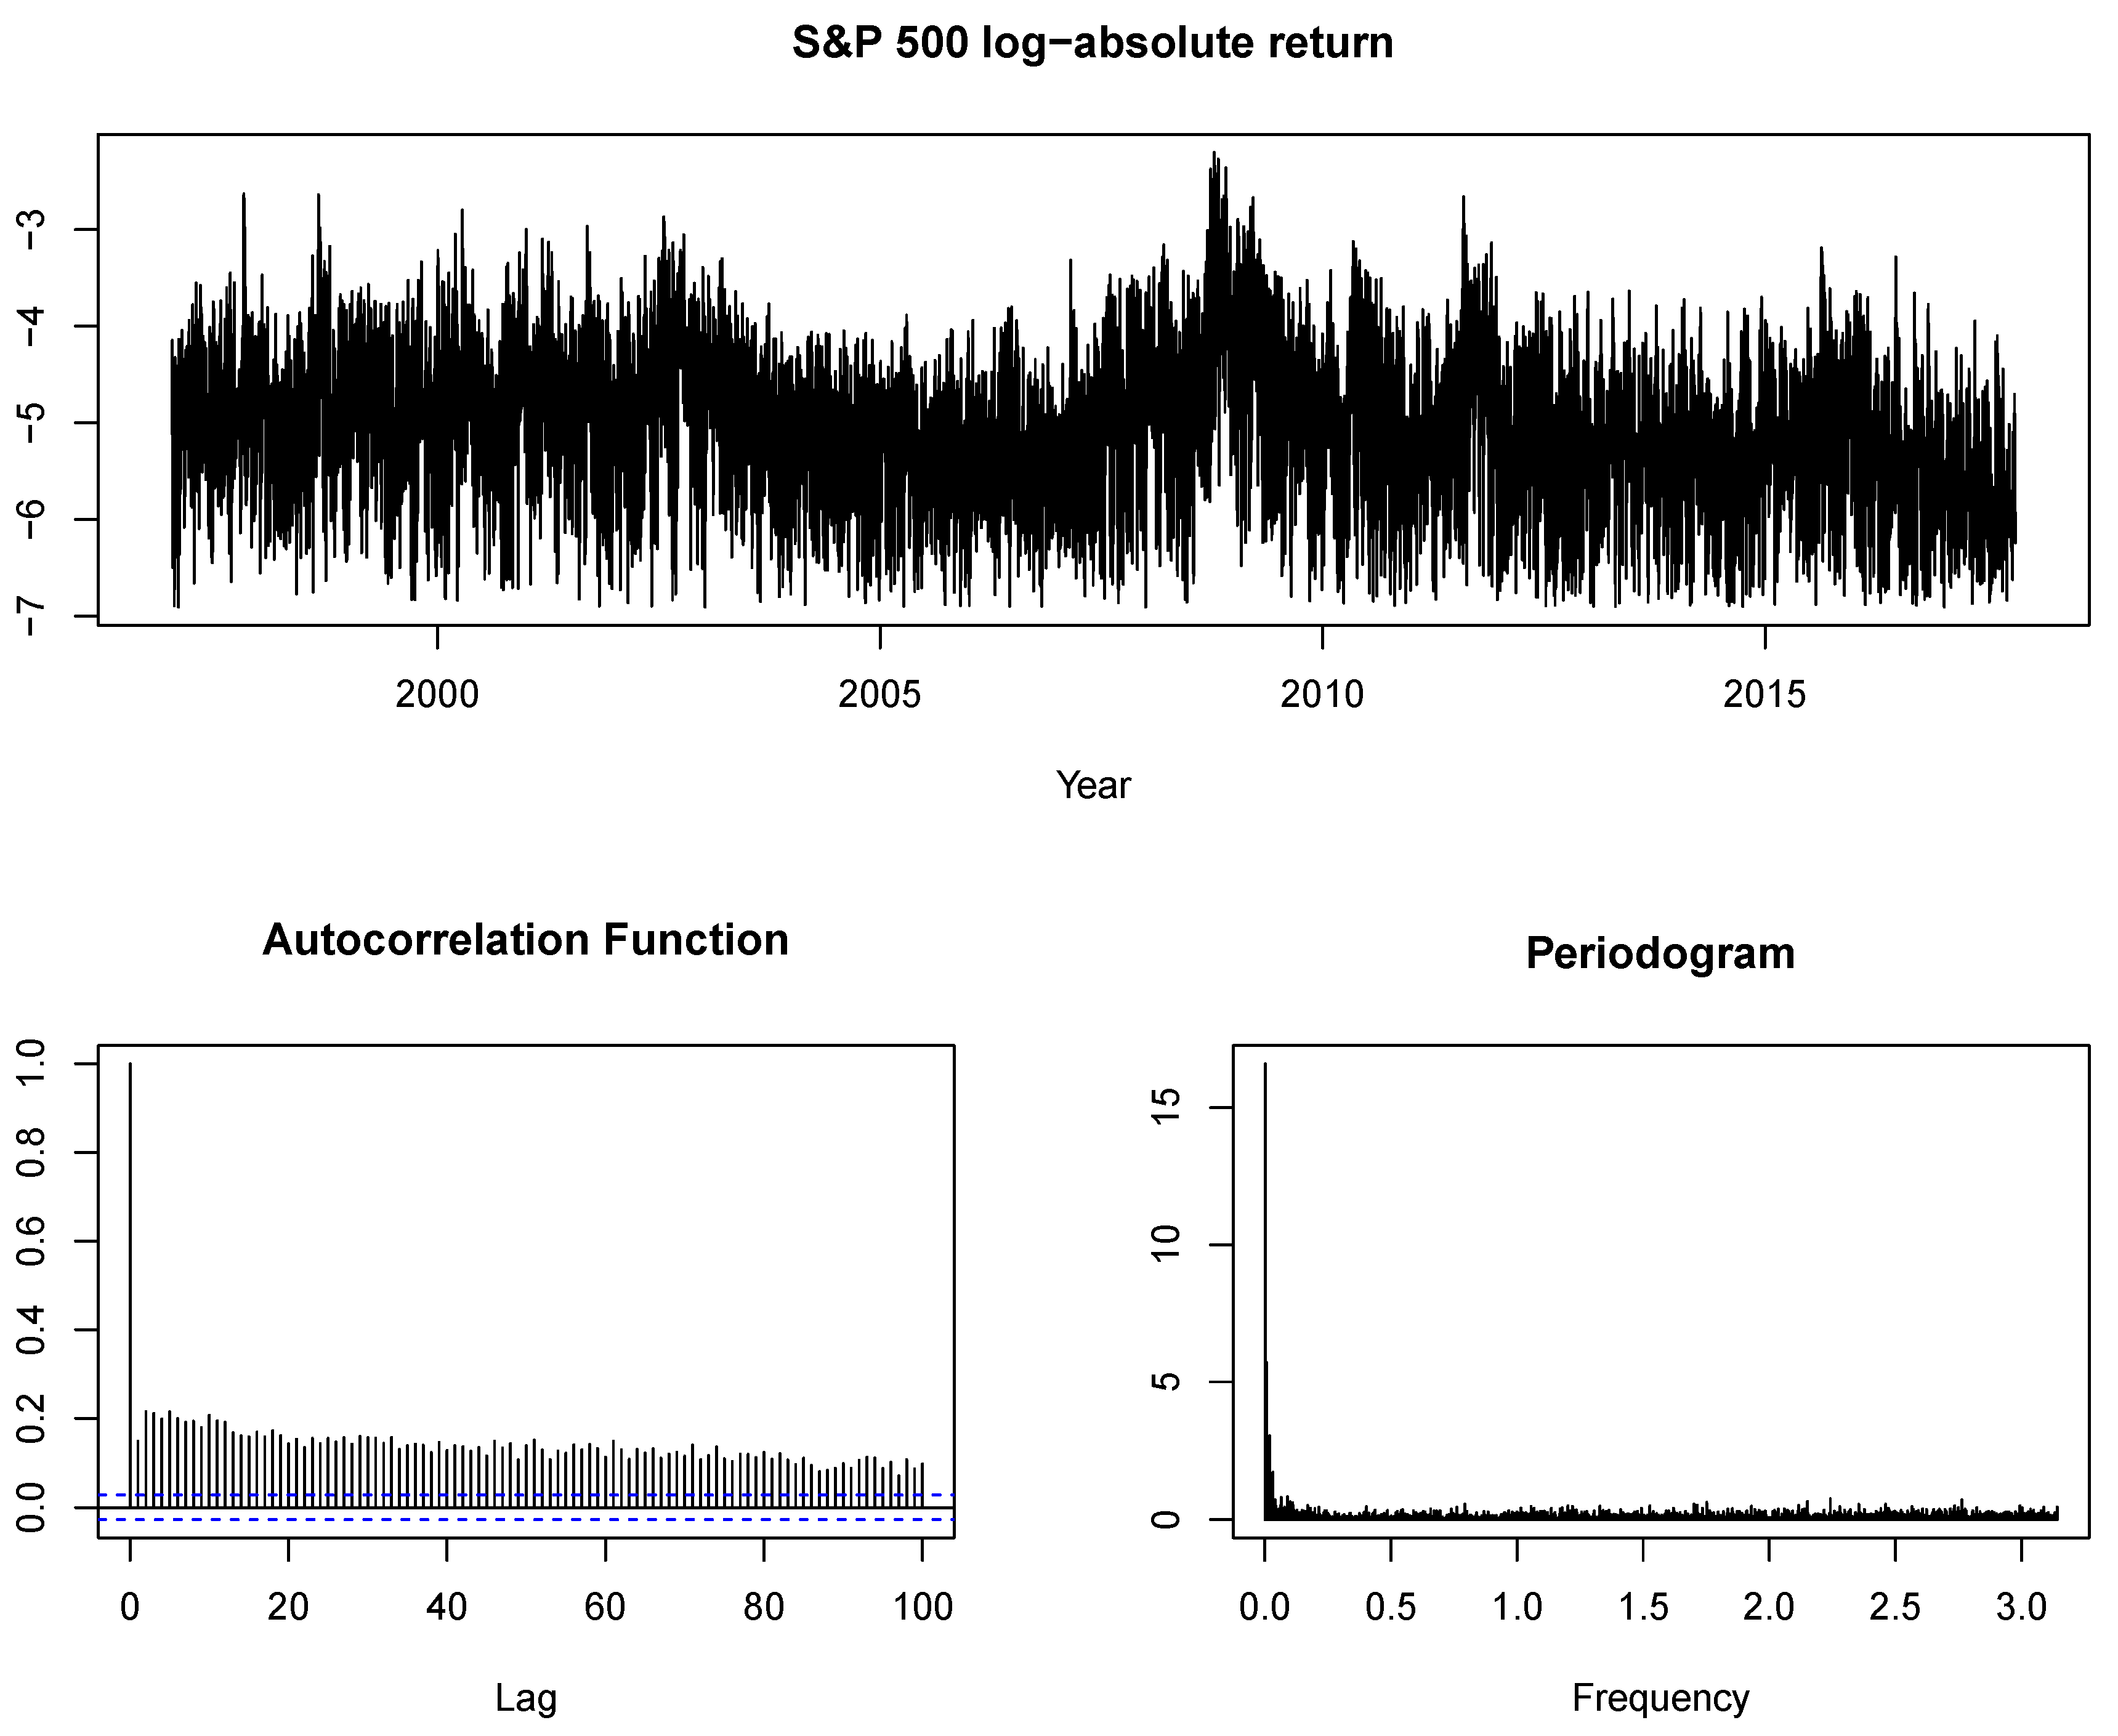
In the following, the DGPs are numbered consecutively according to the order in Table 1. The bias and root mean squared error results of all estimation methods and for the corresponding DGPs are given in the Supplementary Materials. Before presenting some detailed results, we are summarizing the major findings of the simulation study.
The two standard estimation methods are very robust compared to the modified methods in two cases. Considering the first DGP without contamination and the ARFIMA (1,d,0) plus GARCH (1,1), the log-periodogram and Gaussian estimator are both characterized by a smaller bias and RMSE especially for ϕ 0.3 . In the case of a larger bandwidth and ϕ = 0.6 , the modified estimators of Andrews and Sun (2004) and Hou and Perron (2014) perform slightly better or equivalent in terms of the RMSE than the local Whittle estimator. The same results hold for the modified estimator of Smith (2005) compared to the GPH estimator.
For a sinus trend or deterministic level shift as contamination type, the modified estimator of Hou and Perron (2014) is outperforming the local Whittle estimator in terms of bias and also for the majority cases of RMSE. Additionally, for the two variations of the random level shift process, d ^ H P performs well, especially for lower values of the memory parameter (d ≤ 0.2).
The two trimmed versions of the local Whittle and GPH estimator are both exhibiting a very similar pattern over the DGPs. Similar to the estimator of Hou and Perron (2014), the estimators of Iacone (2010) and McCloskey and Perron (2013) also have their strength in the presence of level shifts, irrespective of whether they occur randomly (non-)stationary or deterministic. The good performance in the aforementioned situations is restricted to smaller values of d and to less short-run effects.
While the estimators of Hou and Perron (2014), Iacone (2010) and McCloskey and Perron (2013) often improve the standard estimators in the short-memory case or without short-run dynamics, the methods of Smith (2005), Andrews and Sun (2004), Hurvich et al. (2005) and Frederiksen et al. (2012) outperform their respective standard methods for larger values of the persistence parameter (d ≥ 0.4) as well as for a higher short-run parameter ( ϕ 0.3 ). This finding is not very surprising for the three estimation methods designed for perturbation, however the good performance of d ^ S M I in these situations is rather unexpected. In particular, the DGPs especially constructed for the perturbation setup are dominated by the perturbation estimators and by Smith (2005). Moreover, unreported simulation studies stress the robustness of the estimation method of Smith (2005) to short-run effects with values larger than ϕ = 0.6 .
After a broad overview of the simulation results, we focus on three different contamination types in more detail: a sinus trend, a stationary random level shift and an additive noise term. Since the parameter intervals of the Monte Carlo study are very comprehensive, we concentrate on a sample size of T = 1024 for the following three tables and distinguish between two bandwidths. Further, we omit the persistence value of d = 0.6 for the first two detailed DGPs and for the third contamination type we add the memory value d = 0.6 but exclude the short-memory case.
The results of a sinus trend as contamination are presented in Table 2. The best performance in terms of lowest bias and RMSE is obtained by the GPH and modified GPH estimator of McCloskey and Perron (2013). Further, the trimmed local Whittle estimator of Iacone (2010) exhibits a comparable small bias and RMSE for ϕ = 0 . In the next step, we compare the modified methods to the respective standard estimators. The modified estimator of Hou and Perron (2014) outperforms the local Whittle estimator for all combinations in terms of bias and RMSE. Generally, the estimator improves the performance with a larger bandwidth, except for situations with a larger autoregressive parameter of the ARFIMA model. The performance of the estimator of Iacone (2010) is very similar with an even smaller bias and RMSE for ϕ = 0.0 and for ϕ = 0.3 combined with a smaller bandwidth. Although the trimmed GPH estimator of McCloskey and Perron (2013) performs well in terms of the bias for ϕ 0.3 , the inflated variance increases the RMSE compared to the GPH estimator in most cases. The estimator of Smith (2005) performs better with an increasing autoregressive parameter and for a larger bandwidth. However, the three estimation methods developed for perturbed fractional processes are not an alternative to the standard methods. For the trimmed local Whittle estimator, the reduction of the RMSE is in the range of 60–80% for ϕ = 0.0 and remains within 30–75% for ϕ = 0.3 . In contrast to the aforementioned estimator, the estimator of Hou and Perron (2014) has a smaller reduction of the RMSE for ϕ = 0.0 with 20–65% due to the higher bias. For ϕ = 0.3 , the reduction of the RMSE of d ^ H P is very similar to the estimator of Iacone (2010) with 35–80% and remains within 20–75% for ϕ = 0.6 , except for d = 0.4 . The estimator of Smith (2005) provides a smaller reduction of the RMSE compared to the estimator of Hou and Perron (2014) for the highest value of the autoregressive parameter with 5–50%.
Table 3 presents the results for a stationary random level shift as contamination. In general, the results of the non-stationary RLS in the Supplementary Materials have a similar pattern but with a larger bias due to the non-stationarity and, thus, an increased RMSE. Three out of the four modified estimators developed especially for low frequency contaminations, such as a random level shifts, improve the standard methods, especially for smaller persistence values. The highest reduction in the RMSE for the estimation methods of Hou and Perron (2014), Iacone (2010) and McCloskey and Perron (2013) is obtained for ϕ = 0.3 with 50–55%, 35–50% and 1–35%, respectively, and with less improvement for an increased short-run effect. The performance of d ^ S M I is rather unexpected and shows no improvement against the GPH estimator. The poor results of Smith (2005) are stressed by the fact that the estimator of Andrews and Sun (2004) outperforms d ^ S M I , even though the estimator of Smith (2005) has originally been developed for random level shifts, unlike d ^ L P W . The three estimation methods not explicitly developed for low frequency contaminations are offering no improvement. Nevertheless, compared to the sinus trend above the bias and RMSE decreased and the findings are getting closer to the other modified estimators, especially for a higher short-run dynamic.
After two typical examples of low frequency contaminations in the form of a time trend and level shift, we consider the effect of an additive noise term with the results given in Table 4. Overall, the estimators of Smith (2005), Hurvich et al. (2005) and Frederiksen et al. (2012) are the three best performing estimation methods in terms of bias and RMSE. In the following, we compare the modified methods to the respective standard estimators. As expected, the three estimation methods developed for perturbed fractional processes are dominating the standard methods in terms of a lower bias and RMSE, although a RMSE reduction is restricted to larger memory values of d 0.4 . Additionally, the estimator of Smith (2005) performs well compared to the GPH estimator. The reduction of the RMSE for the estimators of Smith (2005) and Andrews and Sun (2004) is decreasing over the ϕ interval and ranging from 20–30% to 15–30% and finally to 10–30%. A similar but slightly larger reduction of the RMSE is obtained for the estimation methods of Hurvich et al. (2005) and Frederiksen et al. (2012) with 20–60%, 15–60% and still 5–60% for the same aforementioned region of ϕ . The largest reduction is gained for d = 0.6 and δ = 0.79 , irrespective of the previous estimation methods. In the presence of an additive noise term, the two standard methods are more robust than the four modified estimators developed for low frequency contaminations, except for Smith (2005).
The last detailed DGP in Table 5 contains two groups of contamination: a stationary random level shift and an additive noise term. The overall outcome combines the individual results of each contamination type from Table 3 and Table 4. Excluding the short-memory process, the estimators of Smith (2005) and Andrews and Sun (2004) perform best in terms of bias and RMSE. For d 0.4 the reduction of the RMSE to the respective standard method of Smith (2005) and Andrews and Sun (2004) equals on average 30 % , irrespectively of the short-run influence. On the contrary, the estimators of Iacone (2010) and Hou and Perron (2014) provide the best results for a short-memory process being contaminated. With an increasing influence of the short-run dynamic, the reduction of the RMSE for d = 0 decreases on average from 55% to 50% and then to 30% for the estimators of Iacone (2010) and Hou and Perron (2014). Therefore, no procedure provides stable results over the whole range of the persistence parameter in the case of two contamination types.
In the following, we give a broad user-guideline by focusing on the RMSE. Usually, an economist is not aware of specific trends, level shifts or perturbation types when empirical data are analyzed. In the following, we compare the effects of two possible scenarios. The first situation is characterized by a perturbation process and instead of using the more appropriate estimators designed for this specific case one falsely applies estimation methods developed for low frequency contamination. The Monte Carlo results indicate a moderate increase of the RMSE for low frequency contaminated estimators, apart from d = 0.6 . The next scenario summarizes the reverse case, which means that, for a low frequency contaminated process, the estimators developed to capture perturbation are used. Depending on the specific type of low frequency contamination, the Monte Carlo study shows mixed results. Considering a sinus trend or deterministic level shift the RMSE increases substantially for the perturbation estimators, in some cases three times as much as the estimators developed for low frequency contamination. The increase of the RMSE for a (non-)stationary RLS is lower than for the two aforementioned processes but still more than twice as high as the RMSE of low frequency contaminated estimators. The random level shift process plus an additive noise term shows slightly higher root mean squared errors. Considering the three different types of random level shifts an improvement of the RMSE is obtained for d = 0.6 when the perturbation estimators are used instead of the methods designed for low frequency contamination. Therefore, we recommend the estimators developed for low frequency contamination, since the increase in a perturbation setup is not as severe as in the reverse case, especially in the stationary region of the memory parameter.
In summary, our results show a good performance of d ^ S M I in situations of a high short-run dynamic and in typical perturbation situations, however, in cases of low frequency contaminations, the estimator shows some weaknesses. The estimators of Iacone (2010) and Hou and Perron (2014) perform very similar in terms of bias and RMSE, whereas d ^ H P is slightly better. In many situations, the estimator of McCloskey and Perron (2013) cannot compete with the other modified estimators developed for low frequency contamination in terms of RMSE due to the higher variance. Finally, the estimators of Hurvich et al. (2005) and Frederiksen et al. (2012) yield almost identical findings, which are in most situations better than the results of Andrews and Sun (2004).

4. Application

In this section, we analyze the daily log-absolute return series of the S&P 500 from 1 January 1997 to 31 October 2017 (T = 5245) to investigate the robustness of the aforementioned results to the choice of estimator. Furthermore, we apply methods robust to perturbation as well as to low frequency contaminations which gives us additional insights which of these effects if not both are of relevance in our data set. We follow the method of Xu and Perron (2014) and calculate the log-absolute returns as log ( | r t | + 0.001 ) . The log-returns are obtained by differencing the logarithm of the price index, r t = log ( p t ) log ( p t 1 ) , and the constant 0.001 is added to avoid the problem of taking the logarithm of zero. Figure 1 displays the time series of the S&P 500 with the hyperbolically decaying autocorrelation function and the periodogram with a pole at the origin, as typical characteristics of a long-memory process.
We estimate the persistence parameter with nine different estimation methods and vary the bandwidth parameter according to our Monte Carlo study with m = 1 + T δ and δ = 0.60 , 0.70 , 0.79 . The parameter settings of the corresponding estimation methods remain unchanged to the simulation study above. Table 6 shows the estimation results of d ^ and the standard errors which are given in brackets below. Additionally, we apply the univariate test of Qu (2011) to test the null hypothesis of a true long-memory process against spurious long memory. The test statistics are given in the last column of Table 6. We set the trimming parameter of Qu (2011) to ε Q u = 0.02 and the critical value equals 1.517 at the 1% significance level.
In general, the memory parameters decrease with an increased bandwidth, with the exception of d ^ L W N and d ^ L P W N 11 . This finding gives a first hint that the series might be contaminated since the long-memory component dominates for higher frequencies in a contaminated process (cf. Perron and Qu 2010). The estimators of Iacone (2010), Hou and Perron (2014) and McCloskey and Perron (2013) are downward biased compared to the respective non-modified standard method. Especially for the highest bandwidth ( m = 1 + 5245 0.79 = 869 ), the reduction of the memory is extremely strong with less than half of the memory value for d ^ H P and d ^ I A C compared to d ^ L W . This downward pattern of the estimators for an increased bandwidth suggests the existence of low frequency contaminations in the log-absolute return series of the S&P 500. This interpretation is in line with the test results of Qu (2011). The test rejects the null hypothesis for δ = 0.70 and δ = 0.79 at the 1% significance level and therefore suggests that the S&P 500 series follows a spurious long-memory process.
Contrary to this finding, the four other estimation methods present upward biased estimator of d ^ in a non-stationary region compared to the local Whittle or GPH estimator. The estimator of Andrews and Sun (2004) increases less than the other estimators and lies only for δ = 0.60 in the non-stationary region. However, the estimators of Smith (2005), Frederiksen et al. (2012) and, especially, Hurvich et al. (2005) show larger memory parameters in the non-stationary region. The estimation results of Hurvich et al. (2005) and Frederiksen et al. (2012) are very similar. As expected from the simulation study, the estimator of Smith (2005) behaves rather unexpected since it is an estimator originally designed to capture low frequency contaminations instead of perturbation.
The estimators developed to capture perturbation are in the non-stationary region and combined with downward biased standard estimators and even more biased modified estimators for low frequency contamination a perturbed fractional process may be possible (cf. Wenger et al. 2017). Our findings are in line with those of McCloskey and Perron (2013) and Frederiksen et al. (2012), whereas the interpretation of the latter authors differs to our interpretation of a spurious long-memory process. We conclude that the analyzed time series follows a spurious long-memory process rather than a perturbed fractional process. In addition to the estimation results, this interpretation is supported by a formal test of Qu (2011) and the current literature of spurious long memory (cf. Lu and Perron 2010 or Qu and Perron 2013). Without the test results of Qu (2011), a perturbed fractional process would be an alternative conclusion.
In summary, the two standard methods indicate a stationary long-memory process, whereas the methods of Iacone (2010), Hou and Perron (2014) and McCloskey and Perron (2013) suggest a weakly stationary long-memory process, especially for the highest bandwidth. The four other modified estimation methods imply a non-stationary long-memory process.

5. Conclusions

In this paper, we analyze the performance of nine semiparametric estimation methods and compare them in a simulation study. The Monte Carlo study suggests to use either the estimator of Iacone (2010) or Hou and Perron (2014) in cases of low frequency contaminations. Although the estimator of McCloskey and Perron (2013) yields comparable estimation results, it suffers from a higher variance. The performance of the estimator of Smith (2005) in cases of high short-run dynamics or perturbation is comparable to the standard perturbation methods, even though the estimator has originally been developed for low frequency contamination. However, in the latter situation, the estimator is no alternative to its competitors. Furthermore, the estimators of Hurvich et al. (2005) and Frederiksen et al. (2012) yield almost identical findings, which are in most situations better than the results of Andrews and Sun (2004). Based on the Monte Carlo results, we recommend applying the low frequency estimators when its unclear whether a low frequency contamination or a perturbed fractional process is present. In our empirical example, we consider the log-absolute return series of the S&P 500. The downward pattern of Iacone (2010), Hou and Perron (2014) and McCloskey and Perron (2013) as the bandwidth increases combined with a rejection of the null hypothesis of a true long-memory process by the test of Qu (2011) suggests a spurious long-memory process. This paper presents the strengths and weaknesses of the different semiparametric estimation methods and provide some user-guidelines.

Supplementary Materials

The following are available online at https://www.mdpi.com/2225-1146/6/1/13/s1. The tables present the bias and root mean squared error (RMSE) results of nine dierent estimation methods.
Supplementary File 1

Author Contributions

The authors contributed jointly to the paper.

Conflicts of Interest

The authors declare no conflict of interest.

References

  1. Andrews, Donald W.K., and Yixiao Sun. 2004. Adaptive local polynomial Whittle estimation of long-range dependence. Econometrica 72: 569–614. [Google Scholar] [CrossRef]
  2. Arteche, Josu. 2004. Gaussian semiparametric estimation in long memory in stochastic volatility and signal plus noise models. Journal of Econometrics 119: 131–54. [Google Scholar] [CrossRef]
  3. Arteche, Josu. 2006. Semiparametric estimation in perturbed long memory series. Computational Statistics & Data Analysis 51: 2118–141. [Google Scholar]
  4. Byrd, Richard H., Peihuang Lu, Jorge Nocedal, and Ciyou Zhu. 1995. A limited memory algorithm for bound constrained optimization. SIAM Journal on Scientific Computing 16: 1190–208. [Google Scholar] [CrossRef]
  5. Diebold, Francis X., and Atsushi Inoue. 2001. Long memory and regime switching. Journal of Econometrics 105: 131–59. [Google Scholar] [CrossRef]
  6. Doukhan, Paul, George Oppenheim, and Murad Taqqu. 2002. Theory and Applications of Long-Range Dependence. Berlin: Springer Science & Business Media. [Google Scholar]
  7. Faÿ, Gilles, Eric Moulines, François Roueff, and Murad S. Taqqu. 2009. Estimators of long-memory: Fourier versus wavelets. Journal of Econometrics 151: 159–77. [Google Scholar] [CrossRef]
  8. Frederiksen, Per, Frank S. Nielsen, and Morten Ørregaard Nielsen. 2012. Local polynomial Whittle estimation of perturbed fractional processes. Journal of Econometrics 167: 426–47. [Google Scholar] [CrossRef]
  9. Frederiksen, Per, and Morten Ørregaard Nielsen. 2008. Bias-reduced estimation of long-memory stochastic volatility. Journal of Financial Econometrics 6: 496–512. [Google Scholar] [CrossRef]
  10. Geweke, John, and Susan Porter-Hudak. 1983. The estimation and application of long memory time series models. Journal of Time Series Analysis 4: 221–38. [Google Scholar] [CrossRef]
  11. Granger, Clive W. J., and Namwon Hyung. 2004. Occasional structural breaks and long memory with an application to the S&P 500 absolute stock returns. Journal of Empirical Finance 11: 399–421. [Google Scholar]
  12. Granger, Clive W. J., and Roselyne Joyeux. 1980. An introduction to long-memory time series models and fractional differencing. Journal of Time Series Analysis 1: 15–29. [Google Scholar] [CrossRef]
  13. Haldrup, Niels, and Morten Ørregaard Nielsen. 2007. Estimation of fractional integration in the presence of data noise. Computational Statistics & Data Analysis 51: 3100–14. [Google Scholar]
  14. Hosking, Jonathan R. M. 1981. Fractional differencing. Biometrika 68: 165–76. [Google Scholar] [CrossRef]
  15. Hou, Jie, and Pierre Perron. 2014. Modified local Whittle estimator for long memory processes in the presence of low frequency (and other) contaminations. Journal of Econometrics 182: 309–28. [Google Scholar] [CrossRef]
  16. Hurvich, Clifford M., Eric Moulines, and Philippe Soulier. 2005. Estimating long memory in volatility. Econometrica 73: 1283–328. [Google Scholar] [CrossRef]
  17. Hurvich, Clifford M., and Bonnie K. Ray. 2003. The local Whittle estimator of long-memory stochastic volatility. Journal of Financial Econometrics 1: 445–70. [Google Scholar] [CrossRef]
  18. Iacone, Fabrizio. 2010. Local Whittle estimation of the memory parameter in presence of deterministic components. Journal of Time Series Analysis 31: 37–49. [Google Scholar] [CrossRef]
  19. Kuensch, Hans R. 1987. Statistical aspects of self-similar processes. Paper presented at First World Congress of the Bernoulli Society, Tashkent, Uzbekistan, September 8–14; pp. 67–74. [Google Scholar]
  20. Lu, Yang K., and Pierre Perron. 2010. Modeling and forecasting stock return volatility using a random level shift model. Journal of Empirical Finance 17: 138–56. [Google Scholar] [CrossRef]
  21. McCloskey, Adam. 2013. Estimation of the long-memory stochastic volatility model parameters that is robust to level shifts and deterministic trends. Journal of Time Series Analysis 34: 285–301. [Google Scholar] [CrossRef]
  22. McCloskey, Adam, and Jonathan B. Hill. 2017. Parameter estimation robust to low-frequency contamination. Journal of Business & Economic Statistics 35: 598–610. [Google Scholar]
  23. McCloskey, Adam, and Pierre Perron. 2013. Memory parameter estimation in the presence of level shifts and deterministic trends. Econometric Theory 29: 1196–237. [Google Scholar] [CrossRef]
  24. Perron, Pierre, and Zhongjun Qu. 2010. Long-memory and level shifts in the volatility of stock market return indices. Journal of Business & Economic Statistics 28: 275–90. [Google Scholar]
  25. Qu, Zhongjun. 2011. A test against spurious long memory. Journal of Business & Economic Statistics 29: 423–38. [Google Scholar]
  26. Qu, Zhongjun, and Pierre Perron. 2013. A stochastic volatility model with random level shifts and its applications to S&P 500 and NASDAQ return indices. The Econometrics Journal 16: 309–39. [Google Scholar]
  27. Robinson, Peter M. 1995. Log-periodogram regression of time series with long range dependence. The Annals of Statistics 23: 1048–72. [Google Scholar] [CrossRef]
  28. Smith, Aaron. 2005. Level shifts and the illusion of long memory in economic time series. Journal of Business & Economic Statistics 23: 321–35. [Google Scholar]
  29. Sun, Yixiao, and Peter C. B. Phillips. 2003. Nonlinear log-periodogram regression for perturbed fractional processes. Journal of Econometrics 115: 355–89. [Google Scholar] [CrossRef]
  30. Wenger, Kai, Christian Leschinski, and Philipp Sibbertsen. 2017. The Memory of Volatility. Unpublished Manuscript. Hanover, Germany: Department of Economics, University of Hannover. [Google Scholar]
  31. Xu, Jiawen, and Pierre Perron. 2014. Forecasting return volatility: Level shifts with varying jump probability and mean reversion. International Journal of Forecasting 30: 449–63. [Google Scholar] [CrossRef]
  32. Yamamoto, Yohei, and Pierre Perron. 2013. Estimating and testing multiple structural changes in linear models using band spectral regressions. The Econometrics Journal 16: 400–29. [Google Scholar] [CrossRef]
Figure 1. The log-absolute return series of the S&P 500 with the corresponding autocorrelation function and periodogram.
Econometrics 06 00013 g001
Table 1. Overview of data generating processes.
no contamination x t = y t
sinus trend x t = y t + u t u t = 3 sin ( 4 π t / T )
stationary RLS x t = y t + u t u t = ( 1 π ϕ ) u t 1 + δ t
δ t = π t η t     η t i i d N ( 0 , 1 )     π t i i d Bernoulli ( 10 / T , 1 )     ϕ = 1
non-stationary RLS x t = y t + u t u t = ( 1 π ϕ ) u t 1 + δ t
δ t = π t η t     η t i i d N ( 0 , 1 )     π t i i d Bernoulli ( 10 / T , 1 )     ϕ = 0
deterministic level shift x t = y t + u t u t = i = 1 B c i 1 ( T i 1 < t T i )
0 < | c i | <     0 = T 0 < T 1 < < T B 1 < T B = T
GARCH (1,1) x t = y t + u t u t = σ t v t     v t i i d N ( 0 , 1 )     σ t 2 = 0.1 u t 1 2 + 0.8 σ t 1 2
ARMA(0,0) x t = y t + w t w t = ζ t     ζ t i i d N ( 0 , 4 )
ARMA(0,1) x t = y t + w t w t = ( 1 + β w L ) ζ t     β w = 0.6     ζ t i i d N ( 0 , 1 )     ε t i i d N ( 0 , σ ε t 2 )
stationary RLS plus noise x t = y t + u t + w t u t = ( 1 π ϕ ) u t 1 + δ t
δ t = π t η t     η t i i d N ( 0 , 1 )     π t i i d Bernoulli ( 10 / T , 1 )     ϕ = 1
w t = ζ t     ζ t i i d N ( 0 , 4 )
Table 2. DGP2:ARFIMA (1,d,0) plus sinus trend for T = 1024.
ϕ = 0.0 ϕ = 0.3 ϕ = 0.6
d0.00.20.40.00.20.40.00.20.4
δ 0.700.790.700.790.700.790.700.790.700.790.700.790.700.790.700.790.700.79
Bias
d LW 0.6610.5240.4570.3500.2970.2150.6140.5270.4320.3750.3000.2680.6140.5960.4700.4850.3740.420
d GPH 0.1190.0750.0950.0630.0800.0470.1530.1710.1310.1580.1140.1480.2670.3690.2460.3550.2340.349
d HP −0.311−0.147−0.288−0.145−0.275−0.160−0.1580.059−0.1540.048−0.1590.0370.1210.3710.1190.3740.1610.413
d IAC 0.0020.002−0.007−0.008−0.007−0.0170.0700.1850.0570.1730.0630.1670.2930.5190.2880.5130.2930.503
d MCP −0.082−0.015−0.041−0.0070.0200.0060.0600.1590.0450.1310.0960.1480.2520.3710.2500.3620.3350.503
d SMI 0.2870.1790.2340.1460.1870.1130.2570.1550.2150.1250.1710.1010.2270.1900.1850.1630.1510.143
d LPW 0.9280.7190.6650.5010.4480.3290.8300.6500.5930.4570.4130.3140.7350.6250.5390.4690.4010.364
d LWN 0.7900.7890.5820.507 0.7890.6740.5460.372 0.6730.4990.4370.423
d LPWN 11 0.7900.7890.5810.507 0.7890.6740.5450.372 0.6730.4990.4360.423
RMSE
d LW 0.6610.5240.4570.3500.2990.2160.6150.5270.4320.3750.3020.2700.6150.5960.4700.4860.3760.421
d GPH 0.1340.0860.1130.0760.0980.0650.1630.1760.1430.1640.1280.1550.2730.3710.2530.3570.2410.352
d HP 0.3320.1610.3110.1580.3020.1730.1910.0800.1850.0750.1950.0720.1500.3750.1510.3780.2240.415
d IAC 0.1040.0790.1080.0760.1090.0790.1280.1990.1160.1900.1180.1840.3120.5250.3080.5180.3100.507
d MCP 2.9810.1050.1780.0790.1270.0660.2300.1710.1340.1420.1480.1550.2690.3730.2880.3680.3970.535
d SMI 0.3100.1950.2570.1640.2190.1390.2800.1720.2400.1470.2030.1300.2520.2030.2150.1800.1880.164
d LPW 0.9290.7200.6660.5010.4500.3300.8310.6500.5940.4580.4160.3160.7360.6250.5410.4700.4040.366
d LWN 0.7900.7890.5820.511 0.7890.6790.5490.376 0.6780.4990.4410.424
d LPWN 11 0.7900.7890.5820.510 0.7890.6790.5480.376 0.6780.4990.4410.424
Table 3. DGP3: ARFIMA (1,d,0) plus stationary RLS for T = 1024.
ϕ = 0.0 ϕ = 0.3 ϕ = 0.6
d0.00.20.40.00.20.40.00.20.4
δ 0.700.790.700.790.700.790.700.790.700.790.700.790.700.790.700.790.700.79
Bias
d LW 0.3400.2570.1590.0900.019−0.0470.3190.2700.1590.1210.033−0.0120.3390.3350.2070.1970.0900.044
d GPH 0.3220.2250.1520.0770.020−0.0490.3040.2510.1570.1200.037−0.0080.3370.3360.2100.2060.0960.054
d HP 0.0390.017−0.049−0.075−0.128−0.1850.0890.1160.0150.026−0.083−0.1080.2350.2820.1490.1610.034−0.028
d IAC 0.1000.035−0.013−0.070−0.102−0.1850.1210.1290.0330.037−0.059−0.1000.2520.3280.1720.1910.062−0.018
d MCP 0.0580.026−0.037−0.059−0.089−0.1380.1060.1310.0260.050−0.038−0.0530.2610.3060.1740.1900.0820.037
d SMI 0.5700.4290.3370.2280.1600.0860.5050.3730.2920.2040.1420.0830.4180.3470.2440.2250.1360.135
d LPW 0.4790.3710.2660.1810.1040.0380.4280.3380.2340.1710.0950.0490.3740.3430.2170.2150.1140.108
d LWN 0.4910.4590.2280.204 0.4030.3100.1900.148 0.2870.2560.1610.165
d LPWN 11 0.4550.4340.1980.182 0.3790.3000.1700.131 0.2810.2470.1510.141
RMSE
d LW 0.3500.2660.1750.1080.0680.0680.3300.2770.1740.1330.0710.0480.3470.3390.2170.2020.1060.061
d GPH 0.3350.2360.1740.0980.0790.0740.3170.2590.1760.1340.0800.0530.3480.3420.2230.2130.1170.074
d HP 0.1470.0720.1350.1030.1750.1990.1520.1330.1070.0650.1360.1300.2540.2870.1710.1690.0980.079
d IAC 0.1580.0840.1150.1040.1500.2010.1660.1480.1130.0850.1240.1250.2740.3360.2020.2060.1210.082
d MCP 0.2240.1260.2210.1210.2020.1700.2300.1580.1730.0970.1600.0960.2910.3130.2120.2000.1390.077
d SMI 0.5890.4450.3660.2510.2060.1300.5260.3890.3250.2290.1940.1300.4440.3640.2780.2450.1860.164
d LPW 0.4930.3820.2860.1980.1410.0820.4420.3480.2550.1880.1340.0860.3900.3520.2370.2260.1440.125
d LWN 0.5200.4840.2690.238 0.4370.3390.2330.185 0.3100.2690.1890.189
d LPWN 11 0.4890.4630.2440.222 0.4150.3300.2140.171 0.3040.2590.1760.166
Table 4. DGP8: ARFIMA (1,d,0) plus ARMA(0,0) for T = 1024.
ϕ = 0.0 ϕ = 0.3 ϕ = 0.6
d0.20.40.60.20.40.60.20.40.6
δ 0.700.790.700.790.700.790.700.790.700.790.700.790.700.790.700.790.700.79
Bias
d LW −0.134−0.144−0.227−0.258−0.333−0.393−0.105−0.105−0.196−0.228−0.322−0.380−0.034−0.040−0.150−0.191−0.300−0.368
d GPH −0.132−0.141−0.225−0.257−0.339−0.406−0.100−0.102−0.191−0.225−0.329−0.394−0.032−0.036−0.145−0.188−0.304−0.381
d HP −0.151−0.155−0.273−0.298−0.459−0.504−0.123−0.115−0.243−0.267−0.455−0.498−0.046−0.046−0.191−0.232−0.433−0.492
d IAC −0.148−0.154−0.284−0.323−0.469−0.529−0.112−0.108−0.255−0.288−0.458−0.519−0.012−0.032−0.193−0.262−0.435−0.521
d MCP −0.176−0.179−0.330−0.336−0.506−0.539−0.132−0.117−0.296−0.297−0.508−0.529−0.050−0.046−0.233−0.259−0.467−0.532
d SMI −0.112−0.126−0.153−0.190−0.189−0.271−0.091−0.103−0.125−0.157−0.172−0.256−0.055−0.040−0.083−0.110−0.147−0.234
d LPW −0.125−0.136−0.184−0.216−0.246−0.314−0.107−0.107−0.157−0.185−0.233−0.297−0.053−0.037−0.116−0.136−0.207−0.279
d LWN 0.0130.003−0.011−0.003−0.0130.0000.029−0.004−0.004−0.014−0.0020.0080.0350.012−0.0090.0080.0000.015
d LPWN 11 −0.010−0.024−0.055−0.049−0.061−0.0420.007−0.023−0.040−0.052−0.046−0.0340.025−0.001−0.032−0.036−0.044−0.031
RMSE
d LW 0.1420.1480.2310.2600.3350.3940.1150.1100.2000.2300.3240.3810.0560.0500.1550.1930.3010.369
d GPH 0.1450.1480.2330.2600.3430.4080.1170.1100.1990.2280.3330.3960.0670.0560.1540.1920.3090.383
d HP 0.1610.1600.2810.3020.4690.5080.1340.1200.2530.2710.4660.5020.0700.0570.2020.2370.4480.498
d IAC 0.1830.1720.3030.3330.4810.5350.1560.1300.2780.2990.4710.5250.1050.0840.2190.2730.4500.528
d MCP 0.2480.2110.3750.3490.5940.5500.3780.1420.3590.3120.5650.5400.2230.0960.2820.2790.6090.545
d SMI 0.1620.1490.1910.2040.2150.2790.1500.1290.1680.1760.2000.2640.1350.0880.1360.1340.1760.245
d LPW 0.1460.1460.1980.2220.2530.3160.1320.1180.1730.1910.2400.2990.0930.0620.1330.1430.2140.281
d LWN 0.1930.1880.1860.1750.1600.1430.1860.1480.1720.1520.1620.1410.1300.0880.1400.1280.1490.138
d LPWN 11 0.1750.1730.1860.1800.1790.1630.1700.1370.1660.1690.1740.1580.1180.0720.1560.1300.1590.153
Table 5. DGP9: ARFIMA (1,d,0) plus stationary RLS plus additive noise for T = 1024.
ϕ = 0.0 ϕ = 0.3 ϕ = 0.6
d0.00.40.60.00.40.60.00.40.6
δ 0.700.790.700.790.700.790.700.790.700.790.700.790.700.790.700.790.700.79
Bias
d LW 0.2210.157−0.131−0.188−0.283−0.3560.2120.167−0.120−0.169−0.275−0.3470.2250.196−0.086−0.150−0.262−0.339
d GPH 0.2050.134−0.137−0.199−0.293−0.3740.1990.149−0.123−0.178−0.281−0.3660.2200.190−0.087−0.157−0.269−0.358
d HP 0.0310.016−0.274−0.307−0.476−0.5230.0490.048−0.248−0.280−0.465−0.5150.1180.119−0.195−0.257−0.448−0.517
d IAC 0.0410.014−0.272−0.320−0.462−0.5320.0480.048−0.249−0.290−0.447−0.5230.1250.133−0.193−0.273−0.431−0.521
d MCP 0.005−0.007−0.317−0.333−0.502−0.543−0.0450.043−0.290−0.295−0.443−0.5320.1180.120−0.217−0.275−0.464−0.533
d SMI 0.3990.2760.022−0.069−0.101−0.2050.3680.2590.024−0.054−0.089−0.1980.3250.2620.037−0.028−0.086−0.180
d LPW 0.3290.237−0.040−0.112−0.174−0.2570.3030.230−0.035−0.093−0.165−0.2500.2800.240−0.013−0.068−0.155−0.234
d LWN 0.2050.2010.0770.087 0.1790.1740.0750.085 0.1490.1610.0630.094
d LPWN 11 0.1540.1640.0310.046 0.1350.1370.0300.049 0.1140.1190.0190.049
RMSE
d LW 0.2330.1680.1460.1940.3320.3850.2230.1750.1340.1750.2800.3490.2360.2030.1030.1550.2670.342
d GPH 0.2200.1460.1540.2060.3000.3770.2130.1590.1400.1850.2890.3700.2340.1970.1100.1640.2760.361
d HP 0.1080.0580.2920.3130.4900.5280.1120.0730.2670.2860.4800.5200.1480.1290.2190.2660.4650.522
d IAC 0.1150.0760.2930.3290.4740.5370.1160.0900.2700.3010.4600.5280.1660.1530.2210.2840.4450.526
d MCP 0.4650.1120.4020.3510.5730.5562.1950.0990.3390.3121.5510.5430.3360.1470.2750.2950.4970.546
d SMI 0.4240.2950.1320.1170.1570.2240.3920.2770.1300.1060.1460.2150.3540.2810.1340.0940.1500.198
d LPW 0.3450.2510.1030.1310.1930.2650.3200.2420.0980.1140.1830.2570.2990.2520.0870.0910.1740.242
d LWN 0.2710.2600.1800.168 0.2520.2360.1730.170 0.2230.2180.1750.171
d LPWN 11 0.2440.2420.1780.168 0.2270.2200.1700.167 0.2000.1970.1710.168
Table 6. d ^ estimates and the corresponding standard errors in brackets below for different bandwidths m = 1 + T δ with * denoting significance at 1% level.
δ / d ^ LWGPHHPIACMCPSMILPWLWNLPWN11Qu Test
0.600.4530.4930.3530.3390.5060.5700.5210.6080.6030.910
(0.038)(0.049)(0.038)(0.086)(0.055)(0.100)(0.057)(0.039)(0.138)
0.700.3830.4080.2700.3130.3490.5340.4890.5850.4731.836 *
(0.025)(0.032)(0.025)(0.056)(0.041)(0.061)(0.037)(0.026)(0.103)
0.790.2840.2750.1330.1250.1560.4830.3900.6290.5893.727 *
(0.017)(0.022)(0.017)(0.038)(0.033)(0.040)(0.025)(0.017)(0.062)

