
Bayesian Analysis of Bubbles in Asset Prices

Abstract
1. Introduction
2. Econometric Model and Estimation Method
2.1. The Present Value Model and PSY’s Method
2.2. Model and Inferential Task
2.3. Discrete Particle Filter
2.4. Parameter Learning Algorithm
- Propose from a proposal density: .
- Acceptance probability:
- With probability , set , otherwise keep original value.
2.5. Loss Functions for Bubble-Stamping
3. Monte Carlo Study
3.1. Priors and Parameter Restrictions
- This is the parameter determining the expected length of a normal regime. To reflect our a priori beliefs that the normal regime should be reasonably long lasting, we enforce the restriction . The prior distribution we use is then a truncated normal with mean and standard deviation parameters of 180 and 60 respectively.
- Determines the shape of the bubble regime distribution. Here we assume that has an increasing probability of exit from the bubble state in duration reflected in a parameter restriction . The prior distribution we use is then a normal distribution truncated from below with mean and standard deviation parameters of 1.
- : Determines the expected length of a bubble spell. Here again we restrict the parameter to focus on reasonably long-lasting bubble spells, by enforcing . Then ,the prior we use is a normal distribution truncated from below with mean and standard deviation parameters of the normal of 36 and 12 respectively.
- For both we use a uniform prior on .
- We use a normal prior truncated below at 0, with .
- Given that this is the ratio of the volatilities between the high and low-volatility states, we use the parameter restriction . Then, the prior distribution we use is a normal prior truncated below with .
- We use a normal prior truncated below at 0, with .
- Measures the mean reversion during the normal regime. The recent literature in finance points towards time-varying discount rates as the main source behind the cyclical variation in the price-dividend ratio (see for instance Cochrane (2011) for a recent overview), usually thought of as a medium-to-low frequency phenomenon. Hence we bound from below the half-life of the mean reversion at 2 years, corresponding to with monthly data. In addition to this we only assume non-explosiveness of the process in the normal regime leading to the uniform prior reflecting the parameter restriction .
- Here we use the parameter restrictions . The upper boundary is chosen to make sure that we cover all empirically relevant parameters of . Then the prior distribution we use is .
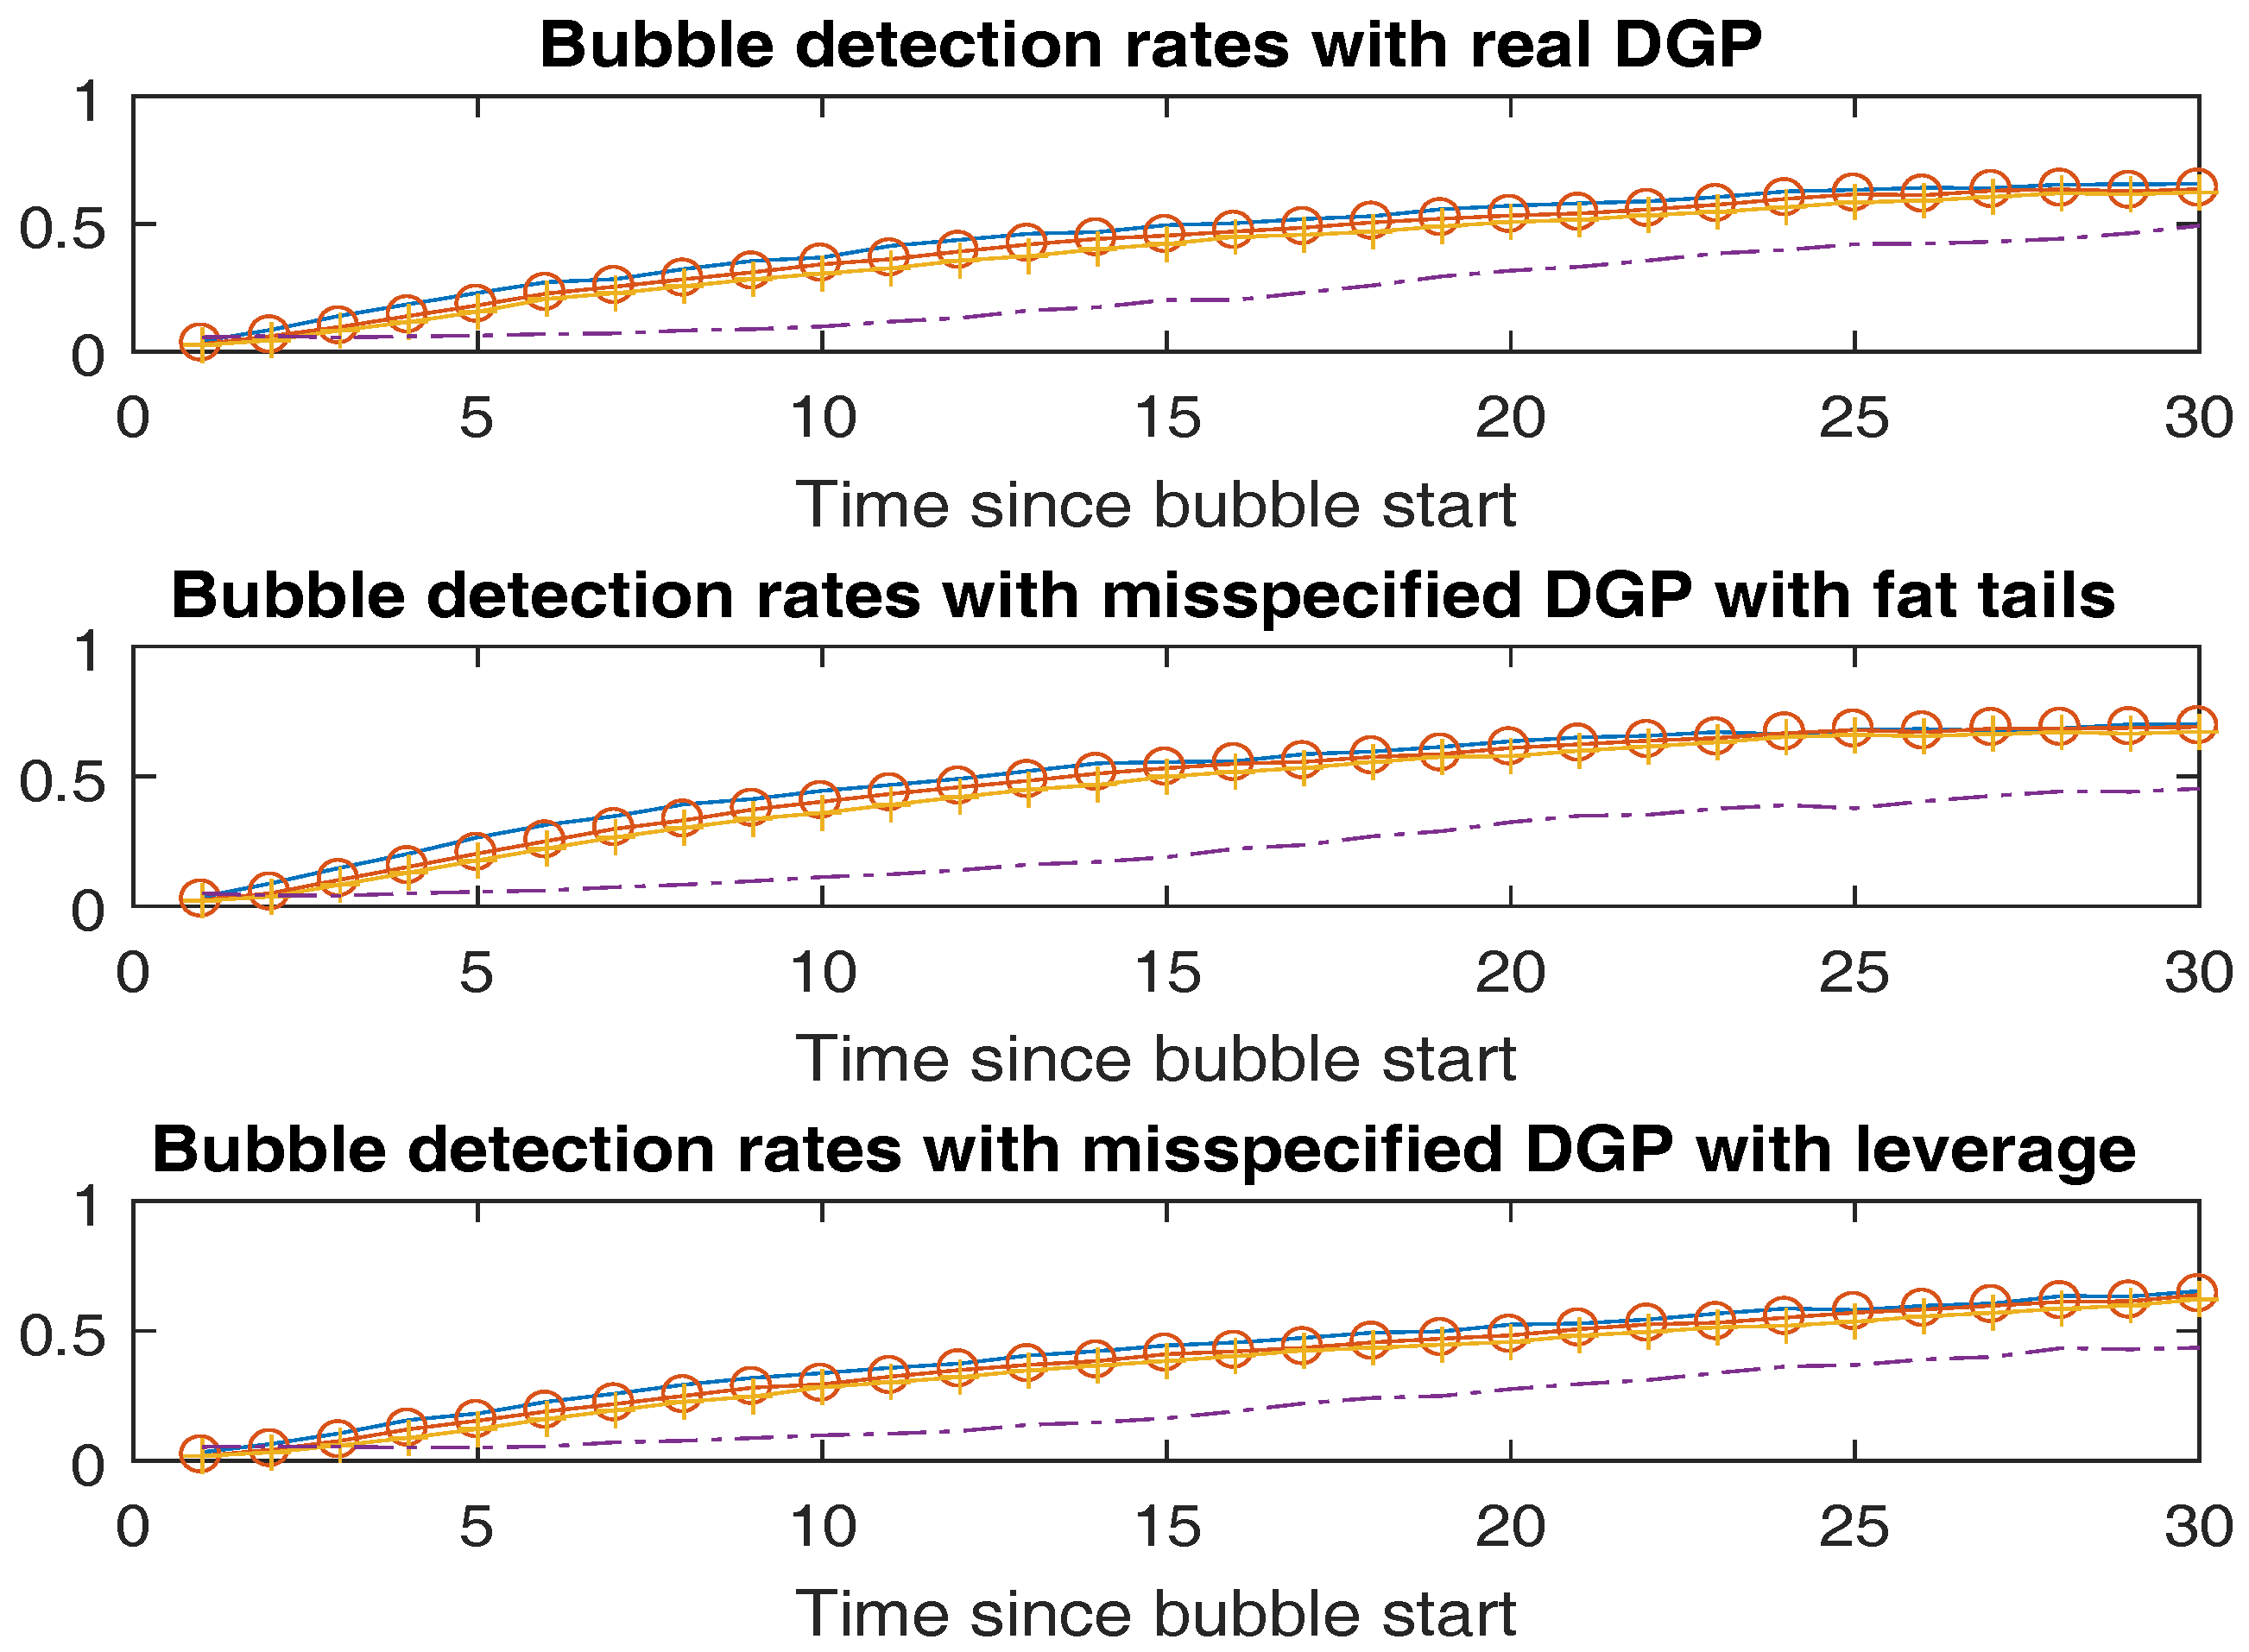
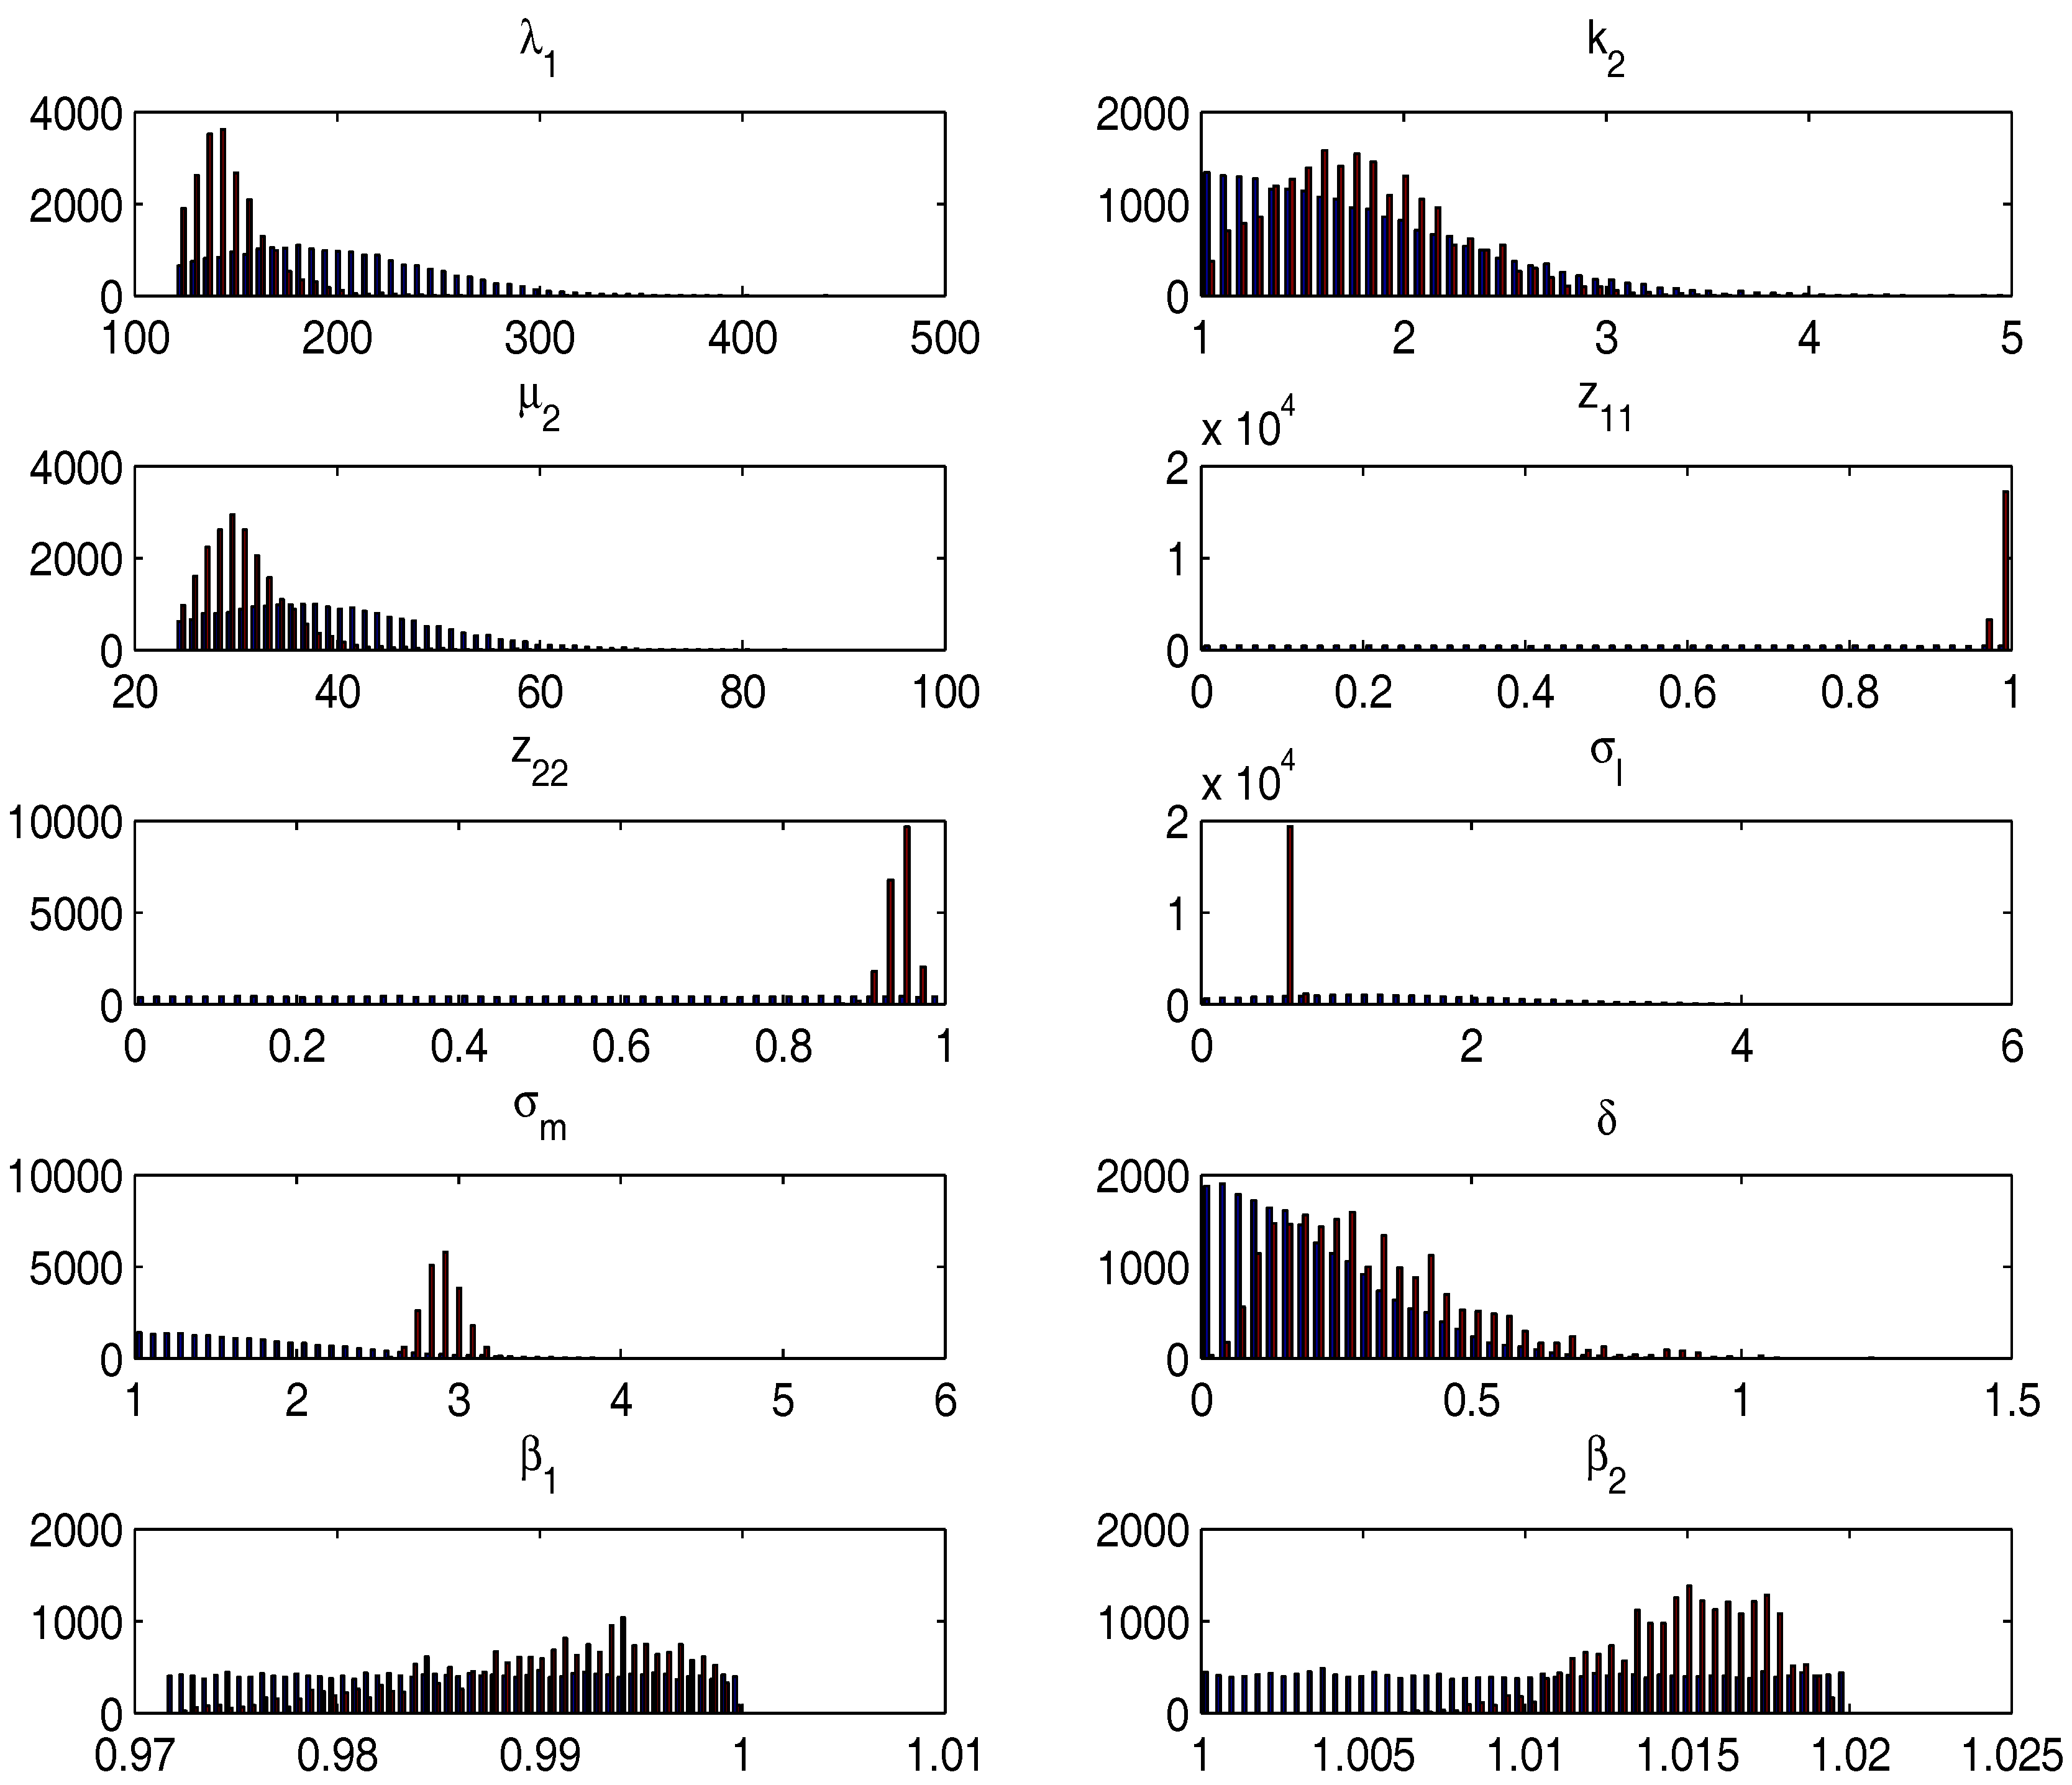
3.2. Monte Carlo Results
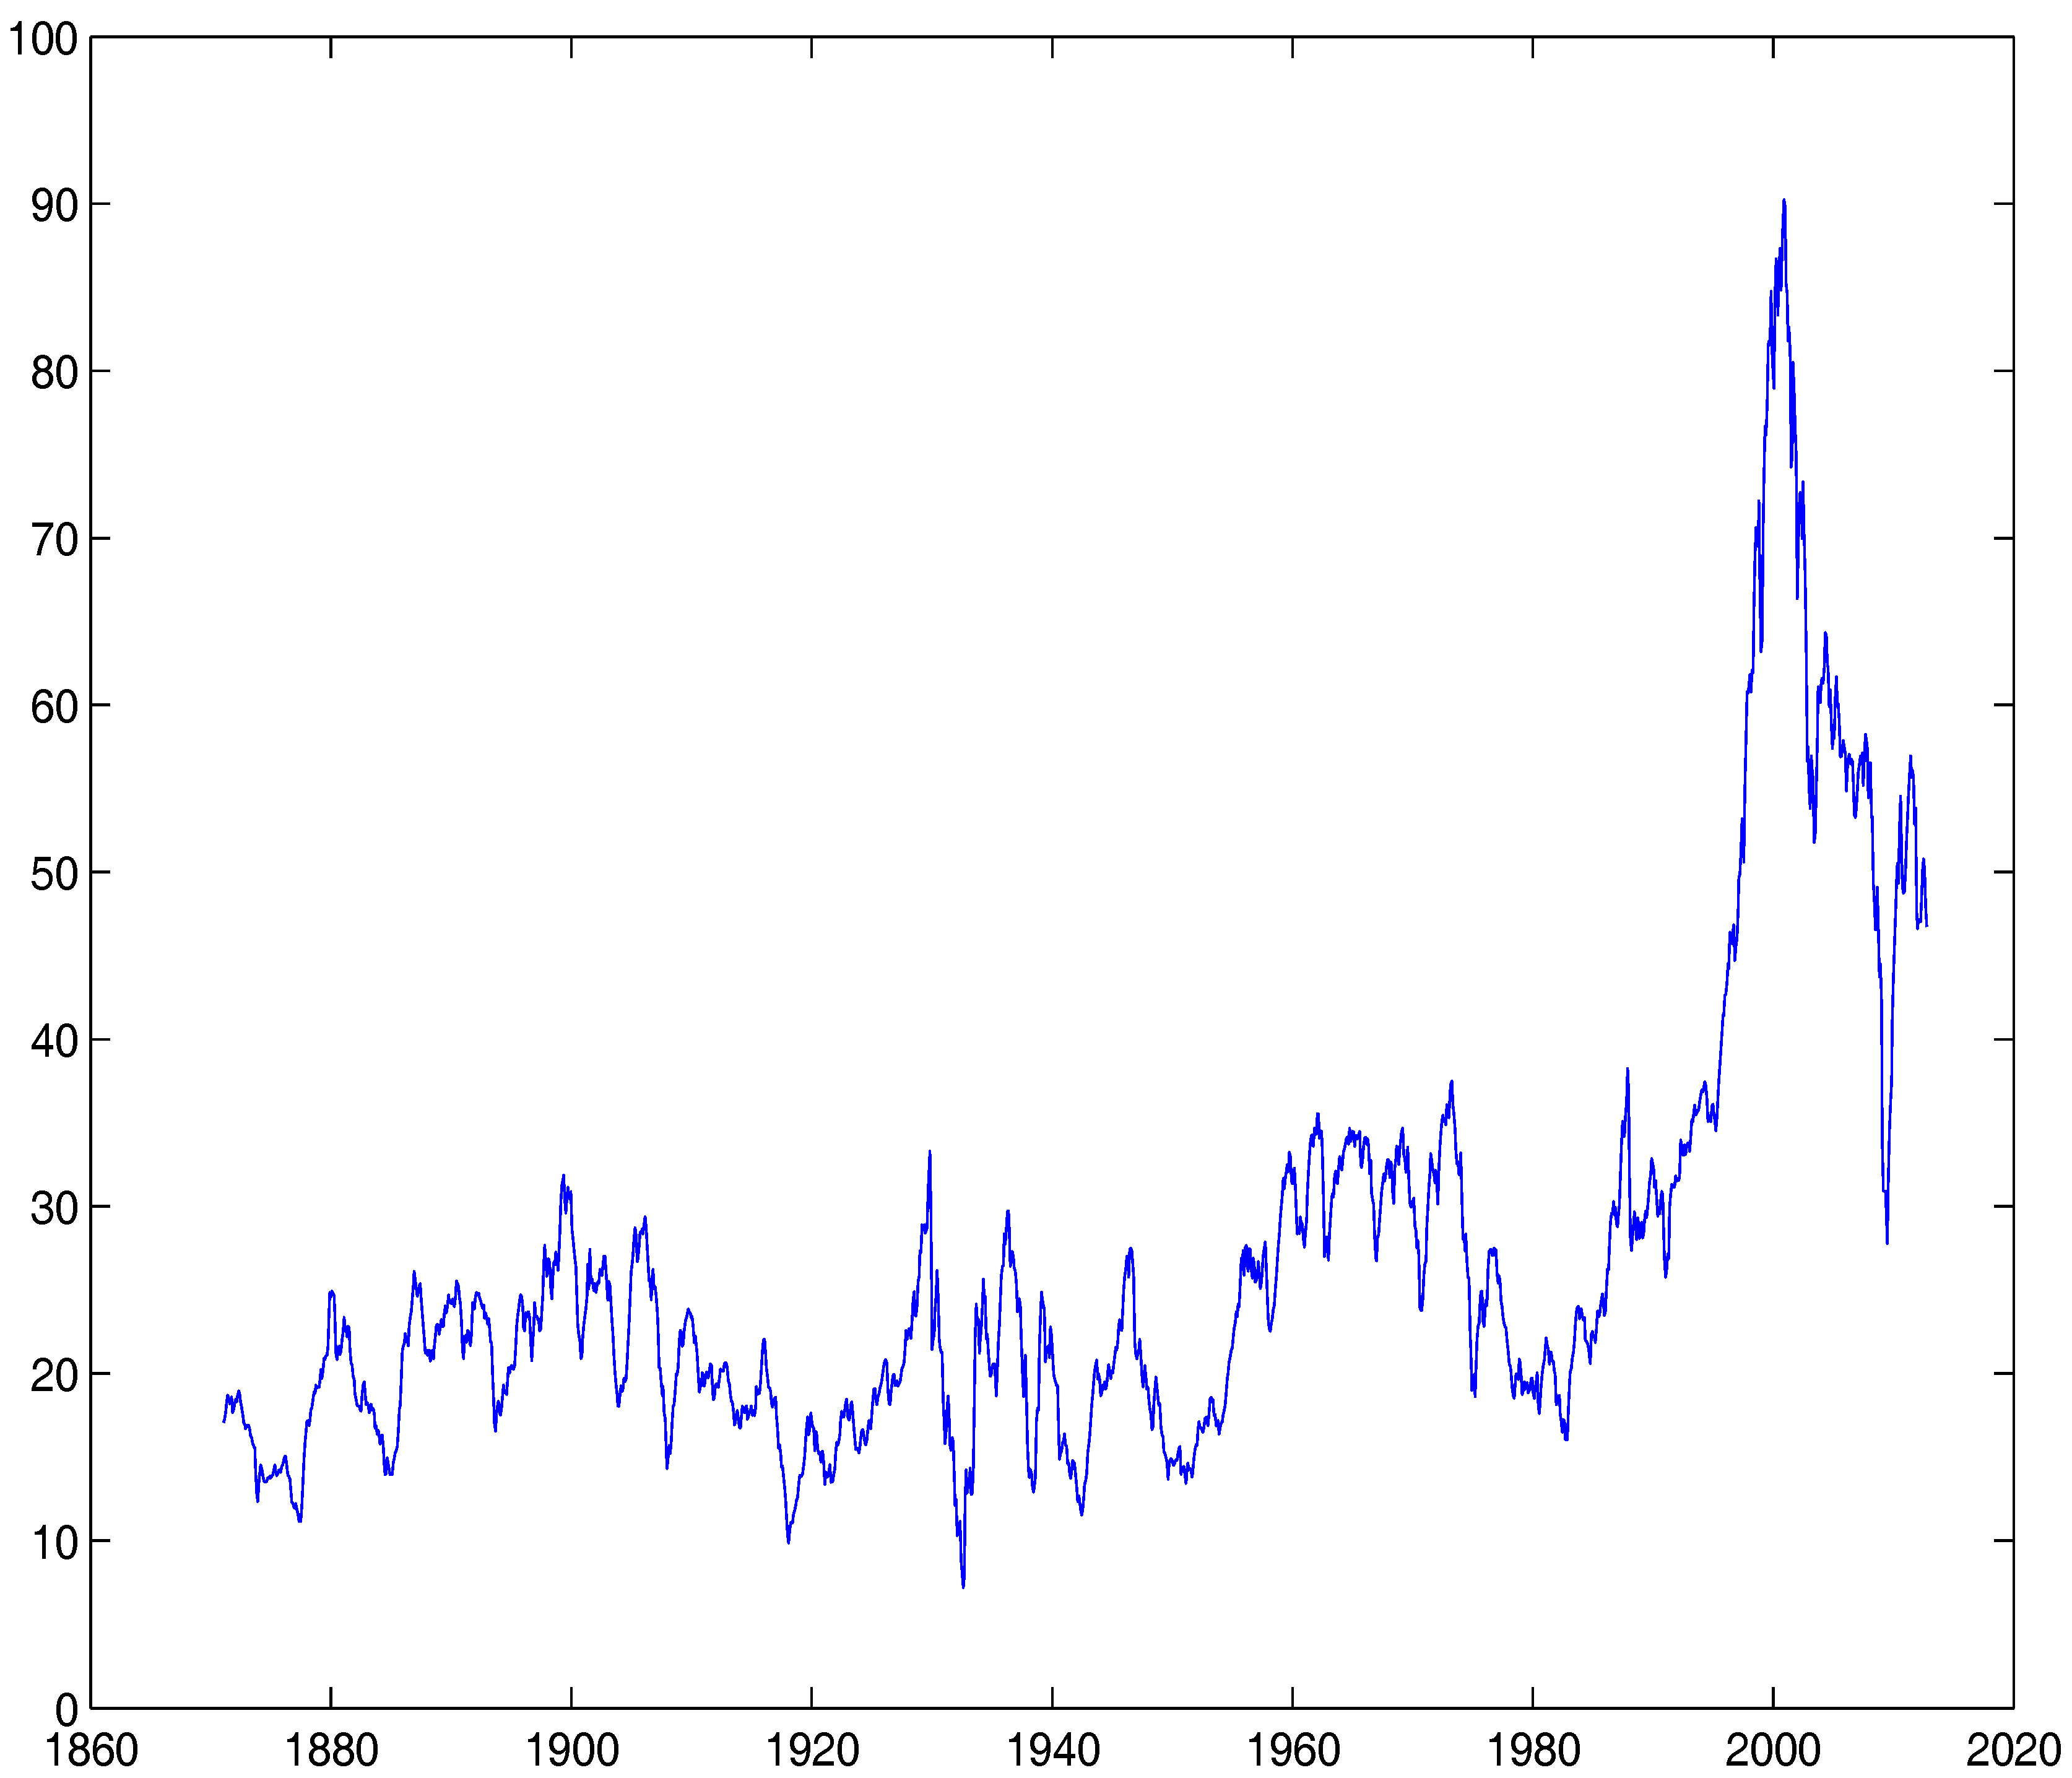
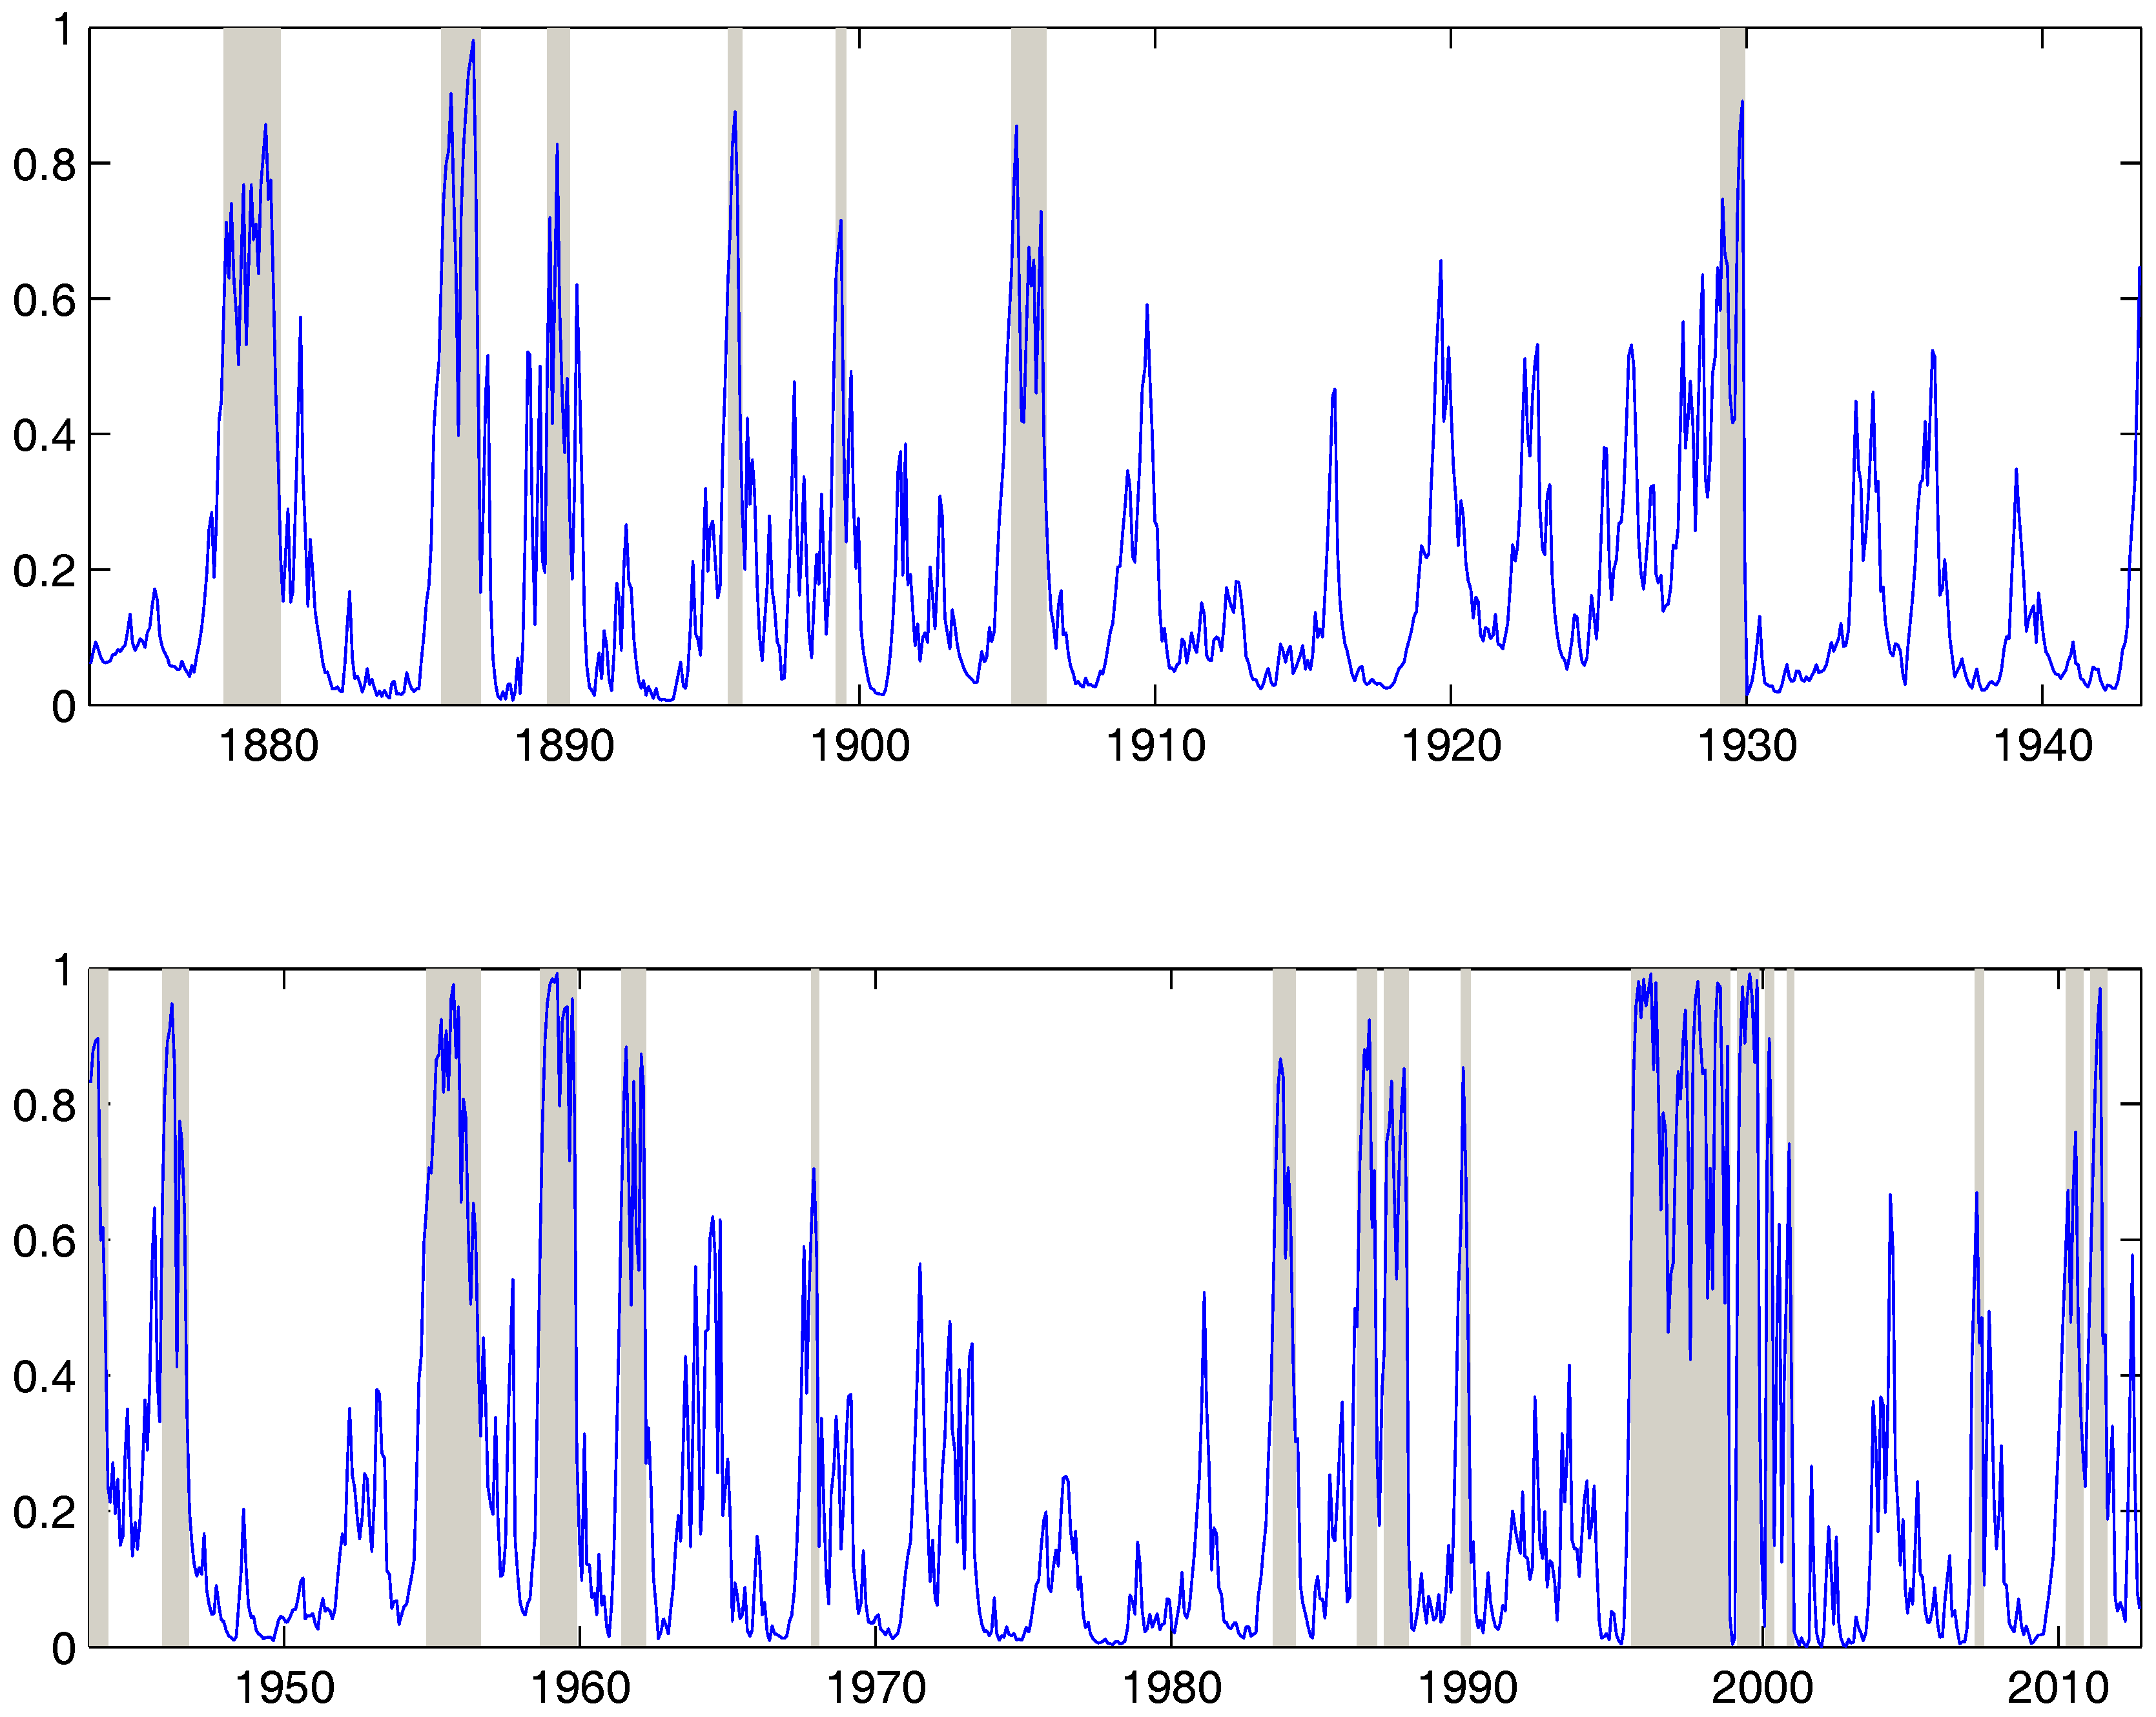
4. Empirical Study
5. Conclusions
Acknowledgments
Author Contributions
Conflicts of Interest
References
- Ahamed, Liaquat. 2009. Lords of Finance: The Bankers Who Broke the World. New York: Penguin Press. [Google Scholar]
- Andrieu, Christophe, Arnaud Doucet, and Roman Holenstein. 2010. Particle Markov Chain Monte Carlo. Journal of Royal Statistical Society B 72: 1–33. [Google Scholar] [CrossRef]
- Busetti, Fabio, and A. M. Robert Taylor. 2004. Tests of stationarity against a change in persistence. Journal of Econometrics 123: 33–66. [Google Scholar] [CrossRef]
- Caballero, Ricardo J., Emmanuel Farhi, and Pierre-Olivier Gourinchas. 2008. Financial Crash, Commodity Prices and Global Imbalances. Brookings Papers on Economic Activity 2: 1–55. [Google Scholar]
- Campbell, John Y., and Robert J. Shiller. 1988. The dividend-price ratio and expectations of future dividends and discount factors. Review of Financial Studies 1: 195–227. [Google Scholar] [CrossRef]
- Chopin, Nicolas, Pierre E. Jacob, and Omiros Papaspiliopoulos. 2013. SMC2: An efficient algorithm for sequential analysis of state space models. Journal of the Royal Statistical Society B 75: 397–426. [Google Scholar] [CrossRef]
- Cochrane, John H. 2011. Presidential Address: Discount Rates. Journal of Finance 66: 1047–108. [Google Scholar] [CrossRef]
- Diba, Behzad T., and Herschel I. Grossman. 1988. Explosive rational bubbles in stock prices? The American Economic Review 78: 520–30. [Google Scholar]
- Evans, George W. Evans. 1991. Pitfalls in testing for explosive bubbles in asset prices. The American Economic Review 81: 922–30. [Google Scholar]
- Fearnhead, Paul. 1998. Sequential Monte Carlo methods in Filter Theory. Ph.D. thesis, University of Oxford, Oxford, UK. [Google Scholar]
- Fei, Y. 2017. Limit Theory for Mildly Integrated Process with Intercept. Working Paper, Singapore Management University, Singapore. [Google Scholar]
- Fulop, Andras, and Junye Li. 2013. Efficient learning via simulation: A marginalized resample-move approach. Journal of Econometrics 176: 146–61. [Google Scholar] [CrossRef]
- Godfeld, Stephen, and Richard Quandt. 1973. The Estimation of Structural Shifts by Switching Regressions. Annals of Economic and Social Measurement 2: 473–83. [Google Scholar]
- Funke, Michael, Stephen Hall, and Martin Sola. 1994. Rational bubbles during Poland’s hyperinflation: Implications and empirical evidence. European Economic Review 38: 1257–76. [Google Scholar] [CrossRef]
- Hall, Stephen G., Zacharias Psaradakis, and Martin Sola. 1999. Detecting Periodically Collapsing Bubbles: A Markov-Switching Unit Root Test. Journal of Applied Econometrics 14: 143–54. [Google Scholar] [CrossRef]
- Hamilton, James D. 1989. A new approach to the economic analysis of nonstationary time series and the business cycle. Econometrica 57: 357–84. [Google Scholar] [CrossRef]
- Homm, Ulrich, and Jörg Breitung. 2012. Testing for Speculative Bubbles in Stock Markets: A Comparison of Alternative Methods. Journal of Financial Econometrics 10: 198–231. [Google Scholar] [CrossRef]
- Jiang, Liang, Xiao hu Wang, and Jun Yu. 2017. In-Fill Asymptotic Theory for Structural Break Point in Autoregression: A Unified Theory. Working paper, Singapore Management University, Singapore. [Google Scholar]
- Kim, Jae-Young. 2000. Detection of change in persistence of a linear time series. Journal of Econometrics 95: 97–116. [Google Scholar] [CrossRef]
- Kohn, Donald L. 2008. Monetary Policy and Asset Prices Revisited. Paper presented at the Cato Institute’s 26th Annual Monetary Policy Conference, Washington, DC, USA, November 19. [Google Scholar]
- Lee, Ji Hyung, and Peter C. B. Phillips. 2016. Asset pricing withfinancial bubble risk. Journal of Empirical Finance 38: 590–622. [Google Scholar] [CrossRef]
- Phillips, Peter C. B., and Jun Yu. 2011. Dating the Timeline of Financial Bubbles During the Subprime Crisis. Quantitative Economics 2: 455–91. [Google Scholar] [CrossRef]
- Phillips, Peter C. B., Shu ping Shi, and Jun Yu. 2014. Specification Sensitivity in Right-Tailed Unit Root Testing for Explosive Behavior. Oxford Bulletin of Economics and Statistics 76: 315–33. [Google Scholar] [CrossRef]
- Phillips, Peter C. B., Shu ping Shi, and Jun Yu. 2015a. Testing for Multiple Bubbles: Historical Episodes of Exuberance and Collapse in the S&P500. International Economic Review 56: 1043–78. [Google Scholar]
- Phillips, Peter C. B., Shu ping Shi, and Jun Yu. 2015b. Testing for Multiple Bubbles: Limit Theory of Real Time Detector. International Economic Review 56: 1079–134. [Google Scholar] [CrossRef]
- Phillips, Peter C. B., Yang Ru Wu, and Jun Yu. 2011. Explosive behavior in the 1990s Nasdaq: When did exuberance escalate asset values? International Economic Review 52: 201–26. [Google Scholar] [CrossRef]
- Shi, Shu Ping. 2013. Specification Sensitivities in the Markov-Switching Unit Root Test for Bubbles. Empirical Economics 45: 697–713. [Google Scholar] [CrossRef]
- Shi, Shu Ping, and Yong Song. 2015. Identifying Speculative Bubbles with an Infinite Hidden Markov Model. Journal of Financial Econometrics 14: 159–84. [Google Scholar] [CrossRef]
- Wang, Xiao hu, and Jun Yu. 2015. Limit Theory for an Explosive Autoregressive Process. Economic Letters 126: 176–80. [Google Scholar] [CrossRef]
- Yiu, Matthew S., Jun Yu, and Lu Jin. 2013. Detecting Bubbles in Hong Kong Residential Property Market. Journal of Asian Economics 28: 115–24. [Google Scholar] [CrossRef]
| 1. | |
| 2. | A very recent contribution in deriving the asymptotic distribution for the change point estimator was made in Jiang et al. (2017). |
| 3. | In more recent attempts, Phillips et al. (2014), Wang and Yu (2015), Fei (2017) showed the impact of the intercept term on the asymptotics in various model setups. |
| 4. |


| Parameters | True | Post. Mean | Post. Credible Interval | Prior Credible Interval |
|---|---|---|---|---|
| 150 | 189.4 | 126.9 | 153.7 | |
| 1.8 | 1.91 | 1.68 | 1.87 | |
| 30 | 35.95 | 21.15 | 31.01 | |
| 0.98 | 0.97 | 0.01 | 0.89 | |
| 0.94 | 0.93 | 0.049 | 0.90 | |
| 0.65 | 0.65 | 0.04 | 2.7 | |
| 2.8 | 2.77 | 0.37 | 1.88 | |
| 0.3 | 0.214 | 0.428 | 0.477 | |
| 0.99 | 0.989 | 0.006 | 0.025 | |
| 1.015 | 1.014 | 0.005 | 0.0180 |
| Methods | Number of Bubble Spells | Total Bubble Length/T | Avg Bubble Duration in Months |
|---|---|---|---|
| Realized numbers | |||
| 9.07 | 0.164 | 30.24 | |
| Panel A: Correctly Specified DGP | |||
| PSY | 13.2 | 0.095 | 11.0 |
| RS, | 17.4 | 0.095 | 8.9 |
| RS, | 8.6 | 0.091 | 17.3 |
| RS, | 6.9 | 0.087 | 20.6 |
| Panel B: Misspecified DGP with Fat Tails | |||
| PSY | 13.8 | 0.096 | 11.0 |
| RS, | 19.9 | 0.106 | 8.7 |
| RS, | 10.0 | 0.102 | 17.0 |
| RS, | 8.0 | 0.099 | 21.0 |
| Panel C: Misspecified DGP with Leverage | |||
| PSY | 13 | 0.090 | 11.3 |
| RS, | 16.1 | 0.090 | 9.42 |
| RS, | 7.91 | 0.086 | 18.37 |
| RS, | 6.49 | 0.082 | 21.77 |
| Parameters | Posterior Mean | Posterior 5th Prctile | Posterior 95 Prctile |
|---|---|---|---|
| 147 | 123.5 | 183.1 | |
| 1.795 | 1.152 | 2.589 | |
| 30.74 | 25.25 | 38.31 | |
| 0.9842 | 0.9754 | 0.9907 | |
| 0.9412 | 0.9128 | 0.963 | |
| 0.6694 | 0.6367 | 0.7017 | |
| 2.895 | 2.708 | 3.1 | |
| 0.3117 | 0.09392 | 0.6485 | |
| 0.99 | 0.9784 | 0.9982 | |
| 1.015 | 1.01 | 1.018 |
| Methods | Number of Bubble Spells | Total Bubble Length/T | Avg Bubble Duration in Months |
|---|---|---|---|
| PSY | 22 | 0.056 | 4.27 |
| RS, | 58 | 0.16 | 4.5 |
| RS, | 24 | 0.14 | 9.7 |
| RS, | 20 | 0.125 | 10.4 |
© 2017 by the authors. Licensee MDPI, Basel, Switzerland. This article is an open access article distributed under the terms and conditions of the Creative Commons Attribution (CC BY) license (http://creativecommons.org/licenses/by/4.0/).
Share and Cite
Fulop, A.; Yu, J. Bayesian Analysis of Bubbles in Asset Prices. Econometrics 2017, 5, 47. https://doi.org/10.3390/econometrics5040047
Fulop A, Yu J. Bayesian Analysis of Bubbles in Asset Prices. Econometrics. 2017; 5(4):47. https://doi.org/10.3390/econometrics5040047
Chicago/Turabian StyleFulop, Andras, and Jun Yu. 2017. "Bayesian Analysis of Bubbles in Asset Prices" Econometrics 5, no. 4: 47. https://doi.org/10.3390/econometrics5040047
APA StyleFulop, A., & Yu, J. (2017). Bayesian Analysis of Bubbles in Asset Prices. Econometrics, 5(4), 47. https://doi.org/10.3390/econometrics5040047