Figure 1.
Percentage shares in the market over time for Company 1 in blue, Company 2 in red, and Company 3 in green color.
Figure 1.
Percentage shares in the market over time for Company 1 in blue, Company 2 in red, and Company 3 in green color.
Figure 2.
Real data in blue vs approximated by response function in red. (a) Company 1, real data in blue vs approximated by response function shares in red; (b) Company 2, real data in blue vs approximated by response function shares in red; (c) Company 3, real data in blue vs approximated by response function shares in red.
Figure 3.
Histograms of the residuals. (a) Histograms of the residuals for Company 1 with mean and standard deviation: , . (b) Histograms of the residuals for Company 2 with mean and standard deviation: , . (c) Histograms of the residuals for Company 3 with mean and standard deviation: , .
Figure 3.
Histograms of the residuals. (a) Histograms of the residuals for Company 1 with mean and standard deviation: , . (b) Histograms of the residuals for Company 2 with mean and standard deviation: , . (c) Histograms of the residuals for Company 3 with mean and standard deviation: , .
Figure 4.
Real data vs iterated one. (a) Simulation of the sequence of successive percentage shares for Company 1, blue color for the real data, red color for , and green color for . (b) Simulation of the sequence of successive percentage shares for Company 2, blue color for the real data, red color for , and green color for . (c) Simulation of the sequence of successive percentage shares for Company 3, blue color for the real data, red color for , and green color for .
Figure 5.
Blue, red, and green colors for Companies 1, 2, and 3, respectively, for the sequences of successive iterations , .
Figure 5.
Blue, red, and green colors for Companies 1, 2, and 3, respectively, for the sequences of successive iterations , .
Figure 6.
(a) Company 1’s real data in blue vs the moving average data in red. (b) Company 2’s real data in blue vs the moving average data in red. (c) Company 3’s real data in blue vs the moving average data in red.
Figure 6.
(a) Company 1’s real data in blue vs the moving average data in red. (b) Company 2’s real data in blue vs the moving average data in red. (c) Company 3’s real data in blue vs the moving average data in red.
Figure 7.
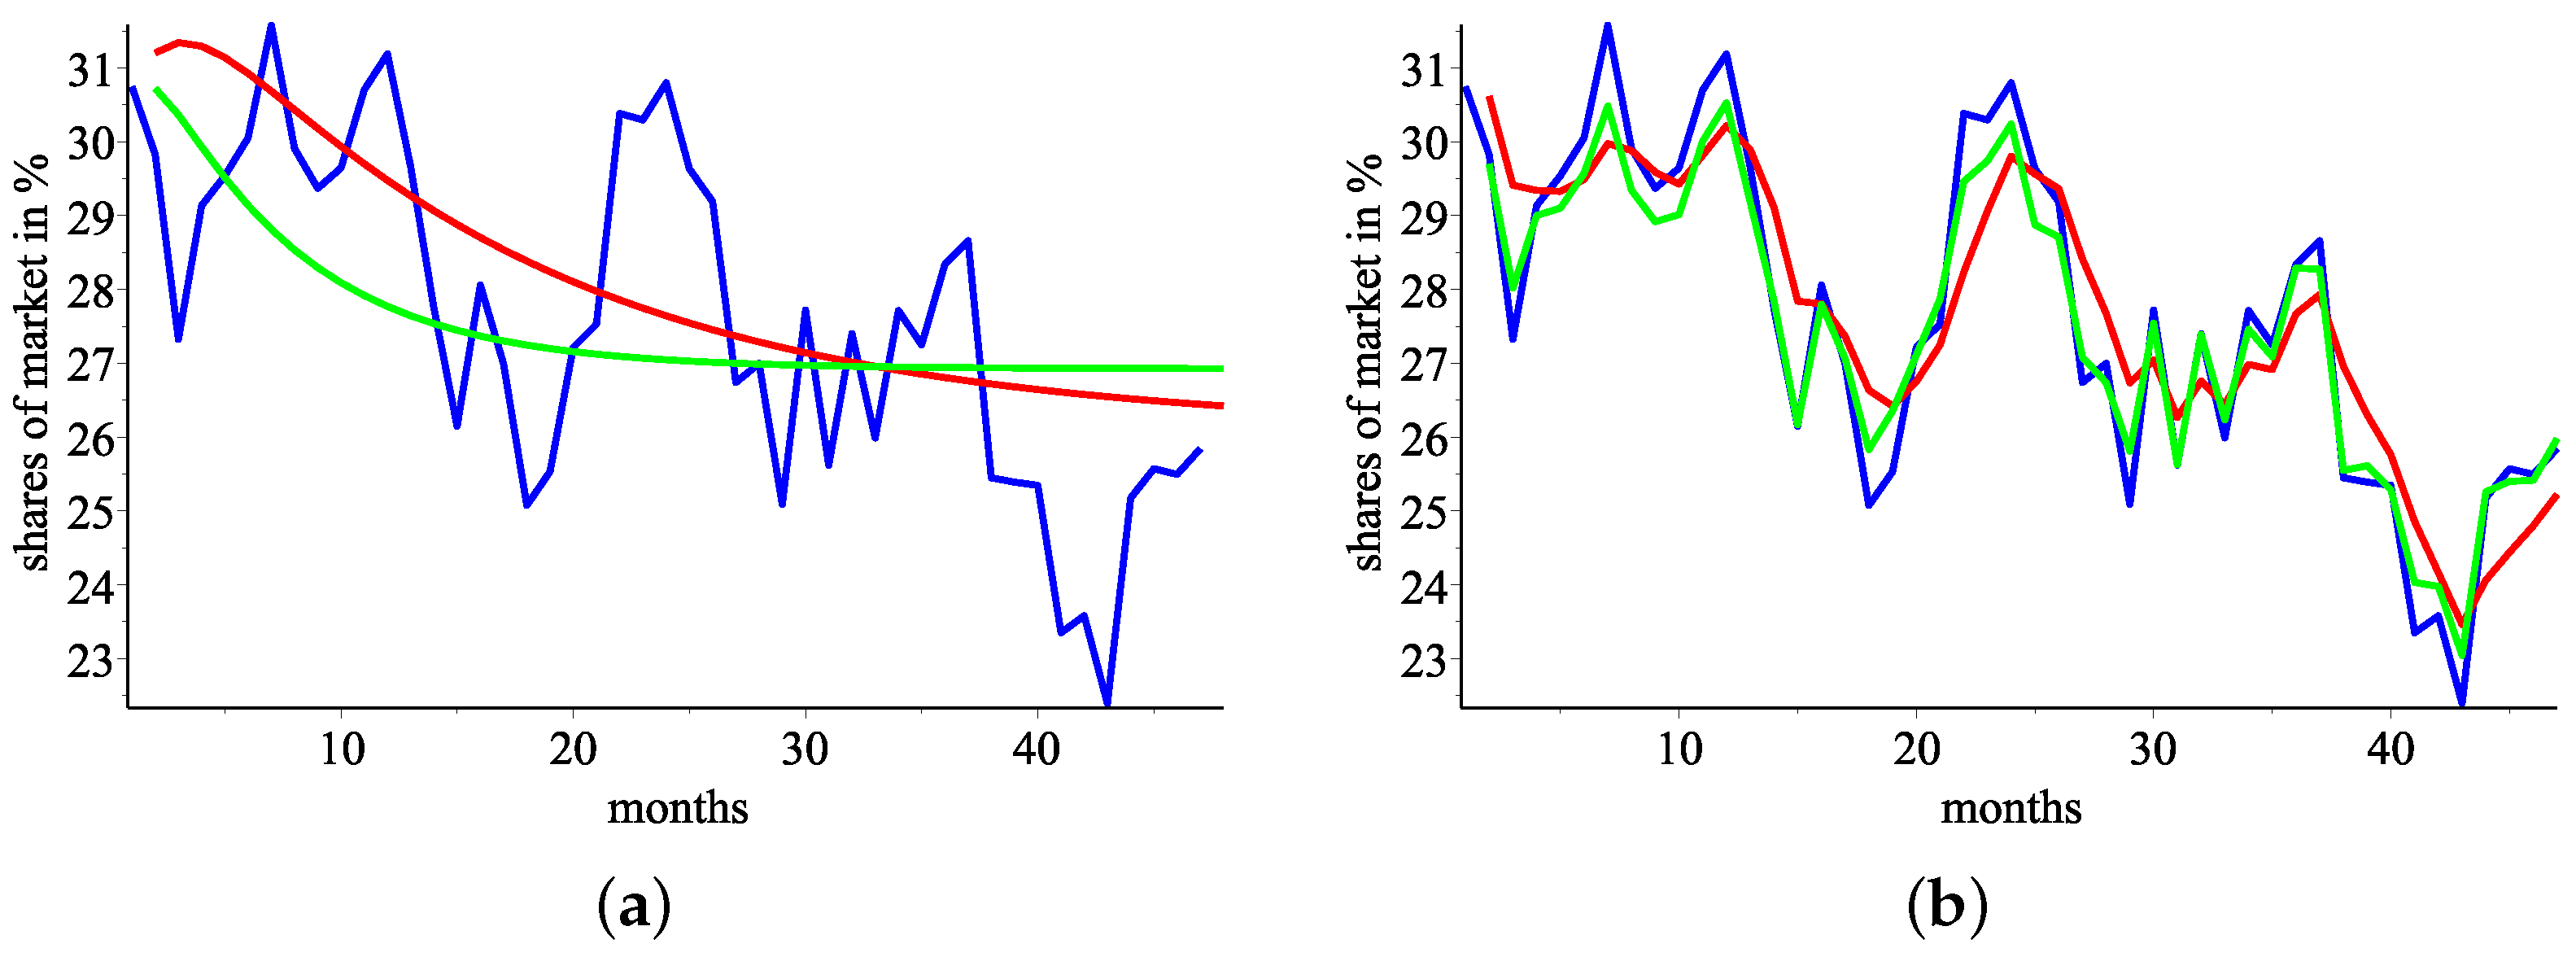
(a) Company 1’s real data in blue, predicted values by iterating in green, predicted values by iterating in red (the response functions constructed by the real data and by the moving average data, respectively). (b) Company 1’s real data in blue, predicted values by (the response function constructed by the real data) in green, predicted values by (the response function constructed by the moving average data) in red.
Figure 8.
(a) Company 2’s real data in blue, predicted values by iterating in green, predicted values by iterating in red (the response functions constructed by the real data and by the moving average data, respectively). (b) Company 2’s real data in blue, predicted values by (the response function constructed by the real data) in green, predicted values by (the response function constructed by the moving average data) in red.
Figure 9.
(a) Company 3’s real data in blue, predicted values by iterating in green, predicted values by iterating in red (the response functions constructed by the real data and by the moving average data, respectively). (b) Company 3’s real data in blue, predicted values by (the response function constructed by the real data) in red, predicted values by (the response function constructed by the moving average data) in green.
Figure 10.
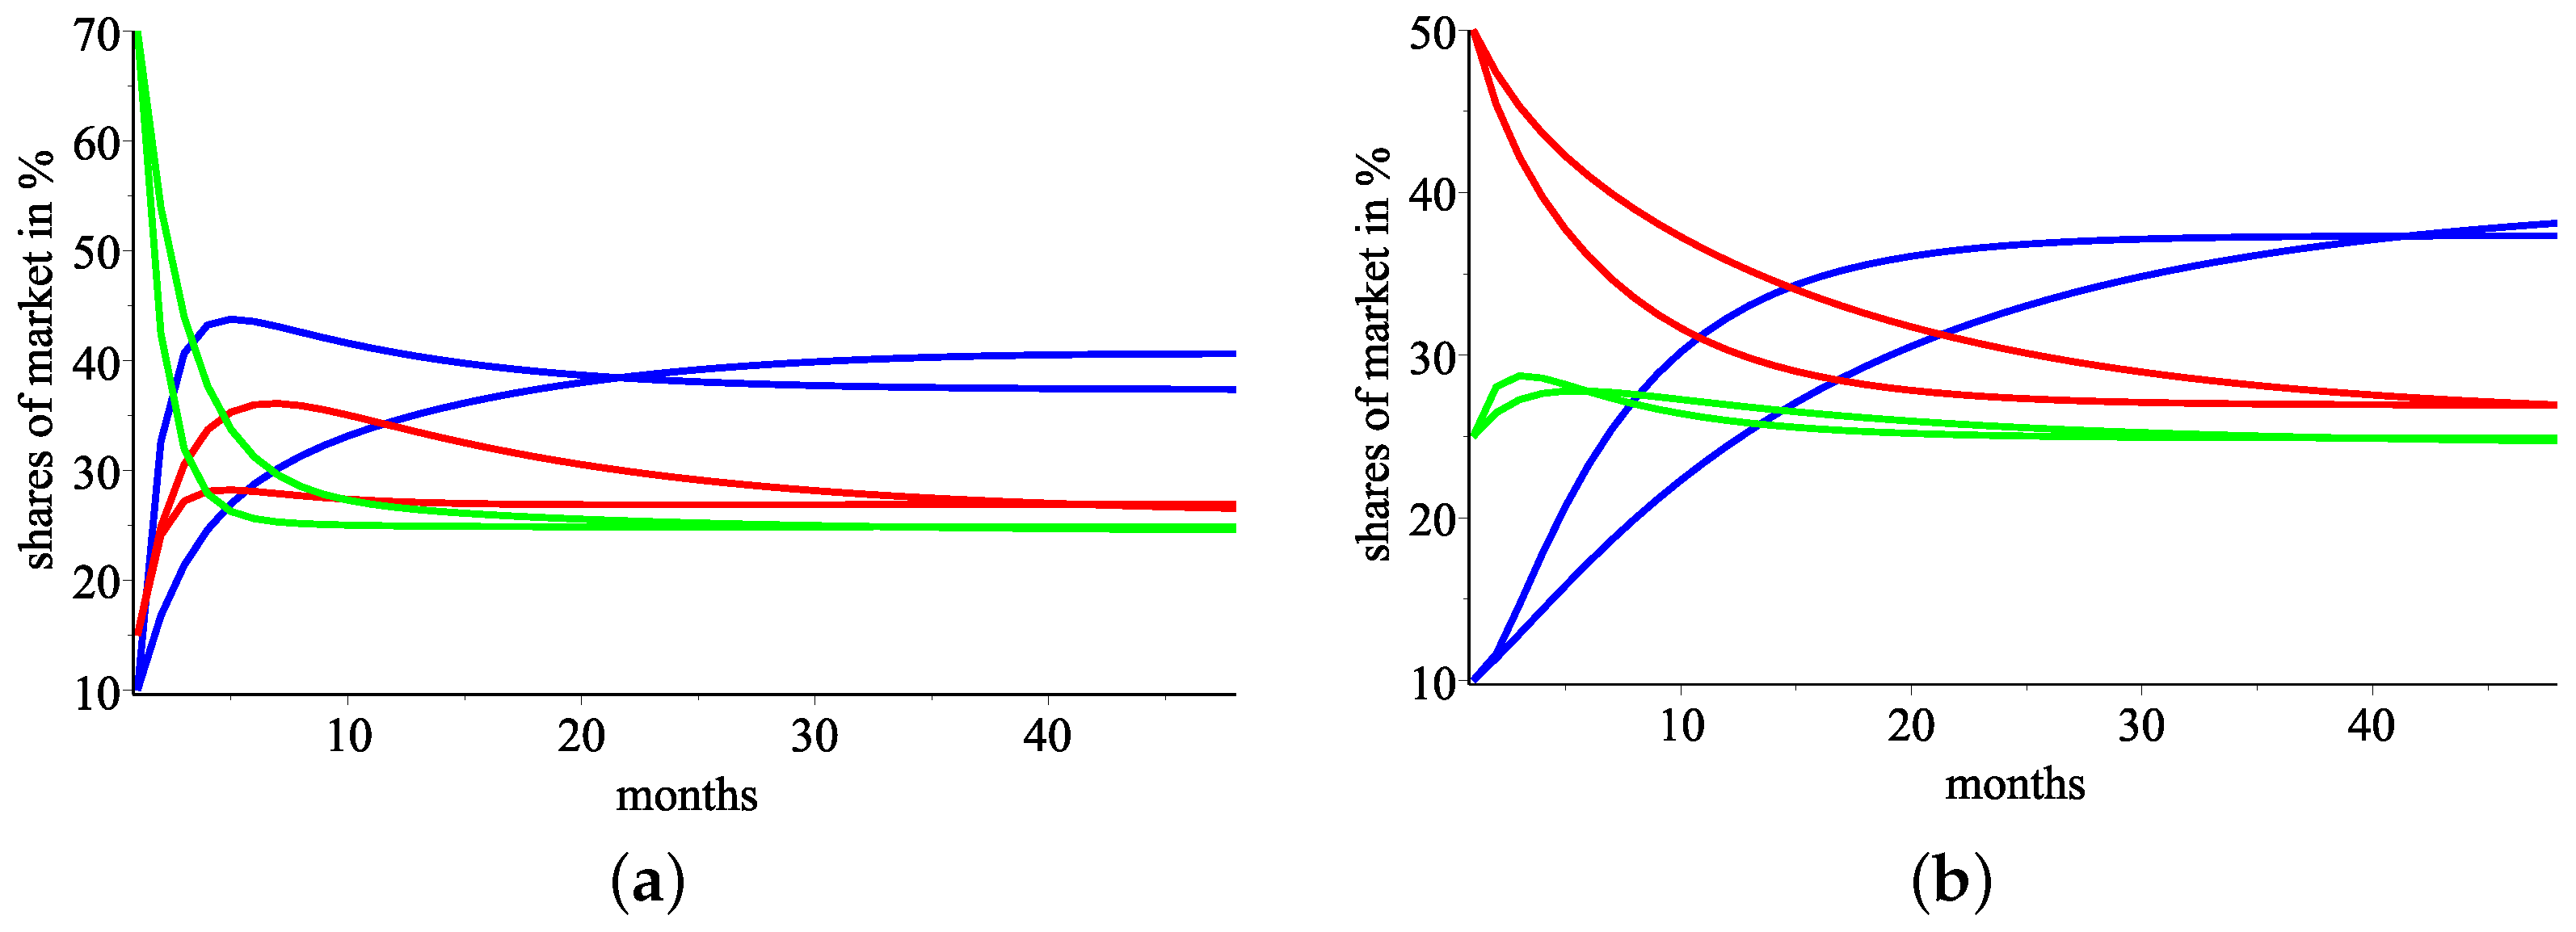
(a) Simulation, with the two models, of the market with an initial start at levels Company 1, 2, and 3 in blue, red, and green colors respectively. (b) Simulation, with the two models, of the market with an initial start at levels Company 1, 2, and 3 in blue, red, and green colors respectively.
Table 1.
The iterated sequence’s values with initial conditions of .
Table 1.
The iterated sequence’s values with initial conditions of .
| n | 0 | 1 | 2 | … | 2k − 1 | 2k |
|---|
| 21 | 19 | 21 | … | 19 | 21 |
| 20 | 20 | 20 | … | 20 | 20 |
| 19 | 21 | 19 | … | 21 | 19 |
Table 2.
The iterated sequence’s values with initial conditions of .
Table 2.
The iterated sequence’s values with initial conditions of .
| n | 0 | 1 | 2 | 3 | 4 | 5 | 6 |
|---|
| 25 | 15 | 25 | 15 | 25 | 15 | 25 |
| 18 | 22 | 18 | 22 | 18 | 22 | 18 |
| 17 | 23 | 17 | 23 | 17 | 23 | 17 |
Table 3.
Descriptive statistics of the initial variables used.
Table 3.
Descriptive statistics of the initial variables used.
| Variable | Mean | Median | Std. Dev. | Variance | Skewness | Std. Err. Skewness | Kurtosis | Std. Err. Kurtosis |
|---|
| Company 1, % | 35.931 | 35.83 | 4.18 | 17.47 | −0.064 | 0.343 | −0.369 | 0.674 |
| Company 2, % | 27.593 | 27.46 | 2.26 | 5.09 | −0.152 | 0.343 | −0.766 | 0.674 |
| Company 3, % | 25.202 | 24.95 | 1.83 | 3.36 | 0.632 | 0.343 | 0.102 | 0.674 |
Table 4.
Result from the unit root tests of the initial time series.
Table 4.
Result from the unit root tests of the initial time series.
| Statistics | | Company 1 | Company 2 | Company 3 |
|---|
| Dickey-Fuller F test | statistic | 0.167359 | −0.237856 | −0.258687 |
| p-value | 0.723573 | 0.624571 | 0.619816 |
| Philips-Perron F test | statistic | 0.183871 | −0.225644 | −0.162057 |
| p-value | 0.727902 | 0.627348 | 0.641746 |
Table 5.
Outcomes of the unit root test of the diffenreced time series.
Table 5.
Outcomes of the unit root test of the diffenreced time series.
| Statistics | | DCompany1 | DCompany2 | DCompany3 |
|---|
| Dickey-Fuller F test | statistic | −55.6533 | −56.0131 | −70.4378 |
| p-value | | | |
| Philips-Perron F test | statistic | −55.599 | −57.4133 | −65.5202 |
| p-value | | | |
Table 6.
Pearson Correlation Coefficients. We denote by Ci Company i.
Table 6.
Pearson Correlation Coefficients. We denote by Ci Company i.
| | | C1 | C2 | C3 | Lag C1 | Lag C2 | Lag 3 |
|---|
| C1 | Pearson Cor | 1 | −0.827 | −0.712 | 0.891 | −0.790 | −0.551 |
| Sig (2-tailed) | | 0.000 | 0.000 | 0.000 | 0.000 | 0.000 |
| C2 | Pearson Cor | | 1 | 0.256 | −0.777 | 0.790 | 0.422 |
| Sig (2-tailed) | | | 0.079 | 0.000 | 0.000 | 0.003 |
| C3 | Pearson Cor | | | 1 | 0.537 | 0.369 | 0.416 |
| Sig (2-tailed) | | | | 0.000 | 0.010 | 0.003 |
| Lag C1 | Pearson Cor | | | | 1 | −0.834 | −0.754 |
| Sig (2-tailed) | | | | | 0.000 | 0.000 |
| Lag C2 | Pearson Cor | | | | | 1 | 0.323 |
| Sig (2-tailed) | | | | | | 0.025 |
Table 7.
Statistical performance of the created models.
Table 7.
Statistical performance of the created models.
| | Model Company 1 | Model Company 2 | Model Company 3 |
|---|
| 0.966 | 0.981 | 0.876 |
| MAPE | 0.025 | 0.013 | 0.029 |


