1. Introduction
Abdominal cancer is a major global health concern, being one of the most commonly diagnosed cancers and among the top three leading causes of cancer-related death [
1]. The level of aerobic fitness prior to surgery has been identified as an important factor for determining the ability to cope with these increased demands and postoperative outcomes. After major abdominal surgery, there is a significantly increased number of metabolic demands on the body [
1]. The level of aerobic fitness prior to surgery has been identified as an important factor for determining the ability to cope with these increased demands and postoperative outcomes [
2]. To address fitness issues, several hospitals have developed exercise (prehabilitation) programmes to improve the aerobic capacity of this patient group prior to surgery [
2]. The most common exercises in prehabilitation programmes are aerobic training activities, such as cycling, walking (treadmill and/ or outdoor), rowing, using a cross-trainer, and stepping.
The intensity of exercises prescribed in these programmes often varies from light to moderate to vigorous, and, more recently, they have included interval training, where a low intensity exercise is followed by a bout of high intensity exercise. Resistance training is also commonly used as an adjunct to aerobic training and involves exercises primarily targeting the lower (e.g., leg press) and upper limbs (e.g., chest press) at moderate repetitions (10–20 repetitions).
The monitoring of exercise and activity in abdominal cancer patients is important, as adherence to prescribed prehabilitation programmes has been associated with improved aerobic fitness and the reduction of postoperative complications [
3,
4]. However, activity detection in this population has been limited to step counting. This type of detection has limited value to abdominal cancer patients, as specific prehabilitation exercises cannot be detected. Furthermore, it has been difficult to detect the type and intensity of exercises these patients engage in outside of supervised settings in hospitals. This has important implications for the development of home-based exercise in the population, particularly for individuals who are geographically isolated and cannot attend supervised hospital programmes.
In the last decade, many researchers have developed devices and systems to monitor human motion and activity recognition. Although a number of these systems (e.g., 3D motion analysis) provide accurate information, they are often expensive and limited to laboratory settings [
5]. Others [
6,
7] have used machine learning techniques, which often require the attachment of multiple inertial measurement unit (IMU) sensors to detect the motion. Whilst this may allow measurement outside of the laboratory environment, the feasibility of attaching multiple sensors in a clinical setting may be limited.
In this work a frequency-based approach has been used to analyse the frequency content and amplitude (power) related to each activity [
8,
9,
10,
11]. Different intensities of exercise have been shown to produce variations in both the frequency and amplitude measures for each activity. For example, light intensity cycling produces a common frequency of 0.75 Hz, with an amplitude of 20–30 m/s
2, moderate cycling corresponds to 1 Hz at 40–55 m/s
2, and vigorous to 1.25 Hz and 55–90 m/s
2. However, several prehabilitation exercises for cancer patients (e.g., rowing, step up machine, cross-trainer machine, leg press, and interval training) have received less attention [
12]. Whether findings from healthy young populations can be transferred to patients with abdominal cancer is questionable. In general, the majority of cancer patients are elderly, poorly conditioned, and perform activities at much lower accelerations than younger healthy individuals [
13].
Therefore, the construct validity of these algorithms for older patients under prehabilitation exercise programmes is unclear. Furthermore, no studies to date have used activity and intensity recognition techniques to identify high intensity interval training in this patient group.
2. Related Work
In this section, different models of prehabilitation programmes are reviewed. This is based on the various methods which are already used in different hospitals globally.
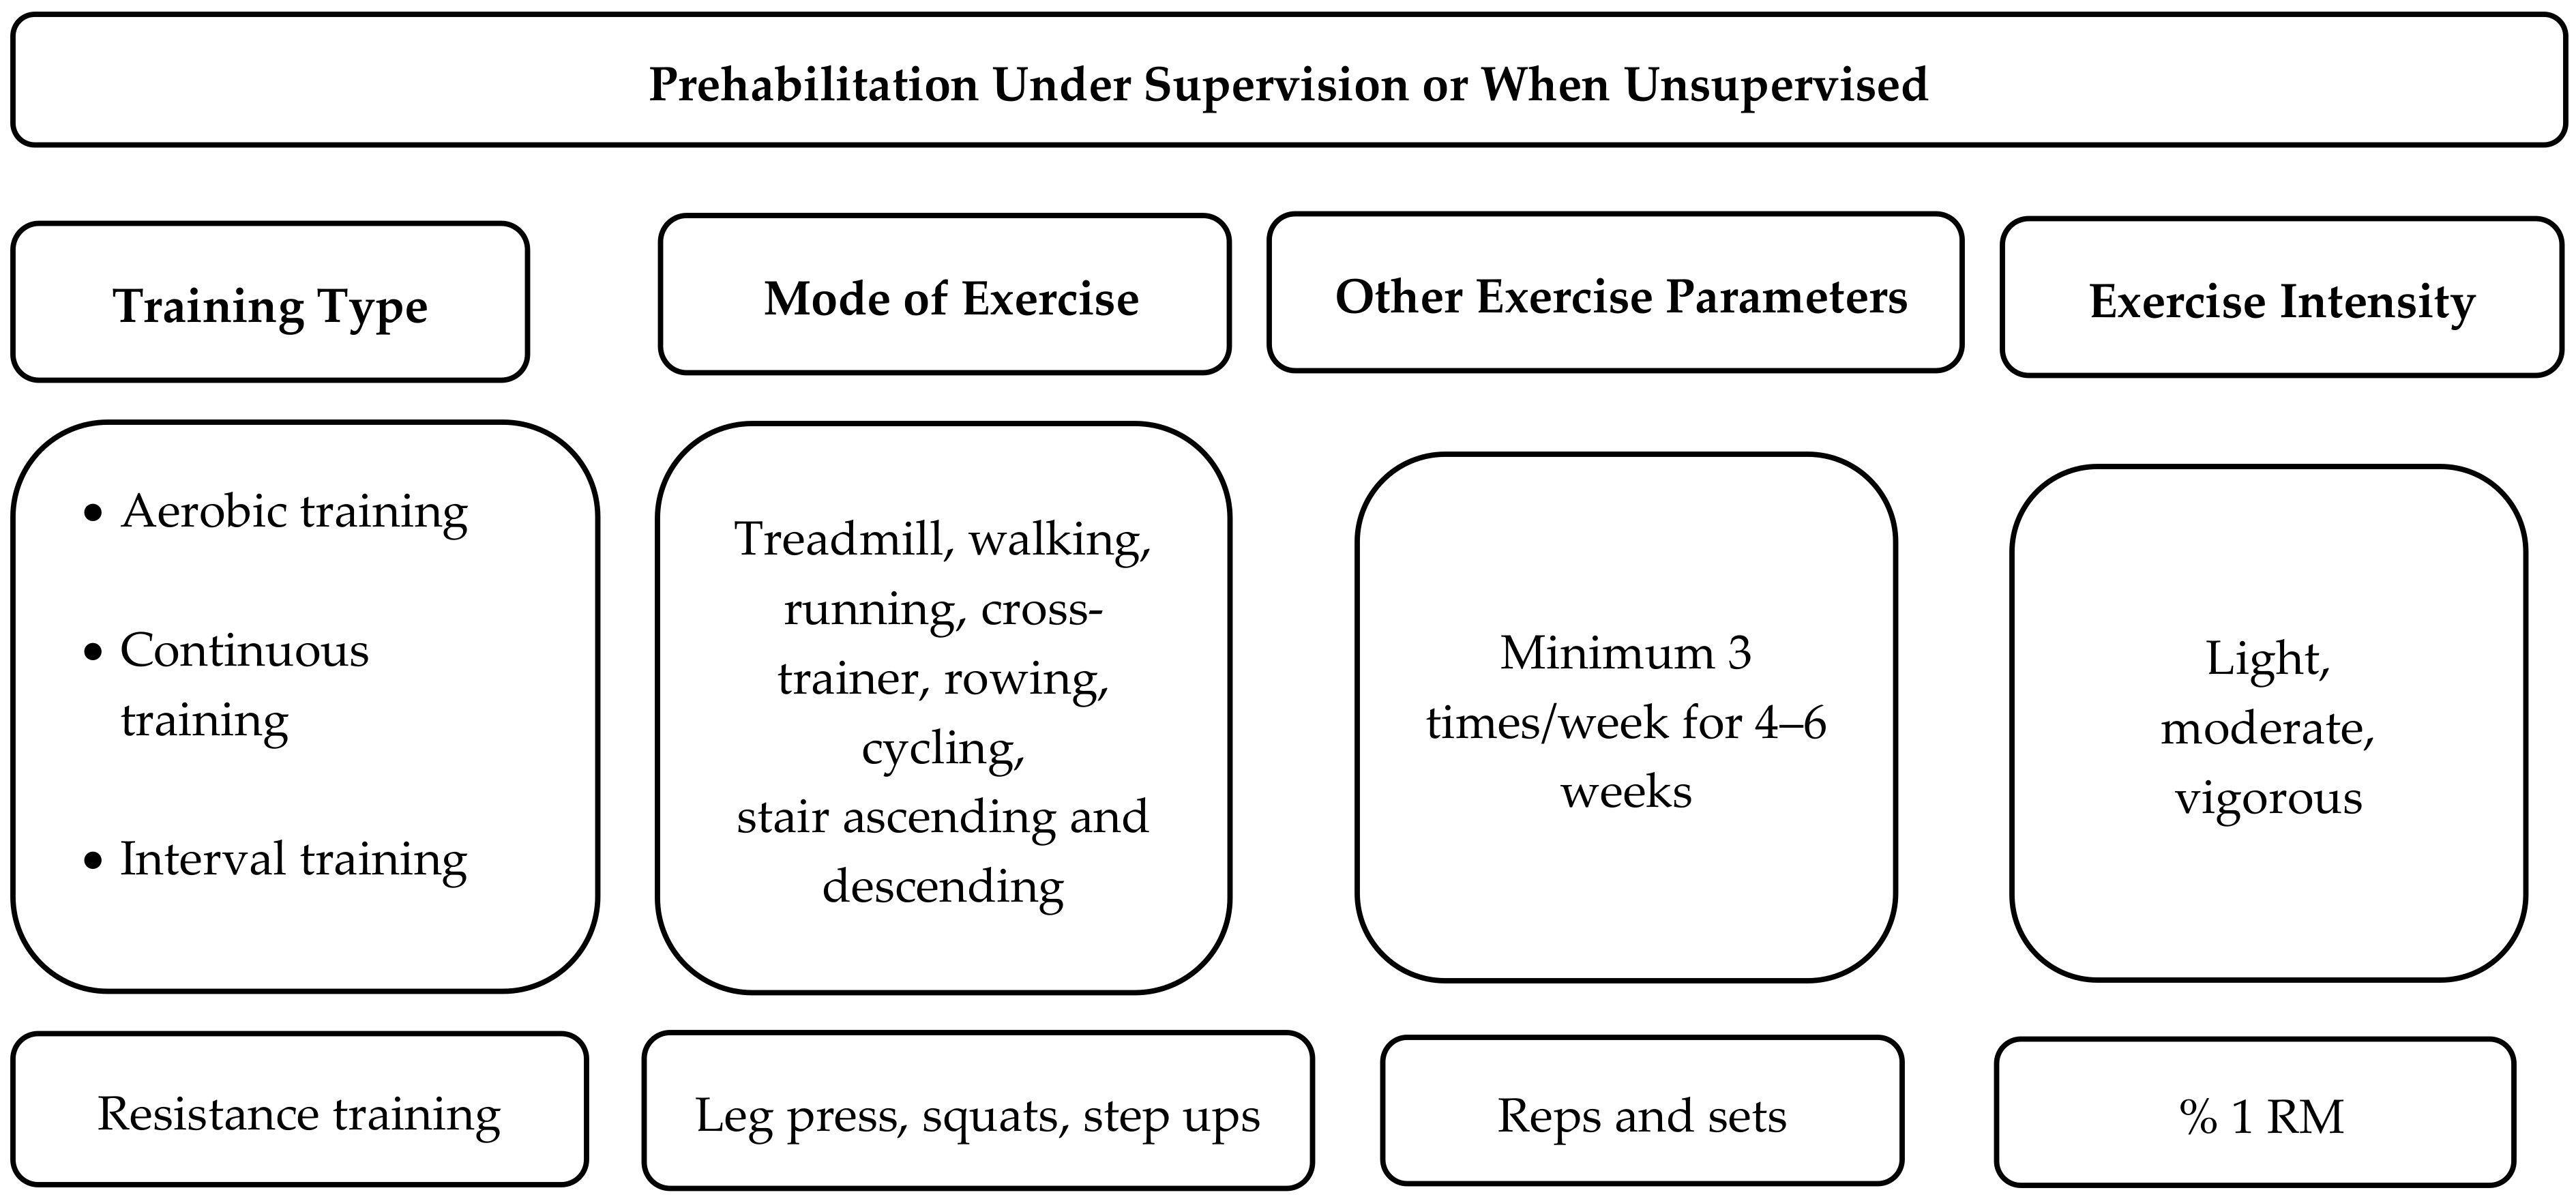
Figure 1 illustrates common exercise parameters in the prehabilitation programmes designed for abdominal cancer patients in supervised and unsupervised settings. Prehabilitation programme parameters are typically defined by the training type (aerobic and/or resistance training), the mode of exercise (e.g., cycling, walking, rowing), exercise frequency and duration parameters, and exercise intensity (
Figure 1). The primary type of activity used in prehabilitation for patients undergoing major abdominal surgery is that which is directed to stressing the aerobic system. The most common aerobic exercises are cycling and walking, though a number of supervised programmes have used running, cycling, rowing, climbing stairs, and cross-training activities [
2]. These aerobic exercises are often performed for at least 30 minutes in either a supervised or home setting from 2–7 times per week [
14,
15,
16,
17].
Typically, initial aerobic exercise will be performed at low or moderate intensity and progress to vigorous intensity [
14,
17,
18]. Exercise intensity is determined using heart rate and ratings of perceived exertion. However, speed and cadence measures can also reflect exercise intensity and can be measured via an accelerometer. For instance, in older populations over the age of 60 years, walking speeds of around 3.3 km/h, 4.2 km/h, and 6 km/h have been defined as light, moderate, and vigorous intensity, respectively [
19]. In addition, intensity during cycling can be increased by increasing cadence from 60 to 80 to 100 RPM, respectively [
20]. Rowing intensity is often calculated by measuring the average power output (40 W—light, 80 W—moderate), but stroke rate also tends to increase as exercise intensity increases. More recently, high intensity interval training has been used to improve fitness in this patient group. This involves a 15-second to two-minute period of rapid movement (high cadence/speed) followed by a period of very slow movement or rest.
A number of prehabilitation programmes also have a resistance training component, targeting the upper and lower limbs for between 8–15 repetitions.
Prehabilitation studies have used exercise interventions in supervised and unsupervised environments. However, those studies that have developed home-based unsupervised prehabilitation programmes have tended to have much lower compliance rates than supervised hospital programmes [
21]. Therefore, the development of a simple device to monitor and provide feedback on specific activities or exercise may potentially improve exercise engagement and outcomes for cancer patients who cannot regularly attend hospital-based prehabilitation programmes.
3. Activity Recognition Techniques
Most of the exercises used for abdominal cancer prehabilitation are rhythmical and have time and frequency components that can be detected via the analysis of accelerometer data. The most widely used data extraction methods used in accelerometry are time domain and frequency domain feature data analysis.
Time domain feature analysis extracts the fundamental waveform characteristics of a given signal. Waveform feature analysis does not require lag statistics and waveforms are easily extracted from raw data [
22]. Frequency domain feature analysis focuses on the periodicity and structure of the signal using algorithms such as Fourier transform coefficients [
22]. On other hand, the magnitude components of the fast Fourier transformation (FFT) of the signal are assumed to discriminate activities with similar energy values and are also proposed to extract primary information from the data, reducing the size of the data.
Conventionally, activities of daily living, including physical exercise, fall below 20 Hz [
23]. Accordingly, frequency domain features have been used in previous research to analyse the raw acceleration data extracted from sensors attached to people performing gait and stair activities (
Table 1). Pachi et al. [
9] performed 800 different accelerometer tests in males and females across different age groups who walked at speeds between 4.5–5.2 km/h and found that the frequency range was between 1.4–2.1 Hz. Sharma et al. [
10] investigated the frequency range of three activities (rest, walking, and running) in two subjects wearing a 3D wearable accelerometer sensor attached to the chest. The normalized FFT was then checked for the range of frequencies at the peak of the magnitude of the dominant frequency. The frequency range for rest was 0.5 Hz and between 1.5–2.5 Hz for normal walking, while the running range was 2.5–4 Hz.
In another study, Mathie et al. [
24] performed 283 tests using a waist-mounted 3D accelerometer. It was concluded that different types of walking ranged from 0.7–3 Hz. Gaile et al. [
11] studied the frequency components of ascending and descending a staircase by using a 3D accelerometer sensor. They found the frequency range of ascending and descending stairs was 0.9–2.4 Hz. When a subject was asked to run down a staircase, the frequency ranges (1.65–3.3 Hz) were higher than walking down stairs [
25].
4. Prehabilitation Process Structure and Monitoring Requirement
Key hospitals that specialize in the treatment of cancer often use prehabilitation programmes for their patients. However, the number of the patients involved in this type of programme is low in comparison to the total numbers of abdominal patients who are assigned for surgery. A number of these programmes have been developed and supervised within hospital settings. These programmes often require each patient to attend a hospital-based session between 2–4 times per week. Many hospitals have limited resources (staff, equipment, and funding) for such programmes. Furthermore, many patients live in communities where they are unable to access a hospital or physiotherapy centre frequently. More recently, community-based prehabilitation programmes have been developed for this patient group [
14,
26]. Prescribed exercises are often given for a period of 2–6 weeks at home, typically performed outdoors or in a gymnasium. Community-based programmes are often unsupervised and typically involve walking, cycling, aerobic, and resistance exercise as the main exercises. Patients initially begin with low intensity exercise for 30 min per day and progress to 50 min of exercise at a moderate to vigorous intensity three times per week.
The development of an activity recognition system to detect a variety of types and intensities of exercise, both within and outside the hospital environment, is important for this patient group. This allows clinicians to effectively monitor patient activity in unsupervised environments. Accurate monitoring could also give flexibility to the patient to perform a variety of home-based activities, which could elicit similar exercise intensities. For example, the patient may subsidize some physical activities with others (e.g., replacing treadmill walking with walking, rowing, or cycling) throughout the programme and still achieve a similar volume or intensity of training [
27]. The remote monitoring of activity also has the potential to reduce the impact on healthcare facilities and healthcare members as well. In addition, the system should be able to monitor and detect continuous or intermittent activities, with or without supervision. It should also accommodate activities performed in both indoor and outdoor environments. Accordingly, this work will try to construct a mixed mode activity recognition system that can detect, and record activities performed in supervised and or unsupervised prehabilitation programmes and give flexibility to the patient to do the prescribed exercises at home, or in a gymnasium, community centre, or hospital.
6. Results and Discussion
The data were collected from nine physical activities at low, moderate, and vigorous intensity. A more detailed analysis of walking and cycling is shown in
Figure 5,
Figure 6,
Figure 7,
Figure 8 and
Figure 9, as these are the most common activities used in prehabilitation programmes. The remaining activities are described in
Table 2, with the extracted features for each of them. The following section compares the efficacy and accuracy of the sensor located on the wrist and ankle to distinguish different walking and cycling intensities.
6.1. Walking at Different Intensities
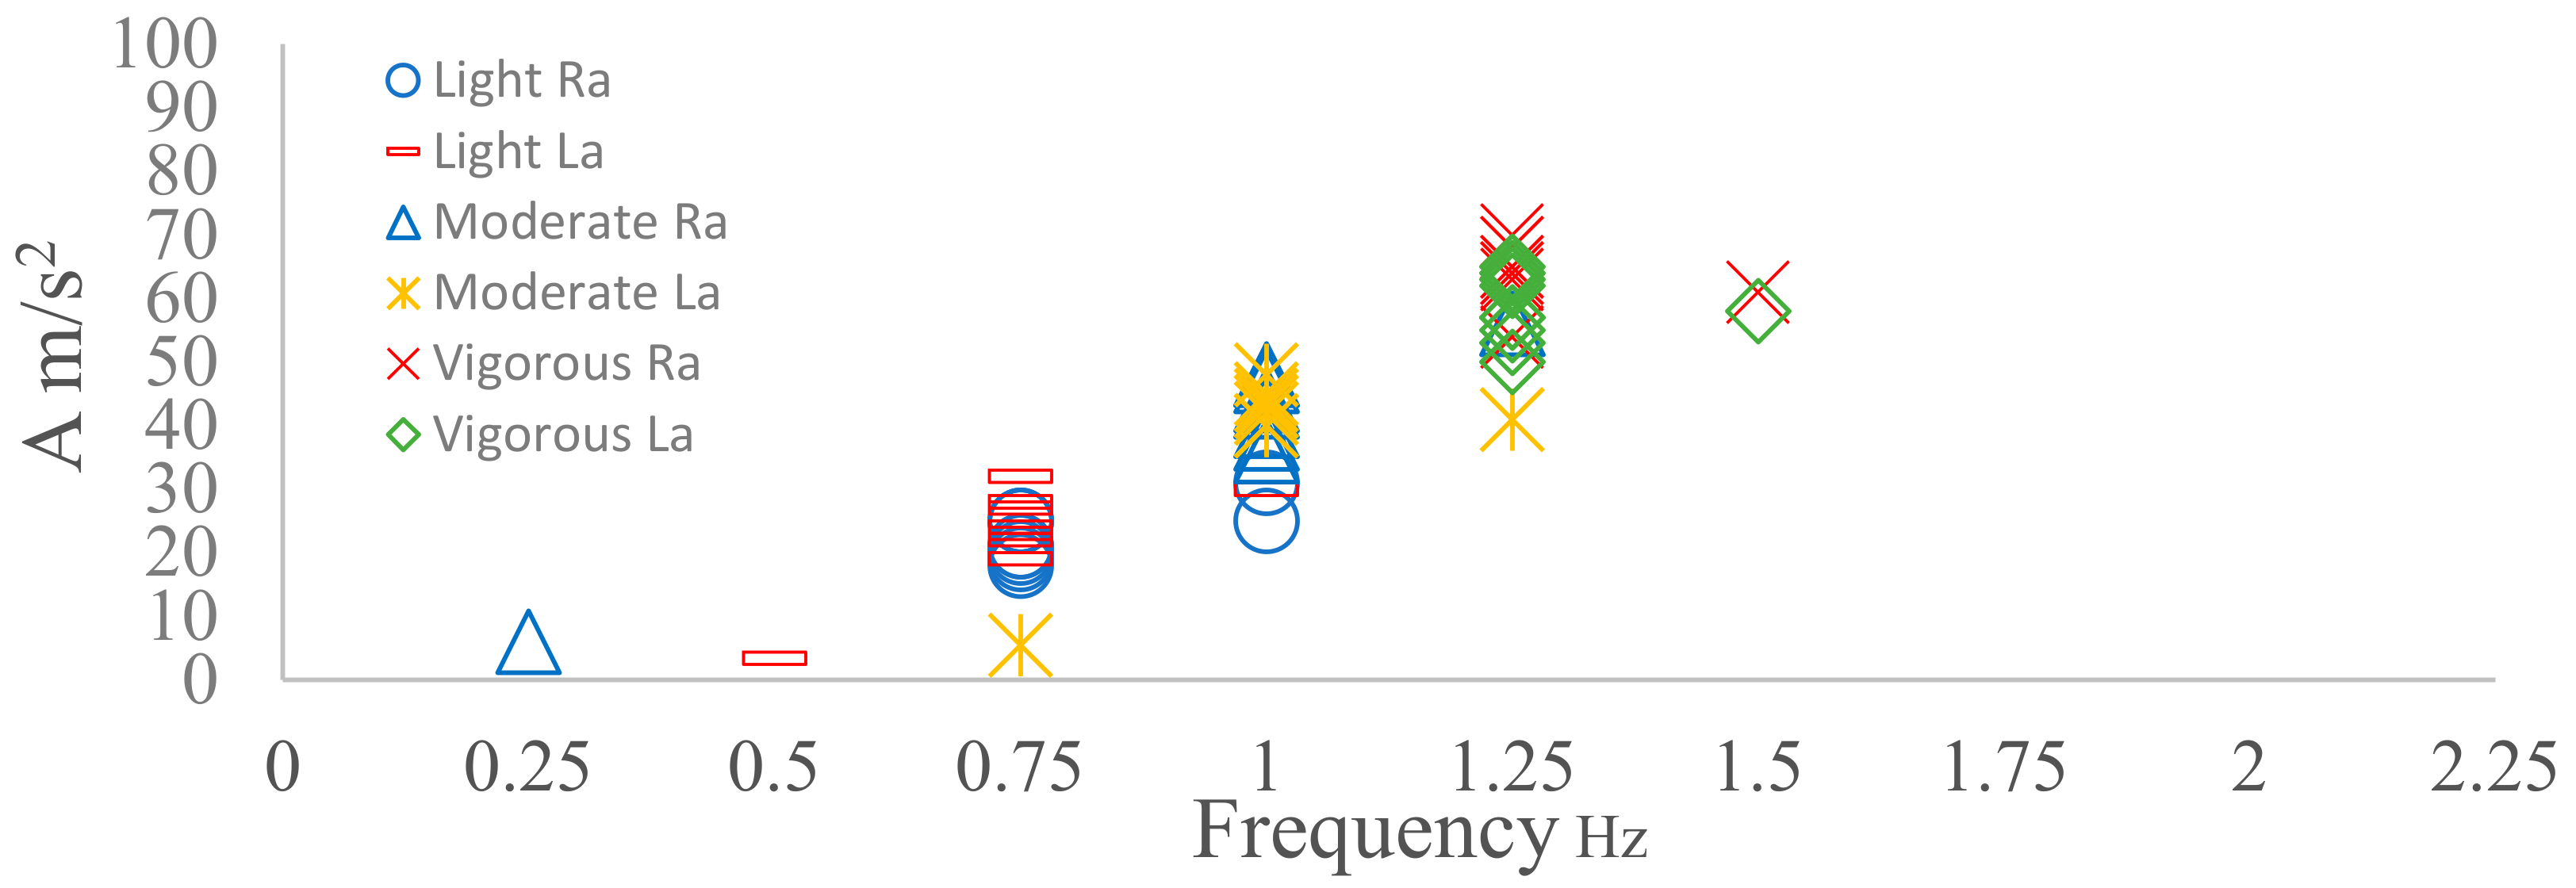
Four sensors were placed on four different locations, namely: left wrist (Lw), right wrist (Rw), left ankle (La) and right ankle (Ra). From the analysis, it was observed that both the right and left ankle produced a similar frequency with each walking intensity (
Figure 5). Walking at 4 km/h produced 1.5 Hz, whereas walking at a moderate speed (5 km/h) resulted in a dominant frequency of 2 Hz and walking at a vigorous speed (6.5 km/h) produced a dominant frequency of 2.25 Hz. The frequencies found for light and moderate walking are similar to other studies [
9,
10,
24] using speeds between 4.2–5.5 km/h. However, the dominant frequency for vigorous walking was 2.25 Hz here, which differs from the 3 Hz reported in another study [
24]. The amplitude ranges of the dominant frequency were also different when walking at different intensities. The amplitude range of the peak frequency for light walking was 11–30 m/s
2, the moderate walking range was 30–50 m/s
2, and the amplitude range for vigorous walking was 50–75 m/s
2 (
Figure 5). This may indicate that the combination of the dominant frequency and amplitude may help to identify the different types of walking intensities rather than dominant frequency alone.
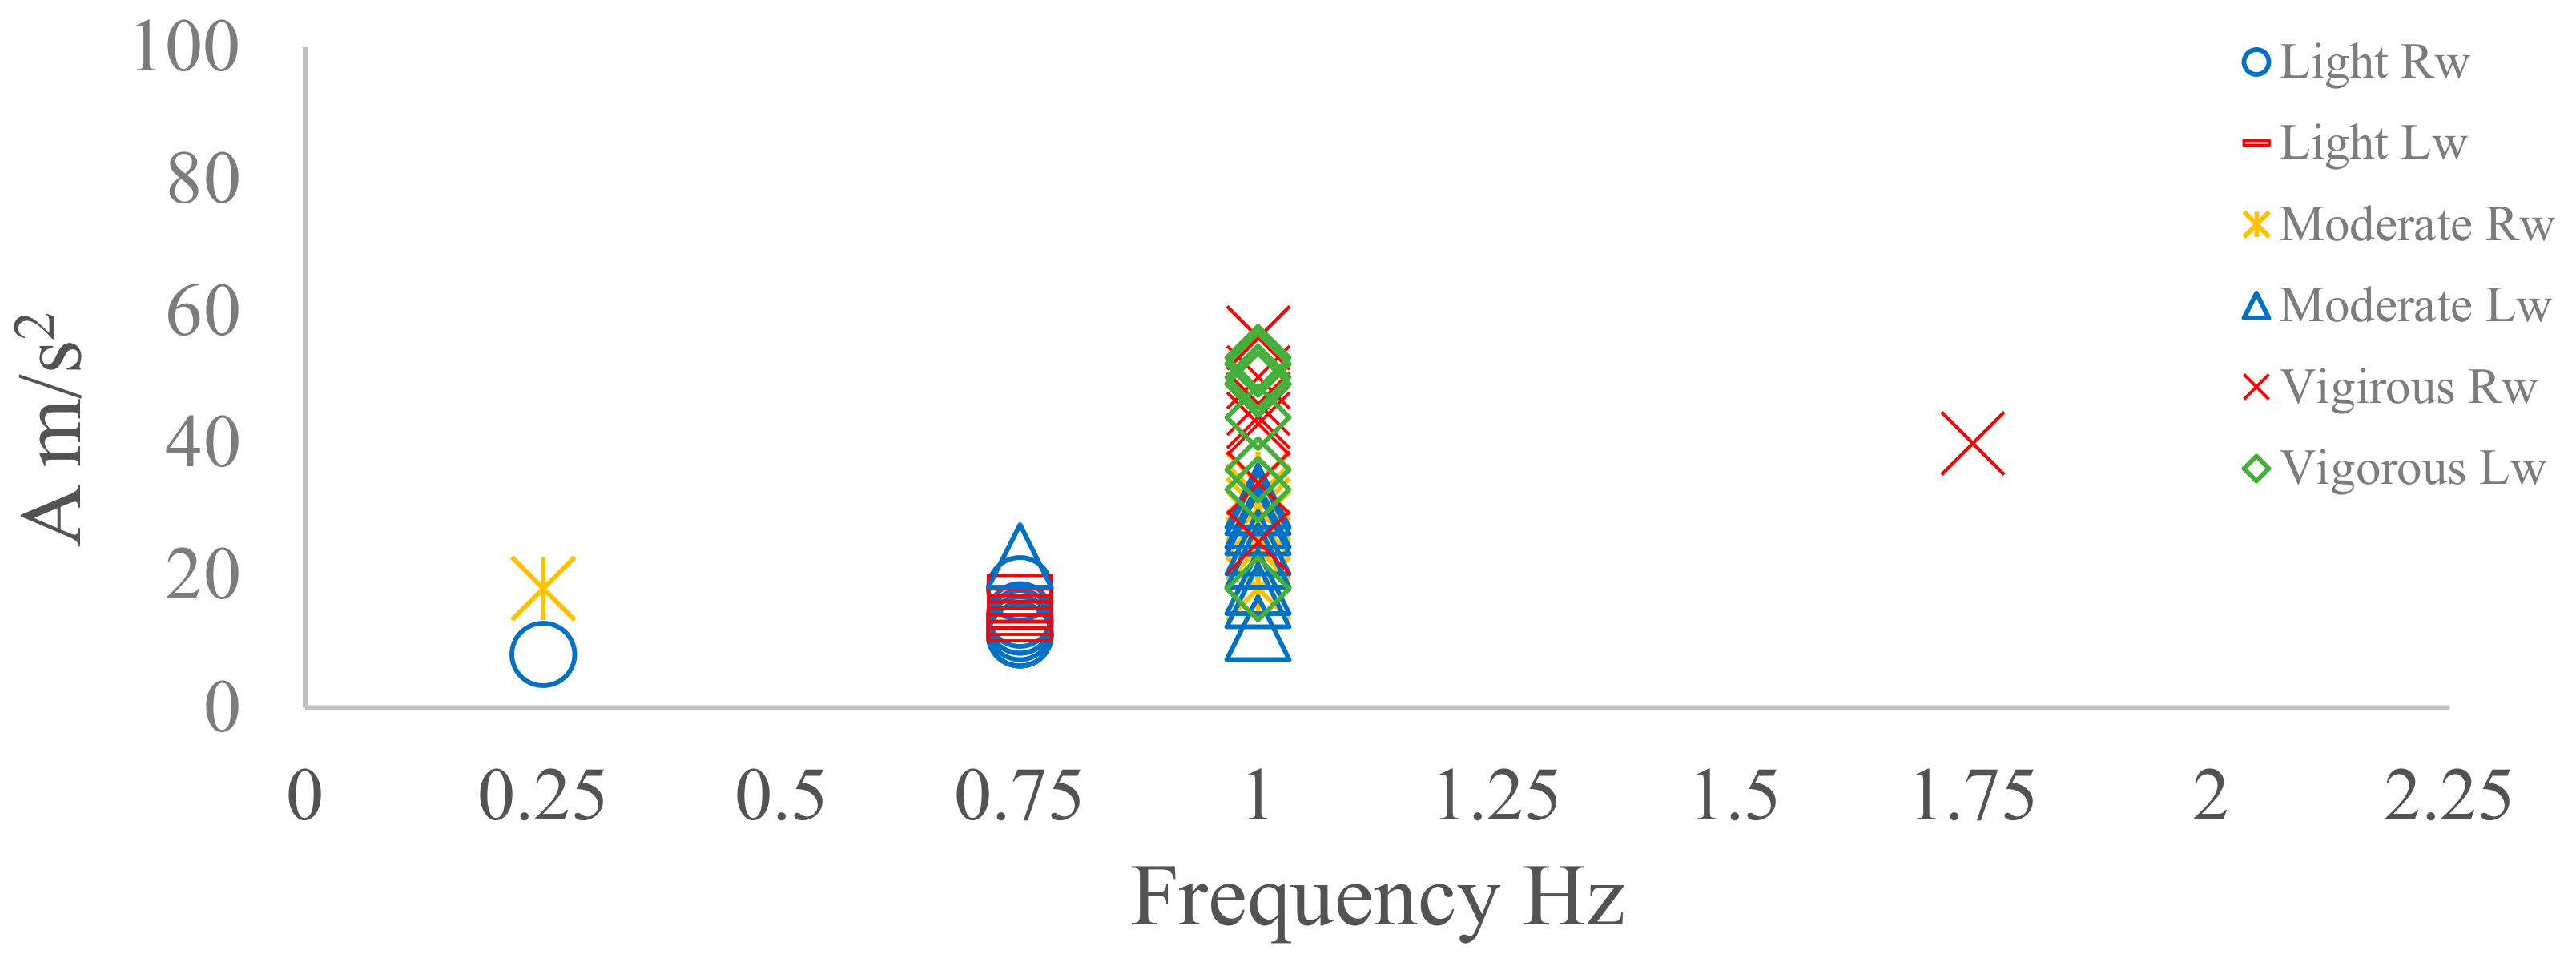
The frequency data collected from the right wrist were similar to that collected from the left wrist (
Figure 6). Light walking produced a lower dominant frequency of 0.75 Hz and an amplitude range of 10–20 m/s
2 (
Figure 5). Moderate and vigorous walking produced a similar frequency of 1 Hz. However, the amplitude measurements during vigorous walking (range: 30–60 m/s
2) were nearly twice that produced during moderate walking (range: 20–40 m/s
2). There is limited data in the literature concerning the analysis of frequency and amplitude from sensors located at the wrist for walking.
The accuracy and consistency were also examined on each activity using the following equation:
For light and moderate walking, the repeatability on both the ankle and wrist was approximately 90%. The vigorous walking repeatability of 80% for both the ankle and wrist is slightly less than that recorded at lower intensities.
In summary, different walking speeds could be accurately detected using dominant frequency and amplitude data from the ankle accelerometer with good accuracy. As the wrist was unable to clearly differentiate between moderate and vigorous walking, it was concluded that the ankle location is the most suitable location for the categorization of walking intensity. It should also be taken into consideration that the outliers observed during the beginning of each activity represent the transition from being stationary to moving.
6.2. Cycling at different intensities
Cycling was tested with a middle-aged participant, where the 3D sensor was placed on both the ankle and the wrist. Intensity was based on revolutions per minute (rpm). Accordingly, 50 rpm, 70 rpm, and 90 rpm were chosen to represent light, moderate, and vigorous cycling intensities, respectively. There is currently no information in the literature on the frequency and amplitudes for each cycling cadence [
20]. From
Figure 7, it can be observed that both the La and Ra 3D accelerometer sensors produced a similar dominant frequency within each intensity. The dominant frequencies during all intensities of cycling were located between 0.75–1.25 Hz, which is considerably lower than the frequencies observed during walking (
Figure 5 and
Figure 7).
Figure 7 shows that the dominant frequency measures for each intensity were clearly different, increasing from 0.75 Hz at light intensity to 1 Hz at moderate intensity and 1.25 Hz at vigorous intensity. The amplitude range for the dominant frequency also increased when the intensity increased (
Figure 5).
For the left and right wrist, the dominant frequency varied between 0.75–1 Hz at light intensity. At moderate and vigorous intensity, the frequency data were highly variable, and therefore it was difficult to determine a dominant frequency. The amplitudes of different intensities were lower than 5 m/s
2 (
Figure 8). The ankle dominant frequency data had high accuracy (90% accuracy) and repeatability, whereas the wrist frequency data were inconsistent. Therefore, for classifying cycling, the left and right ankle were considered as the best locations for recognizing cycling activity.
6.3. Cycling Activities for Five Participants at Different Intensities
Figure 9 shows the frequency and amplitude domain of five participants of different ages (P1—20 s, P2—48 s, P3—60s P4—70 s and P5—80 s) who performed the cycling activity at different intensities.
The sensor was located on La for all participants. It can be observed clearly from
Figure 9 that the dominant frequency for all participants was the same for different intensities (light = 0.75 Hz, moderate = 1 Hz, vigorous = 1.25 Hz) except for P5, who could not reach 90 rpm due to limited co-ordination. Amplitude measures of the dominant frequency were lower at light intensity when compared to moderate and high intensities. However, there was considerable overlap in the amplitude measures for moderate and vigorous cycling. The dominant frequency consistency clearly appears through different intensities, with an overall accuracy of 80%. In summary, if the sensor is placed at the ankle, it can recognize the different intensities of cycling activities.
6.4. Analysis of Common Prehabilitation Activities
Table 2, shown below, presents the results of analysing the data for the most common physical activities that are likely to be prescribed for participants who are enrolled in a prehabilitation programme. The discussion here focuses on the readings extracted from the sensor placed on the ankle, as this location offers a better representation of the movements involved than when the sensor is placed on the wrist. Some activities can be easily distinguished from others by either the dominant frequency content or the amplitude related to the intensity of that dominant frequency. Examples here are light and moderate running and light and moderate leg presses. Other types of movements, such as light cross-trainer exercise, light rowing exercise, light walking or cycling exercises, and light treadmill exercise, can be recognized using both frequency and amplitude. In contrast, other activities, such as moderate walking and moderate treadmill exercises, show an overlap in both the dominant frequency and related amplitude. Furthermore, no clear consistency has been shown in staircase ascension and descension for both the dominant frequency and amplitude. In this context, additional factors, such as displacement tracking or GPS, could be applied for distinguishing those physical activities.
7. Discussion
This study highlights the key components involved in the monitoring and management of pre-operative prehabilitation programmes. These components include the type of physical activity, the duration allocated, and the related exercise intensity. This, in effect, is driving towards approaching digital health programmes through formally managing the service using online monitoring and interaction with patients. The novelty of the study comes from looking at key components involved in monitoring the process of prehabilitation and utilizing the frequency domain for activity analysis and identification.
Furthermore, it highlights the importance of 3D accelerometer sensors and their potential role in the monitoring of this type of healthcare. While the sensor board used for our research (Microduino-10DOF) contains all necessary motion sensors, we have explicitly exposed the potential of one of the main sensors to identify how far we can go with a given sensor in offering the required monitoring. This is an important design step in relation to the amount of data we are gathering, and the intensity of communication needed (hence energy and communication channel occupancy).
Based on the selected physical exercises, the lower limbs are more effective in monitoring most of the prehabilitation activities than upper limbs. Accordingly, the ankle has been selected as the most suitable place for placing the sensor.
Table 2 shows the dominant frequency and amplitude of nine common prehabilitation physical activities. There are similarities between our results and previous research which has measured the dominant frequency ranges for walking at different intensities (1.5–2.25 Hz) [
8,
9,
10]. The dominant frequency and amplitudes of other prehabilitation physical activities, such as cycling, staircase ascension and descension, and rowing, has received less attention by other researchers. The rest of the nine activities in
Table 2 are not discussed by other researchers in terms of frequency domain analysis. However, our initial analysis would indicate that a number of these exercises can be distinguished through frequency and amplitude measurements. For example, activities like cycling, slow walking, and rowing can be distinguished from each other based on the FFT outcome. Other activities, like moderate walking and treadmill use, present some degree of overlap. It would also appear that both staircase ascension and descension do not have a frequency consistency, due to the mixed activity between using stairs and walking. Accordingly, further analysis is required for the development of a more involved activity recognition approach that covers a wider spectrum of activities. Aspects like personalization and machine learning may help in offering better capability for accurate recognition.
8. Conclusions
This paper has focused on prehabilitation programmes for patients with abdominal cancer that are scheduled for surgical operation. It has analysed the key activities involved in a prehabilitation programme. The analysis of the data collected is based on frequency domain analysis and has utilized the dominant frequency associated with each activity, together with the intensity of that frequency. Nine types of physical activities have been studied here. When examining the best data collection duration for the FFT algorithm, when using the 32 sample/s, 4s was found to be the minimum time that could be used without influencing the outcome. Different intensity modes were also considered for each of the activities. The results show that some activities such as walking, and rowing are easily distinguished using the dominant frequency or associated amplitude. Recognition of other activities is difficult due to the overlap of the frequency and amplitude components of the FFT windows. This, in effect, may suggest the need for additional sensors (backup sensors) or possibly more involved machine learning analysis in order to elucidate more accurate activity recognition. Although we have highlighted the need for supportive sensing, this may not necessarily suggest the use of a backup sensor(s) all the time. This may also mean the backup sensor may not necessarily be a motion sensor. For example, the additional monitoring of heart rate may help in differentiating the intensity of the activity. Localization may also help in supporting the differentiation of the type of activity through smart ideas. Our next move is to cover this optimization problem for the prehabilitation process that we are concerned with.


