Abstract
Widely deploying sensors in the environment and embedding them in physical objects is a crucial step towards realizing smart and sustainable cities. To cope with rising resource demands and limited budgets, opportunistic networks (OppNets) offer a scalable backhaul option for collecting delay-tolerant data from sensors to gateways in order to enable efficient urban operations and services. While pervasive devices such as smartphones and tablets contribute significantly to the scalability of OppNets, closely following human movement patterns and social structure introduces network characteristics that pose routing challenges. Our study on the impact of these characteristics reveals that existing routing protocols subject a key set of devices to higher resource consumption, to which their users may respond by withdrawing participation. Unfortunately, existing solutions addressing this unfairness do not guarantee achievable throughput since they are not specifically designed for sensed data collection scenarios. Based on concepts derived from the study, we suggest design guidelines for adapting applicable routing protocols to sensed data collection scenarios. We also follow our design guidelines to propose the Fair Locality Aware Routing (FLARoute) technique. Evaluating FLARoute within an existing routing protocol confirms improved fairness and throughput under conditions that compromise the performance of existing solutions.
1. Introduction
The deployment of sensors in Smart Cities aims to facilitate efficient management of resources and enhance the quality of human life. The concept of Internet of Things (IoT) would see sensors widely deployed in the environment and embedded in physical objects to provide efficient urban operations and services. The success of IoT relies on connecting these sensors to the Internet in order to share the generated information across multiple platforms and applications. This requires a backhaul for collecting and transmitting data from sensors to gateways that are connected to remote management centres through the Internet [1]. In such environments, opportunistic networks (OppNets) serve as a logical backhaul solution for data involving delay-tolerant applications such as agricultural monitoring [2], habitat monitoring [3] and environmental monitoring (for garbage collection and green zone management [1], analysis of noise levels and water quality [4], river pollution management [5], and meter readings [6]). Among the various possible backhaul solutions (e.g., cellular connectivity [7], mesh networks with ad hoc technologies [8], existing communication infrastructure in cities [1], and long-range transmission technologies), only OppNets achieve the desired coverage within the bounds of finite resources and limited budgets [9]. Based on the store-carry-forward (SCF) communication paradigm, data-bundles (or messages) are stored in device memory, carried from one point to another via user movement, and forwarded to another device (through available wireless communication interfaces such as Bluetooth and Wi-Fi) when they encounter each other (i.e., when the devices are within radio transmission range). In this manner, user devices act as routers that physically carry messages from their sources and eventually deliver them to their respective destinations in multiple hops. Not only does this eliminate costs related to procuring, installing, and maintaining network infrastructure (e.g., [10,11,12]), it also offloads infrastructure networks via direct device-to-device communication (e.g., [13,14,15]). These benefits have motivated various contributions including feasibility studies with mobility datasets [11], spatial analysis [16], evaluation testbeds [12], experiments with Bluetooth Low Energy [17], and duty-cycling mechanisms for extending sensor lifetime [18].
1.1. Routing Unfairness in OppNets
Mtibaa and Harras [19] define fairness as the relative equality in the distribution of resource usage among neighbouring nodes in the network. A routing protocol is said to be absolutely fair if it subjects every node in the network to equal amount of burden, in terms of resource expenditure. The authors also ascertain that absolute fairness degrades the performance of OppNets. This can be explained by the “small world” nature of the network [20], in which relatively few devices (referred to as “popular nodes”) experience significantly more encounters than others [21,22], thereby causing large variances in routing abilities among nodes. Popular nodes often belong to very prominent individuals (e.g., politicians) or users that travel around more frequently than others (e.g., deliverymen).
Despite the trade-off between fairness and network performance, fair routing is important in order to ensure user collaboration. While users may allocate different amounts of storage space to the technology, their devices are roughly homogeneous [23] in terms of other core resources, such as energy and processing power. Hence, popular nodes are likely to expend their resources at much higher rates, which may leave their users dissatisfied. The risk is that such users may respond by withdrawing participation, and as Mtibaa and Harras’s [19] “popular nodes removal” experiment have shown, this will cause drastic degradation of network performance.
OppNet routing protocols are based on techniques that select relay nodes according to: similarity in movement patterns (e.g., speed) or contextual information (e.g., user occupation); social characteristics (e.g., node centrality); encounter-based properties (e.g., frequency of encounters); location-based information (e.g., location visiting frequency); or a combination of these. Unfortunately: prominent individuals often have higher contextual information similarity with others; only relatively few individuals possess high social connectedness; prominent individuals encounter a significantly higher number of people; and the number of individuals that visit many different locations is limited. Hence, these utilities are biased towards popular nodes and makes OppNet routing protocols too unfair for sensed data collection.
Ensuring fairness in OppNets for sensed data collection and guaranteeing acceptable throughput is a challenging task. To be suitable for sensed data collection, fair routing solutions need to cope with relevant characteristics of urban environments, such as high degrees of spatial locality [16,24]. Since encounter opportunities between nodes from different geographical regions are limited under higher degrees of spatial locality, forwarding utilities become more biased towards popular nodes. Under these conditions, fair routing solutions require forwarding utilities that can maximize the contribution of less popular nodes in order to relieve the burden on popular nodes. It is also important for nodes to be able to compare their burden when they encounter each other in order to make fair routing decisions. This requires a means of determining and measuring node burden from locally available information. Apart from being distributed, such burden measures also need to cope with the highly dynamic nature of the network.
Unfortunately, the existing fair routing solutions are unaware of spatial locality, lack forwarding utilities that fully utilize less popular nodes and rely on scenario-specific burden measures. As a result, fairness and throughput are degraded, especially in scenarios for sensed data collection. Therefore, with respect to achieving fairness without compromising achievable throughput in sensed data collection scenarios, the aforementioned issues bring about the motivating questions of this paper, which are as follows:
- How to design a forwarding utility that can increase the contribution of less popular nodes in the presence of spatial locality?
- How to determine a measure that can locally quantify the burden on nodes through non-scenario-specific means?
- How can fairness be improved with the forwarding utility and the burden measure without reducing delivery guarantees?
1.2. Authors’ Contribution
Since OppNets rely on users to contribute with the resources on their devices to routing, their willingness to participate is crucial for the success of sensed data collection. The issue of OppNet routing protocols subjecting most of the routing duties to only few nodes in the network threatens user willingness to participate and thereby motivates us to address the problem of routing unfairness. This paper contributes in the following aspects:
- Supported with simulation experiments, we investigate the impact of spatial locality inherent to user movement in sensed data collection scenarios on OppNet routing protocols and also identify drawbacks of existing burden detection approaches. Then, from our findings, we suggest design guidelines that need to be considered when addressing fair OppNet routing for collecting sensed data in real-world scenarios.
- Next, we follow our design guidelines to propose the Fair Locality Aware Routing (FLARoute) technique, which, to the best of our knowledge, presents the first routing approach that considers the impact of spatial locality inherent to user movement in urban environments. FLARoute implements a fair forwarding utility and distributed mechanisms, namely Relative Burden Detection (ReBurD) and Maximum Burden Estimation (MaxBE). Fair forwarding decisions are made with the Fair Locality Aware Forwarding (FLAFord) algorithm, which introduces a new burden balancing mechanism. Through simulation experiments, we verify that FLARoute can be incorporated into relevant routing protocols to improve fairness and throughput under conditions that compromise the performance of existing fair routing solutions.
1.3. Organization of the Paper
The remainder of this paper is organized as follows. Section 2 presents the problem background. In Section 3, we propose a routing technique that implements a forwarding utility to increase the range of suitable relay nodes. Also implemented are two distributed mechanisms for facilitating fair routing decisions, which determine node burden and estimate the maximum burden among neighbouring nodes in the network. The routing technique also implements a forwarding algorithm and a burden balancing mechanism for making fair routing decisions with available information. In Section 4, we compare the performance of our proposed routing technique with existing solutions through simulation experiments. Finally, Section 5 concludes this paper and discusses future work.
2. Problem Background
In this section, we present a background on the current problems in realizing fair routing solutions for sensed data collection. Section 2.1 first presents the need for routing fairness in OppNets for sensed data collection. Next, Section 2.2 studies different OppNet routing approaches with respect to unfairness under different degrees of spatial locality. This is followed by a brief overview on related solutions for improving routing fairness in Section 2.3 and their limitations when considered for sensed data collection in Section 2.4. From the findings, Section 2.5 concludes this section with a set of fair routing guidelines for collecting sensed data with OppNets.
2.1. Need for Routing Fairness in OppNets
The resource-constrained nature of portable handheld user devices has prompted various studies in OppNet routing. Mechanisms have been proposed to detect and relieve congested devices [25], cooperation of selfish users is motivated by incentive schemes (e.g., [26,27]), and energy awareness (e.g., [28,29]) considers the battery level of devices during routing. Despite these studies, failure to address routing unfairness leaves a gap to be filled in OppNets for sensed data collection. This section justifies the need for routing fairness and the role it plays by presenting how fair routing complements congestion control, how it can enhance incentive schemes and how it augments energy aware algorithms.
2.1.1. Fair Routing as a Complement to Congestion Control
In literature, ensuring routing fairness in SCF-based networks is often confused with, and at times may be analogous to, congestion control. Generally, congestion occurs when resource demands exceed available capacity, and may be detected by network capacity (i.e., rate of message generation and delivery), buffer occupancy on nodes, and message drop rates [25]. However, since traditional networks do not consider energy a scarce resource, applying such congestion control mechanisms may not always achieve fairness in OppNets. While congestion control attempts to prevent overloading (or excessive buffer occupancy), solutions aimed at ensuring fairness focus on achieving a balance between user satisfaction (i.e., a fairly even distribution of burden, in terms of resource utilization, among nodes) and throughput. In order words, a fair routing technique focuses on achieving acceptable network performance with a fairly equal rate of resource consumption among nodes, irrespective of the level of congestion (in terms of network capacity, buffer occupancy, or message drop rate). Hence, most fair routing solutions combine a forwarding utility that allows a wider range of relay nodes with a congestion control mechanism.
2.1.2. Fair Routing as an Enhancement for Incentive Schemes
Due to resource constraints on portable handheld devices, incentive schemes are designed to motivate participation of selfish users. Nevertheless, it is still unlikely that the few over-burdened users will be unselfish, particularly when their devices are frequently running low on energy. The logical solution is to ensure fairness by distributing the burden more evenly among the users without sacrificing throughput. Also, the idea of incentives to motivate user participation (especially in OppNets for sensed data collection, where users do not have any additional benefits from contributing their resources to the network) is more effective under a fair routing protocol. Since incentive schemes reward involvement in storing and forwarding messages, users of less popular nodes may be entitled to significantly less incentives. Consequently, the rewards may not be worth their participation, as energy is also expended when the wireless communication interfaces (and GPS in some cases) on their devices remain turned on. With more fairness, routing responsibilities are more evenly distributed among nodes, thereby allowing users of less popular devices more contribution and incentives. Hence, the fairer the routing protocol, the more effective incentive schemes become.
2.1.3. Fair Routing as an Augmentation for Energy Awareness
Energy level is an essential indicator of a node’s ability to partake in routing. With regards to routing, energy awareness ensures that nodes have sufficient energy before entrusting them with routing tasks. However, it is important to note that routing is not the only source of energy consumption on nodes. Nowadays, portable handheld devices are used for numerous energy consuming purposes including communication, entertainment and task-oriented activities. The implication is that energy awareness cannot actually ensure fair routing in OppNets. This is because nodes with higher energy levels are more likely to be selected as forwarders, despite: (i) being already overused by the network (for instance, A, a popular device that is frequently recharged, is prone to becoming even more burdened); or (ii) their inability to contribute (e.g., B, a device with higher battery level but less chances of delivering the message). This may either be worrying to users or degrade throughput. Fair routing not only distributes resource utilization among networking nodes (thereby assuring the user that A would not be overused by the network whenever it is recharged), but is also tasked with ensuring that even less popular nodes (such as B) are able to contribute towards improving throughput. Therefore, fair routing augments energy awareness in OppNets.
2.2. Existing OppNet Routing Protocols for Sensed Data Collection
This section overviews the different categories of OppNet routing protocols and evaluates their performance (in terms of fairness and throughput) under different degrees of spatial locality through simulation experiments.
2.2.1. Overview of OppNet Routing Techniques
Many OppNet routing protocols have been proposed so far, ranging from those that require little or no knowledge about the network to more complex ones that utilize prediction approaches to improve overall network performance [30]. In order to cope with intermittent connectivity, the Epidemic [31] approach forwards messages to any encountered node that does not have a copy. Although relatively easy to implement, the performance of Epidemic depends on the availability of resources, which is limited in portable handheld user devices. Direct Transmission [32], on the other hand, keeps messages at the source until the destination is directly encountered. This approach is also relatively easy to implement, but is unsuitable for collecting sensed data to remote gateways. First Contact [33], another routing approach that is relatively easy to implement, forwards messages to the first available relay node, or randomly selects one from a group nodes within transmission range. Due to the criteria for selecting relays, messages are likely to remain buffered for long periods and may never progress towards the destination.
To find a balance between Epidemic and Direct Transmission, Spray and Wait [34] (SnW) allows only L copies of the message in the network. The source forwards copies of the message to any encountered node that does not have a copy, and retains the last copy until the destination is encountered. The Resource Allocation Protocol for Intentional DTN (RAPID) [35] extends Epidemic by obtaining knowledge of the global state of resources with an in-band control channel. These solutions may benefit OppNets due to their simplicity and ease of deployment. However, their major drawback is the lack of knowledge about the forwarding ability of encountered nodes. Furthermore, the performance of SnW may be scenario-specific under more realistic movement patterns, as it depends on a careful selection of L, while the highly dynamic nature of the network may cause RAPID to incur high costs from utilizing an in-band control channel.
The need to guarantee delivery without excessive resource consumption or utilizing in-band control channels brought about prediction techniques. This led to various means of obtaining knowledge from locally available information for predicting the progress nodes can make towards delivering messages [36]. Basically, messages are forwarded to relay nodes with higher forwarding utilities—a property that quantifies the progress a node can make towards the destination. Some routing techniques compute forwarding utilities from the number of encounters between nodes: the Probabilistic Routing Protocol using History of Encounters and Transitivity (PRoPHET) [37] forwards messages to nodes that often encounter the destination; the Improved Probabilistic Routing Algorithm (IPRA) [38] considers the encounter history of the node’s neighbours and the destination as well; and the Improved Spray and Wait (ISW) [39] forwards messages to nodes that have remained in contact with the destination for longer time slots.
Forwarding utilities can also be computed from how recently the destination was encountered: the Time Message System (TMS) [40] selects a relay if it had a more recent encounter with the destination; and the Optimal Opportunistic Forwarding (OPF) [41] derives this knowledge from the inter-meeting time with other nodes in the network. There are also strategies that predict future encounters between two nodes from the similarity of their movement patterns. MobySpace [42] forwards the message to a relay that has a more similar movement pattern with the destination.
Other routing techniques derive forwarding utilities from social network characteristics or contextual information. PeopleRank [43] selects relays that have a higher social rank. dLife [44] forwards messages to nodes that have a history of better social engagement with the destination. Bubble Rap [45] computes forwarding utility from node centrality between and within communities. The social context-based routing scheme, namely Context Information Prediction for Routing in OppNets (CiPRO) [46], utilizes contextual information (e.g., user information, such as email address, work and home address, occupation, mobility patterns, and communities they belong to; and node information, such as battery level and storage capacity) to make forwarding decisions.
Routing techniques have also been realized from a combination of two (or more) different approaches. Similar to SnW, Spray and Focus [47] (SnF) first forwards L copies of a message to any encountered node that does not have a copy. For the last copy, it selects a relay based on the time elapsed since the destination was encountered. The Sociability-Based Spray and Forward (SSF) scheme [48] also operates in two phases: in the first phase, relays are chosen based on the number of nodes they can encounter; and in the second phase, the choice is based on how often the destination is encountered. EpiPRo [49] switches from Epidemic to PRoPHET based on the hop count parameter of number of copies forwarded. The History-based Prediction Routing (HBPR) protocol [50] determines the forwarding utility of a node from the similarity of its movement history (such as location visits, time, and speed) with that of the destination. The Multi-layer Social Network based Routing (ML-SOR) approach [51] computes the forwarding ability of nodes from centrality, tie strength and link prediction.
2.2.2. OppNet Routing Protocols in Sensed Data Collection Scenarios
In this section, we perform simulation experiments with different routing protocols in order to investigate how existing routing techniques perform under different degrees of spatial locality. The protocols are Epidemic, PRoPHET, dLife, Bubble Rap, SnF and the Home Based Routing (HERO) algorithm [52], which divides the geographical area of the network into regions, and forwards messages based on the history of region visits. Our method of obtaining different degrees of spatial locality is by generating 3 different scales of the Helsinki scenario to depict relatively low, medium and high degrees of spatial locality. In order to achieve this, it is important that the resulting 3 scenarios are formed without changing essential encounter characteristics. Therefore, related factors such as node population and geographic area need to be varied proportionally. Another related factor is the distance between a source-destination pair. This is because the placement of the source and destination nodes impacts on network performance, especially when the distance between them is longer. Since the distance between source-destination pairs would be different for each of the 3 scenarios, it is very unlikely to maintain the same proportion across the 3 scenarios through manual selection and placement. In order to avoid bias, we utilize the “MessageEventGenerator” class in the Opportunistic Network Environment (ONE) simulator [53], which randomly selects the source and destination of each message based on a given creation interval, message size range and range of source/destination addresses.
To generate the three scenarios, the Helsinki simulation area in the ONE simulator is modified to obtain the three movement scenarios shown in Figure 1. The Helsinki simulation area is used to represent the medium scenario, the small scenario is represented by one of the four main districts in the medium scenario and the large scenario is artificially generated from the combination of 4 copies of the medium scenario. The scenarios, namely small, medium and large, correspond to low, medium and high degree of spatial locality, respectively. We vary the number of nodes for each scenario proportionally in order to leave the essential encounter characteristics unchanged.
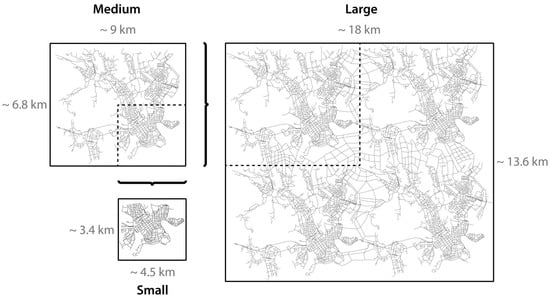
Figure 1.
Movement scenarios used for evaluating unfairness in opportunistic network (OppNet) routing protocols (partitioned by a grid, the small, medium and large scenarios consist of 1 region, 4 regions and 16 regions, respectively).
We assume an OppNet formed by mobile users in a city using smartphones or similar handheld devices equipped with GPS and a Bluetooth interface with transmission speed and range of 2 MBps and 10 meters, respectively. The free buffer space for routing-related tasks is limited to 10 MB, as users may not be willing to spend most of their storage space on behalf of the network. Users move according to the Working Day Movement (WDM) model [54]. Since WDM models daily movement routines in working days, a total simulation duration of 5 days is chosen, i.e., 1 day for warm-up (to ensure a complete generation of encounter and location history and community formation), 3 days for message generation and routing, and 1 day for cool-down (to allow every message delivery attempt). A message is generated every 10 to 15 min from a randomly chosen node (the source) to another randomly chosen node (the destination). The TTL parameter for each message is set to 24 h, as we intend for messages to be delivered during a 1-day period. Sensor data size and generation rates used in related studies (e.g., 36 bytes every 100 s, i.e., 1.296 KB per hour [16] and 30 bytes every 5 s, i.e., 21.6 KB per hour [55]) indicate that this choice depends on the sensor application. Our goal is not to account for the exact amount of burden, but to show that unfairness exists and how fair routing proposals address it. Hence, for simulating sensor applications involving delay-tolerant data, the message size is uniformly distributed between 10 KB and 15 KB.
Energy consumption for Bluetooth is according to the configuration settings in the module proposed by Silva et al. [56]. The initial energy for nodes is 4800 Joules, while energy consumption for receiving or sending messages is set to 0.08 mW/s. Since our interest is only on energy consumed due to forwarding decisions made by different replication techniques, we consider receiving and sending messages as the only sources of energy consumption. Hence, scan energy (i.e., energy consumed from device discovery), scan response energy (i.e., energy consumed from device discovery response), and base energy (i.e., energy consumed in idle state) are all set to 0. Enough initial energy is provided to ensure that nodes do not fail as a result of battery depletion during the simulation. The parameters used for the simulation setup are shown in Table 1. Unless stated otherwise, experiments for each result are conducted 10 times with different random seeds, in order to present the average with a confidence interval of 95%.

Table 1.
Simulation parameters for the small, medium and large scenarios.
For the routing protocols, SnF uses binary spraying, and the value of L is taken as 4, 6 and 8, for the small, medium, and large scenario, respectively. This choice is based on values that yield best overall performance from several trials. Community formation and centrality computation for Bubble Rap is in accordance with the K-Clique and cumulative window algorithms given by Hui et al. [45], while dLife considers 24 daily samples (i.e., 1 h each) as mentioned by Moreira et al. [57]. HERO maintains a routing table of 7 days with 24 periods each. Experimenting with the routing protocols, we observe that they all subject a few set of nodes to most of the routing duties. The results in Figure 2 show that only about 2% to 10% of the total node population partake in forwarding up to 25% of the entire number of messages generated in the network. For the purpose of evaluation, these nodes are termed “central nodes”, while the remaining nodes are termed “other nodes”.
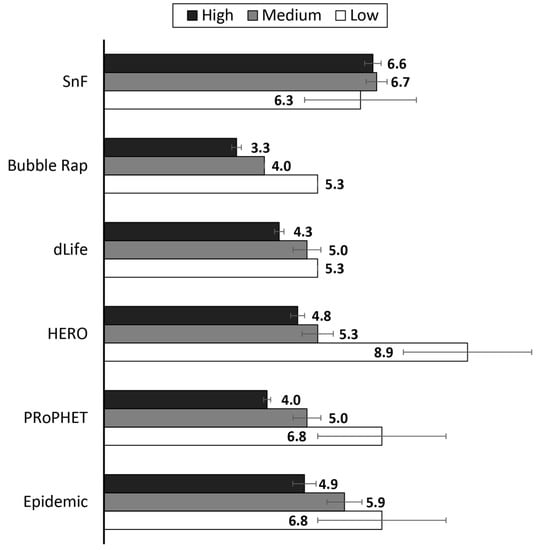
Figure 2.
The percentage of nodes that partake in forwarding up to 25% of the total number of messages in the network under low, medium, and high degrees of spatial locality.
Fairness, on its own, would not be worth the effort (considering the adverse effect the introduction of fairness may have on throughput [19]), unless it reflects on the expenditure of some resource, in this case energy. Since popular nodes are more involved in routing, they also consume more energy. The idea is that, reducing the significant gap between the energy consumption on these set of nodes will increase user satisfaction [19]. So that for fair routing, the difference in energy consumption on neighbouring nodes should not be too large. Hence, we study the impact of unfairness on popular nodes from the perspective of energy consumed—which is the percentage of initial energy expended by the end of the simulation. To better understand the extent of unfairness in the routing protocols, we record the average percentage of initial energy consumed on the central nodes and the other nodes in Figure 3. For all the routing protocols, the central nodes consume at least three times as much energy as the other nodes under the different degrees of spatial locality.
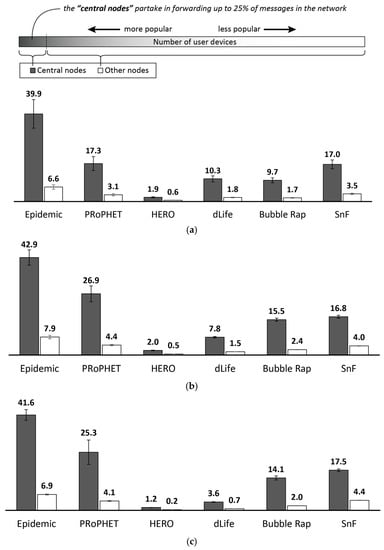
Figure 3.
The average percentage of initial energy consumed on the central nodes and the other nodes under (a) low locality; (b) medium locality; (c) high locality.
The results in Figure 3 can be translated to a metric that shows the distribution of energy consumption among the two sets of nodes. The metric, denoted by α ∈ [0, 1], is termed energy distribution, which we define as the ratio between the average percentage of initial energy consumed on the other nodes and the average percentage of initial energy consumed on the central nodes. The energy distribution for each routing protocol is shown in Figure 4. Higher values such as those of HERO and SnF denote more fairness (i.e., less difference between the energy consumed on the two set of nodes), while lower values denote less fairness. It is noticeable from the figure that all the routing protocols have relatively low energy distribution values. This is due to large differences between the energy consumption on the two sets of nodes.
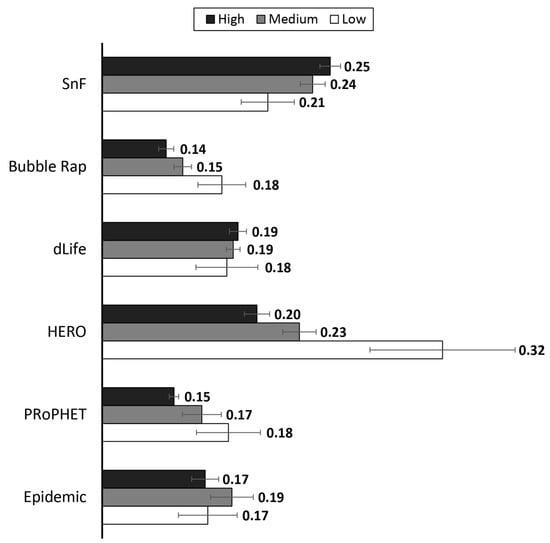
Figure 4.
Energy distribution (α) under low, medium and high degrees of spatial locality.
Overall, SnF records the highest energy distribution, with the central nodes consuming only about four times as much energy as the other nodes under the different degrees of spatial locality. By greedily spraying message copies, nodes are selected as relays irrespective of their forwarding ability. This distributes the task of finding more suitable relays across a wider range of nodes. Also, energy distribution increases with spatial locality since the chosen number of message copies to spray is increased. In real-world implementation, however, determining the number of copies to spray may require knowledge about global network parameters (e.g., total number of networking nodes). Also, further uncertainties are introduced under realistic human movement patterns that demonstrate high degrees of spatial locality.
The relatively high energy distribution demonstrated by HERO under low locality is mainly due to more movement across different geographical regions when spatial locality is low. Since HERO infers the forwarding ability of nodes from their frequency of regional visits, more nodes moving across more regions leads to a less variation in forwarding utilities, hence more fairness. However, as spatial locality increases and nodes visit fewer regions, the few nodes that move across many regions are often selected as forwarders and energy distribution reduces. Next is dLife, which is able to reduce energy consumed from failed transmission attempts through a utility function that somewhat minimizes the effect of short-lived encounter durations by considering levels of social interaction among nodes. This takes PRoPHET behind dLife in medium and high locality—a reason failed transmission attempts may need to be considered a burden on nodes.
With Epidemic, energy consumption is distributed poorly between the central nodes and the other nodes. Epidemic nodes consume the highest amount of energy under each scenario, with the central nodes consuming up to six times more than that of the other nodes. This high rate of energy consumption on the central nodes is mainly due to failed transmissions that result from attempting to transmit buffered messages during each encounter. Although a general issue across the routing protocols, the effect is more pronounced in Epidemic since the central nodes experience more encounters and attempt to transmit every message in their buffer whenever there is an encounter. Finally, Bubble Rap has the lowest energy distribution. The energy consumption on the central nodes in Bubble Rap is about five, six and seven times that of the other nodes under low, medium, and high locality, respectively. This results in declining energy distribution as spatial locality increases.
The throughput (i.e., the fraction of messages generated at source nodes that were delivered) under low, medium and high degrees of spatial locality is recorded in Figure 5. All the routing protocols experience a significant drop in throughput when the degree of spatial locality increases. Increasing the degree of spatial locality from low to medium reduces throughput by at least 52% and further increasing the degree of spatial locality from medium to high reduces throughput by at least 71%. The maximum throughput under low, medium, and high degree of locality is less than 45%, 19% and 6%, respectively. The encounter-based protocols (i.e., SnF and PRoPHET) perform slightly better under the different degrees of spatial locality.
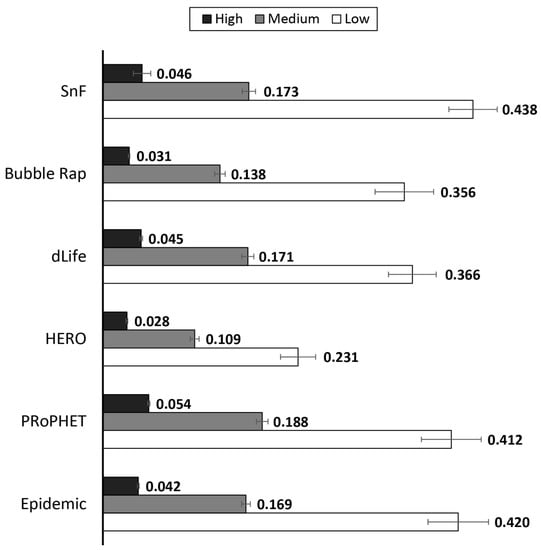
Figure 5.
Throughput under low, medium and high degrees of spatial locality.
2.2.3. Current State of OppNet Routing Protocols for Sensed Data Collection
Unfairness remains a general issue among the existing routing protocols and their approaches for computing forwarding utilities. Protocols such as PRoPHET and IPRA utilize forwarding utilities that are based on the frequency of node encounters, and therefore give higher preference to nodes that encounter the destination (or its neighbour) more often. This increases the likelihood of selecting popular nodes as relays since they experience more encounters. This also applies to routing protocols such as SnF, OPF, and TMS that compute their forwarding utilities from the time since the destination (or its neighbour) was last encountered. Exploiting node popularity (e.g., PeopleRank and dLife) or centrality (e.g., Bubble Rap) also steers messages towards popular nodes. Nodes carried by prominent individuals and users that move around frequently are often selected as relays with protocols such as CiPRO and MobySpace, since they exhibit more contextual and movement similarities, respectively. Being relatively fewer in population, these nodes often happen to be network bottlenecks. Inferring forwarding utilities from node location (e.g., [52,58,59]) also directs messages towards popular nodes. This is because nodes that regularly visit more locations and experience more encounters in the process are relatively few (e.g., HERO). The same can be said for protocols such as Epidemic and SnW that are not based on forwarding utilities. The reason is that unfairness in OppNets stems from the nature of human movement, and therefore, forwarding messages solely based on encounter opportunities presented by such movement tends to overburden popular nodes.
Regarding throughput, delivery guarantees are not only affected by fairness, but also by spatial locality inherent to user movement in sensed data collection scenarios. Under higher degrees of spatial locality, there are less neighbours that can make much progress towards delivering the message through the existing forwarding utilities. Higher spatial displacement between the source and destination nodes reduces the likelihood of meeting relay nodes that often encounter the destination or its neighbours. Under such conditions, node popularity or centrality may not span across the required number of regions to guarantee an encounter with the destination. Protocols that rely on frequency of location visits also face a similar situation due to only few users moving around more frequently. Utilizing similarity of node movement limits throughput as well, since the chances of encountering more suitable relay nodes are less under higher degrees of spatial locality. The approach for computing forwarding utility also has an impact on the achievable throughput in sensed data collection scenarios. Utilizing similarities in node movement patterns or social characteristics may reduce achievable throughput, since gateway nodes are neither mobile nor portray social characteristics. Also, relying on only frequency of location visits may not guarantee an encounter with the destination or its neighbours, as it depends on the span of the geographical area under consideration and coinciding visiting times. The lack of adequate contextual information on gateway nodes limits the applicability of context-aware approaches as well. Maintaining and updating history of encounters, however, can efficiently identify routing paths to gateway nodes [45], thereby making encounter-based routing protocols more suitable for sensed data collection.
In summary, unfairness is an issue with existing OppNet routing protocols and their performance under different degrees of spatial locality suggest that locality-awareness is necessary for realizing fair routing solutions that can guarantee acceptable throughput in sensed data collection scenarios. While encounter-based routing protocols are more applicable for sensed data collection in terms of delivery guarantees, additional mechanisms are required to improve fairness under higher degrees of spatial locality without degrading throughput. Next, we briefly overview existing routing solutions for addressing the issue of unfairness in OppNets and also present their limitations for sensed data collection.
2.3. Existing Solutions for Improving OppNet Routing Fairness
Solutions addressing the issue of unfairness in SCF-based networks include FairRoute [23], the Context Aware Forwarding Algorithm (CAFÉ) [60], the Fairness-based Opportunistic Networking (FOG) framework [19] and Congestion Control with Adjustable Fairness (CCAF) [61]. FairRoute’s idea is to allow less popular nodes to find alternative routes by considering long-term interactions, while directing traffic towards nodes with less buffer occupancy. The forwarding utility is based on an aggregated interaction strength between nodes, indicating the frequency of long-term interactions and also accounting for spurious bursts of activity. In order to distribute traffic among nodes, a queue control mechanism forwards messages to nodes with equal or less queue length.
CAFÉ favours nodes that are able to receive and retain messages. A congestion mechanism distributes load away from popular nodes by prioritizing nodes with a higher percentage of free buffer space. The forwarding utility combines a smoothed degree of centrality, a filtered common neighbour metric, and the interaction strength between a node pair. The smoothed degree centrality increases the size of centrality subsets, thereby distributing load more evenly. This reduces the likelihood of sending messages to nodes with higher buffer occupancies. On the other hand, message custodians with higher buffer occupancy are allowed a wider range of relays to choose from.
In order to increase the uniformity of burden distribution, Mtibaa and Harras’s [19] forwarding rule considers nodes with slightly less rank (i.e., forwarding utility). Burden is perceived as the number of messages a node can carry. The authors introduce FOG, a framework to ensure a balanced efficiency-fairness trade-off with low overhead. FOG consists of two algorithms, namely Proximity Fairness Algorithm (PFA) and Message Context Fairness Algorithm (MCFA), and selects a suitable one based on network properties. PFA forwards messages to relays with higher rank if their burden does not exceed the relative average. Since this may overburden popular nodes and cease to utilize them for certain periods, MCFA aims to maximize the overall satisfaction of every user over time. With MCFA, popular nodes are utilized only when less popular nodes estimate that the former are surely needed. A node infers this need from a utility—simply referred to as need-utility here—derived from its rank, its free buffer space and the estimated number of message copies in the network, such that a higher need utility indicates a higher need to engage popular nodes. With this, a node forwards messages to higher-ranked relays only if its need-utility exceeds a threshold.
CCAF aims to achieve a tuneable efficiency-fairness trade-off by being as fair as possible and utilizing popular nodes wisely. Traffic load is derived from the ratio between remaining storage space and total storage capacity, thereby indicating more burden under higher buffer occupancy. In order to distribute the traffic load fairly, a message is forwarded only if the relay node has a much higher forwarding utility. Messages are forwarded to a relay node with almost equal forwarding utility as the message custodian only when the decision contributes to balancing the traffic load between them.
2.4. Limitations of Existing Fair Routing Solutions for Sensed Data Collection
Here, we present the limitations of the fair routing solutions under three subsections discussing their lack of locality-awareness, low utilization of less popular nodes and scenario-specific burden measures.
2.4.1. Neglecting the Impact of Spatial Locality
Most solutions assume throughput is not compromised after burden is distributed from popular nodes to less popular nodes. However, less popular nodes have less chances of delivering messages through encounter-based or social-based utilities alone [19]. This is due to less popular nodes being less socially-connected in the network, which is worse when coupled with the effects of spatial locality inherent to node movement in sensed data collection scenarios [55]. Concepts of spatial locality include high likelihood of regularly visiting only one or few regions [55,62,63,64,65] and traveling relatively shorter distances [66,67]. Therefore, unlike popular nodes (which Mtibaa and Harras [68] term as “MultiHomed” nodes, e.g., devices carried by postmen and campus bus drivers that are more suitable to disseminate messages across sub communities), the movement of less popular nodes is more confined to a local region, thereby limiting encounter opportunities with nodes from other regions. Hence, throughput is degraded since opportunities to forward messages to more suitable relay nodes are missed for the sake of maintaining a fair distribution of burden.
FairRoute is based on the idea that a diversity of routes can be found through contact and social networks. Therefore, when popular nodes have high queue lengths, less popular nodes rely on the forwarding utility (i.e., nodes that have long-term interactions with the destination) to find alternative routes. Under higher degrees of spatial locality, however, less popular nodes have less encounter opportunities as their movement is often restricted to smaller geographical areas. Since less popular nodes form the majority of the node population, most nodes may not be able to encounter more suitable relays on time with this forwarding utility, and may still rely on popular nodes to carry messages across multiple regions.
The metrics from which CAFÉ’s forwarding utility is derived (i.e., smoothed locally computed degree centrality, a filtered common neighbour metric, and interaction strength between a node pair) are biased towards popular nodes, especially under higher degrees of spatial locality. In such scenarios, the diversity of routes that may exist for less popular nodes are unlikely to extend across multiple regions through centrality and social ties alone. CCAF modifies the existing forwarding utility to allow messages to be forwarded only when the relay presents a much higher forwarding utility. For similar reasons as FairRoute’s approach, less popular nodes may not be able to make much progress under high degrees of spatial locality.
Unlike the typical rule that forwards messages when a relay presents a higher forwarding utility, FOG permits messages to be forwarded to slightly lower-ranked relays. It acts as a one-way filter that only allows messages towards slightly lower-ranked nodes. Hence, when the burden on popular nodes is high, messages are directed towards nodes with decreasing forwarding utility. This may not significantly degrade throughput under low degrees of spatial locality. Under higher degrees of spatial locality, however, achievable throughput is compromised since lower-ranked nodes cannot make enough routing contributions due to less encounter opportunities.
2.4.2. Unsuitable Forwarding Utility for Less Popular Nodes
It is important to note that, without providing less popular nodes with an alternative means to contribute in routing, directing messages towards them hardly improves fairness (although less popular nodes can contribute to an extent through a transitive property [37,47] or by aggregating nodes’ context parameters [69], this is unable to fully utilize their potential and also fails to completely evade the popular nodes since their popularity can still be perceived over multiple hops in the point-to-point communication model, in which destinations are identified by their ID, especially under high degrees of spatial locality). Without such means, less popular nodes will receive more than they can send. Besides frequent buffer overflows and throughput degradation, routing may still be unfair based on the following rationale: receiving rates kept equal, less popular nodes will do less sending and thereby consume less resources, while popular nodes from which the messages are being received continue to do more sending. Therefore, increasing the flow of messages towards less popular nodes without providing them with a suitable forwarding utility (i.e., one that requires minimal involvement from popular nodes to deliver messages) leaves no significant impact on fairness and compromises achievable throughput instead. Such approaches rather reduce fairness in scenarios characterised by high degrees of spatial locality.
2.4.3. Scenario-Specific Burden Measures
Another crucial aspect of ensuring fairness is the ability to determine the burden on nodes. The existing solutions infer node burden from buffer occupancy. Unfortunately, higher buffer occupancy may not always mean higher burden, and vice versa. The three main reasons that bring about this scenario-specific performance are as follows:
A. Changes in Data Traffic
The first reason revolves around the differences in sending and receiving abilities of popular nodes and less popular nodes. Popular nodes are likely to have a higher buffer occupancy most of the time, since they receive more messages. However, this is assuming that a steady rate of message generation is maintained throughout, for which there is no guarantee. At the event of a drop in the rate of message generation (e.g., after traffic bursts), popular nodes are able to send more messages and free their buffers at higher rates due to higher number of encounter opportunities. In such scenarios, experiments [70] show that existing solutions may bring about false positives on less popular nodes: a higher buffer occupancy on less popular nodes will be wrongly translated as higher burden, when they have done less transmissions (i.e., sending plus receiving) and consumed less energy.
B. Unequal Buffer Capacities
The second factor that may lead to a scenario-specific performance is due to unequal buffer capacities on nodes. Although the resources on portable handheld devices are roughly homogeneous in terms of energy and processing power, the amount of storage space users may be willing to allocate to the technology could be motivated by the benefits they derive from incentive schemes. Unfortunately, allocating different amounts of storage space may bring about false negatives on nodes with higher buffer capacity. Suppose two nodes, A and B, with buffer capacity of 100 MB and 10 MB have a buffer occupancy of 20% and 80%, respectively. This means that A and B have 20 MB and 8 MB of their buffers occupied, respectively. While A may have actually expended more energy in sending and receiving messages than B, most existing solutions will identify a lower burden on the former. For instance, with CCAF, which considers traffic load (i.e., burden) as the ratio between remaining storage and total storage capacity, nodes with more buffer capacity will be subjected to more burden. Similarly, by directing messages towards nodes with less buffer occupancy, CAFÉ will subject nodes with more buffer capacity to unfair treatment.
C. Dynamic User Behaviour
The third factor that may cause a scenario-specific performance is dynamic user behaviour, i.e., the existing burden measures can lead to unfair routing decisions depending on user behaviour. Consider a scenario in which device C, a popular node, has partaken in more routing tasks than less popular nodes. In order to conserve the remaining power on C, the user temporarily withdraws from the network by turning off the wireless communication interface. Hours later, the user finds a power outlet and recharges C. By the time the user re-joins the network, most of the messages in C’s buffer have been dropped due to TTL exhaustion. Upon encountering nodes that have taken part in less routing tasks, messages are still forwarded to C since its buffer occupancy suggests less burden. In actual sense, however, subjecting C to more burden is unfair as it has more routing contributions that are not being indicated by its buffer information.
2.5. Fair Routing Guidelines for Collecting Sensed Data with OppNets
Collecting sensed data with OppNets is mainly intended for Smart City scenarios. As learned from Section 2.4, the existing fair routing techniques are not designed to cope with the characteristics of these scenarios. Hence, there is need to adapt fair routing techniques to achieve a more even distribution of burden among nodes without degrading network performance. We suggest the following guidelines regarding fair routing for collecting sensed data with OppNets:
- An economical network model utilizes static gateway nodes, which are basically routers deployed in popular locations that allow sufficient encounter opportunities with user devices. Hence, the approach for computing forwarding utilities should be able to efficiently determine routing paths to destination nodes that are characterised by lack of mobility, limited social characteristics and inadequate contextual information.
- Gateway nodes are likely to be relatively few in order to minimize procurement, installation and maintenance costs, as well as maintain a manageable level of complexity. Due to their sparse distribution, design assumptions should be in accordance with the concepts of spatial locality inherent to user movement. Since the strength and reliability of social bonds and encounter-based relationships tend to reduce with distance, related metrics may not always perform as expected. Also, achieving acceptable fairness and throughput may require messages to traverse more than the usual number of hops to arrive at more distant destinations.
- The forwarding utility should be less biased towards global popularity, thereby allowing contribution from a wider range of nodes. For instance, the forwarding utility could be designed so that the encounter-based popularity of nodes cannot be perceived beyond H hops, where H represents a relatively small number. This ensures that the forwarding utility of a popular node is not always higher than that of a less popular node, unless the former is within H hops from the gateway.
- While allowing a wider range of relay nodes, the forwarding utility should also be able to maximize the contribution of less popular nodes. This requires knowledge about human movement, since less popular nodes may not have strong social ties or encounter-based relationships with gateways nodes. For instance, the regularity embedded in node movement could be exploited to carry messages closer to locations where more suitable relay nodes are likely to be encountered.
- During an encounter, routing decisions are made by comparing information about the nodes in contact. Knowledge about the relative burden on nodes is therefore necessary to make fair routing decisions. While this knowledge is mostly inferred from buffer information, conditions such as changes in data traffic, unequal buffer capacities and dynamic user behaviour may lead to misinterpretations. Hence, in order to ensure fairness under different network conditions, burden should be determined from properties that are directly related to resource consumption on nodes.
In the next section, we follow these guidelines to propose our routing technique, namely FLARoute.
3. FLARoute: Fair Locality Aware Routing
Achieving a balance between routing fairness and network performance requires minimizing the use of popular nodes through the maximum utilization of less popular nodes in a manner that does not incur significant degradations in throughput. This requires exploiting the regularity embedded in node movement to design a forwarding utility that reflects a node’s potential to be part of a series of relays that form a path to the destination through time-separated links. For instance, one of the concepts of spatial locality is that users regularly visit only one or few regions, and these often correspond to where their home or workplace is located [66,71]. It is possible to exploit this regularity to increase the chances of finding less popular nodes that can carry messages progressively towards the destination’s location in multiple hops. Although noticeable delays may be incurred in the process, it is preferred to degrading throughput, as long as the delay is within an acceptable range with respect to the application scenario. A suitable means of identifying the burden on nodes without using buffer occupancy is also required. As discussed in Section 2.4.3, relying on buffer occupancy alone may lead to scenario-specific performance, as fluctuations in data traffic, variations in buffer capacity and dynamic user behaviour may cause over-burdened nodes to either go undetected or be wrongly identified as under-burdened nodes. In this section, we present FLARoute, and tackle the following points in the process:
- A forwarding utility that can assign forwarding responsibilities to nodes according to their spatial connectivity, in order to allow more nodes to participate in routing even under higher degrees of spatial locality;
- A non-scenario-specific means of identifying the burden on nodes, whose performance is not degraded by fluctuations in data traffic, variations in buffer capacity and dynamic user behaviour;
- A mechanism that can maximize the participation of less popular nodes by allowing them to forward messages with minimum involvement from popular nodes, especially when the latter is over-burdened; and
- A forwarding algorithm that makes fair forwarding decisions with the available knowledge.
By addressing these points, FLARoute is able to achieve the features shown in Table 2.

Table 2.
Solutions for improving OppNet routing fairness, their main features and the novelty of FLARoute.
3.1. Overview of FLARoute
FLARoute is focused on increasing routing fairness in encounter-based routing protocols without significant degradations in throughput. The basic idea behind FLARoute is as follows. Popular nodes experience the highest number of encounters, thereby subjecting them to relatively higher burden and making them network bottlenecks. Although popular nodes contribute significantly to routing, the possibility of achieving significant fairness lies in the ability of less popular nodes to forward messages without the aid of popular nodes. Hence, FLARoute aims to achieve fairness without compromising throughput by sparingly utilizing nodes prone to overburden while maximizing the participation of less burdened nodes. This requires nodes to: determine more suitable relays with a fair forwarding utility; locally determine the burden on them without using buffer information; be able to know how their burden compares with those of neighbouring nodes; and forward messages accordingly. Therefore, the task of achieving fairness with acceptable throughput can be divided into four subtasks:
- Determining a fair forwarding utility that can allow less burdened nodes to forward messages with minimal requirement of popular nodes;
- Determining and keeping account of the relative burden incurred from forwarding messages;
- Estimating the maximum burden on neighbouring nodes; and
- Forwarding messages with the fair forwarding utility and making decisions based on available burden information.
Phase 1. As shown in Figure 6, the subtasks are addressed in four phases. The first phase is concerned with computing the fair forwarding utility, namely PoiUtility. PoiUtility is determined from the combination of an existing encounter-based forwarding utility and a location-based forwarding utility. Basically, the location-based utility is determined from geographical closeness to the location of the destination node, while the encounter-based utility maintains encounter history of only nodes that share the same point-of-interest (POI). Fairness is increased by selectively maintaining encounter history of encountered nodes, since the popularity of nodes is not spread across multiple hops. Due to the limited amount of encounter information on nodes, messages are first forwarded to nodes moving towards the destination’s location through the location-based utility. When nodes whose POI corresponds to the destination’s location are encountered, messages are then forwarded based on the encounter-based utility. This approach allows less popular nodes to contribute in routing as well.
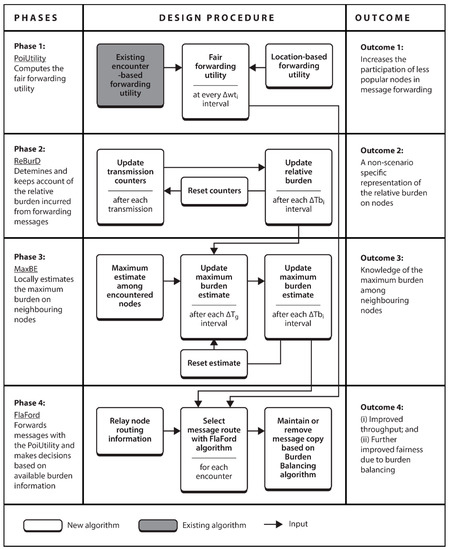
Figure 6.
Functional block diagram of Fair Locality Aware Routing (FLARoute).
Phase 2. The second phase is focused on locally determining the burden incurred in forwarding messages and keeping record of it. The major challenge in this phase is how to increase and decrease burden according to node contribution, without relying on buffer information. To address this, we propose ReBurD, a mechanism that keeps account of message transmissions to determine the incurred burden. With ReBurD, a node increments counters each time it receives or sends a message on behalf of others. The relative burden for the node is determined at the end of a fixed time interval, after which the counters are reset. This allows a non-scenario-specific representation of node burden without utilizing buffer information.
Phase 3. The third phase is concerned with locally estimating the maximum burden on neighbouring nodes in order to make fair routing decisions. Burden estimates are embedded in summary vectors and exchanged when two nodes encounter each other. Through this, a node is able to update its maximum burden estimate when an encountered node presents a higher estimate. The main challenge in this phase is how to maintain a local estimate that is fairly close to the global value at all times. To achieve this, we propose MaxBE, a mechanism that keeps account of the maximum relative burden on encountered nodes with which it periodically estimates the maximum burden on neighbouring nodes. Nodes are able to make fair forwarding decisions with this estimate.
Phase 4. The fourth phase is tasked with making forwarding decisions with the knowledge accumulated from the first three phases. In order to ensure fairness and delivery guarantees, messages are sent through two types of routes: one that presents a higher change of delivery, regardless the level of burden on relay nodes; and one that can make progress through less burdened nodes. To reduce the risk of overburdening popular nodes, the number of times a message is forwarded through the former route is kept minimal, while multiple copies of the message may be forwarded through the latter route. Since more transmissions are likely to increase the burden on nodes, a burden balancing mechanism is also proposed in this phase, to relieve over-burdened nodes of messages traversing the latter route.
The following assumptions are made in the design of FLARoute: (i) each node is a smart mobile device and is equipped with a Global Positioning System (GPS); (ii) nodes are collaborative and willing to participate in routing; and (iii) source nodes have the necessary information for destinations, which are node ID and location-based information in this case.
3.2. FLARoute Design
This section details the design of the phases described in Section 3.1, and is organised as follows. Section 3.2.1 presents PoiUtility, a fair forwarding utility that allows more number of less popular nodes to contribute in improving throughput. Section 3.2.2 proposes ReBurD, a mechanism that locally identifies the burden on nodes without utilizing buffer information. With the identified burden, Section 3.2.3 proposes MaxBE, a distributed mechanism that estimates the maximum burden on neighbouring nodes in the network. Section 3.2.4 proposes FLAFord, an algorithm that makes forwarding decisions with the available information. A burden balancing mechanism is also proposed to relieve nodes of excess burden incurred in this phase.
3.2.1. Phase 1: Computing the Fair Forwarding Utility
Phase 1 introduces PoiUtility, which is elaborated in [72]. , the PoiUtility of a node for a destination , is given by Equation (1), where and represent the encounter-based and location-based forwarding utilities, respectively, and the constants and are non-negative parameters of the forwarding utility, such that and their sum equals 1. Encounter history is only maintained between nodes that have a mutual POI (i.e., either home or office location), and in absence of a transitive property, location-based information—which is obtained via GPS traces collected at fixed intervals – is used to forward messages closer to the location of their destination. Due to spatial locality, forwarding the message closer to the destination’s location increases the likelihood of finding relay nodes that have encounter history with the destination.
Unlike encounter-based forwarding utilities reinforced with a transitive property that epidemically extends the visibility of node popularity over multiple hops, the adopted location-based utility allows a more even contribution among nodes. The choice of relay nodes with the location-based utility depends on their spatial closeness to the destination—a property that relies more on routine than popularity. That way, the potential of less popular nodes can be fully utilized through their ability to deliver messages in multiple hops, thereby making routing less biased towards popular nodes.
3.2.2. Phase 2: Determining Relative Burden
As discussed in Section 2.4.3, focusing on the buffer alone may not achieve the desired level of fairness, because buffer occupancy is not a good indicator of how much burden a node has been subjected to. Inferring the burden on nodes from energy consumption may also come to mind—recall that in order to improve throughput, energy-aware routing solutions consider energy level when selecting suitable relay nodes (i.e., they infer the reliability of relay nodes from available energy), rather than (achieving fairness by) making routing decisions according to the burden routing itself has impacted on the nodes (cf., Section 2.1.3). However, unless there is a means of monitoring the portion of energy expended in routing, energy alone (in terms of overall energy consumption or residual energy) is not a good indicator of node burden as well. In real-world implementation, the chances that a device is low on battery due to other applications besides routing cannot be ruled out. Therefore, inferring burden from buffer information or energy level is only suitable in controlled environments such as experimental simulations. To prevent bias in performance evaluation, simulation environments can be controlled to assume that device resources are consumed through participation in the network alone. Likewise, each node could be assigned equal buffer size. This is, however, not true in real-life, hence should not be used as a basis of designing routing solutions intended for real-world implementation. Therefore, determining the burden on nodes through buffer information limits existing solutions from guaranteeing fairness in realistic scenarios, especially when other resource constraints (e.g., energy and computation) are considered.
The mechanism proposed here, namely Relative Burden Detection (ReBurD), allows a node to locally determine its relative burden (i.e., the burden on the node as compared with those on neighbouring nodes) from transmitted (i.e., received or sent) messages—Global ReBurD (GReBurD), a global version of ReBurD was earlier proposed in [70] for simulation and performance evaluation purposes. ReBurD maintains a counter for , received messages (excluding messages for which the receiver is the destination), and , sent messages (excluding messages for which the transmitting node is the source). , the burden at the end of every time slot (), is computed by Equation (2), where represents the burden in , the previous slot (if there was one, i.e., if ). After computing the burden, the counters are reset to 0 for the next time slot, . Note that without resetting the transmission counters, the burden on nodes do not change even after a long period of inactivity.
The relative burden at a given instant is used to make forwarding decisions. In that case, the instantaneous relative burden is also computed with Equation (2) (note that the counters are not reset until the current time slot is elapsed). Based on the proposed approach, the instantaneous relative burden on nodes increase as they continue to participate in forwarding. At the beginning of a new time slot, the instantaneous relative burden on nodes is reduced since the transmission counters are reset to 0. Hence, the choice of reflects the restoration experienced during rest periods, such as when a device is being recharged, as opposed to periods of high data traffic such as rush hours.
3.2.3. Phase 3: Estimating the Maximum Burden on Neighbouring Nodes
Knowledge about the maximum burden in the network allows nodes to make fair routing decisions accordingly. The maximum burden is the burden on the most burdened node among a node’s neighbours. Global knowledge is required to obtain a precise value at any given instant. However, due to the characteristics of OppNets, obtaining precise global knowledge at any given instant is impractical. Updating local knowledge on encounter basis is a possible solution, since a precise estimate in not required. However, this may result in undesirable overhead. To minimize the overhead incurred in acquiring and maintaining global information, the proposed mechanism, namely Maximum Burden Estimation (MaxBE), only requires each node to embed its maximum burden estimate in summary vectors. Ren et al. [73] show that embedding such information in summary vectors does not incur significant additional control overhead in most cases.
The neighbour burden estimate, denoted by , is first initialized to the local instantaneous relative burden on the node. After each time interval, , is updated if the instantaneous burden on the node is higher. is also updated if an encountered node presents a higher estimate. At the end of every time slot , , the maximum burden estimate, is computed by Equation (3). is then reset to 0 for the next time slot, .
For updating , the instantaneous maximum burden estimate is exchanged in summary vectors when two nodes encounter each other. In that case, the instantaneous estimate is also computed with Equation (3) (note that is not reset until the current time slot is elapsed). Since nodes estimate the maximum burden from encounters, the estimated value depends on the burden on neighbouring nodes. This is suitable for OppNets because users are satisfied by comparing themselves to their neighbours and acquaintances [19].
3.2.4. Phase 4: Fair Message Forwarding
With respect to improving fairness without compromising throughput, FLAFord, the algorithm for making forwarding decisions in FLARoute, tries to minimize the usage of nodes with higher burden, and provides delivery backup through less burdened relays. In general, whenever , a new message, is generated at the source, and needs to be routed to , its destination, FLAFord sends , the first copy of the message, through the “higher-utility path” and subsequent copies, each denoted by , through the “less-burden path”. A “burden balancing” mechanism further relieves more burdened nodes of messages sent through the less-burden path.
Higher-utility path and less-burden path. In order to maintain the throughput of the underlying routing protocol, messages are forwarded towards popular nodes. Unfortunately, such nodes may have higher relative burden. To account for fairness, such nodes are used sparingly by allowing them to forward only a single copy of each message (i.e., the message is removed from the buffer after it has been forwarded). Therefore, for each generated message , only one copy (i.e., the first copy), , is forwarded through the higher-utility path. Allowing popular nodes to forward only one copy of each message reduces the number of messages they need to transmit, thereby reducing their relative burden as well.
Definition 1 (Higher-utility path).
A node forwards to an encountered node the message if and only if .
Although forwarding a message through the higher-utility path (i.e., through nodes with higher popularity) promises higher delivery guarantees, allowing only a single copy through such path may result in message loss, especially during buffer overflows. This brings about the need to provide backup via less burdened nodes, that although may require more copies to guarantee delivery, can afford more transmissions due to their lower relative burden.
Definition 2 (Less-burden path).
A node forwards to an encountered node the message if either of the following holds true: (i) , where and are the instantaneous relative burdens on and , respectively, in , the current time slot; or (ii) , where is the instantaneous maximum burden estimate at , and is a percentage—we have taken as 20% as we consider burden below this value to be relatively low.
If the encountered node has a higher forwarding utility for the destination, the first condition considers its instantaneous relative burden before forwarding the message. This way, messages are forwarded to progressively less burdened nodes while increasing delivery guarantees. Note that with PoiUtility (cf., Section 3.2.1), there is a higher availability of relays satisfying this condition, since more number of nodes with relatively low popularity (or burden) are able to participate in routing. Therefore, what is required is a way to bypass nodes with relatively high popularity (or burden)—which has been provided by the first condition. We consider nodes whose relative burden is less than of the maximum burden estimate as “low burdened”. Hence, in the second condition, messages are forwarded to low burdened nodes, irrespective of their forwarding utility.
Burden Balancing. The burden on a node increases with the number of copies it forwards for each message in its buffer. FLAFord reduces the burden on “high burdened” nodes (i.e., nodes whose relative burden is greater than or equal to of the maximum burden estimate) by allowing them to forward fewer copies of a single message. Hence, based on the following burden balancing rules, a high burdened node may remove from its buffer a message that is taking the less-burden path, after a copy has been forwarded to a less burdened node.
Definition 3 (Burden balancing).
After a node forwards to a node , the former removes the message from its buffer if all the following conditions hold true: (i) , where is the overload threshold; (ii) ; and (iii) .
In the first condition, messages are only removed if the instantaneous relative burden exceeds an “overload threshold” that denotes when the burden actually matters and starts to reflect noticeably on energy consumption. In real-world implementation, the overload threshold can be taken as , where is the noticeable energy consumption and is the average energy expended per transmission (i.e., for either sending or receiving)—for , insights on device energy consumption and user concerns can be obtained from surveys. The second condition prevents low burdened nodes from participating in burden balancing (i.e., deleting messages from their buffer). Hence, low burdened nodes contribute more in forwarding messages that are taking the less-burden path than high burdened nodes. The third condition verifies that the message has been forwarded to a low burdened node, and can continue travelling towards the destination through the less-burden path. The forwarding decisions made by FLAFord are summarised in Algorithm 1.
| Algorithm 1 Making fair forwarding decisions with FLAFord | |||||
| Input: messages in ’s buffer , , , , , , | |||||
| Output: suitable relay nodes and respective messages | |||||
| 1 | foreach Input do | ||||
| 2 | if is then | ||||
| 3 | if then | ||||
| 4 | Insert into ; | ||||
| 5 | Remove from buffer; | ||||
| 6 | end | ||||
| 7 | end | ||||
| 8 | else | ||||
| 9 | if or then | ||||
| 10 | Insert into ; | ||||
| 11 | if and and then | ||||
| 12 | Remove from buffer; | ||||
| 13 | end | ||||
| 14 | end | ||||
| 15 | end | ||||
| 16 | end | ||||
| 17 | return ; | ||||
4. Evaluation
This section presents the evaluation methodology for FLARoute, the experimental results and the lessons learned.
4.1. Evaluation Methodology
We select CCAF, an existing fair routing solution which represents a most recent improvement and can also be easily incorporated into an existing encounter-based routing protocol. CCAF and our proposed FLARoute are each incorporated into PRoPHET. Then the results of both solutions are compared with network performance when running on PRoPHET alone. This allows us to observe the impact of our approach on addressing routing fairness, as well as gain insight on the performance of existing approaches. We also experiment with Bubble Rap, dLife, HERO and SnF, in order to observe the performance of existing routing techniques under high degrees of spatial locality.
For configuration settings, SnF uses binary spraying, and the value of is taken as 8, which yielded best overall performance from several trials. Community formation and centrality computation for Bubble Rap is in accordance with the K-Clique and cumulative window algorithms given by Hui et al. [45], while dLife considers 24 daily samples (i.e., 1 h each) as mentioned by Moreira et al. [57]. HERO collects a location sample every hour, and maintains up to 7 days record. Based on results from several trials with FLARoute, , the overload threshold, is taken as 40, is taken as 20%, while and are taken as 3 h and 6 h, respectively.
Since the performance of the routing proposals is evaluated through simulations, the mobility of nodes needs to portray realistic human movement properties. Although real-world traces represent actual movement scenarios, existing publicly available datasets are less suitable for evaluating fair routing for OppNets in Smart City scenarios due to: (i) the lack of realistic node density and encounter frequencies portrayed in city-wide scenarios; and (ii) the inability to change network properties such as node population and geographical area without interfering with the encounter opportunities between nodes. Hence, we resort to using WDM, which provides the desired level of flexibility and is also able to reproduce realistic properties of human movement.
For the remainder of this section, Section 4.1.1 presents the simulation set-up in the ONE simulator while Section 4.1.2 presents the metrics for evaluating the performance of FLARoute and the selected routing proposals.
4.1.1. Simulation Set-Up
In order to simulate a city-wide scenario that portrays a relatively high degree of spatial locality as compared with the Helsinki scenarios presented in Section 2.2.2, we utilize the Skudai simulation area, which as presented in Figure 7, roughly covers a 21 × 11 km2 terrain consisting of 32 districts. Static nodes are placed in popular locations to represent sensors and gateways in a city. Specifically, 64 source nodes are placed in home locations (representing sensors in residential areas) and along roads (for environmental sensors), while 32 destination nodes are placed in office and meeting spot locations (representing gateways in work places and shopping malls). The remaining 1253 nodes represent handheld devices carried by 1070 pedestrians, 118 bus drivers and 65 users that move in the background to simulate delivery men, police men and taxi drivers. Each source generates a message to a randomly-chosen destination on an hourly basis, resulting in a total of 4608 messages in the 3-day period. All other configurations are according to the settings in Section 2.2.2.
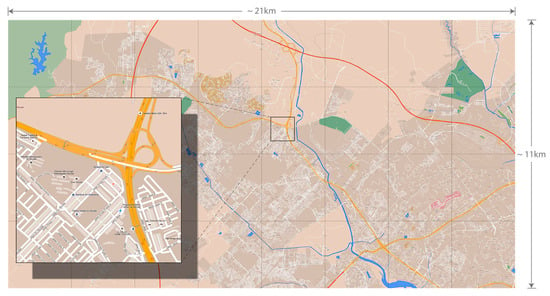
Figure 7.
The Skudai simulation area (map data provided by OpenStreetMap, 2015).
4.1.2. Performance Evaluation Metrics
This section presents the metrics, namely throughput, transmission overhead, average delivery delay, routing fairness and energy distribution, for the performance evaluation.
Throughput. As shown in Equation (4), throughput is the ratio between , the total number of messages successfully delivered at their respective destinations, and , the total number of messages generated. This signifies the message delivery efficiency of a forwarding algorithm, within assigned TTL.
Transmission overhead. As shown in Equation (5), the transmission overhead represents the average number of transmissions required to deliver a message copy, where is the total number of message transmissions, and is the number of times messages were delivered. This is equivalent to the cost of delivering messages with a forwarding algorithm, since every transmission consumes energy on user devices.
Average delivery delay. Delivery delay is the time elapsed (in seconds) between message generation and delivery. As shown in Equation (6), the average delivery delay is the mean delivery delay in the network, where and are the generation time and the delivery time of Message i, respectively. This gives an insight on how long it takes to deliver a message.
Routing fairness. Here, we elaborate the fairness metric [70] employed to measure routing fairness in this paper. The metric uses the distribution of node burden as a measure for fairness. Hence, a small variation between nodes’ burden results in more fairness than a large variation. To illustrate this, consider a scenario of six fictitious routing techniques, denoted by A to F. As shown in Table 3, four nodes, identified by n1 to n4, are subjected to different amounts of burden under each forwarding algorithm. The standard deviation from the mean burden on the nodes under a routing technique, , is then given as:
where is the total number of nodes, is the burden subjects on node , and is the mean burden for a node running on . Assuming that every node runs on the same routing technique, then , the maximum possible standard deviation for (i.e., the standard deviation from the mean burden if subjects only one node to all the burden—which is also the least fair scenario, such as algorithm F in Table 3) becomes:
where is the sum of the burden on every node. We then define the “unfairness” of as the ratio between and (cf., Equation (9)).

Table 3.
Six fictitious routing techniques for describing the working principle of the fairness metric and illustrating how it interprets fairness.
If subjects the same amount of burden on every node, in Equation (10) will be 100% (e.g., A in Table 3). Likewise, if only one node is subjected to all the burden in the network, will be 0% (e.g., F in Table 3). also decreases accordingly, the less evenly the total number of transmissions is distributed among the nodes (e.g., B to E in Table 3). Therefore, we use as a measure of the fairness of a routing technique in terms of the burden subjected on nodes.
Average energy consumption. Energy consumption (in Joules) is the amount of initial energy expended at the end of the simulation. As shown in Equation (11), the average energy consumption is the mean energy consumed by nodes in the network; where is the total number of nodes, and and is the initial energy and the remaining energy of Node , respectively. This gives an insight on how routing impacts on resource consumption.
Energy distribution. Another metric that gives an insight on the fairness of routing techniques is the energy distribution, , which we define as the ratio between , the average percentage of initial energy consumed on the other nodes, and , the average percentage of initial energy consumed on the central nodes (cf., Equation (12)).
4.2. Results and Discussion
This section presents and discusses the simulation results of FLARoute and the routing proposals selected for comparison in two parts that are detailed in Section 4.2.1 and Section 4.2.2. Section 4.2.1 first evaluates the proposals under high degree of spatial locality in the Skudai scenario described in Section 4.1.1. This includes: the percentage difference between MaxBE’s estimate of the maximum burden among neighbouring nodes and the actual maximum burden in the network; and results of FLARoute and the routing proposals based on the selected performance metrics. Next, Section 4.2.2 evaluates PRoPHET, CCAF and FLARoute in the Helsinki simulation area (i.e., the medium scenario) described in Section 2.2.2. This is followed by the impact of FLARoute and the choice of its parameters in Section 4.2.3.
4.2.1. Performance Evaluation in the Skudai Scenario
Figure 8 records the difference between the average estimated maximum burden on neighbouring nodes and the actual maximum burden in the network. The results show that the average estimate converges to about 20% to 50% of the actual maximum burden in the second day of message generation. We do not expect a precise estimate, and consider this outcome satisfactory for the following reasons: (i) it is only an average of different local estimates, and the error bars suggest that estimates may vary significantly among nodes; and (ii) each node has its own set of neighbours, and the maximum burden in the network may vary significantly from the maximum among each node’s neighbours. The next set of results show the performance of CCAF and FLARoute incorporated into PRoPHET routing protocol, as well as the other selected routing proposals in the Skudai simulation scenario.
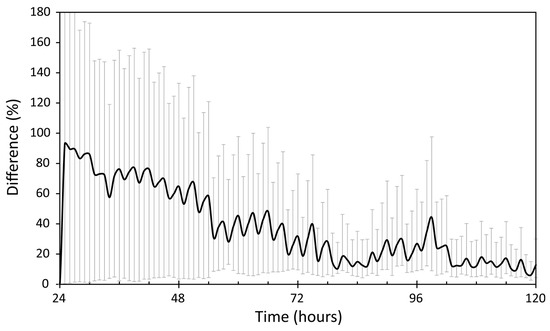
Figure 8.
The difference between average maximum burden among neighbouring nodes estimated by each node with MaxBE, and the actual maximum burden in the network at different times during the simulation.
The fairness of the routing techniques is shown in Figure 9. FLARoute records the highest fairness of 97.9%. SnF and CCAF record a fairness of 97% and 96.2%, respectively. dLife and PRoPHET are closely tied at 95.9% and 95.8%, respectively. Bubble Rap shows a 95.3% fairness, and HERO records the least fairness at 93.3%. Although the difference in fairness may seem small, we observe that a slight change in fairness leaves a noticeable impact on the energy consumption differences between the central nodes and the other nodes. Note that only two proposals, CCAF and FLARoute, were incorporated into PRoPHET. Bubble Rap, dLife, HERO and SnF were only included in the results to show how the existing routing approaches perform under high degrees of spatial locality. Hence, in order to capture the impact of CCAF and FLARoute, their performance should be compared with that of PRoPHET alone.
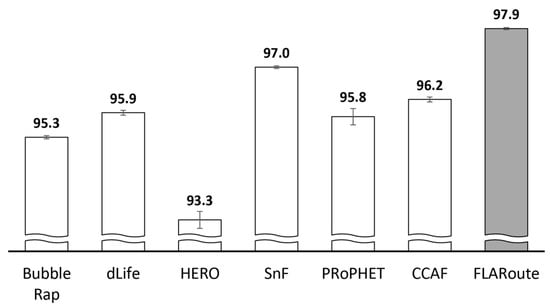
Figure 9.
Routing fairness (in %) of different routing techniques.
As shown in Figure 10, FLARoute records the highest energy distribution at 43.3%. This means that the average energy expended on the other nodes is 43.3% of that expended on the central nodes. This is followed by SnF and PRoPHET at 24.2% and 17.1%, respectively. According to the pattern of routing fairness in Figure 9, CCAF falls behind PRoPHET with an energy distribution of 11.3%. This is because with CCAF, the difference in the burden between members of the other nodes ranked according to their contribution in routing (i.e., from the most burdened to the least burdened) is more subtle as compared with PRoPHET. Normal order resumes with dLife, Bubble Rap and HERO, recording an energy distribution of 11.2%, 6.9% and 4.3%, respectively. FLARoute’s performance as compared with PRoPHET’s shows that the impact of an additional 2.1% fairness could be as much as 2.5 times increase in energy distribution.
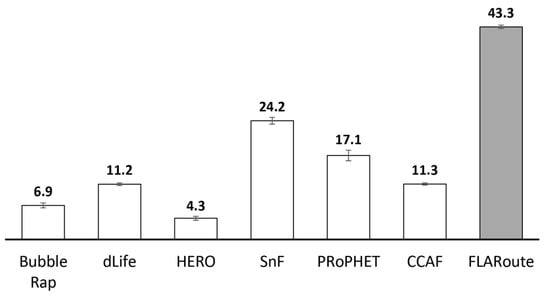
Figure 10.
Energy distribution (in %, i.e., × 100) of different routing techniques.
The throughput of the routing techniques is shown in Figure 11. FLARoute records the highest throughput at 85%, followed by CCAF at 76.2%. PRoPHET and SnF are closely tied at 65.3% and 64.9%, respectively. Next is dLife and HERO, recording a throughput of 49.3% and 49%, respectively. Bubble Rap records the least throughput at 42.7%. FLARoute’s improvement in fairness and throughput comes at a cost. As shown in Figure 12, FLARoute incurs 8.2 h of average delivery delay, which is a 49.1% increment of PRoPHET’s. CCAF, on the other hand, is able to improve PRoPHET’s delay by 9.1%.
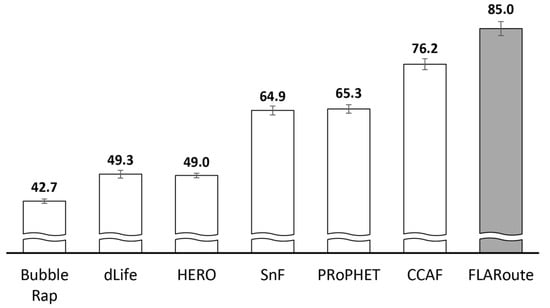
Figure 11.
Throughput (in %) of the different routing techniques.
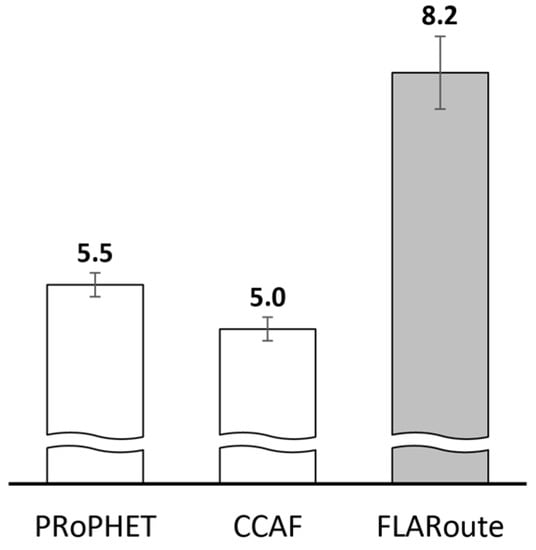
Figure 12.
The average delivery delay (in h) of PRoPHET, and that of CCAF and FLARoute when incorporated into PRoPHET.
As shown in Figure 13, FLARoute is able to reduce the transmission overhead of PRoPHET by 73.5%. This results in a 65.6% reduction of average energy consumption. A 90.7% reduction in transmission overhead and 89.2% reduction in average energy consumption is achieved with CCAF. The number of central nodes recorded by the routing techniques is shown in Figure 14. CCAF records about 30% improvement with respect to PRoPHET, while FLARoute records more than twice PRoPHET’s value. Table 4 summarises the impact of CCAF and FLARoute on PRoPHET routing protocol. We discuss these results next.
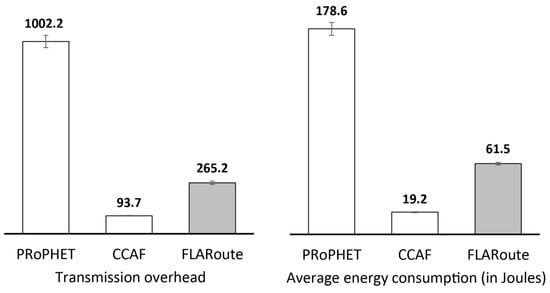
Figure 13.
The impact of CCAF and FLARoute on PRoPHET in terms of transmission overhead and average energy consumption.
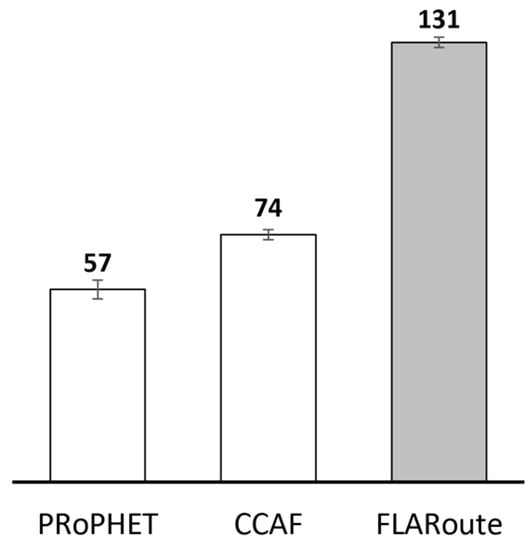
Figure 14.
The number of central nodes in the network when running under PRoPHET, CCAF and FLARoute.

Table 4.
Summary of the impact of CCAF and FLARoute on PRoPHET routing protocol.
A. Fairness-Oblivious Routing
While the same movement conditions apply across the simulations for each routing protocol, the resulting fairness varies depending on the routing approach. This is because different types of forwarding utilities and algorithms have different levels of aggressiveness in utilizing popular nodes. SnF shows the highest fairness among the selected (fairness-oblivious) routing protocols. Due to binary spraying, a less popular node with more copies of a message may end up doing more sending than a more popular node carrying the same message, thereby allowing for more fairness. dLife’s fairness is similar to that of PRoPHET. This is because forwarders are not limited to nodes with high level of popularity. By including a utility function that determines better relays based on the social engagement with the destination, dLife is able to distribute the burden among a larger set of nodes.
The encounter-based strategy of PRoPHET selects relay nodes based on their encounter frequency with the destination. Since popular nodes experience more encounters and may also encounter neighbours more frequently, they often present higher delivery predictabilities. Furthermore, PRoPHET’s transitive property allows this knowledge to be perceived over multiple hops, which increases the chances of selecting popular nodes as relays. That being the case, less popular nodes have less chance of being selected as relays, since the number of nodes they often encounter is relatively less. Consequently, PRoPHET’s fairness is reduced as more messages are pushed towards popular nodes.
Bubble Rap is designed to utilize central nodes to disseminate messages within and between communities. Messages are thereby directed towards nodes with higher centrality. Unfortunately, nodes with high centrality are relatively few in the network. Consequently, the same set of few highly central nodes receive a significantly high number of messages in the network, which decreases fairness. As for HERO, a potential relay node is either a node from the same region as the destination or a node that visits the destination’s region more frequently than the custodian of the message. Under higher degrees of spatial locality, there are less chances of encountering a node from the same region as the destination. Hence, only nodes that often travel longer distances are able to present a better forwarding utility. Since only relatively few nodes visit many different regions in the network, fairness is significantly degraded.
From the results in Figure 10, it is noticeable that energy distribution has a significant impact on fairness (cf., Figure 9). Among the routing protocols oblivious to fairness, SnF shows the highest fairness as well as the highest energy distribution. This is followed by PRoPHET and dLife, which correspond to the next set of protocols in terms of fairness. Finally, Bubble Rap and HERO record the lowest energy distribution, and correspond to the routing protocols with the lowest fairness.
B. Fairness-Aware Routing
OppNet routing protocols often trade one performance feature for another. While early routing approaches offer simplicity and ease of implementation, they lack in terms of major performance measures such as throughput and transmission overhead. For instance, Direct Transmission and First Contact trade low delivery guarantees for low resource requirements. Epidemic on the other hand, ensures higher delivery guarantees at the cost of increased resource consumption. Subsequent routing approaches provide acceptable delivery guarantees and resource requirements through additional mechanisms for acquiring and utilizing knowledge and assumptions. However, this may lead to increased complexity and feasibility issues.
Such trade-offs also exist in solutions for improving fairness, which in most cases, end up reducing either achievable throughput or fairness when considered under sensed data collection scenarios—for instance, the authors of CCAF focus on maximizing throughput as well as achieving a low delivery delay at the expense of a reasonably low reduction in fairness. A major challenge is that optimizing OppNet performance is more challenging that it may seem, as the performance metrics are often dependent on each other, and may reach a saturation point. For instance, while introducing more message copies reduces delivery delay and increases delivery guarantees, excess copies may lead to message loss and reduced delivery guarantees under resource constraints [74].
Focusing on minimizing delivery delay may degrade overall routing performance, especially in terms of throughput and fairness. In Smart City scenarios, delivery delay also depends on the distance between source-destination pairs. Since encounter opportunities and travel distances reduce with longer distances between source-destination pairs, trying to deliver messages through shorter routes may reduce fairness by over-utilizing a few set of nodes. This risk is heightened when the forwarding utility is highly biased towards popular nodes. Besides the risk of TTL exhaustion during the additional time spent waiting to encounter popular nodes, achievable throughput may also be reduced since there is a higher chance of message loss due to buffer overflow on them. As shown in Figure 15, the additional waiting time incurred by CCAF can be justified by a higher average buffer time, i.e., how long a message remains buffered—note that average delivery delay (cf., Figure 12) correlates with the hop count of delivered messages instead of buffer time (cf., Figure 15), unless nodes are able to receive notification of delivered messages and remove them from their buffers. With FLARoute, the average buffer time is reduced as nodes are able to send messages to a wider range of relay nodes as well as drop messages effectively with the burden balancing mechanism. Also justifiable by Figure 15 is the higher risk of losing messages, as CCAF drops more messages compared with FLARoute. A major contributing factor is the messages dropped by popular nodes, since these nodes are more prone to buffer overflow. FLARoute is able to reduce the number of copies of the same message buffered on popular nodes by allowing only one copy of messages to be routed through the higher-utility path. This results in fewer buffer overflows and less risk of losing messages—considering the first-in-first-out (FIFO) queuing policy.
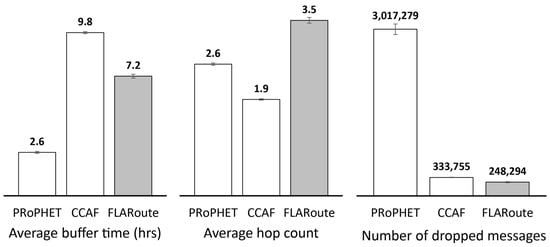
Figure 15.
Comparing PRoPHET, CCAF and FLARoute in terms of average buffer time, average hop count and number of dropped messages.
Figure 15 shows that PRoPHET has the least buffer time, since custodians do not have to wait to encounter less burdened nodes before forwarding messages (i.e., messages are simply forwarded to any encountered node with a higher forwarding utility). On the other hand, the number of messages dropped with PRoPHET is an order of magnitude higher. This is due to more messages being directed towards the few popular nodes, thereby subjecting them to more buffer overflows. As a result, PRoPHET records the least fairness among the three (cf., Figure 9).
C. The Delay Trade-Off
Liu and Wu [41] do not consider delay an important performance metric, as long as messages are delivered before TTL exhaustion. Therefore, the TTL, with respect to relevant application scenarios, becomes an important aspect in the design of OppNet routing solutions. In order to fully utilize the (24-h) diurnal cycle of human mobility [64], a TTL of 1 day is chosen for this evaluation. Experiments with HUMANETS, a routing approach that exploits human movement patterns, show that 75% of messages can be delivered within this period [75]. Hence, FLARoute is able to deliver more messages and achieve more fairness within the bounds of tolerable delay—for instance, Smart City applications such as garbage collection and green zone management may tolerate periodic notifications of up to 24 h [1]. By allowing a wider range of relay nodes with the PoiUtility, buffer occupancy is reduced and nodes are able to retain and deliver messages traversing multiple geographic regions—messages that are more likely to be lost with PRoPHET or CCAF. Hence, on top of PRoPHET’s 5.5 h average delivery delay, FLARoute trades an extra 2.7 h for increased fairness and throughput. Provided messages can be delivered within their lifetime and throughput is improved, we consider this delay insignificant unless the application in concern is delay sensitive, in which case opportunistic routing solutions would not be suitable.
D. Transmission Overhead and Average Energy Consumption vs. Fairness
As shown in Figure 13, FLARoute experiences only about 26.5% of PRoPHET’s transmission overhead, which can be as low as 9.3% with CCAF. FLARoute incurs more transmission overhead than CCAF due to being less biased towards popular nodes and allowing more number of less popular nodes participate in routing. Consequently, FLARoute also records more average energy consumption than CCAF (cf., Figure 13). Besides more number of nodes participating in routing, a reasonable part of FLARoute’s energy consumption is due to energy expended in failed transmissions. The number of failed transmissions is expected to increase when more number of less popular nodes are involved in routing (cf., Figure 16). Since less popular nodes are significantly higher in population, failed transmissions—as they try to find alternative routes—also increases the average energy consumption. With PRoPHET, however, poor fairness leads to higher buffer occupancy and failed transmissions on popular nodes instead, as shorter encounter durations become insufficient for them to complete forwarding transactions. Hence, as far as fairness is concerned, lower average energy consumption does not always signify better performance, and vice versa. What is more important is that the energy consumption on both set of nodes (i.e., the central nodes and the other nodes) is comparable and does not exceed a tolerable rate.
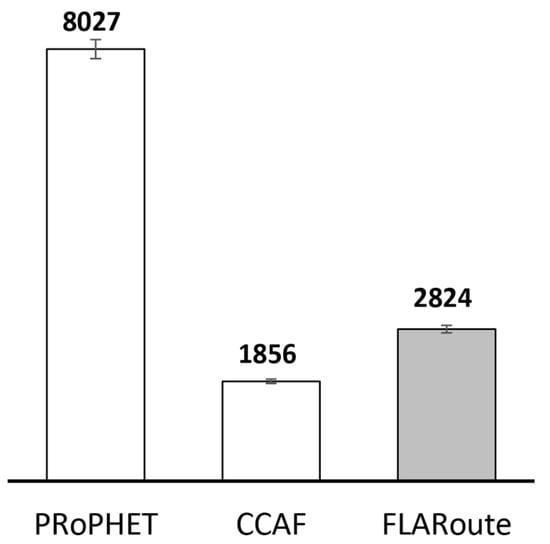
Figure 16.
Number of failed transmissions (aka. “aborted messages” in the ONE simulator) recorded by PRoPHET, CCAF and FLARoute.
E. Quantifying the Burden on Nodes
Another issue is the scenario-specific performance associated with inferring burden from buffer information. Depending on movement patterns and encounter opportunities, some nodes are able to free their buffers faster than others. Consequently, buffer occupancy may not always provide a good reflection of the burden on nodes. In fact, instantaneous buffer occupancy depends on various variables that may not correlate with the relative amount of contribution a node has done in forwarding messages (e.g., TTL, the number of destinations that can be directly encountered, the queuing policy in use, and routing protocol conditions for dropping messages). To demonstrate this, we select Node 114 and 177, two neighbouring nodes running on PRoPHET, for comparison under the fluctuating data traffic pattern illustrated in Figure 17. Messages are generated in two phases, one on the second day and the other on the fourth day, with a 1-day rest period between them. In both phases, each source node generates 1 message every hour for the first 6 h, followed by 1 message every 4 h for the rest of the day.
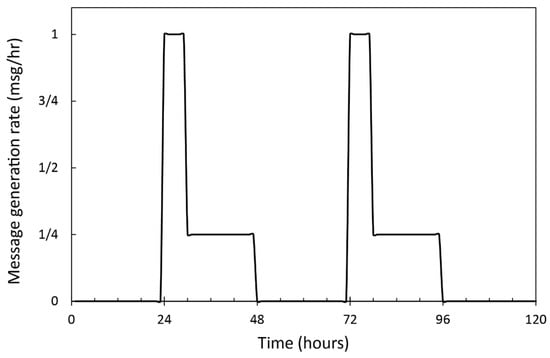
Figure 17.
Message generation rate at each source node for investigating the impact of fluctuating data traffic on inferring node burden from buffer information.
Since we have configured energy to be consumed only when messages are sent or received (cf., Section 4.1.1), the burden on nodes can be studied from their energy consumption. Hence, to observe the impact of the fluctuating data traffic on the resource utilization of the selected nodes, we record the energy consumed on hourly basis in Figure 18. From the figure, it can be observed that Node 114 is the more popular node, as it consumes more energy. Also, the energy consumed on Node 114 is more than that on Node 177 at any point in time. This signifies that the burden on Node 114 remains higher than the burden on Node 177 throughout the simulation. In simulations, energy level can give an insight to node burden since the environment can be controlled to consume energy from only routing related tasks. However, energy level is not a suitable burden measure for designing fair routing solutions intended for real-world implementation. As mentioned earlier in Section 2.1.3, users perform various energy consuming tasks on their devices. Hence, unless the energy consumed due to participation in routing can be determined, energy level is not a valid measure for node burden in real-life scenarios.
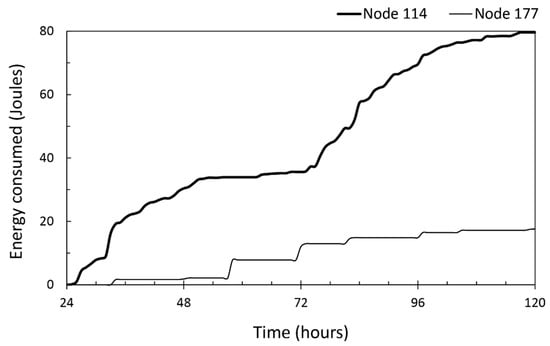
Figure 18.
Energy consumption on Node 114 and Node 177.
The existing fair routing solutions infer burden from buffer information. To observe how buffer information responds to the fluctuating data traffic, we record the buffer occupancy of both nodes every hour in Figure 19. Node 177, despite being the less popular node, experiences higher buffer occupancy for extensive periods, as indicated in the figure. This is mainly because Node 114 is able to free its buffer at a much higher rate. This shows that the buffer state favours nodes that free their buffers at a slower rate, hence may not be able to reflect the energy a node has consumed due to routing. Thus, erroneous routing decisions could occur if burden is inferred from buffer information during these periods. For instance, existing proposals for improving fairness would detect a higher burden on Node 177: from 33 to 39 h; for most of the period between 76 h and 87 h; from 95 h to 104 h; and for most of the time afterwards. During these periods, however, energy consumption (cf., Figure 18) indicates that Node 114 remains the more burdened node by a long margin.
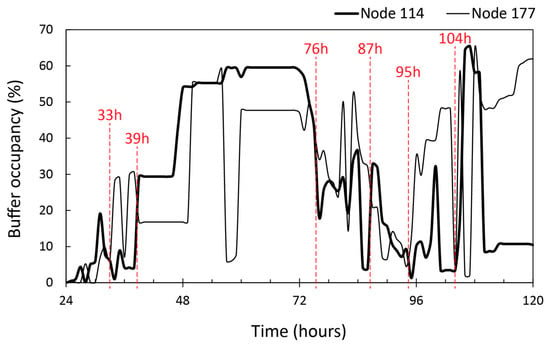
Figure 19.
Buffer occupancy against time for Node 114 and 177.
It is fair to say that existing approaches for improving fairness try to balance the buffer occupancy of nodes, rather than achieving fairness in terms of resource utilization (e.g., energy consumed in sending and receiving messages). By observing Figure 19, a possible workaround is to determine the instantaneous burden on a node from the combination of its current and previous buffer states. However, there is no guarantee that the previous buffer states would be obtained at points in time when the buffer would be able to reflect the actual relative burden on the node. These results also make it easier to imagine how inferring node burden from buffer occupancy would be a problem in a scenario where gateways are located at bus stops, for instance. Devices carried by bus drivers would then be able to encounter more destinations directly and free up their buffers. Without a steady flow of incoming messages, the buffer occupancy on such nodes may drop at a relatively higher rate, thereby rendering buffer occupancy momentarily inaccurate for determining the relative burden on them. Their number of transmissions (i.e., the number of messages sent and received on behalf of other nodes), on the other hand, better reflect their relative burden. This is because transmissions account for a considerable amount of energy consumed in routing. Figure 20 shows the cumulative number of transmissions for Node 114 and Node 177. At any point in time, the relative number of transmissions on both nodes corresponds to their relative energy consumption (cf., Figure 18). This correlation is the idea behind our proposed ReBurD mechanism.
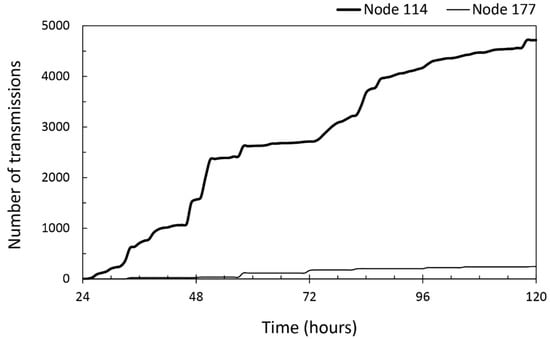
Figure 20.
Cumulative number of transmissions for Node 114 and Node 177.
ReBurD is oblivious of buffer information, and is able to overcome related drawbacks by considering the number of transmissions within a time frame. As shown in Figure 21, ReBurD’s relative burden on Node 177 does not exceed that on Node 114, even when their buffer occupancies suggest otherwise. These results correspond to the energy consumed on both nodes (cf., Figure 18) and their number of transmissions (cf., Figure 20). ReBurD also takes into account the possibility that node resources may have been restored after periods of inactivity. In other words, the computed burden decreases with reducing participation in routing, and vice versa. This explains the intersection of the ReBurD’s relative burden on both nodes around the 73rd hour, during which the burden on Node 114 continues to fall, since it is experiencing a reasonable period of inactivity—the assumption is that the device may have been recharged during this period. The burden on Node 177 on the other hand, starts to rise (cf., Figure 21) in response to incoming messages (cf., Figure 18), and equals that on Node 114, which is still inactive. Another possible event in real-life scenarios where ReBurD’s dynamicity comes to play is when a node newly joins the network. In that case, it would take a very long time for newcomer’s number of transmissions to catch up with that of nodes that have been in the network, even if it is a popular node. With our proposed ReBurD mechanism, the burden on the newcomer would to be comparable with the others in the next reset interval of the transmission counters.
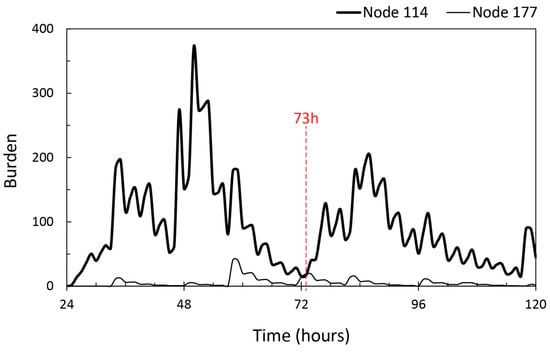
Figure 21.
ReBurD’s relative burden against time for Node 114 and 177.
4.2.2. Performance Evaluation in the Helsinki Scenario
The Helsinki scenario is simulated under five different rates of message generation in order to analyse how the routing proposals respond to changes in data traffic. The scenario consists of 600 nodes, which include 80 source nodes and 36 destination nodes that are placed in popular locations to represent sensors and gateways, respectively. Each source node generates messages to a randomly chosen destination node at the following rates: (i) 1 message every 3 h; (ii) 1 message every 2 h; (iii) 1 message every hour; (iv) 2 messages every hour; and (v) 3 messages every hour. Figure 22 shows that FLARoute achieves the highest energy distribution and fairness under the different rates of message generation. Figure 23, Figure 24 and Figure 25 show how the routing proposals perform under increasing data traffic in terms of energy distribution, routing fairness, throughput, average delivery delay, transmission overhead, average energy consumption, and the energy consumption on the 5 most popular nodes. Finally, Figure 26 and Figure 27 show results of performance evaluations under dynamic user behaviour and heterogeneous buffer capacity, respectively, with source nodes generating 1 message every hour.
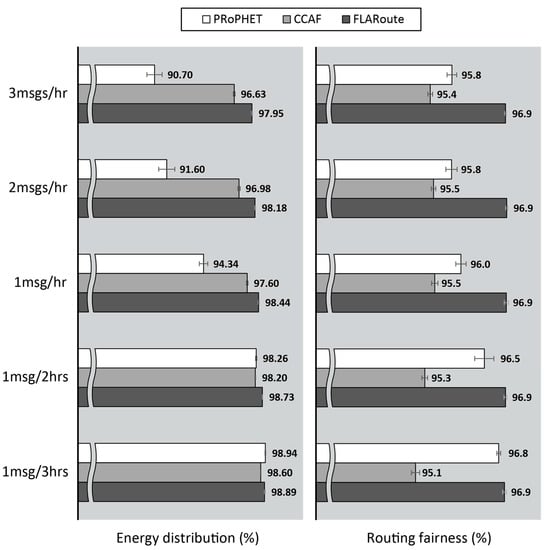
Figure 22.
Energy distribution and routing fairness under increasing data traffic in the Helsinki scenario.
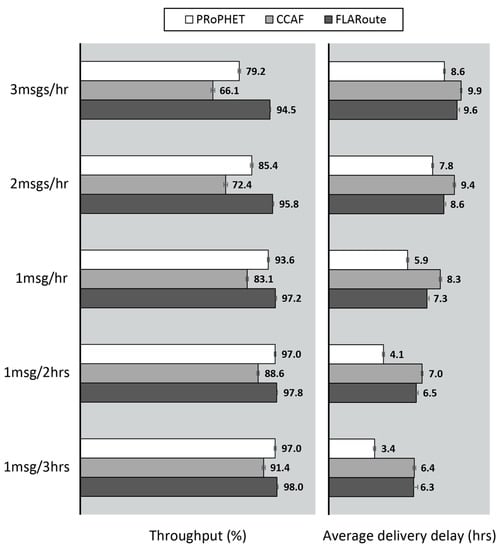
Figure 23.
Throughput and average delivery delay under increasing data traffic in the Helsinki scenario.
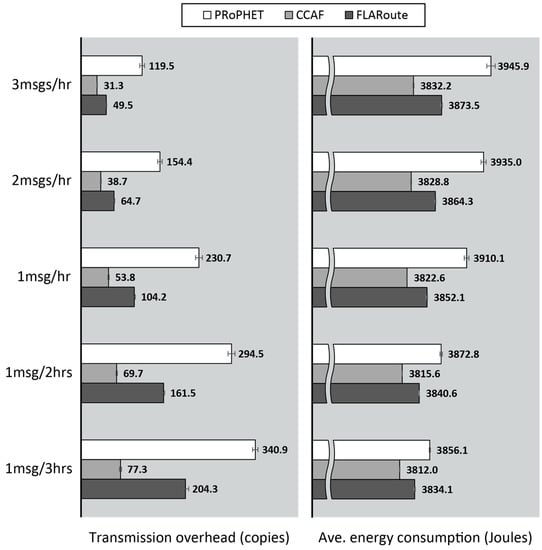
Figure 24.
Transmission overhead and average energy consumption under increasing data traffic in the Helsinki scenario.
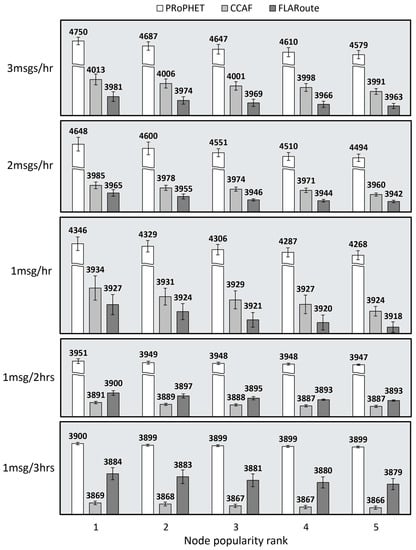
Figure 25.
Energy consumption (in Joules) on the 5 most popular nodes under increasing data traffic in the Helsinki scenario.
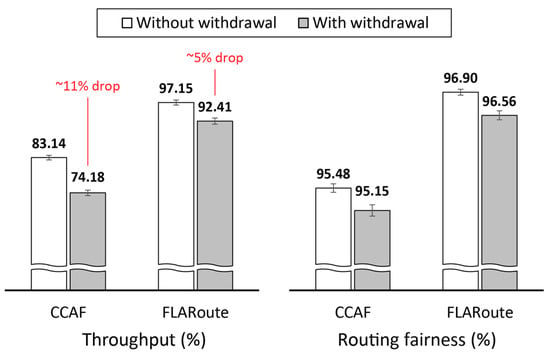
Figure 26.
Throughput and routing fairness with and without users withdrawing participation from the network.
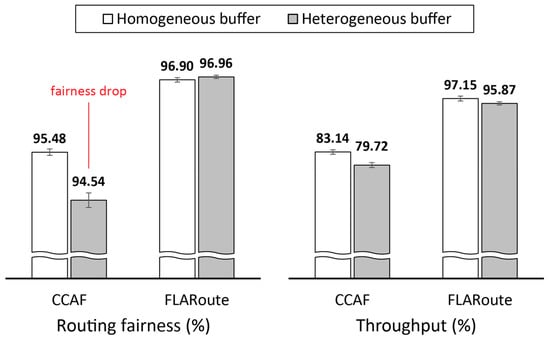
Figure 27.
Routing fairness and throughput under homogeneous and heterogeneous buffer capacities.
A. Throughput and Average Delivery Delay under Changing Data Traffic
As shown in Figure 23, throughput drops with increasing data traffic. With PRoPHET, throughput drops by 18.4% from the least to highest data traffic. This goes as low as 27.7% with CCAF—the lowest drop in throughput as data traffic increases. This is due to the adopted routing approach, which retains messages in buffers until relays presenting much higher encounter-based forwarding utilities are encountered. Under high data traffic, messages are lost during the wait period due to TTL exhaustion on less popular nodes or buffer overflows on popular nodes. Throughput drops by only 3.6% with FLARoute, which is able to maintain a more stable throughput under increasing data traffic by utilizing a forwarding utility that allows more number of nodes to participate and contribute their resources to routing. FLARoute also achieves the highest throughput under the different data traffic.
Figure 23 also shows that average delivery delay increases with data traffic. Since PRoPHET does not consider fairness, messages are forwarded to relay nodes with higher forwarding utilities irrespective of their burden. This way, messages are delivered through shorter routes and minimum delay is incurred, especially when data traffic is low. Under higher data traffic, however, more number of messages are introduced in the network, thereby resulting in higher buffer occupancy. Hence, more messages are delivered through longer routes due to message loss at popular nodes. Fair routing with CCAF spends more time waiting to encounter nodes with much higher forwarding utilities. Also, additional waiting time is incurred under higher data traffic since short-lived encounters may not be sufficient for popular nodes to complete their forwarding transactions. As compared with CCAF, FLARoute records less average delivery delay since a wider range of relay nodes are utilized. This shows that FLARoute recorded higher average delivery delay (and throughput) in the Skudai scenario due to its awareness of spatial locality (i.e., its ability to retain and deliver messages traversing multiple geographic regions). Since only delivered messages are considered, the routing technique that can deliver more number of messages to destinations located farther away incurs more average delivery delay.
B. Transmission Overhead and Average Energy Consumption under Changing Data Traffic
Under low data traffic, buffer occupancy is low and message loss is mostly limited to TTL exhaustion. Messages therefore stay longer in node buffers and due to fewer messages, they are successfully forwarded each time a more suitable relay node is encountered. Hence, high transmission overhead is incurred due to more successful transmissions. However, contrary to expected results, Figure 24 shows that less transmission overhead is incurred as data traffic increases. This is because node buffers become more occupied and more messages are lost from frequent buffer overflows. Increased buffer occupancy also leads to failed transmissions due to insufficient time to complete forwarding transactions. Interestingly, failed transmissions consume energy instead of incurring transmission overhead. This explains why Figure 24 shows more energy consumption as transmission overhead decreases.
PRoPHET records the highest transmission overhead and average energy consumption since messages are forwarded whenever a relay node presents a higher forwarding utility. CCAF, on the other hand, records the lowest transmission overhead and average energy consumption by forwarding messages only when a relay node presents a much higher forwarding utility. FLARoute records a higher transmission overhead and average energy consumption as compared with CCAF by allowing more number of less popular nodes to contribute in improving throughput. In this case, the main concern is whether the energy consumed on the most popular nodes (or the maximum energy consumption) is also increased in the process. To investigate this, Figure 25 shows the energy consumed by the 5 most popular nodes when running on each routing technique. CCAF records less energy consumption on popular nodes under low data traffic. However, as the average energy consumption increases under higher data traffic, FLARoute distributes the burden among a wider set of nodes thereby consuming less energy on popular nodes.
C. Throughput Under Dynamic User Behaviour
The autonomous nature of the network coupled with resource constraints on portable handheld devices leads to a highly dynamic user behaviour in real-life scenarios. One of the consequences is that constant participation cannot be guaranteed for every user in a real-world implementation of the technology. For instance, users may turn off the wireless communication interface on their devices to conserve energy or travel out of the city for a period of time. Hence, a robust fair routing solution should be able to cope with the variable availability of resources without significantly degrading throughput. FLARoute allows the contribution of a wider set of nodes to minimize throughput degradation under such scenarios. Therefore, it is important to have an insight on how the performance of other proposals compare in scenarios where some users occasionally withdraw participation from the network.
In order to simulate user withdrawal, we configure relay nodes in the Helsinki scenario (generating 1 message per hour) to randomly decide on a daily basis whether or not to cease from receiving and sending messages for a period uniformly distributed between 1 to 6 h. Figure 26 shows the throughput and fairness recorded by CCAF and FLARoute, with and without user withdrawal. With popular nodes withdrawing participation, messages are either lost due to buffer overflows on the remaining popular nodes or are unable to make much progress through less popular nodes. This leads to about 11% drop in throughput with CCAF. On the other hand, FLARoute records only about 5% drop in throughput. By increasing the number of central nodes and thereby allowing more number of less popular nodes to contribute in routing, the buffer availability in the network is increased. As a result, messages are provided with more alternative routes to the destination. Furthermore, the network becomes more resistant to increase in data traffic. Allowing more nodes to actively participate in routing reduces individual buffer occupancy and chances of buffer overflows, so that messages can be retained for longer periods. As shown in Figure 26, FLARoute still maintains a higher routing fairness under user withdrawal.
D. Routing Fairness under Heterogeneous Buffer Capacity
Although portable handheld devices are roughly homogenous in terms of energy and processing power, motivation derived from incentive benefits may cause users to allocate different amounts of storage space to the technology—for instance, some users may want to contribute with more storage space in order to gain more incentives. Hence, a robust fair routing solution should be able to treat a device fairly despite the resources allocated to the network. Section 2.4.3 discussed how inferring burden from buffer occupancy affects routing decisions when users do not allocate the same amount of storage space to the network. Specifically, devices that have more buffer capacities are subjected to unfair treatment due to the burden detection approaches of existing fair routing solutions. Therefore, it is important to have an insight on how the proposals perform in scenarios characterised by heterogeneous buffer capacity. To configure different buffer sizes, we generate a second node group from each existing group in the (ONE simulator’s) settings file and change their buffer size from 10 MB to 2 MB. The resulting fairness and throughput, before and after assigning different buffer sizes to the nodes, are shown in Figure 27.
With CCAF, nodes that have higher buffer capacity are likely to receive more messages since they often present less buffer occupancy. Such nodes are thereby subjected to more burden and energy consumption, as compared with other nodes of the same popularity level but less buffer capacity. This unequal distribution in resource utilization among nodes results in a drop in fairness, as indicated in the figure. FLARoute, on the other hand, determines node burden from the number of transmissions, a major source of energy consumption in routing. Hence, fairness is not degraded despite differences in buffer capacities. Unlike CCAF that becomes even more unfair under higher data traffic, FLARoute also provides a more stable fairness and still maintains a higher throughput.
4.2.3. Impact of FLARoute and Choice of Parameters
A. Impact of FLARoute
The main aim of FLARoute is to reduce unfairness in the utilization of handheld user device resources and increase throughput in the presence of strong spatial locality in urban environments. When incorporated into PRoPHET in the Skudai scenario, the additional fairness provided by FLARoute is able to: (i) increase the number of central nodes by 77%; and (ii) achieve 3.8 times CCAF’s energy distribution, thereby distributing energy consumption more evenly among the central nodes and the other nodes. As shown in Figure 28, FLARoute also reduces the maximum energy consumption in the network. These results signify increased user satisfaction among the different sets of nodes. In terms of throughput, FLARoute also provides an additional 8.8% as compared with CCAF. This is mainly because: (i) FLARoute considers spatial locality inherent to user movement when selecting relay nodes and dropping messages; and (ii) more nodes are actively involved in routing, thereby increasing the network’s buffer availability to reduce chances of message loss. As compared with CCAF, FLARoute achieves more fairness without incurring significant increase in the energy consumption per node, and delivers more messages within a TTL of 1 day. As compared with using the PRoPHET routing protocol alone, FLARoute: (i) increased fairness by 2.2%; (ii) increased energy distribution by 153.2%; (iii) increased throughput by 30.2%; (iv) reduced transmission overhead by 73.5%; and (v) reduced average energy consumption by 65.6%.
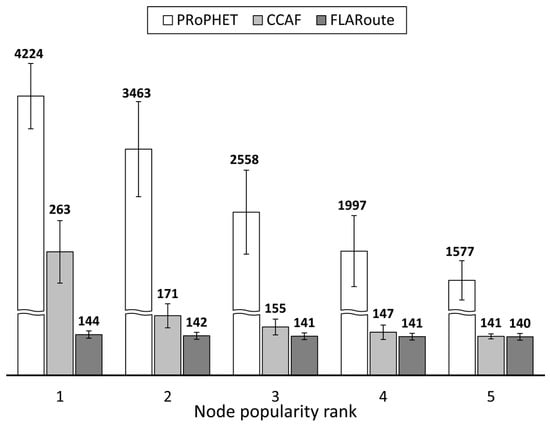
Figure 28.
Energy consumption (in Joules) on the five most popular nodes.
FLARoute’s performance under conditions in which other solutions are unable to guarantee fair treatment and improve throughput leads us to believe that it is more suitable for sensed data collection in real-life scenarios. Apart from its awareness of spatial locality inherent to user movement demonstrated in the Skudai scenario, results in the Helsinki scenario suggest that it can also cope with changing data traffic, heterogeneous buffer allocations on user devices, and dynamic user behaviour.
B. Choice of FLARoute’s Parameters
FLARoute requires the parameters , , and to be set, and here we discuss how changes in these values impact network performance. Node burden can be inferred directly from the number of transmissions. However, instead of counting the number of transmissions to infinity, which does not give a comparable burden for nodes newly joining the network, the observation period can be divided into time slots containing periods of peak traffic. This allows nodes to be observed and burden to be computed for short periods, during which maximum encounters are experienced. We observe that in urban environments, a time slot of 6 h is able to contain at least one period of peak traffic that occurs during rush h (i.e., for a typical working day movement: 07:00 to 09:00 due to encounters experienced while going to work; 13:00 to 14:00 due to lunch break encounters; and 18:00 to 20:00 for encounters while returning home)—note that Wu et al. [18] also exploited the significant rise in traffic experienced during rush h.
Based on results from several trials, we suggest a time slot of 3 h or 6 h. For , we select a time slot of 3 h so that ReBurD responds faster to changes in transmission rate, while we select 6 h for in order for MaxBE to gain insight into the maximum burden on nodes during each rush hour. It is important to note that MaxBE’s maximum burden estimate is focused on only neighbouring nodes, rather than every node existing in the network. Also, FLARoute does not require a precise estimate of this value to improve fairness, and can be based on the burden on nodes MaxBE obtains from past encounters in each time slot. Since ReBurD and MaxBE are distributed mechanisms, their time slots can be loosely synchronized with the global time on smartphones. For example, can be from 06:30 to 21:30, …, 12:30 to 15:30, …, 18:30 to 21:30, … Note that such approach only requires a one-off synchronization during initialization and can be updated whenever the node gains access to global time.
denotes the percentage of the maximum burden estimate that is considered as “low burden”, and determines the number of nodes allowed to forward messages in the less-burden path with FLAFord algorithm (cf., Section 3.2.4). In this regard, a larger value of considers higher amount of burden as low. This allows more popular nodes to contribute in the less-burden path, thereby increasing throughput and reducing fairness. Based on results from several trials, we suggest a 20% value for , as it showed the most optimal throughput-fairness trade-off. is a threshold that denotes when the burden on a node actually matters and starts to reflect noticeably on energy consumption. As we suggested earlier, a desired value of can be obtained from user surveys, in order to meet their satisfaction needs in real-world implementation. Values above or below the desired threshold may either result in more energy consumption on less burdened nodes or less delivery guarantees due to more number of nodes dropping messages that are following the less-burden path (cf., Section 3.2.4), respectively. In summary, the parameters and determine the trade-off between user satisfaction and throughput.
4.3. Lessons Learned
It is important to note that simply involving more nodes in the routing process does not achieve fairness. The idea is not only to allow a higher number of less popular nodes to participate in routing, but to also determine a means for them to reduce the burden on popular nodes and contribute towards improving throughput. Simply involving more relay nodes would be Epidemic routing, and this approach does not guarantee improved fairness. Since Epidemic forwards messages to nodes irrespective of their delivery ability, fairness is determined by the distribution of encounter opportunities among nodes—note that popular nodes are likely to experience more encounters. In other words, the rate at which a node running on Epidemic receives messages is determined by its level of popularity. Hence, simply involving more nodes in routing without providing them with a means to reduce the burden on popular nodes degrades fairness and throughput instead.
An important lesson learned is that metrics such as transmission overhead and average energy consumption tend to increase when more nodes contribute in routing. This can be misleading during performance evaluation if not properly understood. By increasing the number of central nodes (i.e., shifting excess burden from popular nodes to less popular nodes so that the later become more popular), nodes that would have been idle—in terms of contribution—become more active, hence carry out more transmissions and consume more energy. Since less popular nodes are significantly higher in population, the average energy consumption is increased when they are entrusted with more messages. Furthermore, a considerable portion of their incurred burden is also lost to failed transmission attempts, just as the case with popular nodes. Hence, considering every node in the network, the transmission overhead and energy consumption increases. This is only noticeable when comparing FLARoute with CCAF, as FLARoute reduces these metrics significantly when incorporated into PRoPHET. A similar behaviour was observed with Mtibaa and Harras’s [19] proposal, where PFA-PeopleRank and MCFA-PeopleRank—their fair extensions of PeopleRank—incurred more cost (i.e., transmission overhead) than the original version of PeopleRank. According to the authors, the cost increase per node is not significant even though the total number of message replicas in the network is increased, and that the increase in cost becomes significantly smaller when the number of nodes in the network grow to reflect a more realistic deployment.
Another lesson learned is that, in the presence of strong spatial locality, allowing more number of less popular nodes to contribute in forwarding increases the number of hops required to deliver messages as well as delivery delay. Popular nodes often happen to be the ones that either travel longer distances, visit more locations or encounter more number of nodes within shorter periods. Thus, evading them, especially in environments characterised by strong spatial locality, inevitably incurs additional delivery delay. With respect to non-delay sensitive applications in such environments, what is more important is the ability to deliver messages within their lifetime. In order words, it is more important to maximize throughput than minimize delivery delay. Hence, incurring lower delivery delay that will lead to reduced throughput is not a preferable trade-off for delay-tolerant applications.
It is also important to note that changes in fairness tend to occur in slight percentages, especially under higher node population. An example is Fan et al.’s [76] fairness comparison of their fair versions of existing routing protocols on the MITreality data set using Jain et al.’s [77] fairness index. With 80 nodes, the maximum difference in fairness between each original routing protocol and its modified version with their fair packet-forwarding strategy seems to be less than 3%, yet they make the following statement:
“We observe that all of our fair strategies enjoy a better fairness index when compared with the original schemes, proving that the algorithm we proposed can indeed enhance the balance of success rate distribution.”
From our experiments, we observe that the tendency of fairness to vary by slight percentages is mainly due to the number of nodes involved, such that changes in the distribution of burden tend to reflect more noticeably on the fairness metric when the population is less, and vice versa. Hence, we suggest that fairness should be considered alongside , our energy distribution performance metric, as this gives a more meaningful representation of the fairness achieved.
5. Conclusions and Future Work
Collecting delay-tolerant sensor data with OppNets has received considerable attention in recent years. This is mainly because OppNets exploit pervasive user devices such as smartphones and tablets to offer a scalable and resource efficient solution for connecting multitudes of spatially displaced sensors to major infrastructure in urban environments to provide various Smart City services. Regardless of these promising benefits, the success of this approach lies in the willingness of users to contribute with the resources on their devices. As with most OppNet routing solutions, subjecting only few popular devices to most of the forwarding duties leads to higher resource consumption on them. Due to the lack of fairness, users of popular devices may respond by withdrawing participation, which may eventually lead to degraded network performance.
In this paper, we investigated the existing challenges of improving fairness in OppNets for sensed data collection, and then, suggested a set of design guidelines for fair routing techniques. We then followed our guidelines to propose the Fair Locality Aware Routing (FLARoute) technique. Tailored for sensed data collection, FLARoute addresses the issue of fairness in OppNets by exploiting concepts of spatial locality to implement a fair forwarding utility, namely PoiUtility. Unlike existing solutions, PoiUtility combines encounter-based forwarding principles with locality-aware mechanisms to allow a wider range of nodes to participate in message forwarding. Fairness is improved as PoiUtility increases the likelihood of delivering messages through less popular nodes, even under higher degrees of spatial locality. The adopted approach also improves throughput significantly by utilizing less popular nodes when popular nodes are over-burdened.
FLARoute also implements two new distributed mechanisms, namely Relative Burden Detection (ReBurD) and Maximum Burden Estimation (MaxBE). Our ReBurD mechanism, unlike existing approaches, provides a non-scenario-specific representation of node burden by keeping account of the number of message transmissions. The mechanism is also able to locally compute the instantaneous relative burden on a node, which increases and decreases according to the node’s participation in forwarding. MaxBE facilitates fair forwarding decisions by allowing nodes to give a local estimate of the maximum burden among their neighbours, without incurring excessive overheads from metadata transmissions.
We also propose the Fair Locality Aware Forwarding (FLAFord) algorithm, which makes fair forwarding decisions with available knowledge. It forwards messages via two types of routes: one that presents a higher change of delivery, regardless the level of burden on relay nodes; and one that can make progress through less burdened nodes. The FLAFord algorithm also defines a new burden balancing mechanism to relieve relay nodes in the latter phase of excessive burden. Evaluation results in the ONE simulator show that the performance of applicable routing protocols could be significantly improved with FLARoute. Incorporating FLARoute into PRoPHET routing protocol increased fairness, energy distribution, and throughput. FLARoute also reduced PRoPHET’s transmission overhead and average energy consumption. As compared with an existing fair routing solution, namely CCAF, FLARoute achieves more fairness, consumes less energy on the most popular nodes, and delivers more messages within a TTL of 1 day. To the best of our knowledge, FLARoute represents the first fair routing technique to consider the impact of spatial locality inherent to user movement in urban environments. Hence, it promises improved throughput and fairness under characteristics of sensed data collection scenarios that would compromise the performance of existing fair routing solutions. The performance of FLARoute under different network conditions also showed that observing our fair routing guidelines to realize routing fairness does not only achieve user satisfaction, but benefits the network in terms of delivery guarantees as well.
FLARoute’s performance has provided evidence that our suggested guidelines can be followed to improve fairness and throughput in sensed data collection scenarios. While FLARoute has set the foundation for fair routing in these scenarios, more work is required to ready it for deployment. A comprehensive investigation of the effect of different FLARoute parameters on network performance could lead to further research contributions. As a future work, three main areas in which FLARoute leaves room for improvement could be addressed. The first improvement is concerning ReBurD and MaxBE’s reset interval for transmission counters. Since different nodes may experience inactivity in different periods, a preferable solution is a mechanism to provide a dynamic reset interval that adapts to the inactive periods of different nodes. However, this may lead to desynchronization of time slots and the effect needs to be investigated. Also, ReBurD computes burden from only successful transmissions. However, failed transmissions also impact on resource consumption. This brings about the second area of improvement, which is to investigate how accounting for failed transmissions in determining node burden would impact network performance and routing fairness. The third aspect is concerning energy in acquiring location-based information for computing the fair forwarding utility (i.e., PoiUtility) via GPS. There is the possibility that users may have the GPS on their device turned off and may not be willing to turn it back on just to answer the needs of a specific routing solution. Since human movement exhibits a reasonable amount of regularity, the GPS could be used sparingly by relying on prediction techniques. However, further investigation is required to unfold the reliability of this approach in real-world scenarios.
Author Contributions
Tekenate E. Amah conceived the original idea, designed the figures, implemented the proposals in the simulator and wrote the manuscript with input from all authors. Waldir Moreira and Antonio Oliveira-Jr contributed to the problem background the evaluation methodology. Aliyu M. Abali assisted with the simulation set up, helped carry out the experiments, and was also involved in processing the experimental data. Maznah Kamat and Kamalrulnizam Abu Bakar aided in interpreting the results and supervised the findings of this work. All authors provided critical feedback and helped shape the research, analysis and manuscript.
Conflicts of Interest
The authors declare no conflict of interest.
References
- Gomez, C.; Paradells, J. Urban Automation Networks: Current and emerging solutions for sensed data collection and actuation in smart cities. Sensors 2015, 15, 22874–22898. [Google Scholar] [CrossRef] [PubMed]
- Ochiai, H.; Ishizuka, H.; Kawakami, Y.; Esaki, H. Agent based sensor data gathering for agricultural applications. IEEE Sens. J. 2011, 11, 2861–2868. [Google Scholar] [CrossRef]
- Tovar, A.; Friesen, T.; Ferens, K.; McLeod, B. A DTN wireless sensor network for wildlife habitat monitoring. In Proceedings of the 23rd Canadian Conference on Electrical and Computer Engineering, Calgary, AB, Canada, 2–5 May 2010; pp. 1–5. [Google Scholar]
- McDonald, P.; Geraghty, D.; Humphreys, I.; Farrell, S.; Cahill, V. Sensor Network with Delay Tolerance (SeNDT). In Proceedings of the 16th International Conference on Computer Communications and Networks, Honolulu, HI, USA, 13–16 August 2007; pp. 1333–1338. [Google Scholar]
- Velásquez-Villada, C.; Donoso, Y. Delay/Disruption tolerant network-based message forwarding for a river pollution monitoring wireless sensor network application. Sensors 2016, 16, 436. [Google Scholar] [CrossRef] [PubMed]
- Cheng, N.; Lu, N.; Zhang, N.; Shen, X.; Mark, J. Vehicle-assisted data delivery for smart grid: An optimal stopping approach. In Proceedings of the IEEE International Conference on Communications, Budapest, Hungary, 9–13 June 2013; pp. 6184–6188. [Google Scholar]
- Du, W.; Li, Z.; Liando, J.C.; Li, M. From rateless to distanceless: Enabling sparse sensor network deployment in large areas. IEEE/ACM Trans. Netw. 2016, 24, 2498–2511. [Google Scholar] [CrossRef]
- Mao, X.; Miao, X.; He, Y.; Li, X.; Liu, Y. CitySee: Urban CO2 monitoring with sensors. In Proceedings of the 31st Annual IEEE International Conference on Computer Communications, Orlando, FL, USA, 25–30 March 2012; pp. 1611–1619. [Google Scholar]
- Clarke, R. Smart Cities and the Internet of Everything: The Foundation for Delivering Next-Generation Citizen Services. Available online: http://www.cisco.com/c/dam/en_us/solutions/industries/docs/scc/ioe_citizen_svcs_white_paper_idc_2013.pdf%20 (accessed on 7 November 2017).
- Park, U.; Heidemann, J. Data muling with mobile phones for sensornets. In Proceedings of the 9th ACM Conference on Embedded Networked Sensor Systems, Seattle, WA, USA, 1–4 November 2011; pp. 162–175. [Google Scholar]
- Can, Z.; Demirbas, M. Smartphone-based data collection from wireless sensor networks in an urban environment. J. Netw. Comput. Appl. 2015, 58, 208–216. [Google Scholar] [CrossRef]
- Shi, F.; Adeel, U.; Theodoridis, E.; Haghighi, M.; McCann, J. OppNet: Enabling citizen centric urban IoT data collection through opportunistic connectivity service. In Proceedings of the IEEE 3rd World Forum on Internet of Things, Reston, VA, USA, 12–14 December 2016; pp. 723–728. [Google Scholar]
- Dimatteo, S.; Hui, P.; Han, B.; Li, V. Cellular Traffic Offloading through Wi-Fi Networks. In Proceedings of the IEEE 8th International Conference on Mobile Ad-Hoc and Sensor Systems, Valencia, Spain, 17–22 October 2011; pp. 192–201. [Google Scholar]
- Petz, A.; Lindgren, A.; Hui, P.; Julien, C. Madserver: A server architecture for mobile advanced delivery. In Proceedings of the 7th ACM International Workshop on Challenged Networks, Istanbul, Turkey, 22–26 August 2012; pp. 17–22. [Google Scholar]
- Rebecchi, F.; Dias de Amorim, M.; Conan, V.; Passarella, A.; Bruno, R.; Conti, M. Data offloading techniques in cellular networks: A Survey. IEEE Commun. Surv. Tutor. 2015, 17, 580–603. [Google Scholar] [CrossRef]
- Wu, X.; Brown, K.; Sreenan, C. Analysis of smartphone user mobility traces for opportunistic data collection in wireless sensor networks. Pervasive Mob. Comput. 2013, 9, 881–891. [Google Scholar] [CrossRef]
- Aguilar, S.; Vidal, R.; Gomez, C. Opportunistic sensor data collection with bluetooth low energy. Sensors 2017, 17, 159. [Google Scholar] [CrossRef] [PubMed]
- Wu, X.; Brown, K.; Sreenan, C. Exploiting rush hours for energy-efficient contact probing in opportunistic data collection. In Proceedings of the 31st International Conference on Distributed Computing Systems Workshops, Minneapolis, MN, USA, 20–24 June 2011; pp. 240–247. [Google Scholar]
- Mtibaa, A.; Harras, K. Fairness-related challenges in mobile opportunistic networking. Comput. Netw. 2013, 57, 228–242. [Google Scholar] [CrossRef]
- Orlinski, M.; Filer, N. Quality distributed community formation for data delivery in pocket switched networks. In Proceedings of the Fourth Annual Workshop on Simplifying Complex Networks for Practitioners, Lyon, France, 17 April 2012; pp. 31–36. [Google Scholar]
- Tsvetovat, M.; Kouznetsov, A. Centrality, Power, and Bottlenecks. In Social Network Analysis for Startups: Finding Connections on the Social Web; O’Reilly Media, Inc.: Sebastopol, CA, USA, 2011. [Google Scholar]
- Muchnik, L.; Pei, S.; Parra, L.; Reis, S.; Andrade, J.; Havlin, S.; Makse, H. Origins of power-law degree distribution in the heterogeneity of human activity in social networks. Sci. Rep. 2013, 3, 1783. [Google Scholar] [CrossRef] [PubMed]
- Pujol, J.; Toledo, A.; Rodriguez, P. Fair Routing in Delay Tolerant Networks. In Proceedings of the 28th IEEE Conference on Computer Communications, Rio de Janeiro, Brazil, 19–25 April 2009; pp. 837–845. [Google Scholar]
- Amah, T.; Kamat, M.; Bakar, K.; Moreira, W.; Oliveira, A.; Batista, M. Spatial locality in pocket switched networks. In Proceedings of the 17th IEEE International Symposium on a World of Wireless, Mobile and Multimedia Networks, Coimbra, Portugal, 21–24 June 2016; pp. 1–6. [Google Scholar]
- Silva, A.; Burleigh, S.; Hirata, C.; Obraczka, K. A survey on congestion control for delay and disruption tolerant networks. Ad Hoc Netw. 2015, 25, 480–494. [Google Scholar] [CrossRef]
- Jiang, Q.; Men, C.; Tian, Z. A Credit-Based Congestion-Aware Incentive Scheme for DTNs. Information 2016, 7, 71. [Google Scholar] [CrossRef]
- Seregina, T.; Brun, O.; El-Azouzi, R.; Prabhu, B. On the design of a reward-based incentive mechanism for delay tolerant networks. IEEE Trans. Mob. Comput. 2017, 16, 453–465. [Google Scholar] [CrossRef]
- Khalid, K.; Woungang, I.; Dhurandher, S.; Barolli, L.; Carvalho, G.; Takizawa, M. An energy-efficient routing protocol for infrastructure-less opportunistic networks. In Proceedings of the 10th International Conference on Innovative Mobile and Internet Services in Ubiquitous Computing, Fukuoka, Japan, 6–8 July 2016. [Google Scholar]
- Bista, B.; Rawat, D. EA-PRoPHET: An energy aware prophet-based routing protocol for delay tolerant networks. In Proceedings of the IEEE 31st International Conference on Advanced Information Networking and Applications, Taipei, Taiwan, 27–29 March 2017. [Google Scholar]
- Moreira, W.; Mendes, P. Social-Aware opportunistic routing: The New Trend. In Routing in Opportunistic Networks; Woungang, I., Dhurandher, S., Anpalagan, A., Vasilakos, A., Eds.; Springer: New York, NY, USA, 2013; pp. 27–68. [Google Scholar]
- Vahdat, A.; Becker, D. Epidemic Routing for Partially Connected Ad Hoc Networks; Technical Report CS-200006; Duke University: Durham, NC, USA, 2000. [Google Scholar]
- Spyropoulos, T.; Psounis, K.; Raghavendra, C. Single-copy routing in intermittently connected mobile networks. Proceedings of 1st the Annual IEEE Communications Society Conference on Sensor and Ad Hoc Communications and Networks, Santa Clara, CA, USA, 4–7 October 2004; pp. 235–244. [Google Scholar]
- Jain, S.; Fall, K.; Patra, R. Routing in a delay tolerant network. In Proceedings of the Conference on Applications, Technologies, Architectures, and Protocols for Computer Communications, Portland, OR, USA, 30 August–3 September 2004; pp. 145–158. [Google Scholar]
- Spyropoulos, T.; Psounis, K.; Raghavendra, C. Spray and wait: An efficient routing scheme for intermittently connected mobile networks. In Proceedings of the ACM Special Interest Group on Data Communication Workshop on Delay-Tolerant Networking, Philadelphia, PA, USA, 22–26 August 2005; pp. 252–259. [Google Scholar]
- Balasubramanian, A.; Levine, B.; Venkataramani, A. DTN routing as a resource allocation problem. In Proceedings of the Conference on Applications, Technologies, Architectures, and Protocols for Computer Communications, Kyoto, Japan, 27–31 August 2007; pp. 373–384. [Google Scholar]
- Amah, T.; Kamat, M.; Moreira, W.; Abu Bakar, K.; Mandala, S.; Batista, M. Towards next-generation routing protocols for pocket switched networks. J. Netw. Comput. Appl. 2016, 70, 51–88. [Google Scholar] [CrossRef]
- Grasic, S.; Davies, E.; Lindgren, A.; Doria, A. The evolution of a DTN routing protocol—PRoPHETv2. In Proceedings of the 6th ACM Workshop on Challenged Networks, Las Vegas, NV, USA, 23 September 2011; pp. 27–30. [Google Scholar]
- Wang, X.; He, R.; Lin, B.; Wang, Y. Probabilistic routing based on two-hop information in delay/disruption tolerant networks. J. Electr. Comput. Eng. 2015, 2015, 918065. [Google Scholar] [CrossRef]
- Sadat, N.; Tasnim, M. A neighborhood contact history based spraying heuristic for delay tolerant networks. In Proceedings of the 3rd International Conference on Informatics, Electronics & Vision, Dhaka, Bangladesh, 23–24 May 2014; pp. 1–5. [Google Scholar]
- Rolla, V.; Curado, M. Time message system for delay tolerant networks. In Proceedings of the 2nd Baltic Congress on Future Internet Communications, Vilnius, Lithuania, 25–27 April 2012; pp. 239–245. [Google Scholar]
- Liu, C.; Wu, J. An optimal probabilistic forwarding protocol in delay tolerant networks. In Proceedings of the 10th ACM international Symposium on Mobile Ad Hoc Networking and Computing, New Orleans, LA, USA, 18–21 May 2009; pp. 105–114. [Google Scholar]
- Leguay, J.; Friedman, T.; Conan, V. Evaluating mobility pattern space routing for DTNS. In Proceedings of the 25th IEEE International Conference on Computer Communications, Barcelona, Spain, 23–29 April 2006; pp. 1–10. [Google Scholar]
- Mtibaa, A.; May, M.; Diot, C.; Ammar, M. Peoplerank: Social opportunistic forwarding. In Proceedings of the 2010 Proceedings IEEE, 29th IEEE International Conference on Computer Communications, San Diego, CA, USA, 14–19 March 2010; pp. 1–5. [Google Scholar]
- Moreira, W.; Mendes, P.; Sargento, S. Opportunistic routing based on daily routines. In Proceedings of the 13th IEEE International Symposium on a World of Wireless, Mobile and Multimedia Networks, San Francisco, CA, USA, 25–28 June 2012; pp. 1–6. [Google Scholar]
- Hui, P.; Crowcroft, J.; Yoneki, E. Bubble rap: Social-based forwarding in delay-tolerant networks. IEEE Trans. Mob. Comput. 2011, 10, 1576–1589. [Google Scholar] [CrossRef]
- Nguyen, H.; Giordano, S. Context information prediction for social-based routing in opportunistic networks. Ad Hoc Netw. 2012, 10, 1557–1569. [Google Scholar] [CrossRef]
- Spyropoulos, T.; Psounis, K.; Raghavendra, C. Spray and focus: Efficient mobility-assisted routing for heterogeneous and correlated mobility. In Proceedings of the 5th Annual IEEE International Conference on Pervasive Computing and Communications Workshops, White Plains, NY, USA, 19–23 March 2007; pp. 79–85. [Google Scholar]
- Sun, G.; Xiao, F.; Jiang, L.; Xu, J.; Wang, R. A Sociability-Based spray and forward scheme for opportunistic network. Int. J. Distrib. Sens. Netw. 2013, 2013, 987961. [Google Scholar] [CrossRef]
- Deok, S.; Won, Y. An improved PRoPHET routing protocol in delay tolerant network. Sci. World J. 2015, 2015, 623090. [Google Scholar] [CrossRef]
- Sanjay, K.; Kumar, D.; Woungang, I.; Saini, A. Efficient routing based on past information to predict the future location for message passing in infrastructure-less opportunistic networks. J. Supercomput. 2014, 71, 1694–1711. [Google Scholar]
- Socievole, A.; Yoneki, E.; De Rango, F.; Crowcroft, J. ML-SOR: Message routing using multi-layer social networks in opportunistic communications. Comput. Netw. 2015, 81, 201–219. [Google Scholar] [CrossRef]
- Wang, S.; Liu, M.; Cheng, X.; Li, Z.; Huang, J.; Chen, B. HERO—A home based routing in pocket switched networks. In Proceedings of the International Conference on Wireless Algorithms, Systems, and Applications, Huangshan, China, 8–10 August 2012; pp. 20–30. [Google Scholar]
- Keränen, A.; Ott, J.; Kärkkäinen, T. The ONE simulator for DTN protocol evaluation. In Proceedings of the 2nd International Conference on Simulation Tools and Techniques, Rome, Italy, 2–6 March 2009; p. 55. [Google Scholar]
- Ekman, F.; Keränen, A.; Karvo, J.; Ott, J. Working Day Movement Model. In Proceedings of the 1st ACM SIGMOBILE Workshop on Mobility Models, Hong Kong, China, 29–30 May 2008; pp. 33–40. [Google Scholar]
- Wu, X.; Brown, K.; Sreenan, C. Data pre-forwarding for opportunistic data collection in wireless sensor networks. ACM Trans. Sens. Netw. 2014, 11. [Google Scholar] [CrossRef]
- Silva, D.; Costa, A.; Macedo, J. Energy impact analysis on DTN routing protocols. In Proceedings of the 4th Extreme Conference on Communication, Zürich, Switzerland, 10–14 March 2012. [Google Scholar]
- Moreira, W.; Mendes, P.; Sargento, S. Social-Aware opportunistic routing protocol based on user’s interactions and interests. In Ad Hoc Networks, Proceedings of the 5th International ICST Conference, Barcelona, Spain, 16–18 October 2013; Sherif, M., Mel-louk, A., Li, J., Bellavista, P., Eds.; Springer: Cham, Switzerland, 2014; pp. 100–115. [Google Scholar]
- Wang, S.; Liu, M.; Cheng, X.; Li, Z.; Huang, J.; Chen, B. Opportunistic routing in intermittently connected mobile P2P networks. IEEE J. Sel. Areas Commun. Suppl. 2013, 31, 369–378. [Google Scholar] [CrossRef]
- Yu, C.; Bao, C.; Jin, H. Hierarchical geographical tags based routing scheme in delay/disruption tolerant mobile ad hoc networks. In Proceedings of the 1st International Conference on Human Centered Computing, Phnom Penh, Cambodia, 27–29 November 2014; pp. 352–364. [Google Scholar]
- Grundy, A.; Radenkovic, M. Promoting congestion control in opportunistic networks. In Proceedings of the 6th IEEE International Conference on Wireless and Mobile Computing, Networking and Communications, Niagara Falls, NU, Canada, 11–13 October 2010; pp. 324–330. [Google Scholar]
- Akestoridis, D.; Papanikos, N.; Papapetrou, E. Exploiting social preferences for congestion control in opportunistic networks. In Proceedings of the 10th IEEE International Conference on Wireless and Mobile Computing, Networking and Communications, Larnaca, Cyprus, 8–10 October 2014; pp. 413–418. [Google Scholar]
- Jahromi, K.; Zignani, M.; Gaito, S.; Rossi, G. Simulating human mobility patterns in urban areas. Simul. Modelling Pract. Theory 2016, 62, 137–156. [Google Scholar] [CrossRef]
- Wang, S.; Liu, M.; Cheng, X.; Song, M. Routing in pocket switched networks. IEEE Wirel. Commun. 2012, 19, 67–73. [Google Scholar] [CrossRef]
- González, M.; Hidalgo, C.; Barabási, A. Understanding individual human mobility patterns. Nature 2008, 453, 779–782. [Google Scholar] [CrossRef] [PubMed]
- Zhao, M.; Mason, L.; Wang, W. Empirical study on human mobility for mobile wireless networks. In Proceedings of the IEEE Military Communications Conference, San Diego, CA, USA, 16–19 November 2008; pp. 1–7. [Google Scholar]
- Cho, E.; Myers, S.; Leskovec, J. Friendship and mobility: user movement in location based social networks. In Proceedings of the 17th ACM SIGKDD International Conference on Knowledge Discovery and Data Mining, San Diego, CA, USA, 21–24 August 2011; pp. 1082–1090. [Google Scholar]
- Herder, E.; Siehndel, P. Daily and weekly patterns in human mobility. In Proceedings of the 2nd International Workshop on Augmented User Modeling, Montreal, QC, Canada, 16–20 July 2012; pp. 1–11. [Google Scholar]
- Mtibaa, A.; Harras, K. CAF: Community aware framework for large scale mobile opportunistic networks. Comput. Commun. 2013, 36, 180–190. [Google Scholar] [CrossRef]
- Ciobanu, R.; Marin, R.; Dobre, C.; Cristea, V.; Mavromoustakis, C.; Mastorakis, G. Opportunistic dissemination using context-based data aggregation over Interest Spaces. In Proceedings of the 2015 IEEE International Conference on Communications, London, UK, 8–12 June 2015; pp. 1219–1225. [Google Scholar]
- Amah, T.; Kamat, M.; Abu Bakar, K.; Moreira, W.; Oliveira, A.; Batista, M. Measuring burden and routing fairness in pocket switched networks. In Proceedings of the 35th Brazilian Symposium on Computer Networks and Distributed Systems, Belém, Brazil, 15–19 May 2017; pp. 250–264. [Google Scholar]
- Hasan, S.; Schneider, C.; Ukkusuri, S.; González, M. spatiotemporal patterns of urban human mobility. J. Stat. Phys. 2013, 151, 304–318. [Google Scholar] [CrossRef]
- Amah, T.; Kamat, M.; Abu Bakar, K.; Abd Rahman, S.; Mohammed, M.; Abali, A.; Moreira, W.; Oliveira, A. Collecting sensed data with opportunistic networks: The case of contact information overhead. Information 2017, 8, 108. [Google Scholar] [CrossRef]
- Ren, Z.; Liu, W.; Zhou, X.; Fang, J.; Chen, Q. Summary-Vector-Based effective and fast immunization for epidemic-based routing in opportunistic networks. IEEE Commun. Lett. 2014, 18, 1183–1186. [Google Scholar] [CrossRef]
- Santi, P. Next generation wireless networks. In Mobility Models for Next Generation Wireless Networks: Ad Hoc, Vehicular and Mesh Networks, 1st ed.; Hutchison, D., Fdida, S., Sventek, J., Eds.; John Wiley & Sons, Ltd.: Chichester, UK, 2012; pp. 1–17. [Google Scholar]
- Aviv, A.; Sherr, M.; Blaze, M.; Smith, J. Evading cellular data monitoring with human movement networks. In Proceedings of the 5th USENIX Conference on Hot Topics in Security, Washington, DC, USA, 10 August 2010; pp. 1–6. [Google Scholar]
- Fan, X.; Li, V.; Xu, K. Fairness analysis of routing in opportunistic mobile networks. IEEE Trans. Veh. Technol. 2014, 63, 1282–1295. [Google Scholar] [CrossRef]
- Jain, R.; Chiu, D.; Hawe, W. A Quantitative Measure of Fairness and Discrimination for Resource Allocation in Shared Computer Systems; Technical report; Eastern Research Lab, Digital Equipment Corporation: Hudson, MA, USA, 1984. [Google Scholar]
© 2017 by the authors. Licensee MDPI, Basel, Switzerland. This article is an open access article distributed under the terms and conditions of the Creative Commons Attribution (CC BY) license (http://creativecommons.org/licenses/by/4.0/).