Abstract
In wireless sensor networks, building energy-efficient systems is one of the major challenges. In such networks, nodes are usually supplied by low power and small batteries. Many factors are involved in the energy consumption, and this issue may be considered as a cross-layer problem, from the hardware architecture to the application layer. This paper aims at presenting a hybrid solution for sensor networks based on two main aspects. The first one is the hardware architecture, where we present a prototype of a sensor node we designed. This node proved its efficiency in terms of energy consumption. The second aspect is related to the topology construction and presents a new topology control algorithm based on graph computing. Thus, our system consists of a real indoor application for temperature and humidity monitoring, applicable to home automation or industrial monitoring. We performed the experiments using a set of sensor nodes deployed over a building and proved the efficiency of the system in terms of energy consumption, network lifetime and data delivery.
1. Introduction
Today, we assist the great emergence of wireless sensor networks. These kinds of networks are self-organized and consist in general of a large amount of autonomous sensor nodes with low resources transmitting sensed data to the base stations [1]. A sensor network can be easily deployed over large areas, but once deployed, it can be very difficult or even impossible to access. That is why most of these networks intend to optimize the use of the limited energy contained in each node. Energy optimization can be obtained by an efficient hardware architecture, efficient data routing and aggregation, energy harvesting and many other ways. Many application fields tend to take advantage of the technology of wireless sensor networks. The principal fields are related to temperature and humidity monitoring, surveillance, rescue operations and home automation. Most of the applications that require large-scale networks, such as the detection of forest fires, use high range transmission standards like IEEE 802.11b. Other applications, such as home automation that require less transmission range, use other standards, such as IEEE 802.15.4 related to ZigBee specifications. This standard is normally used for home automation and industrial monitoring applications. In fact, many works have demonstrated that conventional wireless standards such as Bluetooth or “WLAN” [2,3] are not suitable to be used in this type of network. It has also been shown that the best standard taking into consideration the constraints of indoor networks is IEEE 802.15.4 [4]. Furthermore, the ZigBee network is has the least, compared with other wireless networks, SNR [5,6], which makes it the best standard for indoor applications, where noise has a strong presence, especially in industrial manufacturing.
It is also important to note that several works have been conducted to improve the energy efficiency of sensor networks by enhancing routing protocols, topology control and data aggregation, and the results are confirmed using simulation tools such as Ns-2, Omnet, MATLAB, etc. [7,8]. However, building energy-efficient hardware has not yet gained much interest from the research community. Consequently, most of the commercialized sensor nodes have a high consumption level, energy still being an unresolved problem. In addition, the commercialized nodes do not give any possibility to improve the performances related to the physical and MAC layers, namely the registers of transmission and reception, the size of packets, and others.
Thus, the first challenge that we tackle in this paper is to design a prototype of the sensor node that reduces the energy consumption while maintaining a high level of performance. As a matter of fact, the idea was to use a combination of a ZigBee radio transceiver provided by Microchip [9] and an “Arduino” microcontroller [10]. Our designed node showed satisfying results in terms of energy saving and the reliability of data processing. Secondly, we focus on topology construction to enhance the performances of the sensor network. We developed an improved cluster-tree topology based on the minimum spanning tree (MST) that we called minimum spanning cluster-tree (MSCT).
The remainder of the paper is organized as follows; Section 2 presents some concepts related to our contribution, namely ZigBee specifications and graph theory concepts. Section 3 describes our hardware architecture based on the ZigBee transceiver and Arduino microcontroller, as well as an overview of our system. In Section 4, we treat our developed topology based on minimum spanning trees. Section 5 evaluates the performances of the system by presenting our experimental scenario and results. Finally, Section 6 concludes the paper.
2. Background
In this section, we present some concepts related to the paper’s contributions, where we introduce graph theory related to the construction of the minimum spanning tree topology, as well as the particularities of ZigBee networks.
2.1. Minimum Spanning Tree
A minimum spanning tree (MST) of an undirected graph is a graph that spans all the nodes as vertices and contains no cycles [11]. It can also be presented as a sub-graph that contains all the vertices where the sum of the weights of edges is no larger than the total weight of any other spanning tree from the graph [12]. The concepts of the spanning tree may be applied to construct the topology. Thus, several algorithms for routing and topology control based on MST have been developed. These algorithms use a few methods that allow the construction of the MST-based topology, such as the “relax” algorithm [13], the “adjust weight” algorithm, the “adjust tree” algorithm [14], the “STPtree-based” algorithm [15] and others. In general, spanning tree algorithms have shown energy efficiency for different extreme sensor network conditions. The Kruskal algorithm [16] starts by computing the cost between all nodes and continues until all the possible pairs have calculated there costs. Then, it sorts all edges in increasing order and considers all of these edges for inclusion in the tree. The tree initially has all vertices, but no edges; an edge is included in the tree if and only if its addition does not create a cycle in the already constructed tree.
2.2. ZigBee Network
IEEE 802.15.4 is a low-power and low-cost standard for wireless communications, destined for personal area networks (PAN). ZigBee networks are basically composed of one or many PAN coordinators, which monitor the entire network by dealing with the ordinary nodes that request association with the PAN managed by the coordinator in order to participate in the network’s operations [17]. Two layers are specified in the IEEE 802.15.4 standard: the physical and MAC layers.
The physical layer supports three frequency bands [17]: a 2450-MHz band (16 channels), a 915-MHz band (10 channels) and an 868-MHz band (1 channel). Concerning the MAC layer, the 802.15.4 standard defines two types of nodes: reduced function devices (RFD) and full function devices (FFD) [17]. The FFD devices are equipped with all MAC layer functions. ZigBee also standardizes the higher layers of the protocol stack [18]. The network layer has the task of organizing routing over a multi-hop network, while the application layer intends to provide a framework for distributed application development and communication.
ZigBee specifies three principal devices: the coordinator, routers and end devices; where routers and coordinator must be FFD. From these devices, three types of topologies are defined: star, mesh and cluster three. The star topology [19] consists only of end-devices sending packets to the coordinator. The mesh topology [20] is more complex, but robust and resilient to faults. Routers maintain a routing table and employ a route discovery algorithm to construct and update data structures on the path nodes. The routing table is generally consulted by a node before any transmission to decide about the next hop.
The cluster-tree [21] is a simple hierarchical topology based on a relationship between the father and children, as shown in Figure 1. In this topology, several clusters are present and able to communicate using multi-hop routes. They are also controlled by a PAN coordinator [22,23]. The cluster topology performs as follows: after the network’s construction based on association-request and association-response, the parents of the clusters form a tree structure and act as intermediate routers. For better network control, the maximum number of children and the maximum depth of the tree that each router may have need to be fixed.
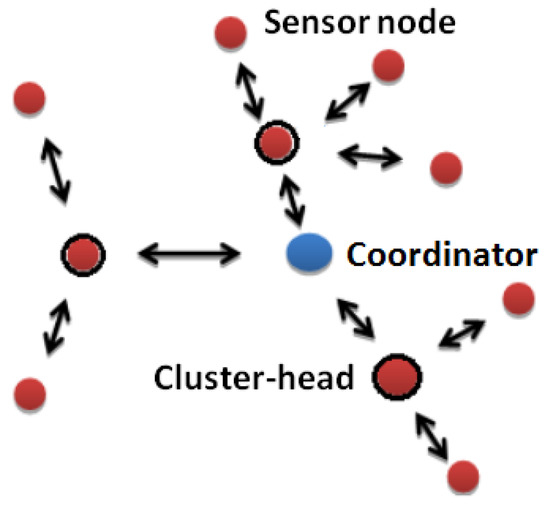
Figure 1.
Cluster-tree topology.
In the next section, we present the architecture of our sensor nodes based on ZigBee specifications over the Arduino platform. The system was designed and programmed in order to follow the characteristics cited above.
3. Hardware and System
3.1. Hardware Architecture
In this section, we present the hardware architecture of our designed sensor node. Basically, a node includes three main components: sensor, processor and radio frequency (RF) transceiver.
The sensor is a device that produces data measurements in order to monitor the physical environment. Sensed data could be temperature, pressure, humidity, voltage, etc. The sensor gives an analog signal based on the observed phenomenon converted to digital information by the AD converters and sent to the processor for further processing. In our system, we opt for the “Aosong DHT22” temperature-humidity sensor.
The processor is generally integrated with the microcontroller. It performs tasks, processes data and coordinates the functionality of all components connected to the sensor board. In our system, we used the “Atmel Sam3x8e ARM Cortex-M3” micro-processor embedded on an “Arduino Due” microcontroller [24]. A similar system using the Xbee mote, also based on Arduino, has been presented in [25] for a railway control case. Another advantage of working with the Arduino microcontroller is that it gives an easy programming interface for all layers, while many other commercial nodes are fixed for the physical and MAC layers.
The radio frequency (RF) transceiver connects the sensor node to the network. Generally, the RF module operates in three different modes: transmit, receive and sleep. The transmit mode consumes more energy. The energy consumed during the other modes may vary according to the used medium access algorithm. In our system, we used the “Microship MRF24J40MA” ZigBee transceiver [9] for routers and end-devices and the “Microship MRF24J40MD” for the coordinator due to it high transmission range.
Table 1 and Table 2 present comparisons between the characteristics of some sensor nodes, including our designed sensor node, based respectively on the CPU, memory and data rate in Table 1 and power consumption, range and sensitivity in Table 2.

Table 1.
Sensor Nodes’ Comparison 1: hardware specifications.

Table 2.
Sensor Nodes Comparison 2: energy and power.
This comparison shows that our hardware gives an alternative solution concerning the transmission range-energy consumption problem, by reducing considerably the energy consumption while maintaining a high transmission range compared with the other sensor nodes.
The circuit design of the node (excluding the Arduino board) is modeled in Figure 2, and a prototype of it is shown in Figure 3.
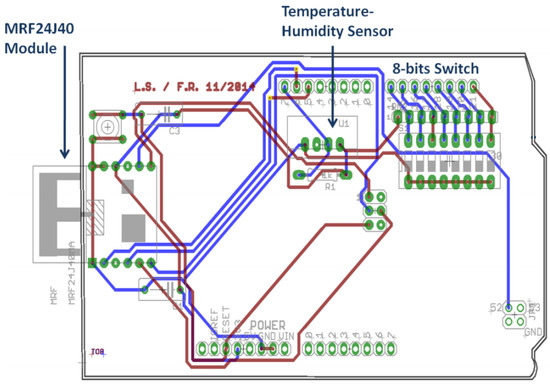
Figure 2.
Circuit design of the sensor node.
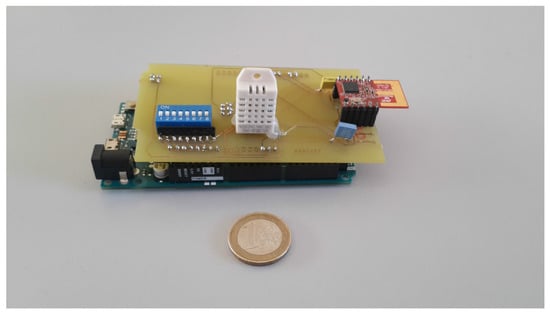
Figure 3.
The sensor node prototype.
We also note that, besides the three main components cited above, the sensor node includes other hardware components: one eight-bit, so the node provides a MAC address to nodes before the logical address assignment, and two capacitors. The circuit board, including all electronic components, is finally connected to the Arduino microcontroller.
In order to highlight the added value of our sensor device in terms of energy consumption and the performance of the network, it is imperative to note that the used microcontroller and ZigBee transceiver are, in addition to the low power consumption, open to be configured in all network layers, contrary to the commercial sensor nodes described in Table 1 and Table 2, where it is very difficult to access or configure the operations performed in the physical and MAC layers. However, the ZigBee specifications only define three topologies inside the MAC layer: star, mesh and cluster-tree. Since the goal of this work is to develop and test a new topology, it was necessary to design a new sensor node prototype that must be fully open to configuration.
The development of this new device has also allowed performing some improvements related to the physical layer and transceiver registers, such as reducing the size of packets to minimize the computational delay and save energy.
Thus, the hardware has permitted obtaining a new platform that represents a cross-layer solution, where users can define the specifications of the network based on the type and application of the network.
3.2. System Overview
In this section, we present the network system based on our designed sensor nodes. The system is based on the IEEE 802.15.4 standard described in the previous section to allow low range communications and energy consumption between the different nodes. It includes a set of sensor nodes organized as a network. The coordinator is connected to a control system acting as the base station. An illustration of this system is shown in Figure 4. The software architecture of the network includes two units as follows.
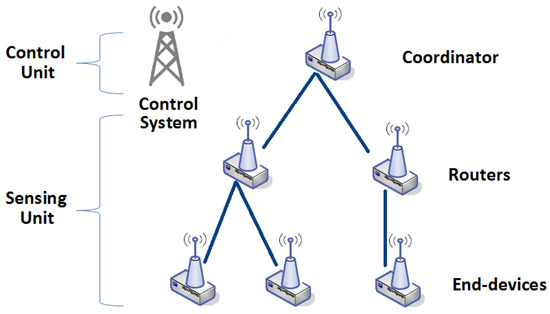
Figure 4.
System overview.
3.2.1. Sensing Unit
This unit includes an important number of nodes that act simultaneously as sensors and routers. In this system, end-devices are considered as reduced function devices (RFD) and are programmed to activate the sensor, read the physical measurement and transmit it toward the base station. On the other hand, the routers are considered as full function devices (FFD). They are programmed, in addition to the task performed by end-nodes, to receive data from other nodes and route these toward the control unit.
3.2.2. Control Unit
The control unit is composed of a coordinator node connected to the control system. The coordinator has to organize the network and its communications. It has also the capability to add or remove any node from the network, provide addresses and create/control the topology. The algorithms used by coordinator, like the topology construction algorithm, have to be sent by the control system to the coordinator.
4. MSCT Topology
In this section, we present our improved cluster-tree topology based on the minimum spanning tree. We call our topology the minimum spanning cluster-tree (MSCT). Basically, as discussed in the previous sections, the typical cluster tree is based on the association-request and association-response sent between the node and the coordinator; the coordinator then decides which position has to be attributed to the requesting sensor node. This position depends more on the timing of association-request; the network is created progressively with its expansion. In the MSCT topology, the process of network creation is totally different. We explain in this section how the topology is created in our system.
4.1. Indoor Propagation Models
Since our proposed algorithm for topology control is intended for ZigBee networks, the deployment environment is considered to be inside buildings. The indoor networks have some particularities to take into consideration, especially the presence of walls.
We take into consideration a model treating the placement of walls that dictates the signal path inside a building. Generally, in an indoor environment, the average path loss for a transmitter and receiver over a distance dis given in [26] by:
where is the path loss for 1 m, nthe path loss exponent, and is a zero-mean Gaussian distributed random variable with standard deviation .
This model has been generalized in [27] to a multi-wall environment. This consists of adding a further attenuation term due to losses introduced by the walls penetrated by the direct path between the receiver and transmitter:
where represent the multi-wall component expressed as:
where is the number of penetrated walls, is constant and depends on wall size as: for a light wall (0–20 cm), for a medium wall (20–40 cm) and for a door.
In this paper, we consider that the cost of the transmission of a packet is based on the distance between transmitter and receiver. This cost can be considered as the weight of connection between the two nodes. In the case of free space transmission, the weight would simply be the Euclidean distance between the nodes. However, in the indoor environment, the presence of obstacles and path loss must be taken into consideration. Thus, based on the model above, we conclude this equation that calculates the weight of the connection between two nodes in indoor conditions:
where represents the Euclidean distance between the transmitter and the receiver and and represent respectively the received power at the destination and the power from the source.
4.2. MSCT Creation
We suppose a graph representing the topology of the static sensor network, where V represents the sensor nodes and E the link weight between two connected nodes. In theory, the link weight in the sensor network represents the Euclidean distance between two nodes. This distance is not representative in the case of an indoor environment. Therefore, our algorithm has to take into consideration some obstacles for transmission, mainly the walls, and does not consider other kinds of obstacles. Thus, in Equation (4), we presented a formula to compute the weight of connection from the Euclidean distance that considers the path loss. To construct the MST, we used Algorithm 1 based on Kruskal to sort the weight of edges in an increasing order. We then considered each sorted edge for inclusion in the tree if it did not create a cycle. Following this algorithm, we obtain a topology hlwith the minimum cost of communication.
| Algorithm 1 Minimum Spanning Tree Construction Algorithm |
| Require: Graph with N nodes Ensure: Minimum Spanning Tree T
|
Figure 5 and Figure 6 show an illustration of the minimum spanning tree topology construction and how costs are reduced. Let us consider the topology (graph) in Figure 5 with eight nodes (vertices) that can be connected by several edges. The numbers on the edges represent the weight of connection that may be the distance between nodes and is considered as the cost of transmission in our study. Algorithm 1 sorts the weights of edges in an increasing manner and starts adding them to the tree. The edges that generate cycles will be excluded from the tree.
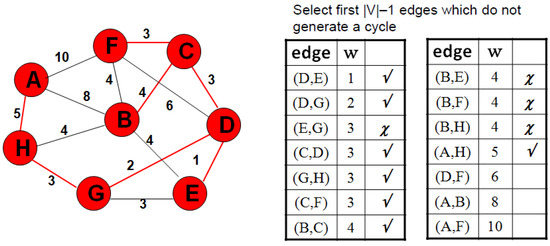
Figure 5.
MST construction illustration: Part 1.
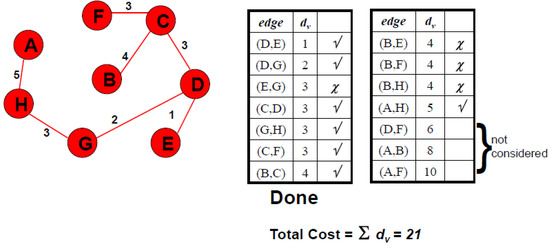
Figure 6.
MST construction illustration: Part 2.
At the end of this process, the topology obtained is a spanning tree where the total weight is minimal, as illustrated in Figure 6. As the weight represents the transmission cost, mainly related to the energy dissipation, we can suppose that building such a topology may reduce considerably the consumption of energy in the network.
4.3. MSCT Topology Control
In this section, we explain how the MSCT topology based on the algorithm above is implemented in a real ZigBee sensor network. When the network is created, the only node to be connected is the coordinator. In order to add nodes, the network proceeds as follows:
- When a node sends an association-request, the coordinator adds the node to the network (assigning the PAN id), but not to the topology (no address assigned yet). Thus, during a time , the coordinator does not create the topology, but only receives association-requests from nodes to store them in a table.
- All nodes added in the network calculate the weight of connections with their neighbors and send this information to the coordinator.
- After time has passed, the coordinator constructs a map containing all nodes that joined the network, as well as their neighborhood tables. Thus, it creates the topology following Algorithm 1 steps.
- After the construction of the topology, the coordinator defines a period of time where the association-requests are received and stored in order to face any change of topology. This process allows the saving of energy by reducing the computational cost.
This control process allows the reduction of the energy consumption in the network because of:
- The algorithms for the topology construction and control are executed at the coordinator node. The energy of the sensor nodes is saved for sensing, transmitting and routing tasks.
- The total cost of transmissions in the network is minimal.
- Topology maintenance is executed periodically, contrary to cluster-tree or mesh, where it is calculated after any change in topology.
To better illustrate the topology control process, Algorithm 2 shows the operations performed by the coordinator. To simplify this algorithm, we assume that all association-requests are accepted by the coordinator.
| Algorithm 2 Network Operations at the Coordinator |
|
5. Performance Evaluation
In this section, we present the experimental tests we performed to evaluate the performances of the system based on our designed sensor nodes.
5.1. Experiments’ Scenario and Parameters
To evaluate the performances of our system in the same conditions as most of the ZigBee systems, we conducted the tests in an indoor environment. In these experiments, the network is composed of 13 ZigBee sensor nodes. We used only FFD devices that can act as routers or end-devices. This is due to the the fact that the topology can change at any time, and end-devices may become routers in a new topology. The scenario is to deploy our network inside the building at the University of Rabat. The system is programmed in such a way that all sensor nodes measure data every 2 s and transmit these toward the coordinator.
The end-device nodes sense and transmit data to the parent node; meanwhile, the routers can receive data from neighbors and transmit these toward the coordinator using the links defined in the topology. Figure 7 shows the deployment of nodes over the building and also shows the links between nodes in one of the topologies constructed during this experiment.
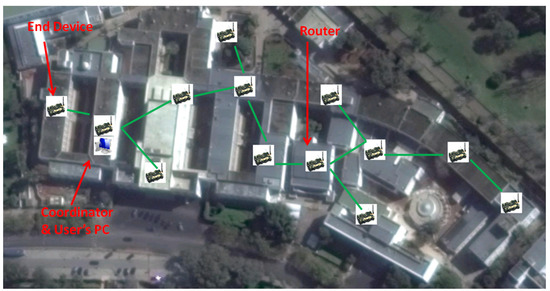
Figure 7.
Sensor network deployment and topology over the building of the university.
The detailed parameters of the experiments and their corresponding values are summarized in Table 3.

Table 3.
Experimental parameters. FFD, full function devices; RFD, reduced function devices.
The coordinator sends received data from the network to a computer that represents the control system. Figure 8 shows the coordinator area. The connection between coordinator and the control system computer is wired. This can be explained by two reasons:
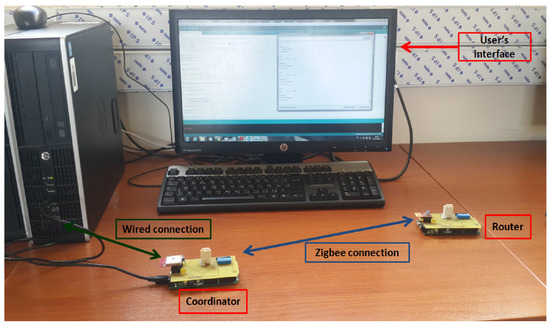
Figure 8.
Architecture of the coordinator area.
- (i)
- The wireless connection will consume much energy because all of the network’s data will be sent through this connection.
- (ii)
- To ensure that collected data coming from nodes arrive safely at the control system.
5.2. Results and Discussion
Concerning the main results, we focus on the energy consumption of sensor nodes to test the performances of the system on it from two aspects: the hardware and the topology.
In order to evaluate the performances of our designed hardware, we compare its performances with a famous commercial sensor node: the MicaZ sensor node of Memsic (presented in Table 1 and Table 2).
The MicaZ sensor node (Figure 9) is a sensor node based on a Texas Instruments microcontroller and respects ZigBee specifications. We choose to compare the performances of our hardware with MicaZ nodes because of the nearly similar features of both nodes in term of frequency, communication range and transmitting power (see Table 1 and Table 2).
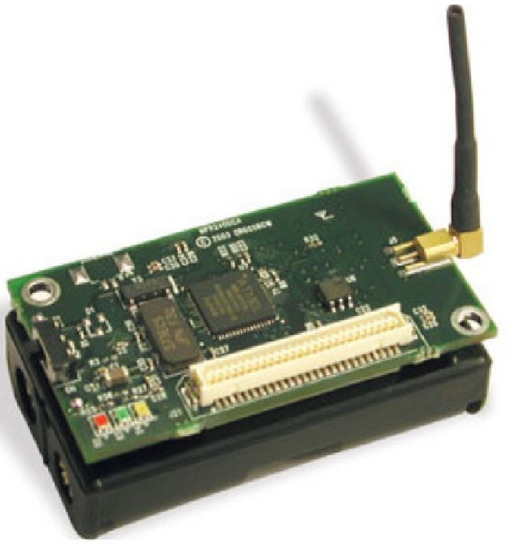
Figure 9.
Memsic MicaZ sensor node.
The first result regards the discharge process. We performed the test of this metric using our designed sensor node. As illustrated in Figure 10, we compare the different topologies in terms of the battery’s voltage discharge in router nodes according to time. The initial voltage for all router nodes is approximately 2 V. It is clear that the discharge process using MSCT is longer than the mesh and cluster-tree topologies. We notice also that this process is accentuated for the mesh topology when the voltage level is below 1.5 V. In this case, the node is considered out of resources. Note that this value is lower in the other topologies: 1, 3 V for the cluster-tree and 0, 9 V for the MSCT. This first result shows that the energy consumption is minimal and the discharge process is slower by using the MSCT topology.
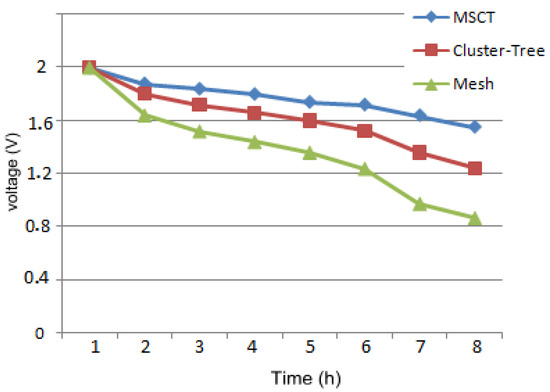
Figure 10.
Average voltage of the designed sensor node batteries according to time and topology.
Figure 11 presents the second result where we compare the average energy consumptions for the two nodes. This metric includes the average consumption of all components in the (transmitting) and (receiving) modes, and values are measured in milliamperes (mA). We plot this result for all types of devices; coordinator, routers and end-devices. Logically, the coordinator and the routers consume more energy than end-devices. We can deduce that the MSCT topology shows better results in terms of energy consumption compared with the other typical topologies of ZigBee. Note that in Figure 11, the acronyms “C-T” and “M” represent respectively cluster-tree and mesh topology.
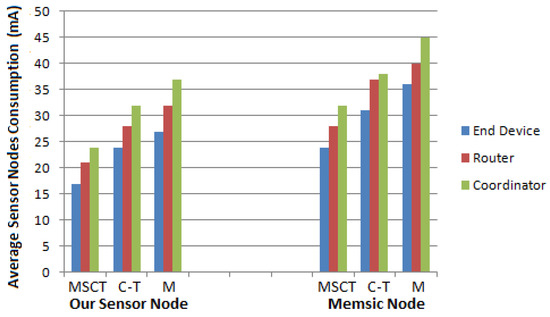
Figure 11.
Average of the power consumption of nodes according to hardware and topology. MSCT, minimum spanning cluster-tree; C-T, cluster-tree; M, mesh.
This result is very important since it shows also how energy consumption is reduced by our hardware device compared with the Memsic nodes. This can be explained by the fact that the devices used in our prototype have low power consumption. Furthermore, the size of packets has been reduced at the physical layer, which has positively impacted the computational costs, as well as the energy consumption of the nodes.
The next result shown in Figure 12 concerns the network’s lifetime, considered as the main result. We represent the lifetime with two metrics. The first one is the time until the first node dies (FND). The FND time is considered as a stability period for the network since there is a node that leaves the network during it. The second one is the total network’s lifetime that represents the time until there is no sensor node in the transmission range of the coordinator; this time is called the network’s lifetime (NL).
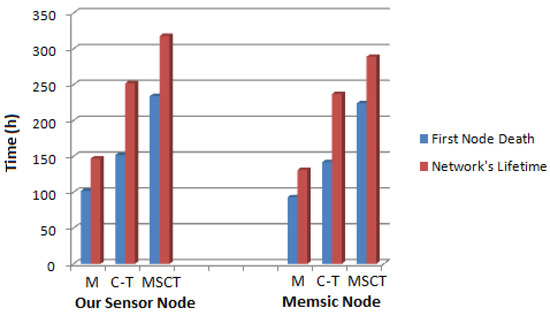
Figure 12.
First node dead and the network’s lifetime according to hardware and topology.
We can clearly deduce from this result that our designed sensor node, enhanced by the MSCT topology, considerably improve the network’s lifetime compared with Memsic nodes by reducing the energy consumption.
Finally, in order to evaluate the communication performances of the hardware, we measure the delivery of packets to the coordinator. We illustrate in Figure 13 the packet loss ratio according to hardware and topology.
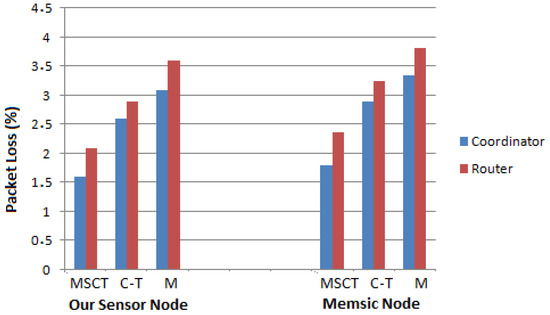
Figure 13.
Packet loss ratio according to hardware and topology.
We first deduce that the packet loss ratio is reduced by our designed sensor nodes compared with the Memsic nodes. This is explained by the efficiency of data processing offered by the Arduino platform and by the reduction of the packet size, which leads to the reduction of the dropping of packets in the router nodes.
We also note from Figure 13 that the MSCT topology reduces the packet loss ratio; this can be explained mainly by the minimal cost of transmissions and also because most of the parent nodes have a maximum of two children.
In summary, we deduce from the above experiments that the developed system significantly improves the energy consumption and the network’s lifetime. The combination of effective hardware architecture and MSCT topology has led to the minimization of the communications cost and the increase of the network’s performances.
6. Conclusions
Wireless sensor networks have been widely exploited in the last few decades in many application fields due to their promising features. However, most of the sensor nodes are equipped with limited batteries, which makes power a serious issue. Thus, energy saving and optimization becomes one of the major concerns in the wireless sensor networks’ hardware design and software programming.
In this paper, we developed the energy issue of an indoor sensing system based on the ZigBee network and presented as a solution our designed sensor nodes based on Arduino microcontrollers and ZigBee radio transceivers. The device showed good performances in terms of packet delivery, while maintaining a low power consumption. These results were enhanced by an energy-efficient cluster-tree topology called MSCT that reduced the transmissions cost of nodes by computing minimum spanning trees taking into consideration indoor conditions. The combination of the designed hardware and the developed topology showed very satisfactory results in terms of energy consumption and the network’s lifetime.
Author Contributions
In this work, Yassin El Hillali proposed the hardware architecture for the sensor node, and participated to the implementation of the physical and MAC layers in the sensor nodes. Atika Menhaj-Rivenq supervised the team work at Valenciennes and participated in the design of the hardware prototype. Mourad Ouadou integrated the circuit components to build the sensor node prototype, implemented the first network layers, and developed the proposed algorithms and implemented them into the system. Ouadoudi Zytoune participated in the implementation of the algorithm. Finally, Driss Aboutajdine supervised the working team in Rabat and validated results.
Conflicts of Interest
The authors declare no conflict of interest.
References
- Ulema, M. Wireless sensor networks: Architectures, protocols, and management. In Proceedings of the Network Operations and Management Symposium, Seoul, Korea, 19–23 April 2004. [Google Scholar]
- Bargh, M.S.; De Groote, R. Indoor Localization Based on Response Rate of Bluetooth Inquiries. In Proceedings of the First ACM International Workshop on Mobile Entity Localization and Tracking in GPS-Less Environments (MELT’08), San Francisco, CA, USA, 19 September 2008; pp. 49–54. [Google Scholar]
- Gomez, C.; Paradells, J. Wireless home automation networks: A survey of architectures and technologies. IEEE Commun. Mag. 2010, 48, 92–101. [Google Scholar] [CrossRef]
- Liu, H.; Darabi, H.; Banerjee, P.; Liu, J. Survey of wireless indoor positioning techniques and systems. IEEE Trans. Syst. Man Cybern. Part C Appl. Rev. 2007, 37, 1067–1080. [Google Scholar] [CrossRef]
- Shuaib, K.; Alnuaimi, M.; Boulmalf, M.; Jawhar, I.; Sallabi, F.; Lakas, A. Performance Evaluation of IEEE 802.15.4: Experimental and Simulation Results. J. Commun. 2007, 2, 29–37. [Google Scholar] [CrossRef]
- Alnuaimi, M.; Shuaib, K.; Jawhar, I. Performance Evaluation of IEEE 802.15.4 Physical Layer Using MatLab/Simulink. In Proceedings of the Innovations in Information Technology, Dubai, UAE, 19–21 November 2006. [Google Scholar]
- Melodia, T.; Pompili, D.; Akyildiz, I.F. On the interdependence of distributed topology control and geographical routing in ad hoc and sensor networks. IEEE J. Sel. Areas Commun. 2005, 23, 520–532. [Google Scholar] [CrossRef]
- Li, M.; Li, Z.; Vasilakos, A.V. A Survey on Topology Control in Wireless Sensor Networks: Taxonomy, Comparative Study, and Open Issues. Proc. IEEE 2013, 101, 2538–2557. [Google Scholar] [CrossRef]
- Microchip Technology Inc. MRF24J40 Data Sheet, IEEE 802.15.4, 2.4 GHz RF Transceiver ; Microchip Technology Inc.: Chandler, AZ, USA, 2010.
- Schubert, T.W.; D’Ausilio, A.; Canto, R. Using Arduino microcontroller boards to measure response latencies. Behav. Res. Methods 2013, 45, 1332–1346. [Google Scholar] [CrossRef] [PubMed]
- Ovalle-Martínez, F.J.; Stojmenović, I.; García-Nocetti, F.; Solano-González, J. Finding minimum transmission radii for preserving connectivity and constructing minimal spanning trees in ad hoc and sensor networks. J. Parallel Distrub. Comput. 2005, 65, 132–141. [Google Scholar]
- Sahbani, H.; El Marraki, M. Ennumeration of the Number of Spanning Trees in the Lantern Maximal Planar Graph. Appl. Math. Sci. 2014, 8, 3661–3666. [Google Scholar] [CrossRef]
- Khuller, S.; Raghavachari, B.; Young, N. Balancing minimum spanning trees and shortest-path trees. Algorithmica 1995, 14, 305–321. [Google Scholar] [CrossRef]
- Gallager, R.G.; Humblet, P.A.; Spira, P.M. A distributed algorithm for minimum-weight spanning trees. ACM Trans. Program. Lang. Syst. 1983, 5, 66–77. [Google Scholar] [CrossRef]
- Gabow, H.N.; Galil, Z.; Spencer, T.; Tarjan, R.E. Efficient algorithms for finding minimum spanning trees in undirected and directed graphs. Combinatorica 1986, 6, 109–122. [Google Scholar] [CrossRef]
- Kruskal, J.B. On the shortest spanning subtree of a graph and the traveling salesman problem. Proc. Am. Math. Soc. 1956, 7, 48–50. [Google Scholar] [CrossRef]
- Howitt, I.; Gutierrez, J. IEEE 802.15.4 low rate-wireless personal area network coexistence issues. In Proceedings of the 2003 IEEE Wireless Communications and Networking (WCNC 2003), New Orleans, LA, USA, 16–20 March 2003; Volume 3, pp. 1481–1486. [Google Scholar]
- Baronti, P.; Pillai, P.; Chook, V.W.; Chessa, S.; Gotta, A.; Hu, Y.F. Wireless sensor networks: A survey on the state of the art and the 802.15.4 and ZigBee standards. Comput. Commun. 2007, 30, 1655–1695. [Google Scholar] [CrossRef]
- Wang, C.; Sohraby, K.; Li, B.; Daneshmand, M.; Hu, Y. A survey of transport protocols for wireless sensor networks. IEEE Netw. 2006, 20, 34–40. [Google Scholar] [CrossRef]
- Akyildiz, I.F.; Wang, X. A survey on wireless mesh networks. IEEE Commun. Mag. 2005, 43, S23–S30. [Google Scholar] [CrossRef]
- Huang, Y.K.; Pang, A.C.; Hsiu, P.C.; Zhuang, W.; Liu, P. Distributed throughput optimization for zigbee cluster-tree networks. IEEE Trans. Parallel Distrib. Syst. 2012, 23, 513–520. [Google Scholar] [CrossRef]
- Koubaa, A.; Cunha, A.; Alves, M. A time division beacon scheduling mechanism for IEEE 802.15.4/ZigBee cluster-tree wireless sensor networks. In Proceedings of the 19th Euromicro Conference on Real-Time Systems (ECRTS’07), Pisa, Italy, 4–6 July 2007; pp. 125–135. [Google Scholar]
- Cuomo, F.; Della Luna, S.; Cipollone, E.; Todorova, P.; Suihko, T. Topology formation in IEEE 802.15.4: Cluster-tree characterization. In Proceedings of the Sixth Annual IEEE International Conference on Pervasive Computing and Communications (PerCom 2008), Hong Kong, China, 17–21 March 2008; pp. 276–281. [Google Scholar]
- Barrett, S.F.; Pack, D.J. Atmel avr microcontroller primer: Programming and interfacing. Synth. Lect. Digit. Circuits Syst. 2002, 7, 1–244. [Google Scholar] [CrossRef]
- Sadoudi, L.; Biaou, U.; Bocquet, M.; Rivenq, A. Modeling of ZigBee (IEEE 802.15.4) channel in rail environment for intelligent transport. In Proceedings of the 2015 4th IEEE International Conference on Advanced Logistics and Transport (IEEE ICALT 2015), Valenciennes, France, 20–22 May 2015. [Google Scholar]
- Seidel, S.Y.; Rappaport, T.S. 914 MHz path loss prediction models for indoor wireless communications in multifloored buildings. IEEE Trans. Antennas Propag. 1992, 40, 207–217. [Google Scholar] [CrossRef]
- Lott, M.; Forkel, I. A multi-wall-and-floor model for indoor radio propagation. In Proceedings of the VTC 2001 Spring IEEE VTS 53rd Vehicular Technology Conference, Rhodes, Greece, 6–9 May 2001; Volume 1, pp. 464–468. [Google Scholar]
© 2017 by the authors. Licensee MDPI, Basel, Switzerland. This article is an open access article distributed under the terms and conditions of the Creative Commons Attribution (CC BY) license (http://creativecommons.org/licenses/by/4.0/).