Abstract
In this paper, we have presented a novel transmission protocol which is suited for battery-powered sensors that are worn by a patient when under medical treatment, and allow constant monitoring of health indices. These body-wearable sensors log data from the patient and transmit the data to a base-station or gateway, via a wireless link at specific intervals. The signal link quality varies because the distance between the patient and the gateway is not fixed. This may lead to packet drops that increase the energy consumption due to repeated retransmission. The proposed novel transmission power control protocol combines a state based adaptive power control (SAPC) algorithm and an intelligent adaptive drop-off algorithm, to track the changes in the link quality, in order to maintain an acceptable Packet success rate (PSR)(~99%). This removes the limitation of the SAPC by making the drop-off rate adaptive. Simulations were conducted to emulate a subject’s movement in different physical scenarios—an indoor office environment and an outdoor running track. The simulation results were validated through experiments in which the transmitter, together with the sensor mounted on the subject, and the subject themselves were made to move freely within the communicable range. Results showed that the proposed protocol performs at par with the best performing SAPC corresponding to a fixed drop-off rate value.
1. Background Work
The emergence of Internet of Thing (IoT) has enabled technological capabilities to exchange data and to create a healthcare system that is efficient in terms of time, energy and cost [1]. In healthcare, body wearable sensors are used to continuously monitor the vital physiological parameters of patients in hospitals and the elderly at home, allowing them to enjoy independent living [2]. Hospitals use IoT to monitor the location of medical devices, personnel and patients. The healthcare professionals are then able to use data to create a system of proactive management with this network of devices. At the same time, such procedures are effective and are cost-effective ways of monitoring age-related illnesses [3]. For example, one Texas hospital reportedly cut the re-admission rate for patients with heart failures by 50% using predictive analysis of their individual healthcare records [4].
There have been significant developments in building body wearable sensors that have low computational complexity, require little memory storage, and can be suitably implemented using simple hardware. For example, Shih-Hong Li et al. have designed a wearable sensor to detect real time wheezing [5]. In the field of medicine, the wheezing sound is usually considered as an indicator of the degree of airway obstruction. In [6], authors have developed a wearable instrumented vest for posture monitoring, especially for aged people. The vest provides a portable and low-cost solution that can be used indoors and outdoors to provide long-term care at home. The recognition abilities of accelerometer-based detection and activity monitoring can help in assessing rheumatic and musculoskeletal diseases [7]. There are several other examples of similar research and development studies that are shifting the paradigm of patient care and welfare.
Figure 1 shows a simple representation of a wireless sensor network application used in healthcare. The body-wearable and implanted sensors collect vital health parameters such as the pulse rate, EEG, blood insulin level etc., and transmit to the gateway. The gateway that is shown in Figure 1 can be with the person or with the access point.
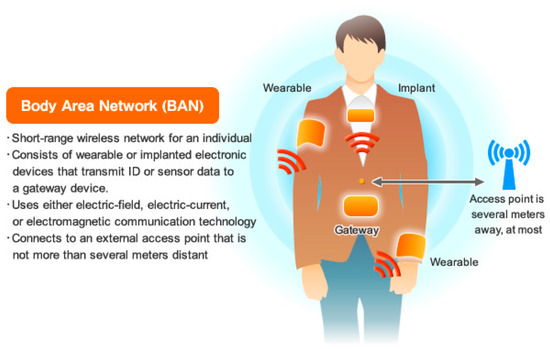
Figure 1.
A body area network with sensors connects with the access point via a gateway [8,9].
Data communication, not just data collection, is an important component to build such success stories. When independent living is considered, the healthcare solution should be such that the monitored person is able to move seamlessly within the house with minimum loss of data. In order to support such a scenario, the transmitting module of the body wearable sensors should adapt with the changing radio link quality. Therefore, the radio transmitter must keep track of the changing environment so that the transmission power can be adjusted for reliable transmission [10].
There are several adaptive transmission protocols that modulate output power to meet the target Eb/N0 and save energy at the same time. In particular, this paper focuses on the state-based adaptive power control protocol (SAPC) that uses an intelligent algorithm to transmit data in an energy efficient manner [11]. This protocol has been compared with fixed power transmission and other adaptive protocols that use RSSI (received signal strength indication) to estimate link quality and set the transmission power [11,12,13,14]. Simulation and experimental results have shown that SAPC can save up to 33% energy. One drawback of the SAPC protocol is that the performance is dependent on the fixed drop-off factor (R) and that it does not maintain any target PSR (packet success rate). The value of R does not adapt to the changing link quality during run time. In this paper, we propose an alternative solution to the existing SAPC that removes these limitations by maintaining a target PSR. This is done by modulating the value of the drop-off factor (R) based on the evaluated PSR and occurs after a designated number of transmissions.
2. Description of the Adaptive Algorithm
The adaptive algorithm consists of two components. The first component controls the value of the drop-off rate (R) depending on the current packet error rate. It maintains a window (typically set to 50 transmissions) during which it uses a fixed R value. At the end of the window interval, the PSR is calculated. If the PSR is less than the target PSR, then the R value is decremented by 0.05. The lower limit to which R can go down is set to be 0. The reason to reduce the drop-off rate is to delay the system switching to a lower state so that the PSR is maintained at a target level.
On the other hand, if the PSR is greater than or equal to the target PSR, the R value is incremented by 0.05. The uppermost value that R can reach is limited to 1. In either case, the algorithm uses the new R value for all packet transmissions during the windowed interval.
The second component of the algorithm can be referred to as the inner component that follows the adaptive algorithm of SAPC [12]. SAPC is a state-based adaptive power control algorithm. In each state, the power levels are configured in an increasing order of magnitude.
Table 1 shows the power levels based in these states. In the experiments that follow the simulation, the nRF24L01p radio modules have been used. This radio module has four programmable output power levels. They are 0 dBm, −6 dBm, −12 dBm and −18 dBm. The state transition model can be extended to any number of states, depending on the available power levels of the particular radio module. As the number of states grows, the algorithm can become computationally expensive. It is therefore advisable to choose power levels with a difference of approximately 5 dB in between them.

Table 1.
States, power levels and retry limits.
Figure 2 shows the state transition diagram of the adaptive power control algorithm. State transition occurs depending on the power level at which the transmission is successful or has failed.
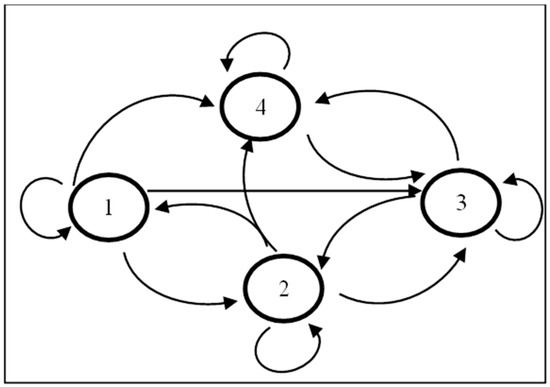
Figure 2.
State transition diagram of the adaptive algorithm.

Table 2.
State transition matrix when state levels go up [12,13].

Table 3.
State transition matrix when state levels go down [12,13].
2.1. Choice of Hardware
For experimental purposes, nRF24L01p transceiver modules from Nordic semiconductors have been used. The transceiver module at the gateway or hub has an additional power amplifier (PA) and a low-noise amplifier (LNA). The output power level of the receiver is 20 dBm. The reason for using a high power transmitter at the hub is to ensure near error-free communication between the hub and the sensor. The major specifications of the receiver and the transmitter are presented in Table 4 and Table 5 respectively.

Table 4.
Features of nRF24L01p receiver [15].

Table 5.
Features of nRF24L01p transmitter [16].
A set of heart rate data from PhysioNet is preloaded into the transmitter module and set to transmit after every 2 s [17,18]. Physionet has a huge repository of human physiological data and can be downloaded from their web-based application. These values are chosen to make the target mobile scenario as realistic as possible.
2.2. Evaluation Parameters
The evaluation parameters are
- Mean cost of successful transmission (Cmean)
- Protocol efficiency [19]
One of the parameters for optimization is the energy consumed per useful bit transmitted over a wireless link [20,21]. This paper has used the following Equation (1) to evaluate Cmean.
where CTotal = Sum of the cost of all transmissions; PL = Total lost packets; PS = Total packets to send.
The protocol efficiency (Proteff) includes the average number of retries [20]. Mathematically,
where RetT = Sum of all retries.
Here PS − PL = total successes (Psucc). In % form, it is represented by Equation (3) when both the numerator and denominator in Equation (2) are divided by the total number of packets to send (Ps).
where Retmean = mean retries per packet and is defined as
Here,
3. Simulation Design and Result
Two sets of simulations were conducted to capture two different geometrical spaces. In the first set, an indoor office environment was considered. A subject was fitted with wearable sensors, and the locations of the subject were divided into a docked position, and a number of undocked positions with respect to the base station. The docked position is defined as the location where the subject mostly stays. Occasionally, the subject changes location when he/she moves out of the docked position, for example, to visit the washroom, collect printouts, get a drink etc. This results in variable radio link conditions because of the change in the distance between the base station and the sensors, and also because the signal has to travel through intervening walls. In the second set, an outdoor environment was considered where the subject is assumed to be an athlete, and different health indices were monitored while she/he runs. An outdoor Olympic size running track was considered with the base station at the center of the field, and the subject running at an average speed along the track.
3.1. Results and Discussion—Simulation Set 1
We considered the average speed of the subject as 5 km/h and the sensors transmitting data every 2 s. Therefore, the distance covered during the 2 s was approximately 3 m. The maximum distance between the sensors and the gateway was chosen as 20 m. Therefore, the various undocked positions from the gateway were taken to be 8 m, 11 m, 14 m, 17 m and 20 m. There are partitions in between the transmitter and the receiver and the path loss (in dB) has been accounted for when the average Eb/N0 is calculated. Each of this position is considered as a state and the state transition follows a Markov process [22]. A Markov process has the following properties:
- The number of possible states is finite.
- The outcome at any stage depends only on the outcome of the previous stage.
- The probabilities are constant over time.
In the emulated walk model that is shown in Figure 3, the number of states is finite and the transition probabilities are constant over time. The state transition depends only on the current state, or on the location of the subject. For example, if the subject is in state or position B, then his/her next state transition to either A or C would only depend on B and not on any other previous states. The probability of remaining in the docked state, given it is in the docked state is 0.7. The probability of transiting to an undocked position, given the subject is in docked position, is 0.3. The subject does not remain in an undocked state, but transits to a new state with certain probability. No transmission happens during the transitions. This state transition model was built on the assumption that the subject is moderately active. The state transition probabilities are listed in Table 6.

Figure 3.
A state transition model that emulates the movement of a subject with the states defining the position from the receiving base station.

Table 6.
State transition table of the emulated walk that follows the Markov process—Activity level: Moderate.
The simulation was conducted in Maltab and the parameters are presented in Table 7.

Table 7.
Simulation parameters with Matlab.
Figure 4 shows that for the same PSR of >99%, the proposed S-ATPC protocol can provide a unified, energy-efficient solution, while maintaining the same protocol efficiency as SAPC with different drop-off (R) values. The transition probabilities of the different states in Table 4 also represent the activity levels of an individual. Based on these probability values, the activity level was categorized as moderately active. We changed the transition probability values in Table 4 to introduce more activeness. The transition probability values were changed so that the subject stays away from the base station more often. Table 6 and Table 7 represent the transition probability matrices for which the performances are plotted in Figure 5 and Figure 6 respectively.
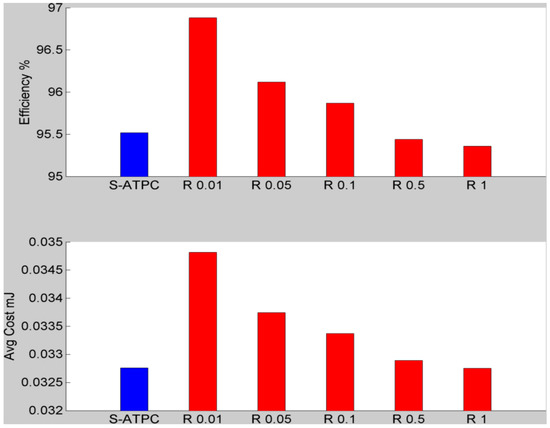
Figure 4.
Activity level: moderate—the protocol efficiencies and the average cost of success transmissions are compared when the PSR for all the cases are equal to 100%.
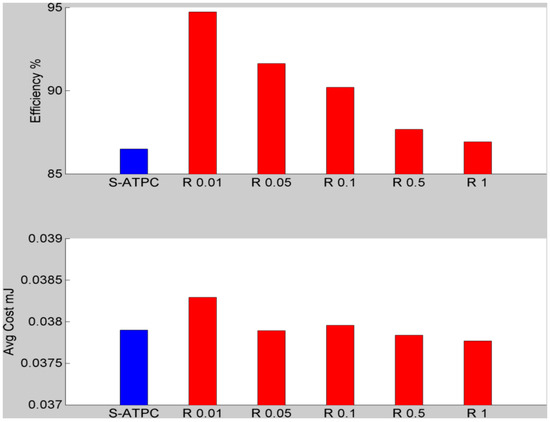
Figure 5.
Activity level: Uncertain—the protocol efficiencies and the average cost of success transmissions are compared when the PSR for all the cases are equal to 99%.
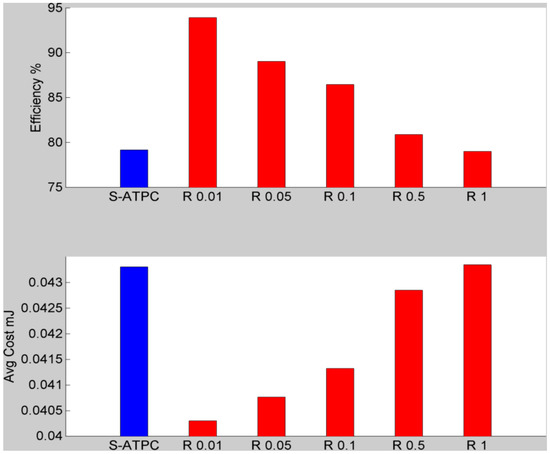
Figure 6.
Activity level: High—the protocol efficiencies and the average cost of success transmissions are compared when the PSR for all the cases are equal to 99%.
The values in Table 8 suggest that state transitions occurred with 50% probability. Compared to the simulation scenario based on Table 6, the subject was spending more time on average away from the base station. Therefore, the average cost per successful transmission was also greater in comparison to the first scenario. However, was observed from Figure 5 that S-ATPC performs comparably in terms of energy savings.

Table 8.
State transition table of the emulated walk that follows Markov process—Activity level: Uncertain.
Table 9 suggests that the subject was highly active, as they were transiting to undocked states more frequently than in the second scenario. The average cost of successful transmission at different R values in Figure 6 suggested that when R is low, the energy saving is the maximum. This was expected because a low R value keeps the system more often in the higher power state and provides best performance when the subject is more often in undocked states (indicating higher link distance and therefore poorer channel condition). The cost of successful transmission corresponding to SATPC was within 7% of that of when R = 0.01.

Table 9.
State transition table of the emulated walk that follows Markov process—Activity level: High.
The steady state distributions of the states under the three scenarios are plotted in Figure 7. A more active scenario means that the subject stays more often in undocked scenarios and away from the base station.
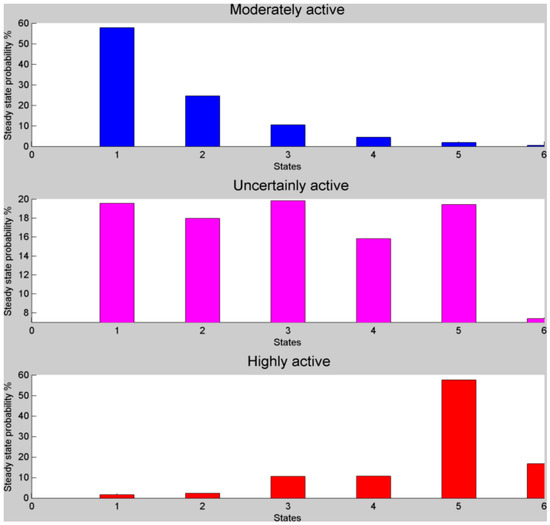
Figure 7.
Steady state distribution of the different states under the three activity scenarios.
3.2. Results and Discussion—Simulation Set 2
In this simulation, the subject ran at an average speed of 24 km/h around a track (shown in Figure 8), and transmits data every second. Therefore, in terms of distance, the body wearable sensors transmitted after an approximate distance of 7 m. Since the size of the track is not circular, the distance varied with time.
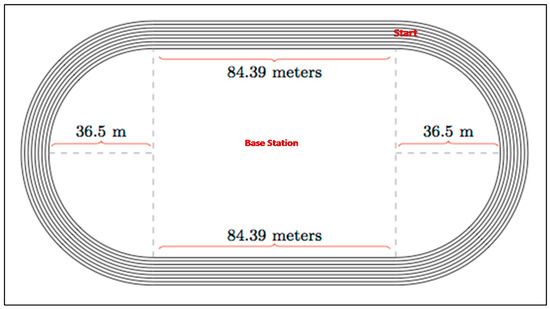
Figure 8.
Shape and dimension of a standard Olympic track.
In this simulation, free space path loss model was considered, and a Rician fading channel model was used, as there was at least one direct line-of-sight path between the transmitting sensors and the receiver (gateway) [24]. The available power levels of the transmitter were changed to 0 dBm, 5 dBm, 10 dBm and 15 dBm, as the distance between the transmitter and the gateway is higher than the indoor scenario. Transmission power below 0 dBm does not result in any meaningful communication. However, for the sake of simplicity, the current consumptions corresponding to the power levels remained the same. This may not be practical, but the RF modules nRF24L01p does not support power levels above 0 dBm. This however did not affect the overall objective of the simulation, as the protocols were compared to in terms of their energy consumptions, and individual energy usage was not a concern.
The result of the simulation is presented in Figure 9. The efficiency values were comparable, with the cost of successful transmission of the proposed protocol (S-ATPC) being less than the average cost for SAPC when R = 1. This result again indicated that if SAPC can be modified with a single R value that adapts with the changing radio link condition, we can achieve desirable energy savings per successful transmission.
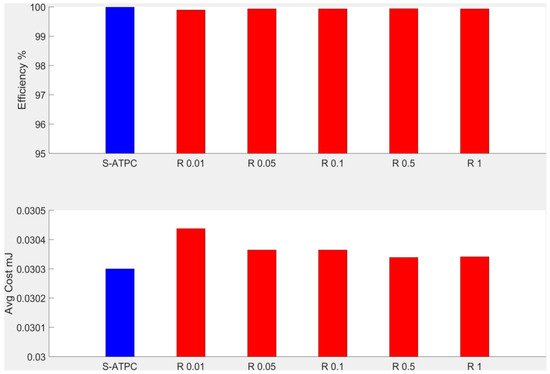
Figure 9.
The protocol efficiencies and the average cost of success transmissions are compared when the PSR for all the cases are equal to 100%.
4. Experimental Method and Results
In this section, the experimental methodology and the results are presented.
4.1. Experimental Methodology
The experimental setup was a university building with the base station powered by mains, while the transmitting sensor was piggybacked on the subject. The subject was allowed to roam freely inside the building and his routine activities were followed. The traversal path of the sensor is shown in Figure 10.
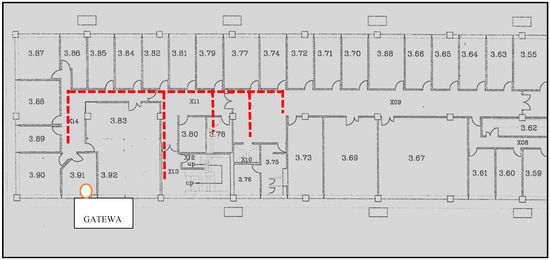
Figure 10.
Traversal path of the sensor is shown in dotted red line. The distance between the sensor and the gateway is not constant.
Data was collected for a period of approximately two hours on different days of the week. The sensor transmitted packet data every 2 s. The average of five such runs was used and is presented in this paper.
4.2. Experimental Results
The results are tabulated in Table 10, and the bar diagram is shown in Figure 11. The plots show that for a target PSR of 99%, the proposed S-ATPC can deliver an energy efficient solution that is comparable with that of SAPC at R that corresponds to minimum energy consumption.

Table 10.
Experimental results.
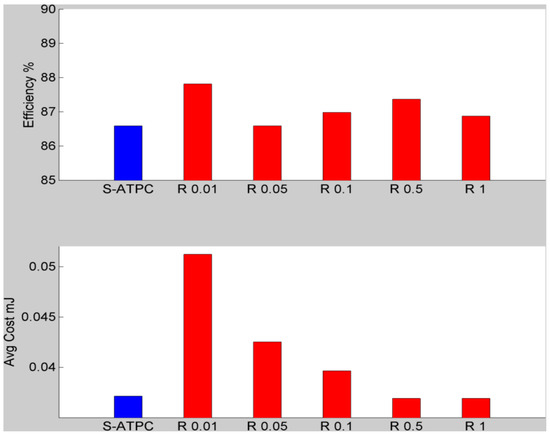
Figure 11.
Experimental results: The protocol efficiencies and the average cost of success transmissions are compared when the PSR for all the cases are equal to 99%.
5. Conclusions
The results of the simulations and the experiments suggest that we have a new adaptive transmission power control protocol in place, which can be implemented in mobile wireless sensor scenarios. The efficacy of the protocol has been demonstrated by two sets of simulation results in two different environments. The proposed protocol will work well in scenarios when the activity of the subject under question is moderately high. In general, the protocol is well suited for mobile sensors. This will introduce a new paradigm in the adaptive transmission domain, as this approach is unique and tested in a variable real world environment where not only the distance between the sensor and the base station affects the link quality, but also fading, due to multipath propagation of complex indoor environment and movements of other people within the vicinity of the sensors. The outdoor environment is comparably less complex, with a direct line of sight. The proposed protocol will also be tested in other outdoor environments as part of future research plans.
Acknowledgments
I acknowledge the contribution of my supervisors for their support and guidance to develop this research paper. I also acknowledge Massey University for funding the cost of publication, if accepted.
Author Contributions
Debraj Basu is the primary author of the paper and has done all the experimental work and analysis to support the various observations. Gourab Sen Gupta, Giovanni Moretti, and Xiang Gui are the research supervisors who have contributed with their ideas and direction to facilitate the research and develop the research paper.
Conflicts of Interest
The authors declare no conflict of interest.
References
- Christopher, G. Internet of Things in Healthcare: What’s Next for IoT Technology in the Health Sector. Available online: http://www.computerworlduk.com/iot/iot-centred-healthcare-system-3643726/ (accessed on 15 October 2016).
- Darwish1, A.; Hassanien, A.E. Wearable and Implantable Wireless Sensor Network Solutions for Healthcare Monitoring. Sensors 2011, 11, 5561–5595. [Google Scholar] [CrossRef] [PubMed]
- Ko, J.; Lu, C.; Srivastava, M.B.; Stankovic, J.A.; Welsh, A.T.M. Wireless Sensor Networks for Healthcare. Proc. IEEE 2010, 98, 1947–1960. [Google Scholar] [CrossRef]
- There Are Two Major Challenges to Implementing IoT Solutions in Healthcare. Business Insider Intelligence. 13 July 2016. Available online: http://www.businessinsider.com/there-are-two-major-challenges-to-implementing-iot-solutions-in-healthcare-2016-7/?r=AU&IR=T (accessed on 15 August 2016).
- Li, S.; Lin, B.; Tsai, C.; Yang, C.; Lin, B. Design of Wearable Breathing Sound Monitoring System for Real-Time Wheeze Detection. Sensors 2017. [Google Scholar] [CrossRef] [PubMed]
- Lin, W.; Chou, W.; Tsai, T.; Lin, C.; Lee, M. Development of a Wearable Instrumented Vest for Posture Monitoring and System Usability Verification Based on the Technology Acceptance Model. Sensors 2016, 16. [Google Scholar] [CrossRef] [PubMed]
- Billiet, L.; Swinnen, T.W.; Westhovens, R.; de Vlam, K.; van Huffel, S. Accelerometry-Based Activity Recognition and Assessment in Rheumatic and Musculoskeletal Diseases. Sensors 2016, 16, 2151. [Google Scholar] [CrossRef] [PubMed]
- Renesas Solutions for Wireless Sensor Networks—Part 2: Body Area Networks. Available online: http://in.renesas.com/edge_ol/features/08/index.jsp (accessed on 19 November 2016).
- Alemdar, H.; Ersoy, C. Wireless sensor networks for healthcare: A survey. Comput. Netw. 2010, 54, 2688–2710. [Google Scholar] [CrossRef]
- Shnayder, V.; Chen, B.; Lorincz, K.; Jones, T.R.F.F.; Welsh, M. Sensor Networks for Medical Care; Technical Report TR-08-05; Division of Engineering and Applied Sciences, Harvard University: Cambridge, MA, USA, 2005. [Google Scholar]
- Basu, D.; Gupta, G.S.; Moretti, G.; Gui, X. Protocol for improved energy efficiency in wireless sensor networks to support mobile robots. In Proceedings of the 6th International Conference on Automation, Robotics and Applications (ICARA), Queenstown, New Zealand, 17–19 February 2015; pp. 230–237.
- Basu, D.; Gupta, G.S.; Moretti, G.; Gui, X. Performance comparison of a novel adaptive protocol with the fixed power transmission in wireless sensor networks. J. Sens. Actuator Netw. 2015, 4, 274–292. [Google Scholar] [CrossRef]
- Basu, D.; Gupta, G.S.; Moretti, G.; Gui, X. Performance comparison of a new non-RSSI based transmission power control protocol with RSSI based methods: Experimentation with real world data. Int. J. Eng. Technol. Innov. 2016, 6, 30–54. [Google Scholar]
- Basu, D.; Gupta, G.S.; Moretti, G.; Gui, X. Effectiveness of a novel power control algorithm in heart rate monitoring of a mobile adult: energy efficiency comparison with fixed power transmission. Int. J. Sens. Netw. Data Commun. 2016, 5. [Google Scholar] [CrossRef]
- 2.4G Wireless nRF24L01p with PA and LNA. Available online: http://www.elecfreaks.com/wiki/index.php?title=2.4G_Wireless_nRF24L01p_with_PA_and_LNA (accessed on 15 November 2016).
- nRF24L01+ Single Chip 2.4GHz Transceiver Product Specification v1.0. Available online: http://www.nordicsemi.com/eng/Products/2.4GHz-RF/nRF24L01P (accessed on 15 November 2016).
- PhysioNet. Available online: https://physionet.org/ (accessed on 20 September 2016).
- Moody, G.B. RR Intervals, Heart Rate, and HRV Howto. Available online: https://physionet.org/tutorials/hrv/#hr-extraction (accessed on 20 September 2016).
- Zhang, D.; Zhu, Y.; Zhao, C.; Dai, W. A new constructing approach for a weighted topology of wireless sensor networks based on local-world theory for the Internet of Things (IOT). Comput. Math. Appl. 2012, 64, 1044–1055. [Google Scholar] [CrossRef]
- Sheu, J.P.; Hsieh, K.Y.; Cheng, Y.K. Distributed Transmission Power Control Algorithm for Wireless Sensor Networks. J. Inf. Sci. Eng. 2009, 25, 1447–1463. [Google Scholar]
- Schmidt, D.; Berning, M.; Wehn, N. Error correction in single-hop wireless sensor networks—A case study. In Proceedings of the Conference & Exhibition of Design, Automation & Test in Europe, Nice, France, 20–24 April 2009; pp. 1530–1591.
- Husen, B. Markov Processes. Available online: https://people.math.osu.edu/husen.1/teaching/571/markov_1.pdf (accessed on 20 July 2016).
- Universal Mobile Telecommunications System (UMTS). Selection Procedures for the Choice of Radio Transmission Technologies of the UMTS (UMTS 30.03 Version 3.1.0); UMTS: 2011. Available online: http://www.etsi.org/deliver/etsi_tr/101100_101199/101112/03.01.00_60/tr_101112v030100p.pdf (accessed on 19 July 2016).
- Jain, R. Channel Models A Tutorial1, V1.0 February 21, 2007. Available online: http://www.cse.wustl.edu/~jain/cse574-08/ftp/channel_model_tutorial.pdf (accessed on 25 November 2016).
© 2017 by the authors. Licensee MDPI, Basel, Switzerland. This article is an open access article distributed under the terms and conditions of the Creative Commons Attribution (CC BY) license ( http://creativecommons.org/licenses/by/4.0/).