1. Introduction
Accidents on highways are one of the major sources of loss of life in modern society. Significantly more lives have been lost in highway accidents than in terrorism or wars. Part of the reason for this is that Americans spend a significant time on the roads—the average commute is 30 min (NHTSA) [
1] (check). Any technology that makes driving safer, faster or cheaper would have a significant human and commercial impact. Whereas, in recent years, significant research focus (and press coverage) has been dedicated to self-driving vehicles, there is no imminent transition to fully self-driving infrastructure. In fact, fully autonomous vehicles are not legal for highway driving—they require human supervision. Even if fully autonomous vehicles become commercially available in the next decade, the vast majority of vehicles on the highway will remain human-controlled, with the mix of vehicles changing only gradually towards more autonomy. What we are going to see, in the foreseeable future, is a mix of vehicles with various sensing, actuation and communication technologies, and various degrees of automation based on these. Just like with today’s cars, drivers will have a choice of turning on or off these technologies, as well as reacting or not to messages coming from them.
It is quite possible that this proliferation of technology mixtures will make driving in the following decades even more unpredictable and cognitively challenging than in the current situation, where uncertainty arises only from the driver’s behavior.
To understand the traffic of the future, the only feasible approach is to study it through the means of simulation.
In order to define a standardized set of rules, it is vital to collect a large number of statistics. In the real world, this is a very tedious task to accomplish. For example, data published by the National Highway Traffic Safety Administration (NHTSA) [
2] is based on the observation of one hundred drivers’ (100) road experiences during a 12-month period of time, but this sample is too small order to formulate a standard set of rules.
This is where the modeling and simulation comes into play [
3,
4,
5,
6,
7,
8]. Simulation is performed when conducting experiments on real systems would be impossible or impractical. Furthermore, through conducting simulations [
9,
10,
11], it is possible to generate a large amount of data with several permutations and combinations with respect to multiple attributes for analytical purposes.
In order to understand the impact of a new technology, we need to study it through a simulation that models not only the technology itself, but the overall environment, visibility, traffic structure as well as the cognitive state, reaction time and so on of the drivers.
It is not enough to model where a vehicle is and how fast it moves. We need to model the surrounding vehicles, what each of the drivers know, their decision making processes, and their low-tech and high-tech means to communicate with each other.
To illustrate that all these factors need to be taken into consideration, let us consider the case of side-sweep accidents, which will be the running subject of the remainder of this paper.
Why do side-sweep accidents occur? In the simplest approximation, the cause of the accident is lack of awareness—the driver of the lane changing vehicle is not aware that there is a blocking vehicle in the other lane. This lack of awareness might be due to either the driver neglecting to check the appropriate side mirror, or because the blocking vehicle was in the driver’s blind spot. The accident might also be due to a misprediction that the driver might have seen the blocking vehicle, but judged that, at the moment of the lane change, the vehicle would be safely behind it. This misprediction might be due to a misjudgment of the relative speed of the vehicles, or because the blocking vehicle had accelerated since the most recent sighting.
Moving towards more complex causes, a possible cause of the side-sweep accident might be failure of communication. The lane changing vehicle might have communicated its intention to change lanes, either with the turning lanes or vehicle to vehicle (V2V) communication, but this signal had not been seen or received by the blocking vehicle.
Finally, the cause of the accident might be incorrect mental modeling. The lane changing driver might judge that the blocking vehicle’s driver will slow down to give way, but instead, that driver chooses to accelerate, relying on the lane changing driver seeing him and abandoning the action.
Overall, we conclude that side-sweep accidents can have complex sources. Technological solutions, such as sensor improvements and V2V communication can improve several steps of this process, but they will always need to be seen as playing a specific part of a system. Our objective in this paper is to present the design of a simulator that takes into account all the factors of the lane change scenario. We will then use this simulator to study the potential of technological solutions such as V2V communication in reducing the frequency of the side-sweep accidents.
The remainder of this paper is organized as follows. In
Section 2, we discuss in detail the physical, communicatory and cognitive setup under which a lane change event takes place, and we describe the design of our simulator that takes these factors into consideration.
Section 3 describes a series of simulation studies that assume various scenarios and mixtures of vehicles with various technological enhancements. The results of these simulations are then analyzed for the benefits and drawbacks of various technologies. We conclude in
Section 4.
2. The Physical and Cognitive Context of a Lane Change
Side-sweep accidents occur during driving on multi-lane highways when a vehicle initiates a lane change and when a follower vehicle is blocking the other lane. Side-sweep accidents lead to a side collision, but the resulting loss of control can create further collisions [
12,
13]. Side-sweep accidents account for 4%–10% of all crashes [
14,
15,
16,
17].
The immediate cause of the side-sweep accident is the incorrect decision made by the driver of the lane changing vehicle, and the cause of this incorrect decision is lack of information: the driver does not know about the blocking vehicle. To avoid side-sweep crashes, drivers are instructed to ensure that there is no blocking vehicle by visual inspection, looking both through the rear view and side mirrors as well as turning his or her head in the direction of the target lane [
18].
Let us now investigate why the driver might not be aware of the blocking vehicle. The simplest explanation is that the driver did not look or check the mirrors. NHTSA research revealed that 17% of drivers failed to check their left mirrors, left windows, and center mirrors during the last 8 s prior to initiating a left-lane change. Furthermore, 36% of drivers failed to check their right mirrors, right windows, and center mirrors during the last 8 s prior to initiating a right-lane change [
2,
19,
20].
Even for drivers who do check the mirrors, a significant number do not make a strong effort to turn their head and make a visual inspection. As many vehicles have significant blind spots, it is possible that the blocking vehicle exists even if it does not show up in the mirror [
21]. The size of the blind spot depends on the geometry of the vehicle, the size and adjustment of the mirrors, as well as whether other means of inspecting the target lane (such as side-view cameras or blind spot sensors).
Another factor comes into the picture when we consider that conditions might change between the last time a driver looked at the target lane versus when the lane change is initiated. For instance, an accelerating vehicle might enter into the blocking zone without the driver being aware of it. The ability to accurately assess whether the lane will be free at the moment of the initiation of the lane change requires that the driver makes a prediction of the way that the traffic will evolve. This prediction might be impaired in conditions of poor visibility and drowsiness [
22,
23]. Visibility can be impacted by the factors such as atmospheric conditions and the blind spots [
24]. Enhancing driver attention and minimizing the size of the blind spots of cars can help overcome lack of visibility issues [
25]. Another way to monitor drowsiness is proposed by integrating intelligent control systems into vehicles to include the human driver control loop [
22].
2.1. Reducing the Number of Side-Sweep Accidents
There are several ways in which the number of side-sweep accidents can be reduced [
26,
27,
28].
Early warning systems improve the driver’s awareness of potential blocking vehicles or obstacles [
29]. Systems such as side detection sensors recognize objects on either side of the vehicle and alert drivers of the presence of vehicles during lane changes to avoid side-sweep accidents [
30,
31,
32]. For these systems, it remains the responsibility of the driver to make a correct decision, such as canceling the lane change.
Another class of systems,
early intervention systems, provide limited automatic assistance to the driver by intervening even
after the decision has been made [
33,
34,
35,
36,
37,
38,
39]. This assistance may be in the form of slowing the vehicle to a stop and/or controlling steering to help the driver stay in the proper lane.
Another important class of methods for reducing the number of side-sweep accidents is by improving the coordination and communication between drivers. This communication does not necessarily need to be mediated through technology. By using its turning lights, the driver can communicate his intention to change lanes to the following vehicles. Following vehicles can also infer this intention from implicit means from the behavior of the driver. Communication in the other direction is also possible: the blocking vehicle might warn the driver initiating a dangerous lane change by honking.
These communication means might not always work. The fault may be with the initiator (neglecting to use or deploying the lane change signals too late), or with the fault of the receiver (not noticing or ignoring the lane change signal). Even if communication was successfully received, this might not amount to a clear agreement for the procedure to follow. The signaling driver might expect that the following driver might slow down and give way upon receipt of the signal, while the driver of that vehicle might choose to accelerate instead.
V2V communications are novel networking technologies that extend traditional means of communication between vehicles. V2V technologies might enable many novel driving behaviors such as convoy formation [
40]. For the purpose of this paper, we will restrict our attention to communication between the lane changing and the follower vehicle. The first advantage of V2V communication is that it allows more information to be transferred than the single-bit turning signals. Furthermore, V2V communication can ensure that a transmission has been received by the destination vehicle (although this might not guarantee that the driver of the vehicle receives and also understands the signal).
As with any communication technologies, V2V communication does not guarantee that the appropriate actions for the avoidance of the accident will be made. To perform lane changes safely and quickly, ideally coordinated action from both the lane changing and the following vehicle is needed. However, as new technologies are adapted only gradually by drivers, it is likely that, in the foreseeable future in most encounters, only one of the vehicles will be augmented with automated response technology. As we shall see in our experiments, even this might improve the accident rate.
2.2. Simulation Requirements
The objective of this paper is to study the effect of novel technology, in particular V2V, on the frequency of side-sweep accidents. In order to obtain realistic and useful results, the simulator needs to satisfy a number of requirements.
First, it needs to realistically model the traffic conditions of multi-lane highway driving, including the geometry of the road, the overall and relative speed of the vehicles, and the distribution of the vehicles in the traffic. The simulator should allow the modeling of various traffic conditions.
Second, the simulator needs to model the visibility of the drivers of the vehicles, including direct observation and observations through the mirrors. Occlusions by parts of the car (A, B and C pillars) and by other vehicles must be considered. The location, shape and size of the blind spot must be accurately modeled, and we should be able to repeat experiments with different blind spot sizes.
Finally, the simulator needs to model driver behavior [
41], in particular not only whether the driver can see the blocking vehicle, but also whether it will check its mirrors, as well as the temporal relationship of the decision making with regards to the sighting.
2.3. The Design of the UCF Lane Change Simulator
Our group at University of Central Florida (UCF) have significant experience in developing traffic simulators to study various aspects of human driving behavior. The UCF Lane Change Simulator (LCS), to be described below, concentrates on modeling in detail the circumstances of a lane changing car in multi-lane highway traffic.
In contrast to simulators that model the overall flow of the traffic, the LCS concentrates on a single car and its driver’s decisions as it moves in traffic. The traffic flowing around the car assumes a Poisson arrival model of the vehicles. Various assumptions about the density and relative velocity of the vehicles in adjacent lanes can be specified as parameters to the simulator. Although photo-realistic visualization is not an objective for LCS, its simple graphical interface allows us to inspect the particular circumstances under which the lane change decision is made.
As the awareness of the lane changing vehicle’s driver of a potential blocking vehicle is a critical aspect of the success of a lane change and the avoidance of a side-sweep accident, LCS focuses extensively on correct modeling of the driver visibility and blind spots.
We designed the UCF LCS to model in detail the events immediately preceding a lane change. Most traffic simulators take the perspective of the overall highway, and are interested in the overall traffic metrics such as throughput, average speed, average time to destination, and the evolution of the traffic over timespans of hours. The UCF LCS, in contrast, is only interested in the vehicles in close proximity to the lane changing vehicle and a short timespan of tens of seconds necessary for the lane change maneuver. We shall need to ensure that the traffic near the lane changing vehicle is modeled realistically. We are not interested, however, in the vehicles before they enter and after they leave the zone of the lane changing vehicle.
The simulator had been implemented in Java, and it has been designed such that every aspect of the traffic model, vehicle geometry and road geometry can be specified in parameters. For the simulation study described in this paper, we fixed the road and overall vehicle geometry to correspond to average sizes of US highways and a mid-size four door vehicle, respectively. We retained as free parameters, however, the mirror adjustments.
Photorealistic visualization was not part of the objectives while designing our simulator. We found, however, that a simple graphic rendering can help us understand the various scenarios.
Figure 1 shows a series of screenshots from the “warm up” phase of the scenario. In general, it is difficult to initialize a traffic simulator to a random point in the traffic, as in normal traffic the position of every vehicle is determined by its history of interactions with other vehicles. Thus, like many simulators, LCS uses a “cold start” approach. It starts with an empty highway and a specific arrival rate of the vehicles (in our case, Poisson arrival with a specific average cars per minute) and lets the dynamic interactions between the vehicles stabilize. The “measured part” of the simulation, in our case the lane change intent, will happen after the traffic has stabilized. This warm up process is shown in the screenshots in
Figure 1.
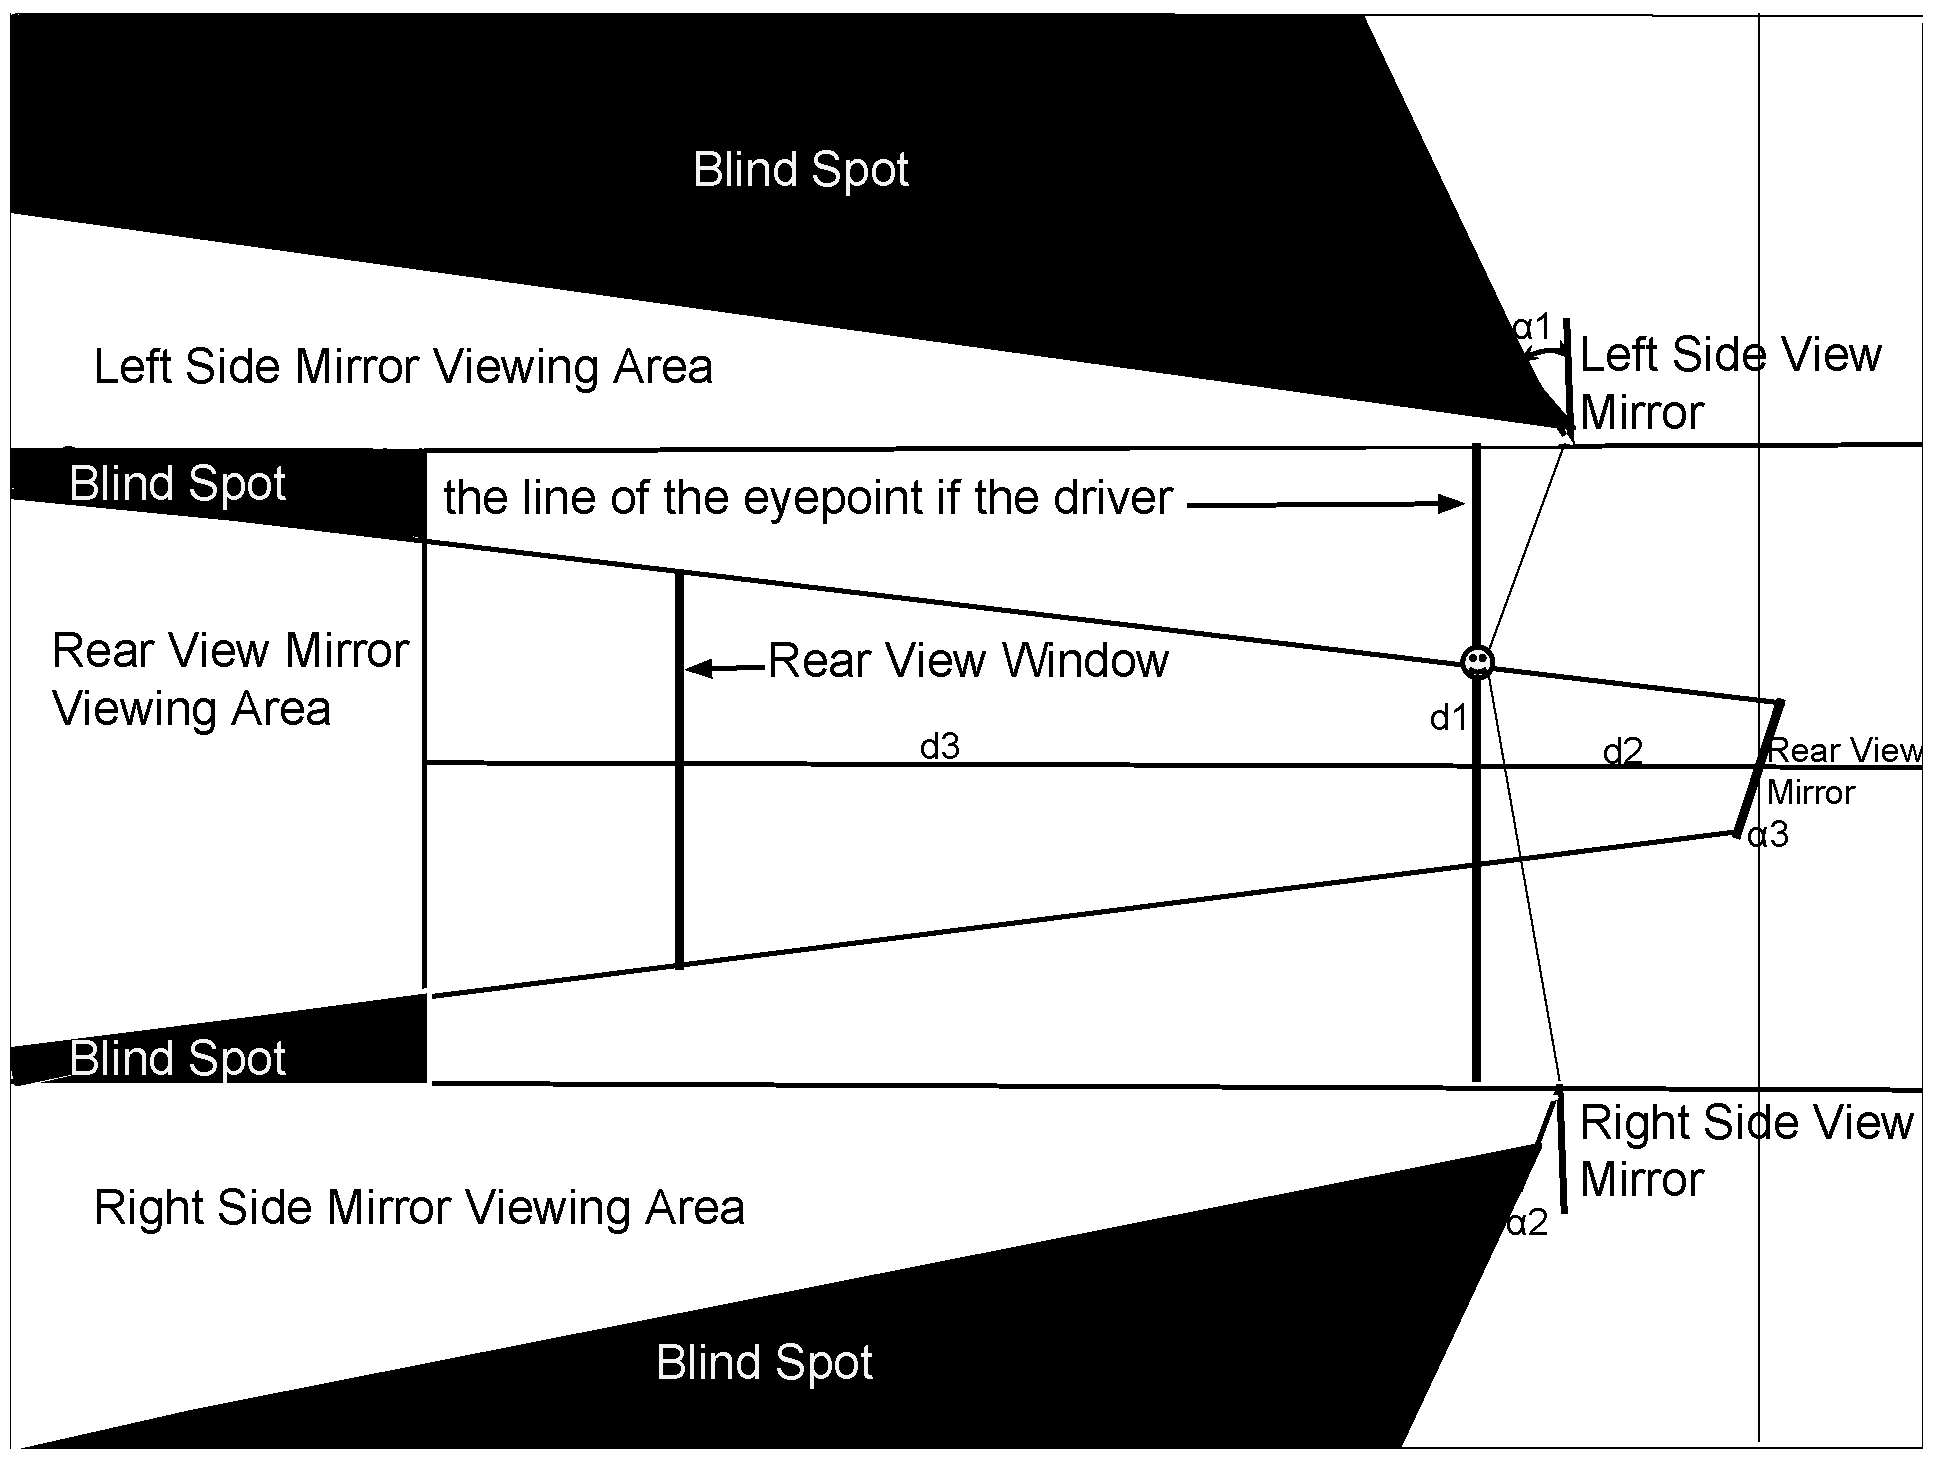
As one of the critical determining factors of successful lane change is driver visibility, the LCS models in detail the geometry of the lines of sight and mirrors in the lane changing vehicle.
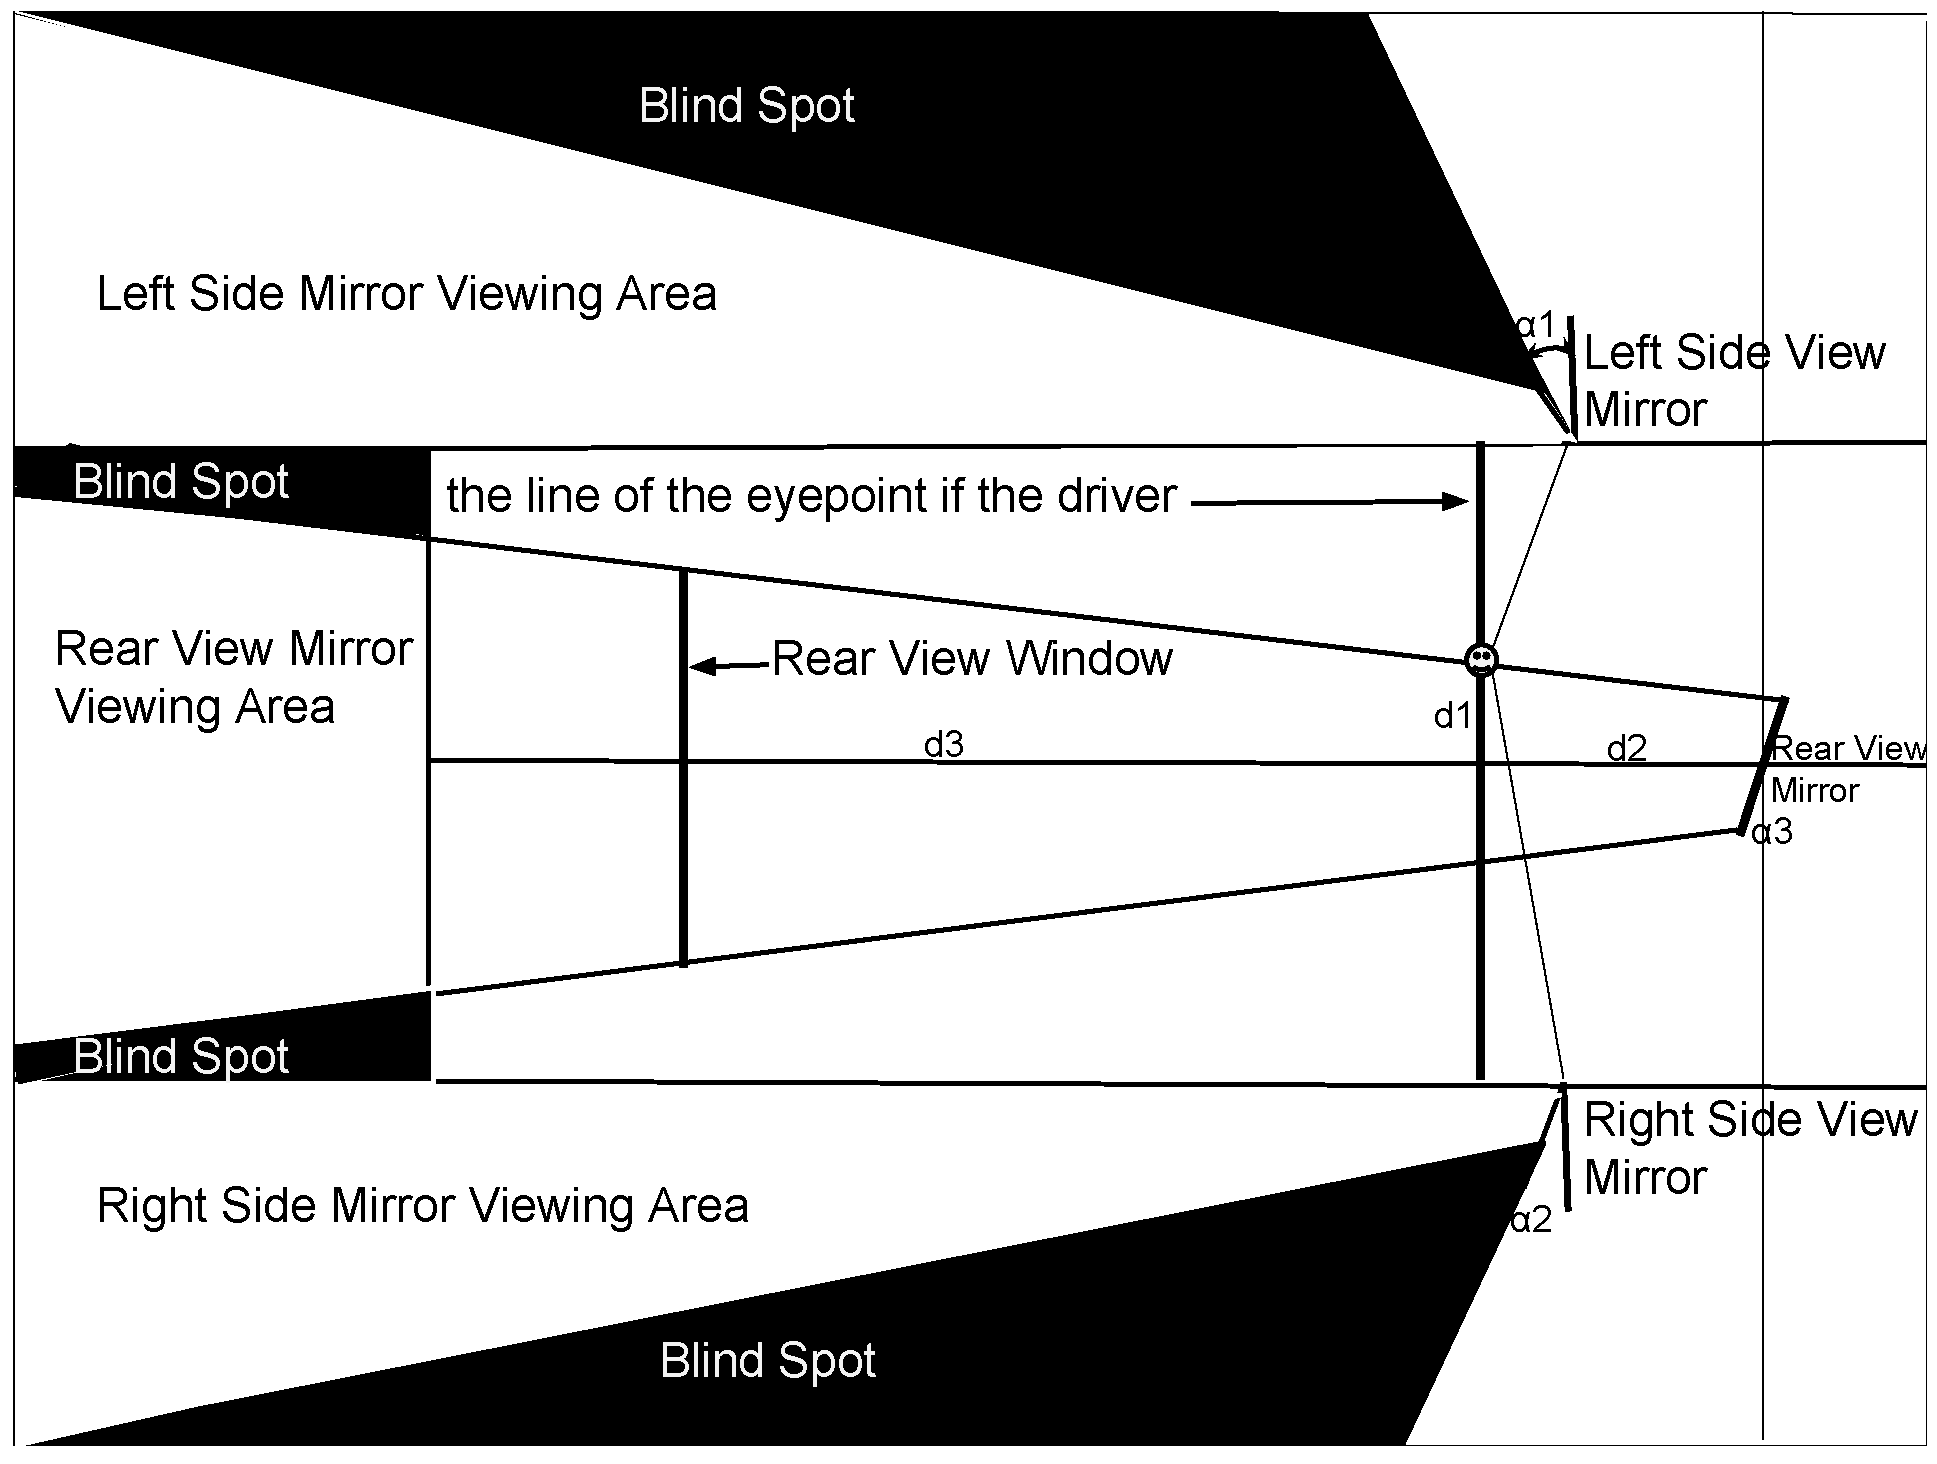
Figure 2 shows the geometric model used for this. The range of view of the driver is affected by many parameters, and some of them, such as the distances
,
and
and the width of the rear window is fixed for a given vehicle. Other parameters, however, such as the mirror angles,
,
and
, are under the control of the driver. Normally, the driver should adjust these angles in order to minimize the size of the blind spots. The arrangement in
Figure 2 is actually the optimal arrangement of these mirrors. As we can see, even for the optimal arrangement, there are four blind spots around the vehicle: two large ones on the sides (also shown in the screenshots in
Figure 1) and two smaller ones in the back where the C-pillar of the car blocks the rear-view mirror’s sight.
In addition to aspects of traffic and vehicle geometry, the LCS also models the behavioral and cognitive aspects of the drivers and associated vehicle automation. In particular, we model what information the driver knows, whether and when the driver looked in the mirror and how long the period is before making a decision and the initiation of a lane change.
Figure 2 shows the geometric model of the driver visibility range. This takes into account both the direct sight range and the visibility provided by the rear view mirror and the left and right side view mirrors. We take into account the size of the rear view mirror and that of the A-pillars. As the size and angle of adjustment of the side view mirrors significantly affect the blind spots, these are adjustable in LCS. Finally, the model takes into account the fact that the driver sits on the left side of the vehicle.
2.4. Driver Scenarios
The action of a lane change is strongly determined by the behavior of the driver of the lane changing car, the behavior of the driver of the following vehicle, and the various communication means that they might use. In the following, we will outline the different scenarios we deployed in our simulation. Note that for all the scenarios we are assuming that there is a left lane change.
Before we proceed further, we need to clarify what a “crash” situation means in our simulations. While we do model the conscious behavior of the drivers, we cannot realistically model reactive actions that take place at time scales of milliseconds, such as sudden evasive actions, where several inches in the position of the vehicle might make the difference. We will say that if a vehicle initiates a lane change while another vehicle blocks the lane, we will count this as a “potential crash situation”. In practice, it is possible that the crash will be avoided through a quick evasive action by the follower vehicle or a last second cancellation of the lane change by the driver. While the number of the near-crashes will be overall higher than the actual crashes, whether a given encounter ends up in a crash or near-crash is primarily a probabilistic event. Our models will predict the potential crash situations, and thus the number of real crashes will be a proportionally smaller fraction of these.
Scenario 1—Reckless driver: In this baseline scenario, the driver of the lane changing vehicle will initiate a lane change if there is no vehicle in his direct line of sight. If there is a vehicle in the direct line of sight, the driver will wait, continuing to drive at a constant speed without initiating a lane change. As the reckless driver will not check the blind-spot or the mirror, if there is a vehicle behind the car, the vehicles will get into a crash situation. While this represents an unusually high number of potential crashes, it allows us to set the baseline for other scenarios.
Scenario 2—Average driver: In this scenario, we aim to model the behavior of a typical driver based on highway administration statistics. Such a driver, once he decides to perform a lane change, will periodically check its mirrors, with a certain probability. Based on NTHSA data, this interval is 8 s and the probability . If the driver does not see a vehicle in the mirrors or in the direct line of sight, it initiates a lane change. If the driver sees a vehicle in the mirror and this vehicle is either blocking the lane or, based on its current speed, will be blocking the lane at the moment of the lane change, the driver will wait. Note that for Scenario 1 and 2 we did not assume any action taken by the driver of the following or blocking vehicle, as this driver is not aware of the intention of changing lanes.
The average driver might still get into crash situations. One reason might be that it missed checking the mirrors (according to the statistics, the drivers check them only 83% of the time). Another reason might be that the driver might have checked the mirror at a moment when the blocking vehicle was in a blind spot and the user did not track the vehicle from a previous sighting.
Scenario 3—Driver using turn signals: In this scenario, the behavior of the driver from scenario 2 is augmented with the fact that the driver uses the turn signal before changing lanes. While in previous cases the drivers of the following vehicles were not active participants, in order to model this scenario, we need to know the action taken by the driver of the following vehicle.
There are several important parameters of this scenario. The first one is whether the follower driver took action upon seeing the signal. The normal action to take upon seeing the signal is a moderately strong braking. This action might not be taken, either because the driver did not see the signal or chooses to ignore it. Another parameter is the number of seconds before the initiation of the lane change that the driver turned on the turn signal? If the signal is turned on only immediately before the lane change, there might not be sufficient time for the following driver to slow down and clear the lane for the lane changing vehicle.
What do we expect from the lane change signal? First, we expect a reduction of the number of crash situations, since even in situations where the average driver might have crashed, the crash could have been avoided due to the action of the following driver.
Second, we expect that, on average, the time to change lanes will be reduced, since, by the action of the following driver, the lane changing driver might find a slot into which he/she could change lanes more quickly. For the same reasons as before, there is no guarantee that there is a no crash situation even in the case of the use of the turn signal.
Scenario 4—V2V communication with active control in the lane changing vehicle: For this scenario, we assume that the vehicles have V2V communication technology such as Dedicated Short Range Communication (DSRC). We assume that, using this technology, the following vehicle can make its presence and speed known to the lane changing vehicle using short-range V2V communication. Furthermore, the lane changing vehicle is equipped with a device that prevents the driver from initiating a lane change if the on-board algorithm judges that, given the existence of the following vehicle and the relative velocities at the moment of the lane change, a collision will occur.
Let us consider what we expect such a system to achieve. First, the system should obtain better information about the status of the target lane than visual inspection by the driver. The V2V system will listen all the time and blind spots will not prevent the communication. Furthermore, by directly transmitting the velocity of the following vehicle, the overall system can have better information about the relative speeds. In general, it is not easy for drivers to estimate the relative speeds of the vehicles from short glances in the mirror.
Nevertheless, equipping a vehicle with this technology will not immediately mitigate all possibilities for a side-sweep accident. To begin with, not all vehicles will be immediately equipped with this technology. Second, V2V communication is limited by the transmission range of the V2V radios, which can be further limited by environmental conditions. If the following vehicle is significantly faster than the lane changing one, and the transmission range is small, it might happen that the V2V-based notification arrives too late to prevent a side-sweep collision.
Note that many other possible scenarios exist. V2V communication can be also implemented with an intelligent decision making factor in the follower vehicle instead of the lane changing one. In another scenario, we can assume the existence of an intelligent agent in both vehicles, which might negotiate a coordinated course of actions. Multi-vehicle coordinated action using vehicle-to-infrastructure (V2I) communication is also a possibility. Exploring these and similar scenarios, however, is beyond the scope of this paper.

