Case Report

Graphene–PLA Printed Sensor Combined with XR and the IoT for Enhanced Temperature Monitoring: A Case Study

by
Rohith J. Krishnamurthy
and
Abbas S. Milani
*
Composites Research Network-Okanagan Laboratory, School of Engineering, University of British Columbia, Kelowna, BC V1V 1V7, Canada
*
Author to whom correspondence should be addressed.
J. Sens. Actuator Netw. 2025, 14(4), 68; https://doi.org/10.3390/jsan14040068
Submission received: 28 April 2025 / Revised: 24 June 2025 / Accepted: 25 June 2025 / Published: 30 June 2025
(This article belongs to the Section Actuators, Sensors and Devices)

Abstract

This case study aims to combine the advantage of the additive manufacturing of sensors with a mixed reality (MR) app, developed in a lab-scale workshop, to safely monitor and control the temperature of parts. Namely, the measurements were carried out in real time via a 3D-printed graphene–PLA nanocomposite sensor and communicated wirelessly using a low-power microcontroller with the IoT capability, and then transferred to the user display in the MR. In order to investigate the performance of the proposed computer-mediated reality, a user experience experiment (n = 8) was conducted. Statistical analysis results showed that the system leads to faster (>2.2 times) and more accurate (>82%) temperature control and monitoring by the users, as compared to the conventional technique using a thermal camera. Using a Holistic Presence Questionnaire (HPQ) scale, the users’ experience/training was significantly improved, while they reported less fatigue by 50%.

1. Introduction

The advent of Industry 4.0 has signaled a transformative period in industrial manufacturing. This new paradigm represents a convergence of cutting-edge technologies such as cyber–physical systems (CPSs), the Internet of Things (IoT), artificial intelligence (AI), big data analytics, additive manufacturing (AM), and extended reality (XR) [1,2,3,4,5,6,7,8,9,10,11]. At its core, Industry 4.0 redefines traditional industrial processes by introducing a highly digitized, networked, and automated operational model. Among others, one of the most compelling applications of this revolution is observed in the design and operation of smart warehouses [12].
Traditional warehouses have long depended on manual labor for tasks such as inventory handling, record keeping, and goods distribution [13]. This conventional setup not only incurs inefficiencies—ranging from slow inventory retrieval to excessive use of human resources—but may also introduce challenges in data accuracy and environmental impact due to manual-based documentation [14]. In contrast, smart warehouses leverage advanced technologies to automate operations such as picking, delivery, and bookkeeping. By replacing manual interventions with real-time, data-driven processes, smart warehouses promise to elevate time saving and energy efficiency, dramatically reduce error margins, and streamline overall operational costs [15].
At the heart of these modernized warehouses lies a fusion of physical logistics with a robust digital infrastructure. The transformation is underpinned by CPSs, which tightly integrate sensors, actuators, and real-time data processing capabilities with physical environments, enabling the seamless tracking and control of every warehouse operation. In parallel, the IoT serves as the digital nervous system, facilitating ubiquitous connectivity among devices and enabling continuous monitoring and control across expansive warehouse spaces [16]. Together, these technologies not only provide a responsive and automated operational framework, but also pave the way for further enhancements via advanced manufacturing and immersive human–machine interfaces [17].
It is believed that central to this transformation is the optimal integration of the IoT within emerging advanced manufacturing and digital techniques such as AM and XR. While each (or a combination of a few of such technologies) has demonstrated promise in past case studies, the CPS literature reveals critical disconnects in their integrated application. These include: (1) Material–Digital Divide: advanced AM techniques enable the fast fabrication of bespoke sensors that can monitor manufacturing operational parameters with high precision; however, these sensors still remain largely isolated from the real-time analytics capabilities of CPS studies [18]; (2) Human–System Asynchrony: although XR interfaces have been developed to overlay real-time data onto physical environments, they frequently function merely as passive dashboards (e.g., for off-line training of operators), rather than active, decision-support layers that enable intuitive human oversight during operation [19]; (3) Lifecycle Fragmentation: sensor production via AM, data processing within CPSs, and user interaction in real-time through XR have been often implemented as discrete phases (in different sections of a smart factory case study), rather than as an integrated continuum that concurrently enhances a particular task performance [20]. To address these, this paper presents a case study that aims to combine a 3D-printed graphene–PLA sensor with an XR interface for an enhanced, real-time temperature monitoring task—deemed a critical task in smart warehouse environments—under the IoT.
Before presenting the case study details, we first provide a synopsis of each selected technology’s current state of the art, along with a viewpoint focused on smart warehouses.

1.1. Role of Cyber–Physical Systems and the Internet of Things in Smart Factories

Cyber–physical systems (CPSs) serve as a fundamental pillar in the context of Industry 4.0, bridging the physical and digital environments to empower real-time data collection and decision-making via the IoT devices [21]. CPSs are essentially designed to create a seamless integration between computational processes and physical operations through networks of embedded sensors [22], actuators, and control algorithms [23]. In a warehouse setting, CPSs construct a digital twin of the physical environment where dynamic feedback loops constantly update the state of the system [24]. For example, temperature fluctuations within storage areas are continuously sensed, digitized, and processed [25]. This real-time feedback not only enables immediate corrective actions—such as activating cooling systems or issuing system alerts—but also underpins predictive maintenance and resource optimization across the facility [26].

1.2. Additive Manufacturing for Custom Sensor Solutions

Additive manufacturing (AM) continues to drive a paradigm shift in the development of specialized sensor systems. In the era of Industry 4.0, such innovations are critical for smart warehouse operations, where precision, adaptability, and seamless integration with cyber–physical infrastructures are essential. Force sensors, for instance, are indispensable components in robotic handling, automated production lines, and logistics operations within smart warehouses. Cost-effective processes like digital light processing (DLP) and inkjet printing have enabled the fabrication of these sensors with elaborate designs [27]. For instance, an affordable fingertip sensor can be effectively used to measure the contact force of robotic grippers under strenuous conditions, thereby demonstrating its compatibility with intricate warehouse systems [28]. Despite such advances, there is ongoing research to further enhance these sensors functionality and application scopes [29,30,31].
Simultaneously, progress in micro-channel-based sensors—with conductive materials integrated via AM—is propelling the Internet of Things (IoT) applications in smart warehouses. For example, inkjet-printed strain sensors offer outstanding dimensional accuracy, repeatability, and flexibility [32,33]. Complementary innovations include highly flexible and elastic strain sensors fabricated via fused deposition modeling (FDM), which utilize both extruded filaments and 3D-printed nanocomposites based on, e.g., TPU/MWCNT [34]. Moreover, cost-effective material extrusion (ME) has been employed to manufacture conductive plastic components such as carbon-dispersed ABS, carbon-dispersed PLA, and graphene-dispersed PLA that possess the electrical properties necessary for seamless integration into embedded sensing systems.
Recent developments in the field have also expanded the materials toolkit by introducing flexible dielectric and conductive filaments that can measure both degradation and temperature within a smart warehouse. Materials such as TPU [35], PDMS [36], polystyrene sulfonate (PEDOT: PSS) [37], and PLA [38] enable the fabrication of sensors that are transparent, soft, highly sensitive, and stretchable features that are particularly attractive for monitoring a variety of conditions in Industry 4.0 settings.
In smart warehouse applications, flexible capacitive force sensors based on a parallel plate design can also stand out due to their ability to register changes in capacitance under applied forces. These sensors, whose data are captured with LCR meters and processed through microcontroller-based readout systems, ensure high-precision force measurements [39]. Additionally, the use of FDM to fabricate structures that exploit anisotropic material properties has led to further sensor performance improvements [40].
A critical aspect scarcely addressed in the past is the integration of these AM-based sensors with cyber–physical systems (CPSs) and extended reality (XR) platforms. In a smart warehouse setting driven by Industry 4.0, such an integration would facilitate real-time data collection and interactive monitoring at every node of the operational network. Enhanced temperature measurement, a key requirement for preserving, e.g., perishable goods, could be achieved by leveraging AM-fabricated sensor materials and advanced systems to significantly lower error margins [41]. Moreover, CPS and XR technologies would enable immediate, human-in-the-loop feedback, allowing warehouse managers to rapidly respond to deviations from predefined environmental parameters.

1.3. Extended Reality for Operational Management in Factories

Extended reality technologies—including augmented reality (AR), mixed reality (MR), and virtual reality (VR)—can significantly enhance operational management by overlaying real-time data onto the physical world [42]. This immersive approach allows operators to gain situational awareness, thereby accelerating response times and facilitating safer and more effective decision-making during critical operational moments [43]. The integration of XR into manufacturing and logistics provides intuitive access to essential data and analytics, thus empowering personnel to make informed decisions quickly [44]. Industry applications of XR have illustrated its capability to bridge cognitive gaps in operational settings, providing workers with augmented information that enhances their understanding of complex processes [45]. Moreover, studies have shown that XR can lead to reductions in error rates and time spent on tasks associated with training and operational execution, ultimately contributing to overall process efficiency [46]. By harnessing XR, organizations stand to enhance not only their operational frameworks but also employee safety and engagement levels [47]. In our framework, XR interfaces serve as “decision amplifiers”, empowering operators to visualize sensor data (such as temperature maps) in an immersive and intuitive manner.
In practical terms, an XR interface may present data collected, e.g., from sensors as dynamic, spatial thermal maps. For example, a mobile application might render a virtual 3D object whose color changes in response to temperature variations detected by the sensor. Such an interface would then allow human operators to monitor key operation parameters related to temperature of parts without needing to physically traverse the warehouse. This not only improves response times but can also enhance operator safety by reducing the need to interact with, e.g., high-temperature areas directly.
However, despite its transformative potential, the CPS literature reveals that XR’s role remains rather underexplored compared to other enabling technologies of Industry 4.0. For instance, XR solutions are frequently deployed as standalone visual dashboards, lacking a fully integrated, closed-loop capability with sensor fabrications and digital analytics— the latter represents an ongoing research gap that also motivated this work.

1.4. Objective and Novelty of This Industry 4.0 Case Study

The primary objective of the present case study was to demonstrate, at laboratory scale, how AM-based sensor fabrication and XR technology (here a mixed reality) may be integrated under the IoT to enhance the user/operator experience and task precision, when asked to monitor and control temperature of manufactured parts in a simulated warehouse. The real-time temperature sensing is based on a 3D-printed graphene–PLA (GPLA) conductive nanocomposite, and the data are communicated wirelessly using a low-power microcontroller with the IoT capability.
It is worth adding that the practical challenges using conventional manual temperature monitoring and control systems in a factory warehouse (e.g., via a handheld thermal camera as opposed to the herein proposed sensor-XR-based system) may be as follows:
(a)
In the case of manual operation, the user would need to use two independent systems to (i) monitor and (ii) control the part temperature;
(b)
The thermal camera must be carried by the user across the inspection locations;
(c)
The user would need to move and interact with the control switches physically (which can be prohibitive if the part temperature is too high, or it is not physically easy to reach).
We hypothesize that an integrated sensor-XR system can (1) significantly reduce response time for temperature control actions as compared to traditional manual methods, (2) improve the accuracy and reliability of temperature measurements, and (3) enhance overall user satisfaction and situational awareness through immersive, real-time visualizations. To assess the usefulness of the developed system, we performed a user-study and evaluated a range of quantitative and qualitative performance metrics, as described in Section 2.

Novelty: A Human-in-the-Loop (HITL) CPS-Based System Demonstrator via Integration of XR, an AM-Based Sensing Modality

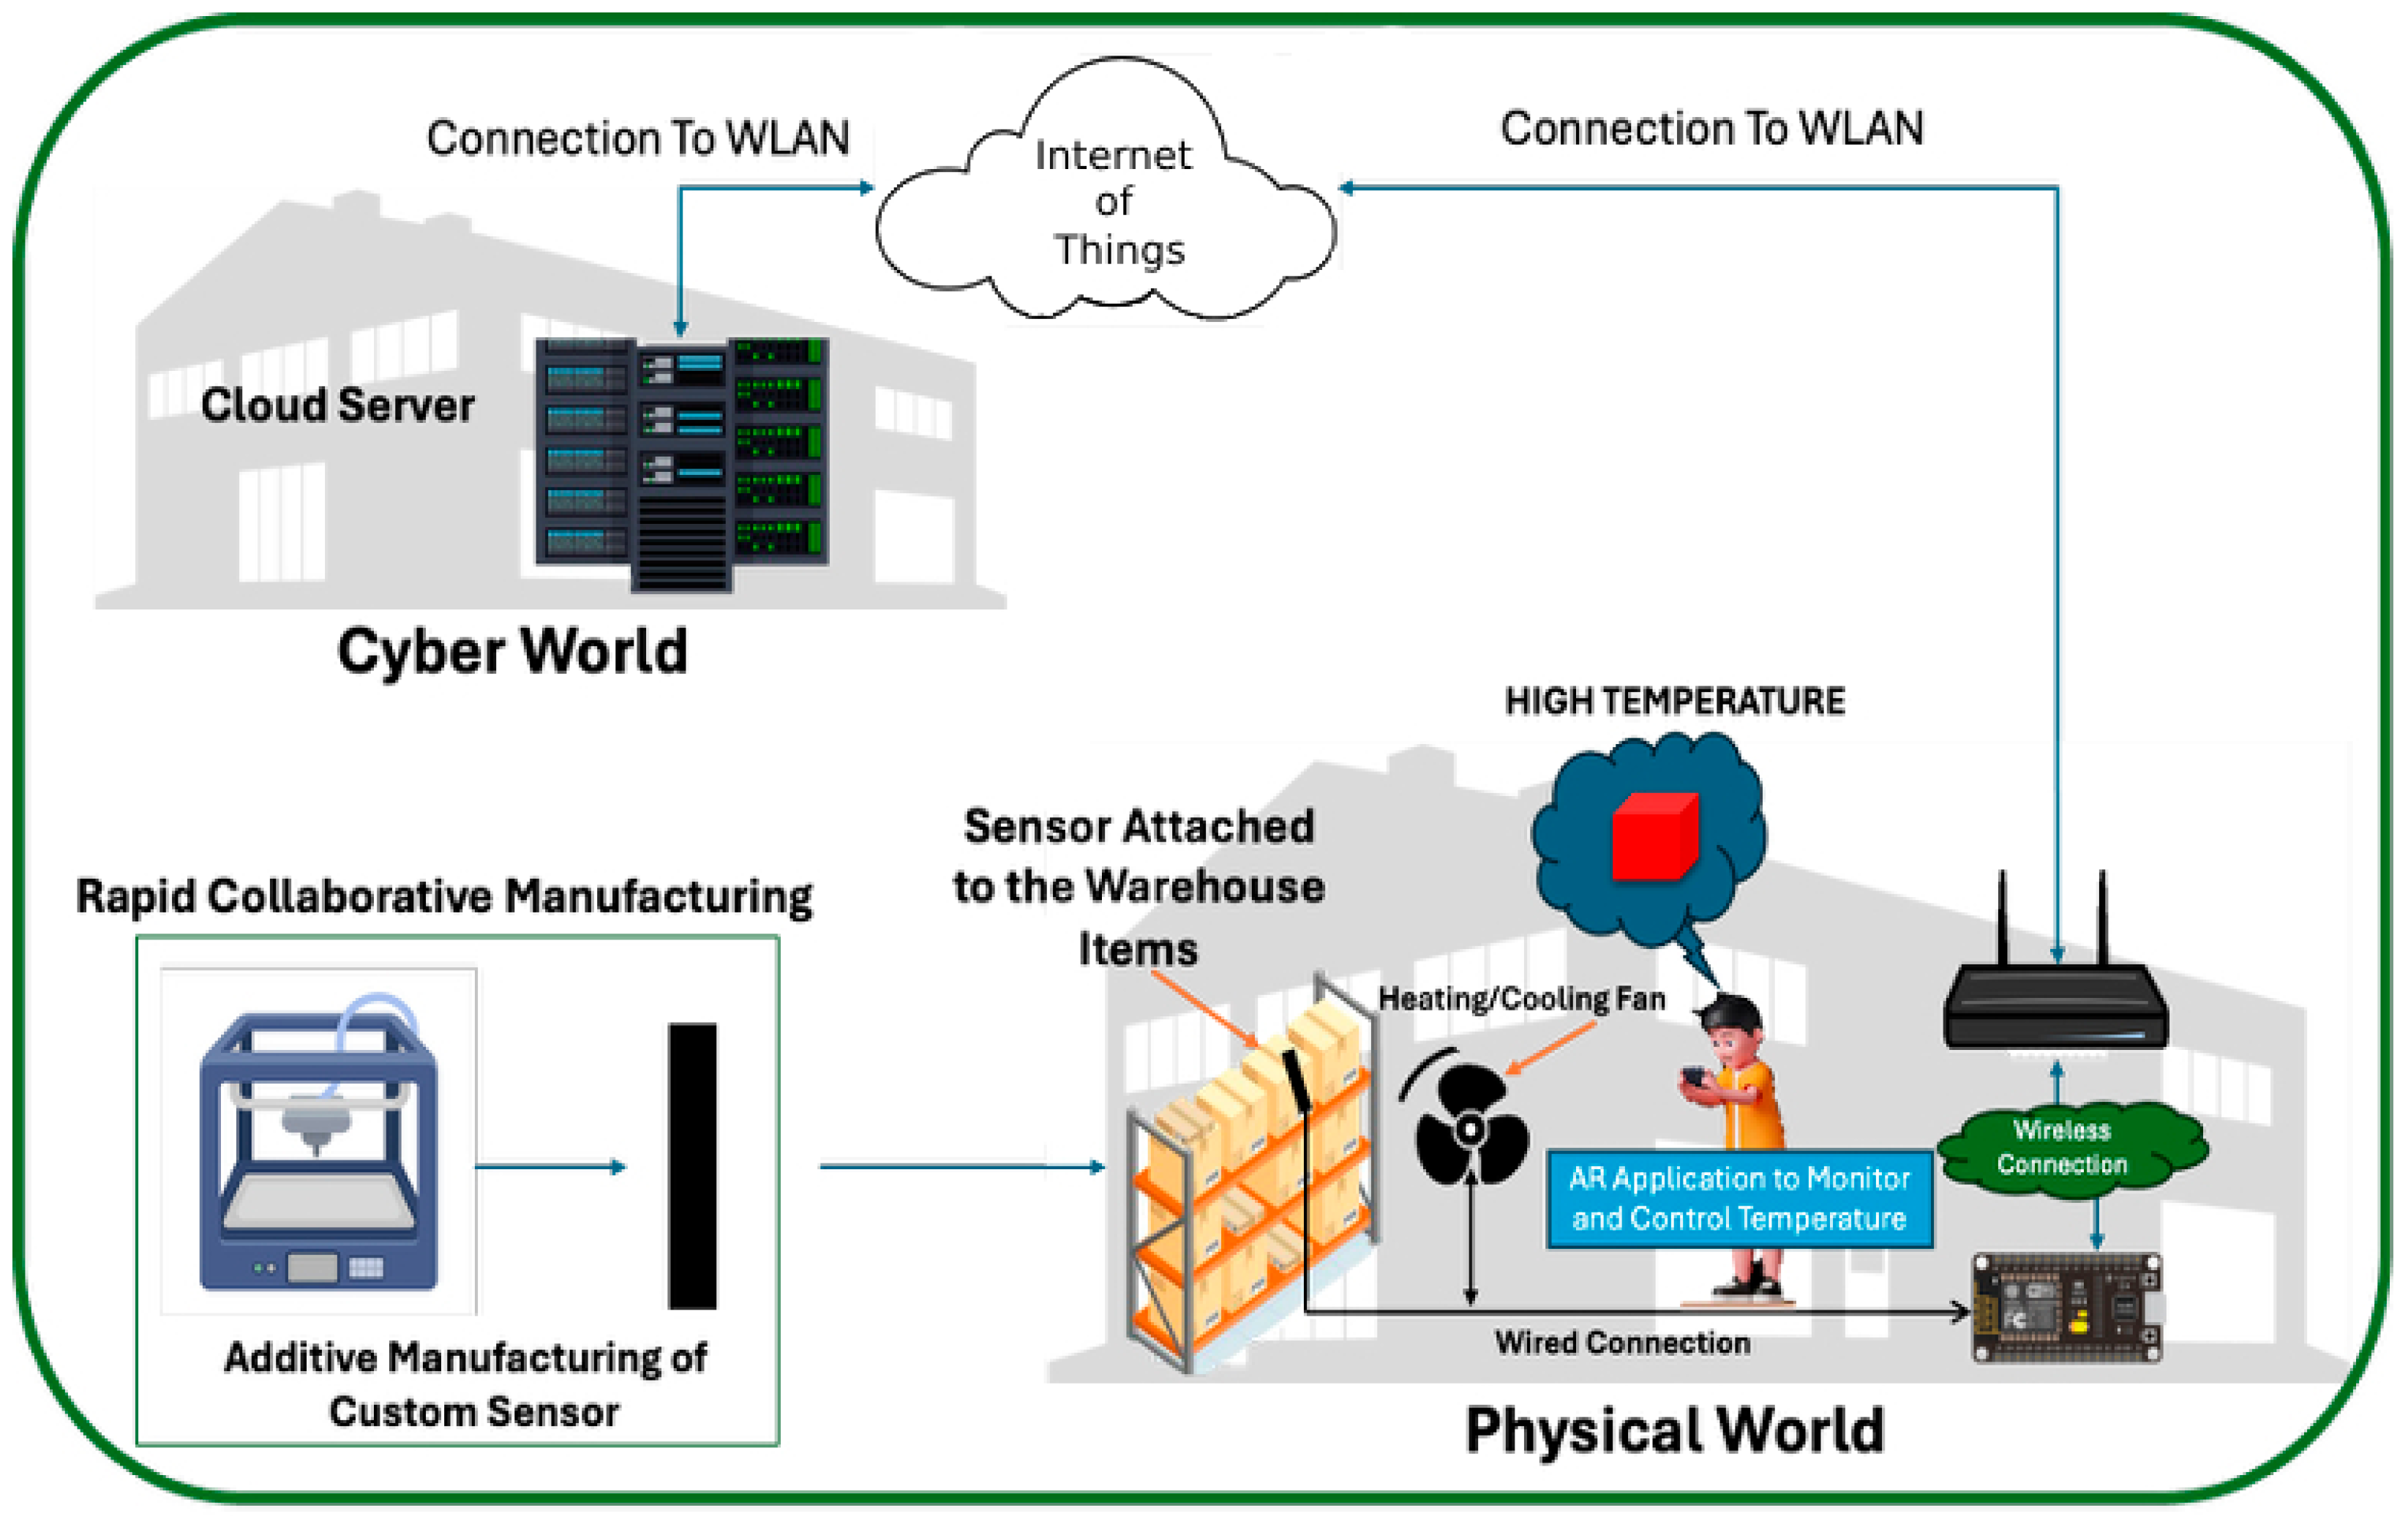
Drawing upon the CPS/IoT Components (design) Model introduced in [26], also shown in Figure 1, our integrated approach classifies a hypothetical smart factory warehouse system into four elements: (1) Physical: The physical domain encompasses the tangible, hardware-based components that form the backbone of the warehouse; (2) Logical: The logical sphere represents the system’s computational intelligence. It involves a network of CPS connectivity and data handling that process sensor inputs to generate actionable insights; (3) Transducing: Acting as the critical interface between the physical and logical layers, the transducing element performs the vital task of signal conversion. In our implementation, high-performance sensor transducer converts raw physical signal into digital data stream; (4) Human: The human component is pivotal in smart factory design, serving as both a consumer of, and a contributor to, the system’s operational intelligence. This element integrates end-users and decision-makers directly into the control loop through extended reality (XR) interface. By transforming sensor data into immersive and spatial visualization, our system demonstrator can empower operator to engage in proactive, remote decision-making. Accordingly, the novelty of our contribution lies in integration of CPS, AM, and XR technologies (Figure 2) a combination rarely explored in the past case studies. This convergence not only enhances the accuracy, energy efficiency, and responsiveness of temperature monitoring systems in smart warehouses but also sets a new benchmark for developing further intelligent, adaptive industrial networks.
The IoT infrastructure is essential for gathering a continuous stream of data from all parts of a warehouse environment. These data points, including temperature readings, humidity levels, and inventory movements, feed directly into centralized CPS platforms or cloud-based analytics systems [49]. The ubiquitous connectivity provided by the IoT supports not only comprehensive real-time monitoring but also the deployment of adaptive control strategies that can pre-emptively address deviations from optimal conditions. Even as CPSs and the IoT lay the technical groundwork for sophisticated automation, the human element remains indispensable especially under conditions where full autonomy is not yet feasible. As shown in Figure 1, human-in-the-loop (HITL) frameworks are designed to provide dynamic, flexible control by integrating human oversight into automated processes [50]. While fully autonomous systems offer rapid and consistent performance, they may struggle with unforeseen anomalies or complex decision scenarios that require human judgment. HITL enables operators to monitor, override, or fine-tune automated responses, ensuring that nuanced situations are managed effectively [51]. For instance, in warehouse temperature monitoring, intuitive interfaces potentially augmented by extended reality (XR) technologies can display real-time temperature maps and facilitate remote control actions by human operators [52]. This shared control paradigm not only enhances response times and situational awareness but also increases overall system resilience and safety.

2. Material and Methods

The graphene–PLA (GPLA) conductive filaments were acquired from the Graphene-3D Lab Inc. (Calverton, NY, USA) [53], with a resistivity of about 0.6 ohm/cm at room temperature and positive temperature coefficient characteristics. The filament’s diameter was 1.75 mm, with a ±0.1 mm tolerance. Subsequently, a desktop 3D printer (Ender-3) was employed to fabricate the composite sensor with a nozzle diameter of 0.4 mm and inject the filament through the Bowden tube extruder. The printer’s nozzle temperature was maintained at 220 °C, and the bed temperature was set at 40 °C. The 3D-printed sensor’s resistance changes in relation to working temperature was studied and calibrated using a Thermotron SM-4-8200 chamber (Holland, MI, USA). The temperature varied from 0 °C to 100 °C at a constant (room) relative humidity was 40%. Furthermore, the four-wire method was used to gauge the resistance changes with the 9219 NI National Instruments Analog Input Module. The data were collected at a sampling rate of 30 Hz.
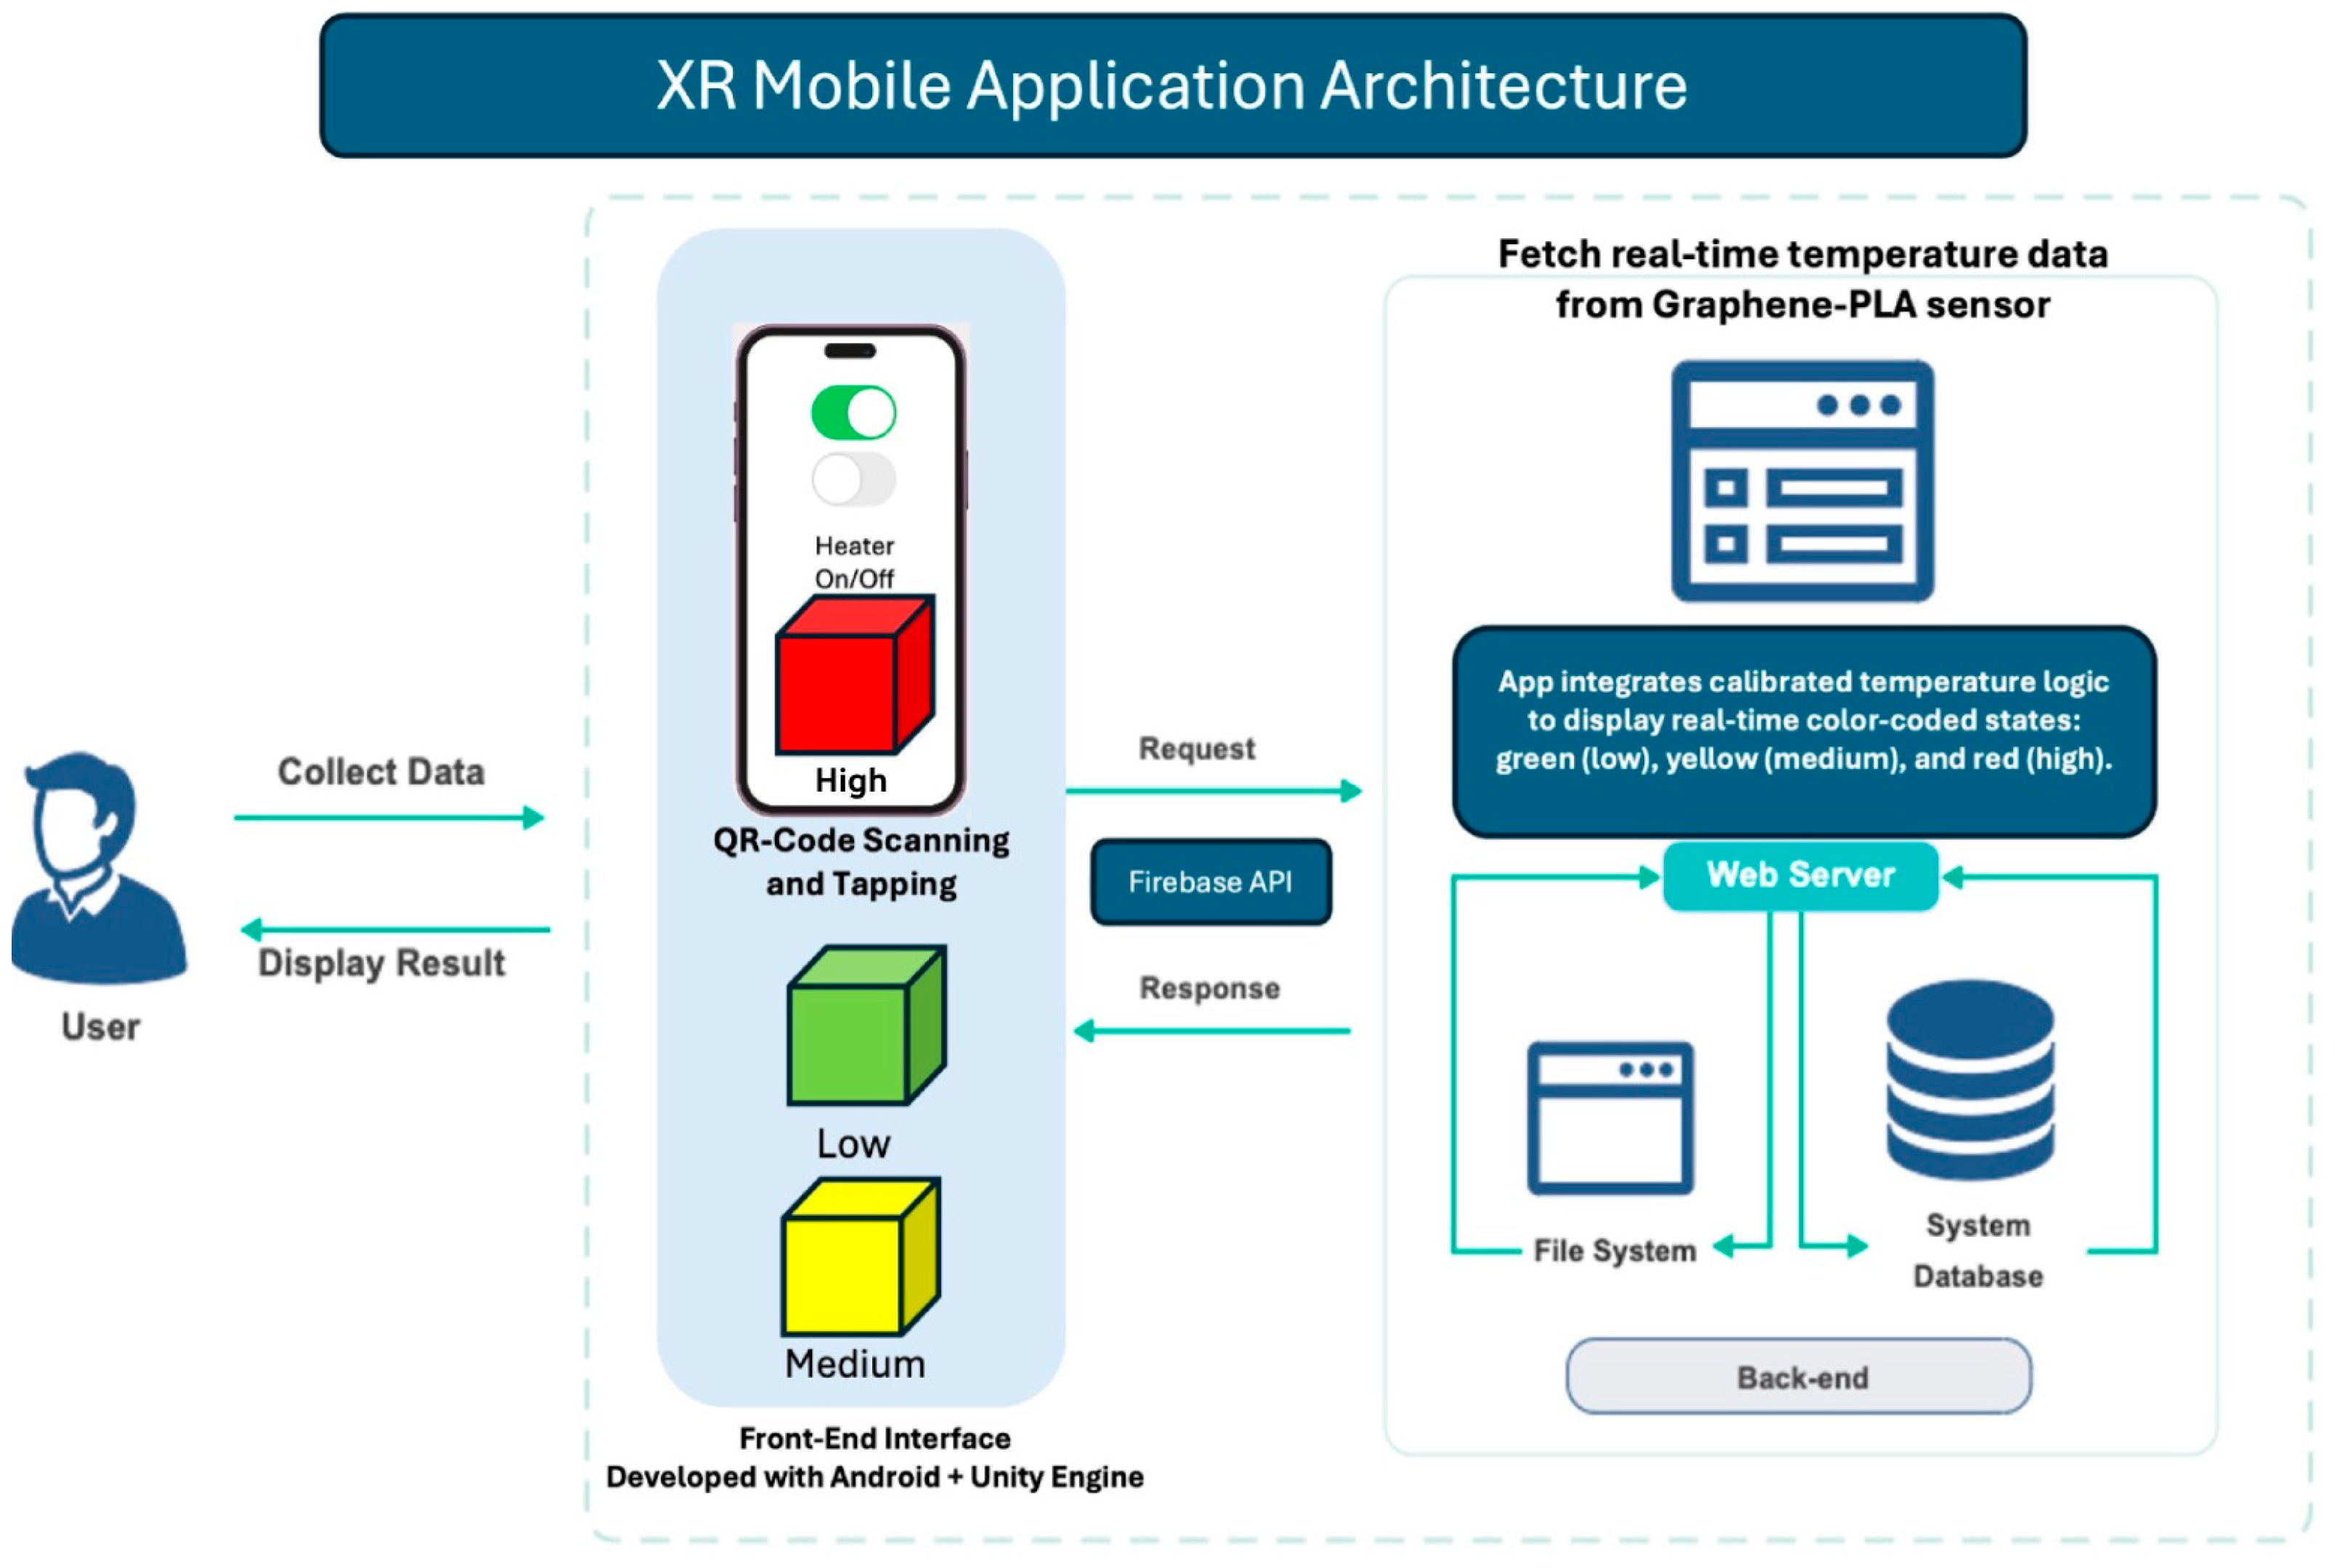
For the XR implementation, we employed an image recognition method where the user’s camera (mobile) tracks the target’s position and direction, then renders a virtual 3D object on its surface. Furthermore, the user can interact with virtual 3D objects in real-time, i.e., a dual-layer 3D user interface (UI). For example, as shown in Figure 3, the tested game object (cube) changes its color based on the temperature readings from the sensor, and the user at the same time can opt to tap the game object (cube) to turn off/on the heater located adjacent to the part. The graphene–PLA sensor interfaces with a low-power ESP32 microcontroller, selected for its integrated Wi-Fi and BLE capabilities [54,55], facilitating seamless the IoT connectivity without requiring additional modules. With an active Wi-Fi current draw of approximately 160 mA and a deep-sleep consumption as low as 10 µA and at a cost of $3–$5 the ESP32 was deemed suitable for continuous monitoring application in the present study [55]. Furthermore, its compatibility with the Arduino ecosystem and strong community support simplified both the IoT development and deployment [56]. Furthermore, the ESP32 had an inbuilt analog- to-digital converter, enabling the graphene–PLA sensor to communicate in a four-wire configuration to detect the part temperature change, through a change in its electrical resistance. The microcontroller was programmed to update the resistance change instantaneously to the Firebase database [57]. The Firebase was programmed based on the sensor calibration dataset to correlate the difference in resistance value to the temperature.
Furthermore, the Firebase data recording, linked to the mobile application, allowed the users to monitor the temperature remotely through the color variation in the game objects (green (low temperature), yellow (medium), and red (high)). Similarly, the game object (cube) acts as a button that constantly updates its state with current time to the Firebase. Finally, the button state recorded in the Firebase is sent back to the microcontroller through the internet, which helps to control the temperature (by turning on or off the heater based on the button state; see also Supplementary Video S1.

User Study

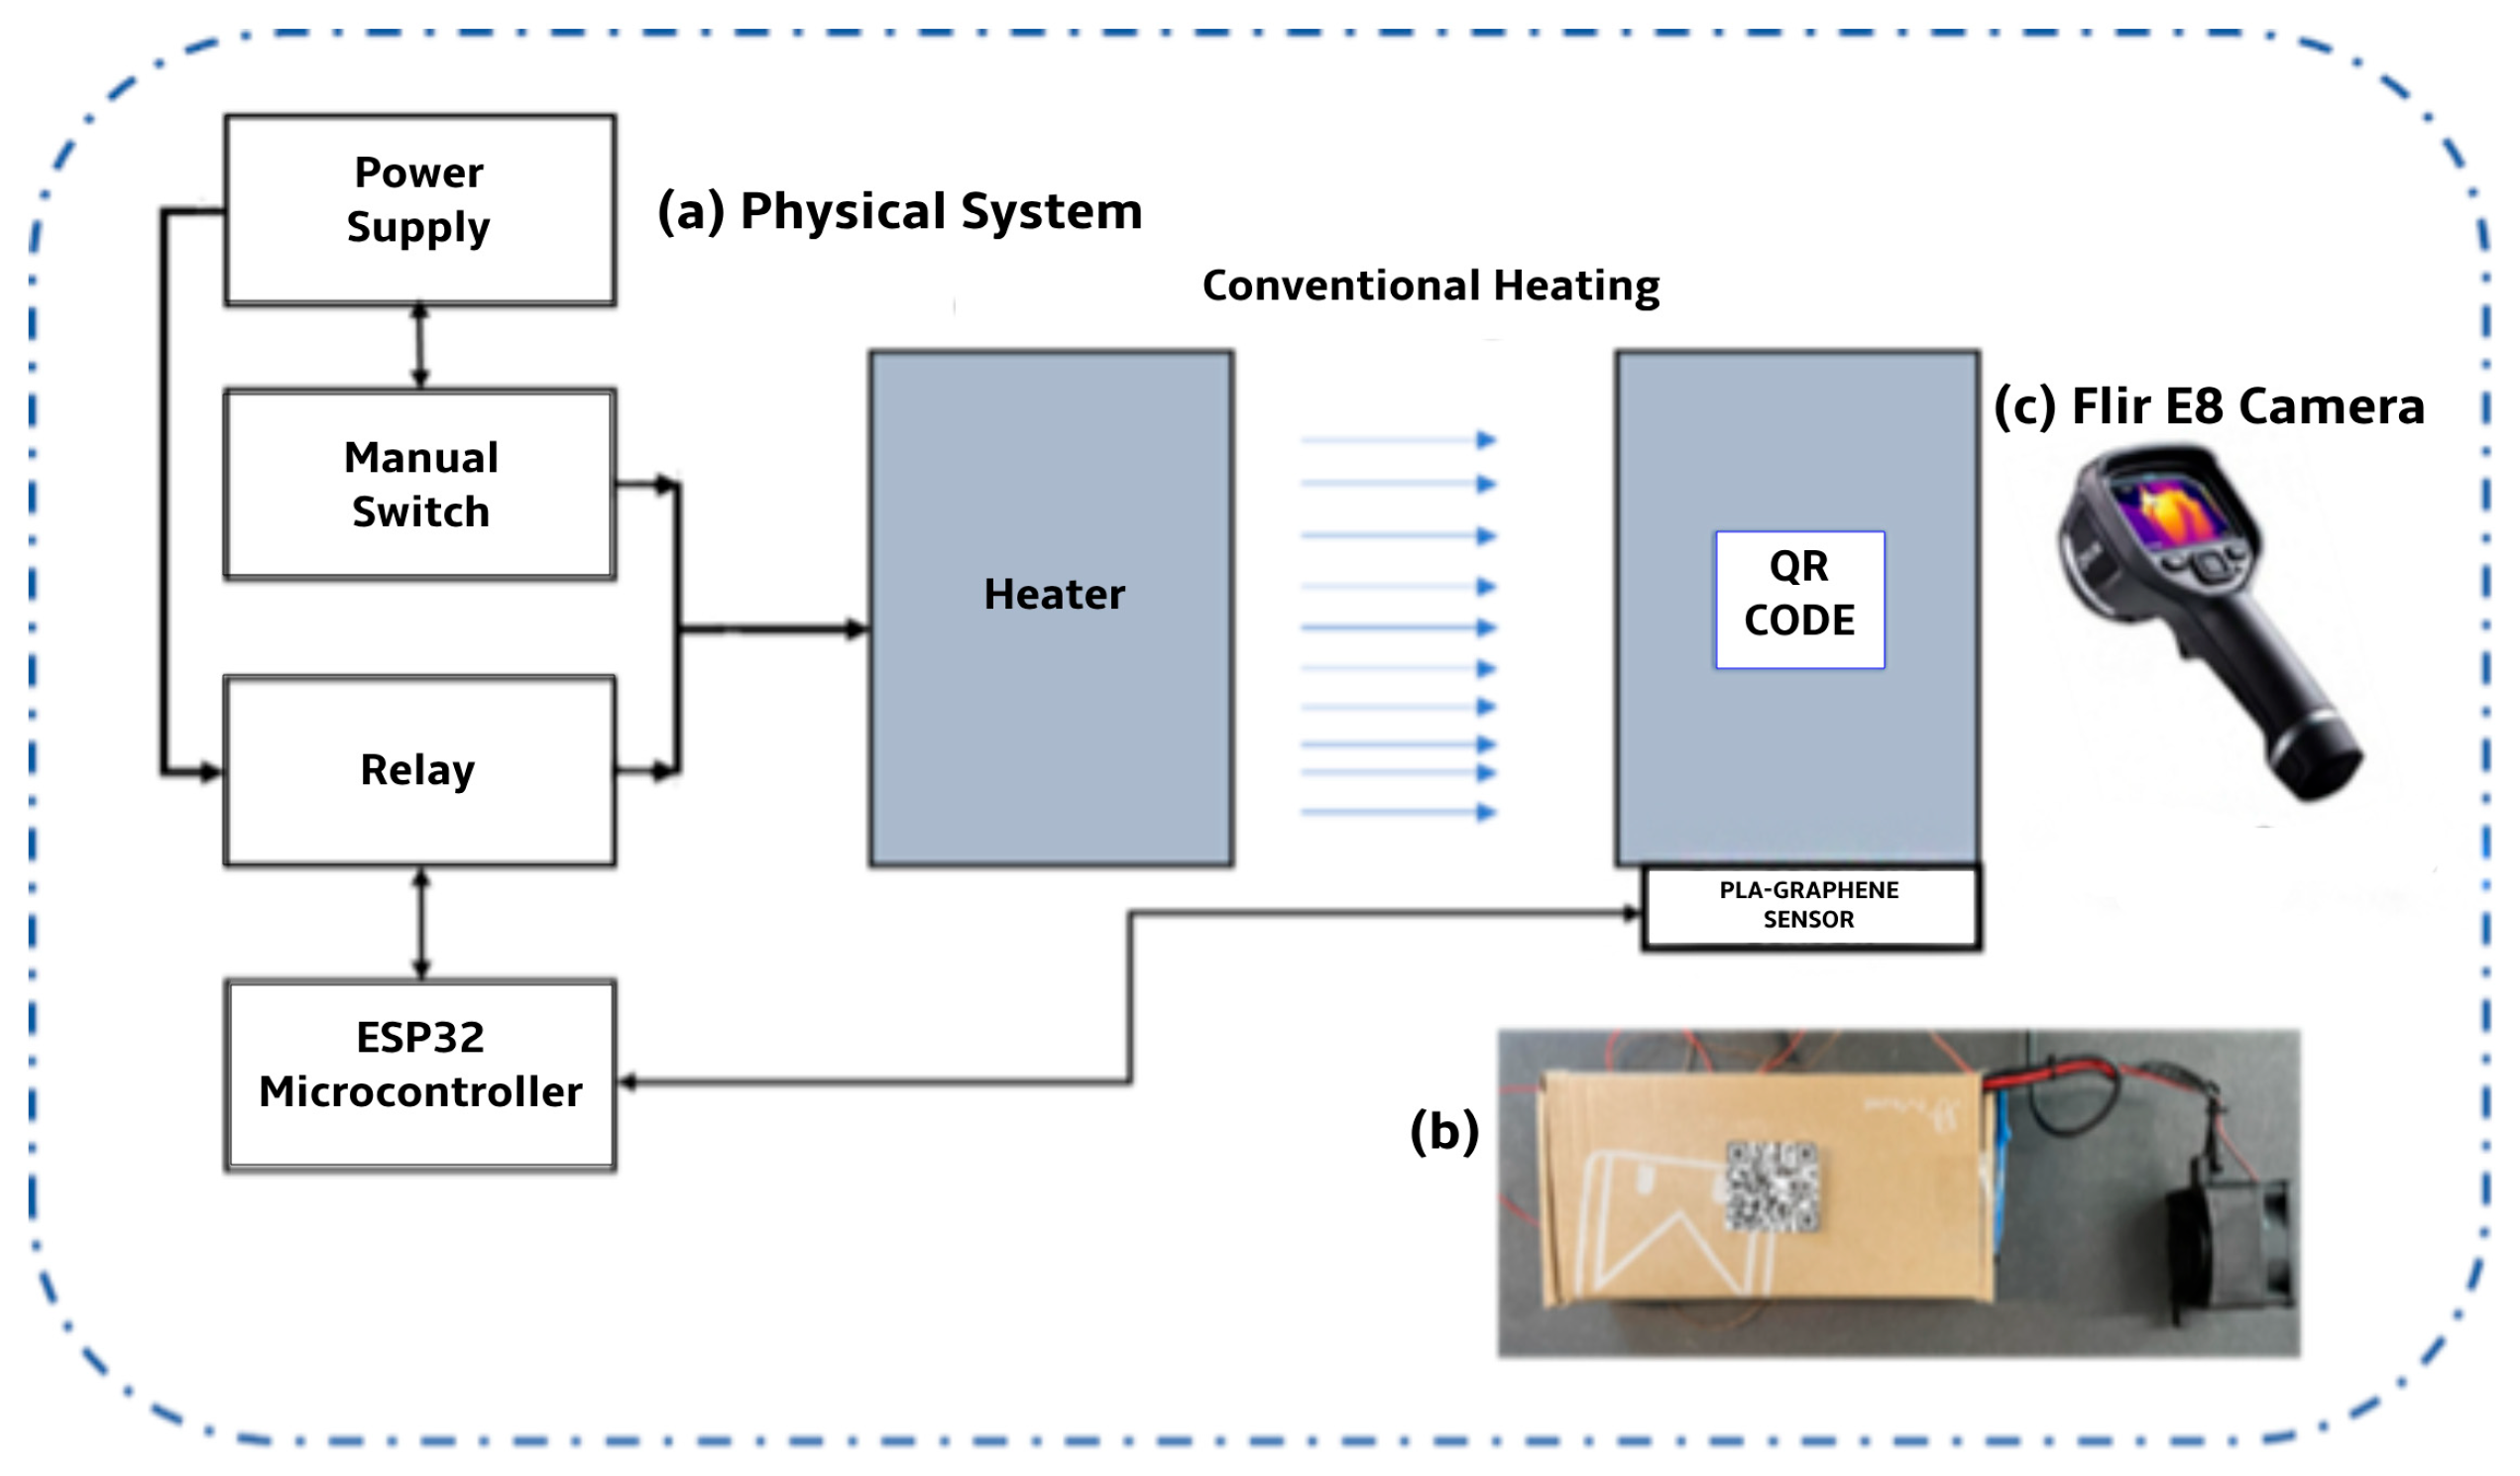
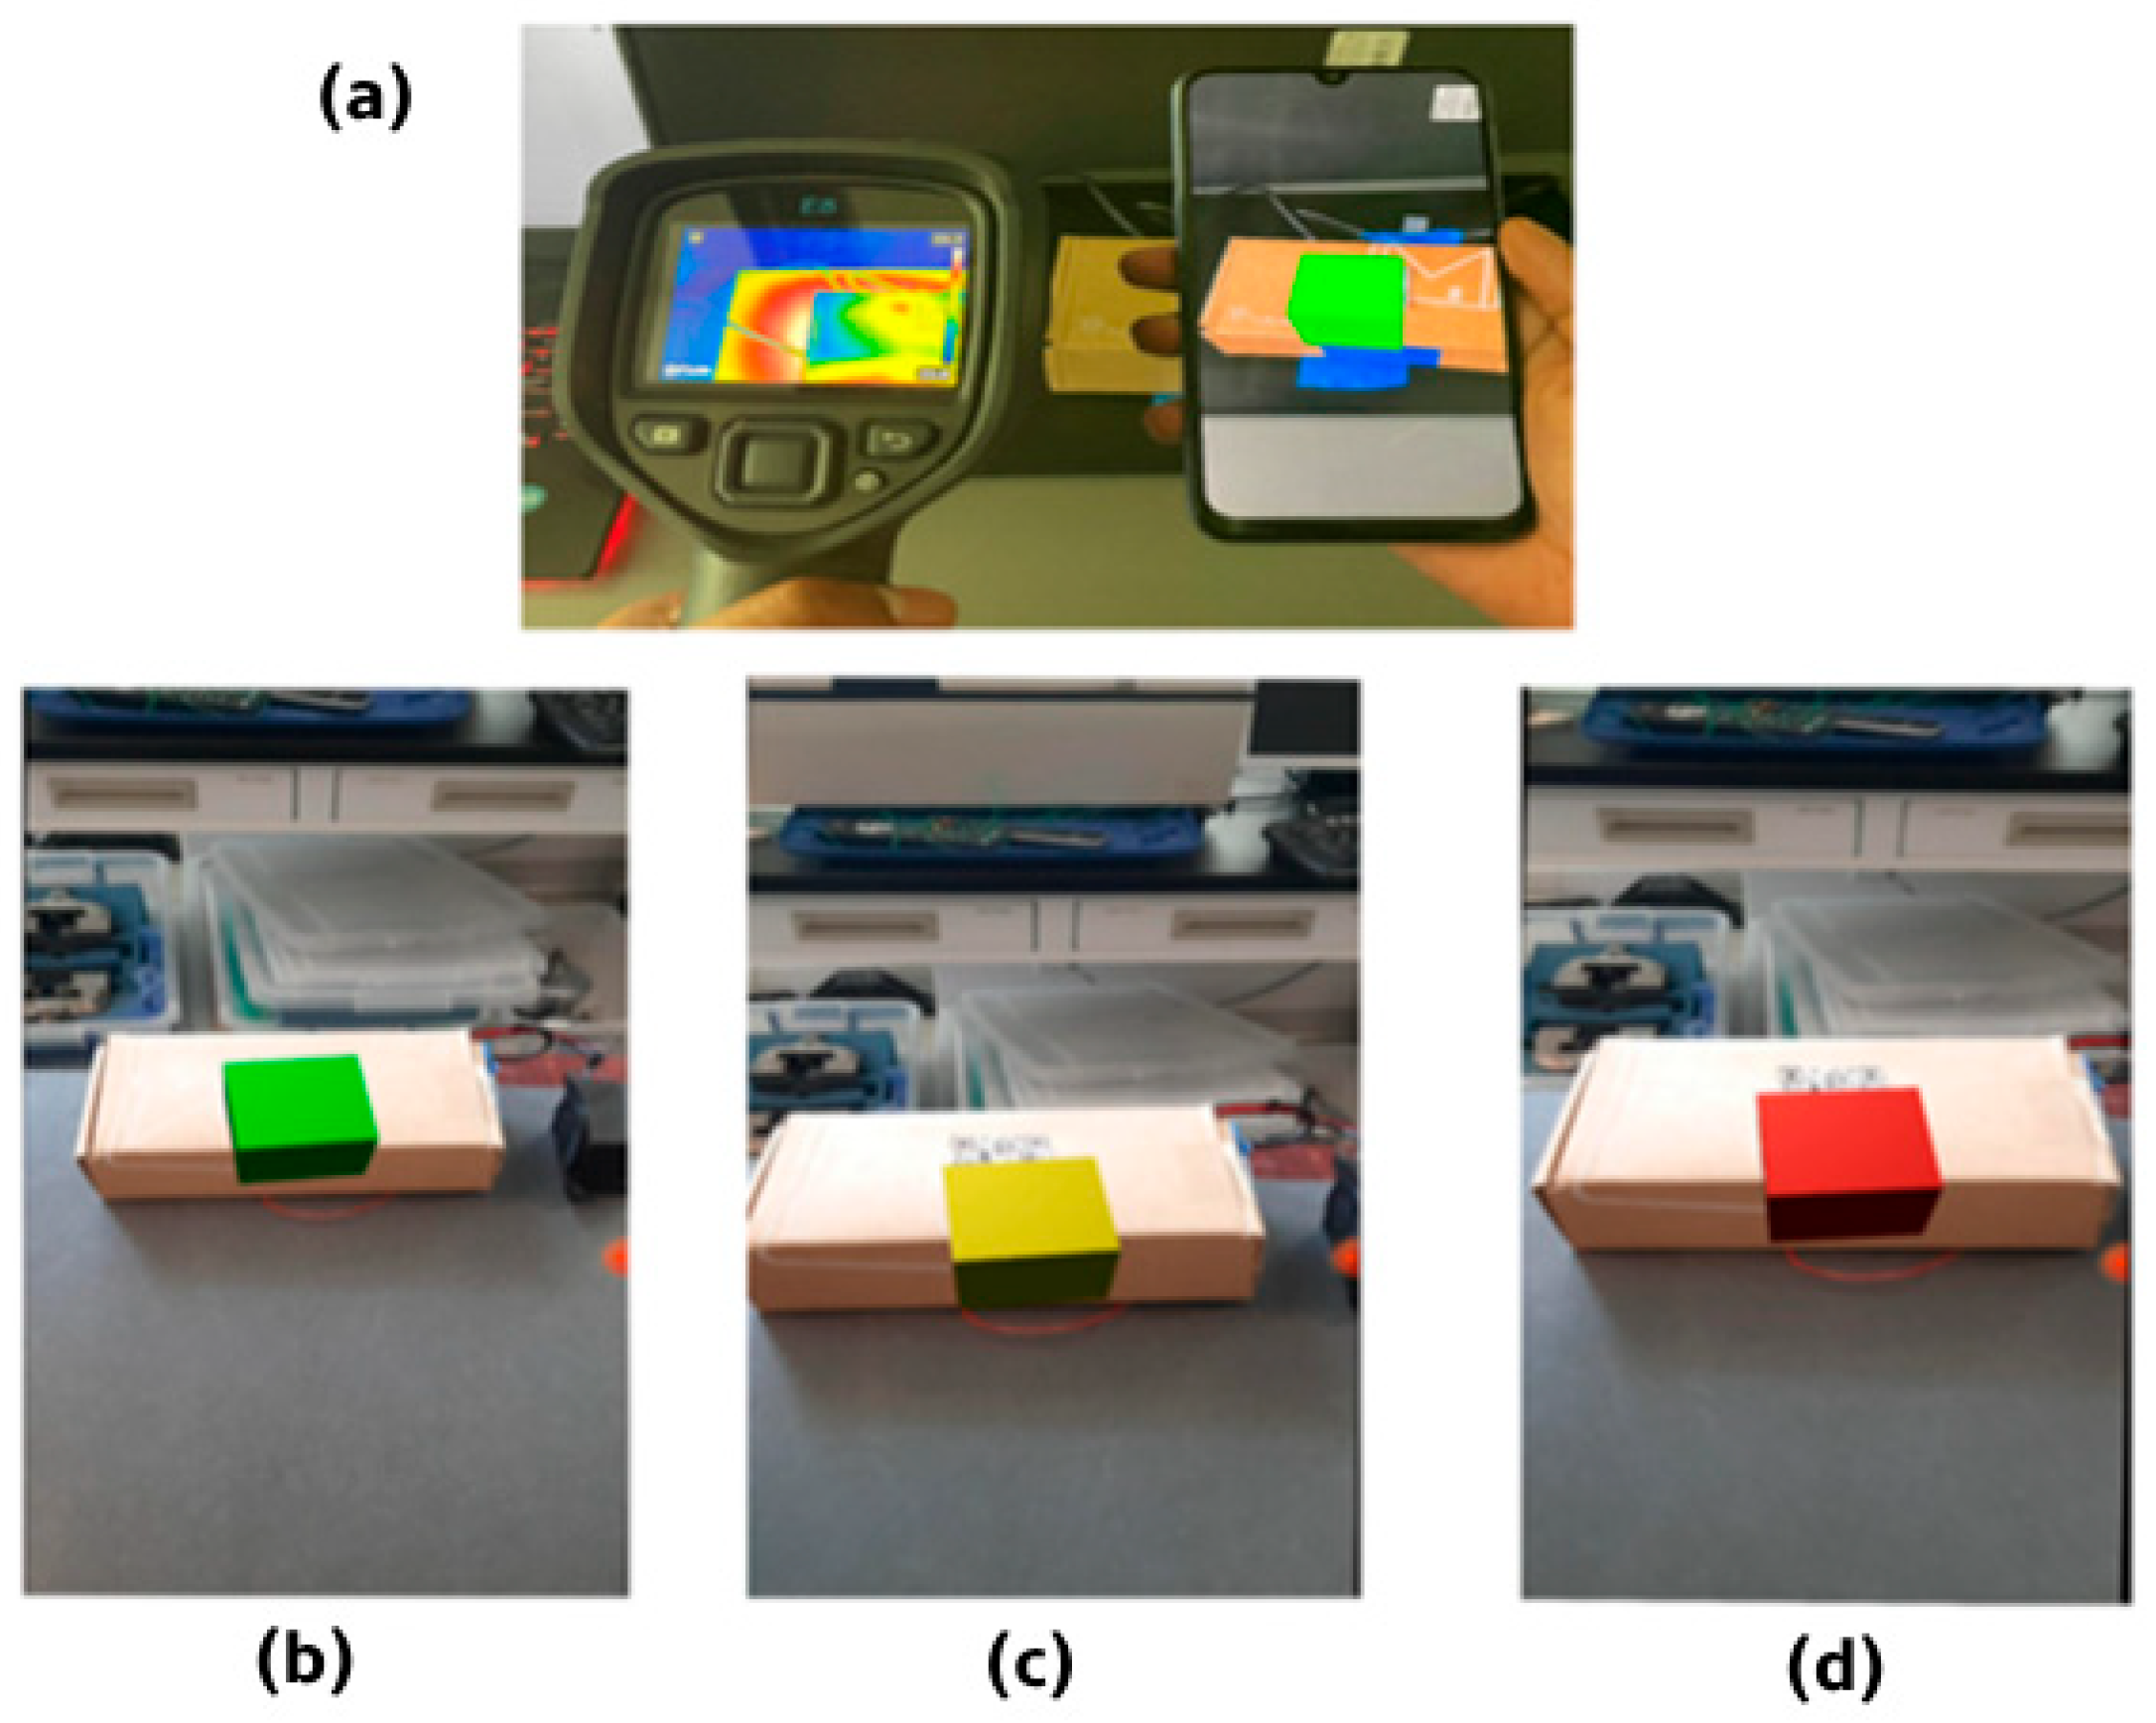
The experimental setup employed for the user study is shown in Figure 4. Two experiments were designed for comparison: one with FLIR E8 thermal camera and another with the developed XR mobile application. The sample box was heated with the help of a ceramic heater with a fan. Additionally, the heater was connected to the manual on/off switch and a relay, which can be controlled virtually by the XR application. Furthermore, the GPLA sensor is connected to the microcontroller, which constantly updates the Firebase’s resistance value. In Firebase, the resistance value is auto scaled to the temperature value from the calibration dataset. The participants were requested to stand 2 m away from the control switch. Each participant was tasked to monitor the temperature at three-level (50 °C, 60 °C, 65 °C) and instructed to turn off the heater when it reached 65 °C. Firstly, this experiment was conducted with the help of a thermal camera and the manual switch and with the GPLA sensor for temperature sensing. Next, the same experiment was conducted with the XR mobile application connected with Firebase and a relay to control the heater. Furthermore, the XR game object (cube) will pop up on the screen as soon as the mobile camera scans the image target (QR Code) [58], as shown in Figure 3. Additionally, the game object (cube) will change its color into presumed colors/values: “Green: 55 °C (low)”, “Yellow: 60 °C (medium)”, and “Red: 65 °C (high)” as shown in Figure 5. The GPLA constantly updates its resistance value to the Firebase through the microcontroller. Eight participants (2 female and 6 male) volunteered for the experiments, aged between 21 and 35 years old. Their previous experience in using XR smartphone applications spread among the groups of “little to no experience” (<5 h), “moderate experience” (5–100 h) and “extensive experience” (>100 h). Most of them had some experience with AR games (5) and eCommerce applications like the IKEA AR [59] store (2). Only one participant had a previous experience with AR demos. All participants had normal or corrected-to-normal vision. Furthermore, all the participants were given a general introduction to the practical importance of inventory management in factory settings and trained equally to practice both experiments three times prior to the actual experimentation. Upon each experiment, the following metrics were measured:
  • Metric 1: Response time—the time taken to “turn off” the heater after reaching the maximum temperature.
  • Metric 2: Error—change in temperature upon completing the task.
  • Metric 3: Presence—after each experiment, every participant assessed the feeling of presence in the virtual environment using the Holistic Presence Questionnaire (HPQ) [58]; the scores were calculated based on the official source for the HPQ questionnaire.
  • Metric 4: Ease and frequency of use, intuitive, orientation, speed, and fatigue—following the completion of each experiment, the participants were given a 5-point Likert scale [60] and asked to rate the ease and frequency of use, intuition, speed, and fatigue of the method (1—strongly disagree, 2—disagree. 3—neutral, 4—agree, 5—strongly agree).
During each user test, the research team complied with the study ethics (H21-03556- A002) and health & safety precautions. Every piece of testing equipment was cleaned with disinfectant after each experiment, and the test room was left open to the air for at least an hour between the participants. Other logistics and experimental factors considered to ensure a within-subject user study, are outlined in Appendix A.

3. Results and Discussion

3.1. 3D-Printed Graphene Temperature Sensor

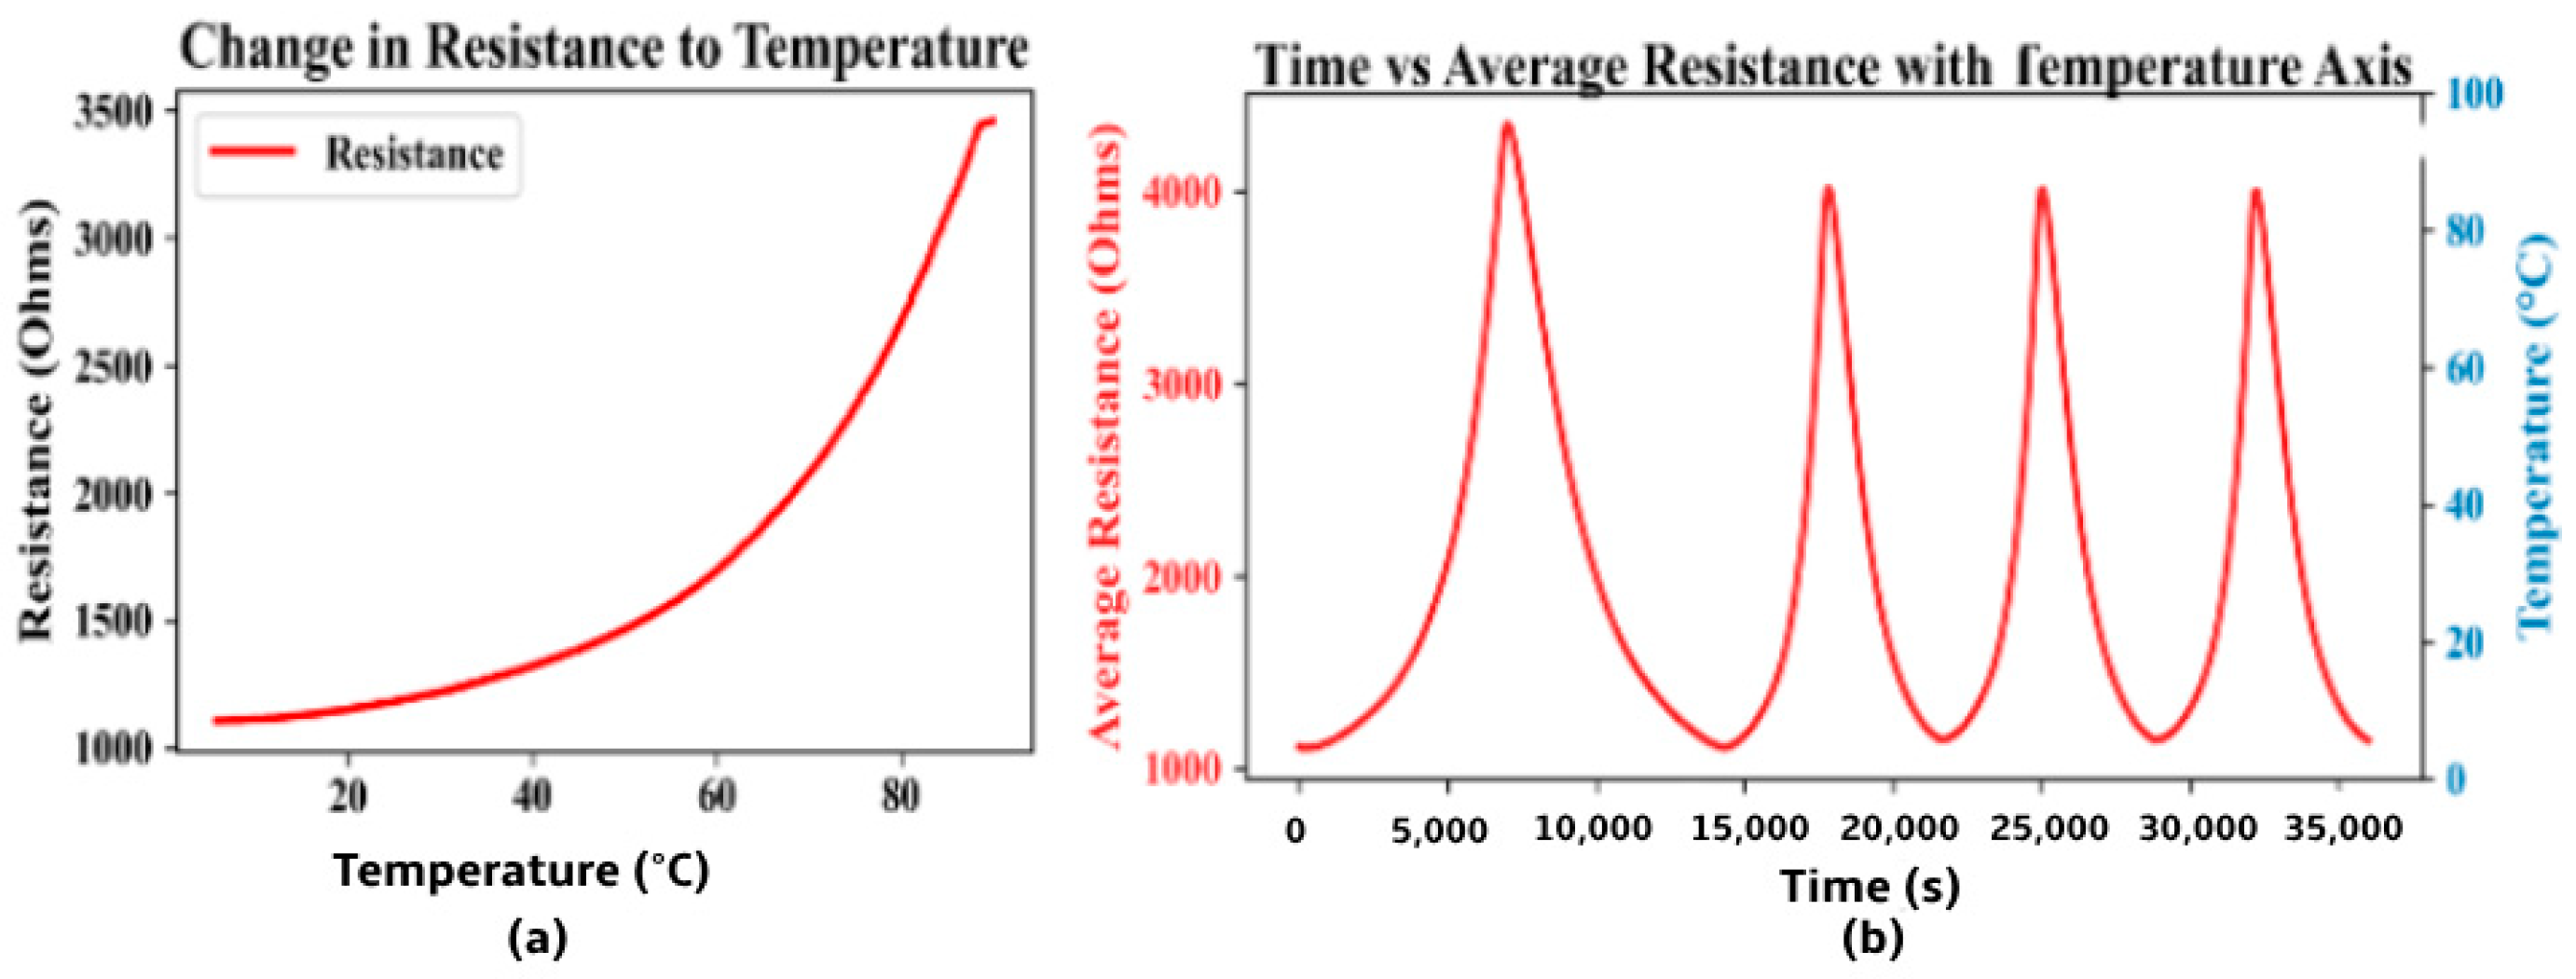
The sensing properties of the 3D-printed GPLA temperature sensor was determined by electrically characterizing the sensing device and measuring its resistance change in the contact mode, at controlled temperature increments between 0 °C to 100 °C using an environmental chamber as shown in Figure 6a. The thermal coefficient of resistance (TCR) was defined as TCR = (Rb − Ra)/Ra (ΔT), where ΔT = Tb − Ta is the change in the temperature, and Ra and Rb are the initial and final resistance, respectively [60,61,62,63,64]. The ensuing master curve (temperature dependence) of the GPLA resistance is shown in Figure 4a. The calculated TCR for GPLA was ~0.0061 °C−1. In addition, a cyclic temperature loading was applied within the same temperature range to analyze the sensor’s repeatability when under repetitive measures. Figure 4b shows that the sensor resistance has a positive temperature coefficient (PTC) behavior, with resistance displaying a gradual slope in the low-temperature regime (0 °C to 40 °C), suggesting an approximately linear relationship. Beyond this range, the slope increases non-linearly, transitioning to a parabolic trend as the temperature approaches ~40 °C. This change of behavior at ~40 °C is because of approaching the glass transition temperature of the PLA, which is between 50 °C to 80 °C [65,66,67,68,69]. A similar behavior was reported for, e.g., graphene-based thermistors on a PDMS substrate [70], printed graphene electrodes on a PET substrate [71], and multiwall carbon nanotubes [72]. Regarding the sensing robustness, Figure 6b shows that the sensor behavior remains primarily unchanged over temperature cycles. Finally, the stability of the GPLA sensor over time (i.e., against potential uncontrolled fluctuations during the length of each user-study test) was investigated by recording its resistive response in the environmental chamber when maintained at a constant room temperature of 25 °C. On average, a drift of −0.5% was measured for the RTDs over 12 h. The response and recovery time of the sensor were assessed by interchanging the chamber temperature between 10 °C and 20 °C. The response time, defined as the time taken to achieve 90% of the total resistance change, was measured to be 1.1 min. While this moderate response time is slower compared to certain commercial high-speed probes, it remains well suited to the assumed typical warehouse scenarios where temperature shifts tend to be gradual.

3.2. XR-Based Temperature Monitor and Control

3.2.1. Evaluation of the User Study Metrics

A standard paired t-test [73,74] was used to statistically determine how XR-based and manual temperature control methods have affected the response time and target temperature error (note that these are quantifiable metrics with interval scales among the four metrics listed in Section User Study; Metric 3 was measured via the HPQ scale). Table 1 provides an overview of results of these three metrics. The manual temperature control method in which participants relied on a thermal camera and physical switch to turn off the heater has had a mean (M) response time of 4.36 s and a standard deviation (SD) of 1.97 s. In comparison, the XR-based temperature monitor and control method had a response time significantly faster than the manual method. In addition, the process based on XR has had a lower standard deviation of response time. The average time needed to respond for the participants using this technique was 1.97 s, while the standard deviation was 0.73 s. These findings were supported by the statistically significant main effects (t = −3.123, p < 0.05). In addition, the post-hoc analysis showed statistically significant differences between all pairs (p < 0.001) of treatments. The standard deviation of the mean temperature error using XR was 0.40 °C, and the mean temperature error was 0.91 °C. On the other hand, the manual method had a much higher temperature error mean (2.23 °C) and a standard deviation of 0.71. Due to the non-parametric nature of the data, a one-sample Wilcoxon signed-rank test [74] was utilized to evaluate various impacts, including sensory, emotional, cognitive, behavioral, and reasoning. This method is particularly suited for small sample sizes, such as the eight participants in this study, providing robust statistical analysis when data distribution assumptions cannot be met. The Wilcoxon signed-rank test is advantageous in these scenarios because it does not require the assumption of normality and making it a reliable choice for analyzing data that may not follow a Gaussian distribution [74,75]. Non-parametric tests like the Wilcoxon signed-rank test are effective for small sample sizes, as they maintain statistical power while accommodating the inherent variability in such datasets. For instance, Akbulut notes that the Wilcoxon signed-rank test is particularly useful when the sample size is below the conventional threshold of 30, where normality assumptions may not hold [76]. Additionally, O’Malley et al. emphasize the applicability of the Wilcoxon signed-rank test in studies with small sample sizes and non-normal data distributions, reinforcing its validity in psychological and behavioral research [77]. In this study, the participants were first regarding their perceptions of the authenticity of the depicted natural environment. Even though it had a mean sensory score of 3.50 and a standard deviation of 1.95, most users believed it was natural. Furthermore, the fact that the main effect was statistically significant (p < 0.05) lends credence to the conclusion reached. Further, the participants have questioned: “whether their sensation was consistent and agreed with the represented environment”. This allowed the research team to evaluate the psychological impact of the experiment. Most of the participant’s responses reflected an optimistic outlook, which resulted in an emotional score of 3.83 on average with a standard deviation of 1.60 points. This result had an effect that was statistically significant (p < 0.05) in nature. In addition, the standard deviation for the cognitive impact score was 1.60, while the standard deviation for the behavioral impact score was 1.64.
The mean score for the cognitive impact was 3.50, and the score for the behavioral impact was 3.83. Both groups of results showed statistically significant coefficient of variations (p < 0.05). After the survey, the participants were questioned regarding their thoughts on whether the XR environment that had been created felt natural. Most respondents indicated that they agreed with this, giving it a mean score of 4 with a standard deviation of 1.67 (p < 0.05). Similarly, most respondents (with a score of 4.0 out of 5.0) showed an agreement with the XR application’s effect on enhanced reasoning (Table 1).

3.2.2. Evaluation of Metric 4: Ease and Frequency of Use, Speed, Fatigue, Trust, and Reliability

Under the 4th metric (per Section User Study), to evaluate the subjective feedback of users regarding each sub-metric of ‘ease of use’, ‘intuition’, ‘speed’, ‘fatigue’, ‘trust’, and ‘reliability’, we conducted a Wilcoxon signed-rank test [74,76]. Based on Table 2, the participants found that the XR method was much easier to use when compared to the manual method, with a mean score of 4.5 (out of 5) and a standard deviation of 0.83 (p < 0.05). Furthermore, the participants found that the XR method was more intuitive, with a mean score as high as 4.17 and a standard deviation of 0.75, compared to the manual method with a mean score of 2.0 and a standard deviation of 0.89 (p < 0.05). However, with a mean score of 3.0 and a standard deviation of 1.26, the participants rated the manual method as slightly more trustable than the XR method. Similarly, with a mean score of 4.17 and a standard deviation of 0.75, the participants concurred that the manual method is slightly more reliable than the XR method. However, for both reliability and trust factors, the scores between the two methods were not statistically significant (p > 0.05). Expectedly, the participants experienced 50%much less fatigue when using the XR method (with a mean score of 1.83 and standard deviation of 0.98) compared to when using the manual method, which had a mean fatigue score as high as 4.0 with a standard deviation of 0.89 (p < 0.05). Participants agreed that an XR method has been nearly two times quicker to use compared to the manual method (p < 0.05).

3.3. Discussion: Challenges and Future Perspective

The present case study demonstrated that integrating additive manufacturing (AM)-fabricated graphene–PLA sensor with extended reality (XR) and cyber–physical systems (CPSs) analytics significantly addresses major limitations inherent in traditional thermal imaging-based monitoring and control systems. Conventional thermal cameras typically exhibit spatial constraints, delayed responses due to manual interventions, and insufficient integration of real-time data-driven feedback loops. The low-cost graphene–PLA based sensing ($3–$5/sensor) overcomes such challenges by embedding digital connectivity directly within the electrically conductive feature of the nanocomposite, thereby creating a seamless material–digital interface as also aligned with the principles of the NIST CPS/IoT Components Model [25]. This integration, in turn, facilitated intuitive, efficient real-time feedback loops, enhancing operational decision-making and automation capabilities by users.
From a materials science perspective, the above performance would be partly attributed to a combination of material properties and fabrication choices. Namely, the graphene–PLA composite itself exhibits high thermal conductivity, enabling precise, localized thermal sensing with minimal thermal inertia. In parallel, an optimized additive manufacturing strategy, including carefully controlled layer orientation and increased surface area, ensures tight thermal coupling to the monitored surface, thereby reducing thermal mass and improving response accuracy.
Nevertheless, we believe the greater efficiency observed arises primarily from the CPS-integrated design itself [25], rather than sensor accuracy alone. The CPS framework facilitates intuitive and convenient real-time emissivity calibration by users via a structured three-step control process (visual indication, XR-based remote adjustment, and immediate verification). Compared to the earlier literature, e.g., similar graphene-based sensors were developed by Ding et al. [78] and Wang et al. [79]. Despite their millisecond-scale responsiveness suitable for physiological monitoring, they did not offer real-time actuation or integrated XR interfaces. Similarly, the coaxially spun thermoelectric fibers by Jiang et al. [80] demonstrated effective thermal sensing and mechanical resilience, yet requiring external visualization and interaction platforms for CPS integration. In contrast, the present graphene–PLA sensor system integrated XR visualization for an intuitive temperature indication, along with remote actuation capabilities, creating a human-in-the-loop CPS environment.
Experimental measurements in Section 3.2 highlighted that the XR-integrated graphene–PLA sensing system achieved a 2.2-fold faster shutdown response (1.97 s versus 4.36 s) and an 82% improvement in shutdown accuracy (0.91 °C error versus 2.23 °C), comparted to the manual control scenario. Traditional thermal cameras often require precise emissivity settings and periodic recalibrations, introducing errors in the range 3–5 °C. Conversely, the low-cost graphene–PLA sensor maintained a desired calibration stability of ±0.5 °C drift, over 12 h [61].
However, the same user study identified a critical challenge regarding user trust and reliability in such automated XR-integrated systems. Despite achieving a 50% reduction in operator fatigue, the participants expressed comparatively lower trust in the XR system (average rating of 2.83/5) relative to the manual thermal-camera method (3.0/5). To analyze potential causes of this diminished trust, several key issues were identified: user unfamiliarity with XR interfaces, concerns regarding data accuracy and visualization fidelity (specifically, whether color-coded cues precisely reflect actual temperatures), possible latency in live data updates, and participants’ tendency to default to familiar manual tools. To effectively address such concerns in future studies, the authors recommend a comprehensive multi-pronged strategy as follows”
  • Hands-on Training: conduct more structured, hands-on workshops to enhance user familiarity and confidence with the XR environment and its reliability.
  • Iterative Usability Testing: refine XR interface elements iteratively to minimize cognitive load and enhance intuitiveness and ease of use.
  • Latency Reduction: optimize data pipelines and networking to ensure real-time sensor updates without perceptible delays.
  • Multiple Feedback Mechanisms: integrate multiple forms of user feedback, including visual, haptic, and auditory cues, alongside color-coded indicators to reinforce user confidence in sensor readings.
  • Ongoing Validation Exercises: regularly benchmark XR sensor readings against established physical methods (such as thermal cameras), transparently presenting performance metrics within the XR interface itself.
  • User Feedback Loops: systematically solicit and incorporate participant feedback after each CPS design trial, allowing iterative improvements that continually enhance trust and user satisfaction.
Looking towards future advancement from the sensing and materials perspective, inspired by recent advances such as thermally drawn polymer composite fibers [81] and coaxially spun thermoelectric fibers [80], the future work can expand sensing capabilities by including additional environmental parameters like humidity, pressure, or gas composition into the design. Hybrid composite strategies, as demonstrated by hyperplastic graphene aerogels reported by Yin et al. [82], could also further enhance the sensor mechanical resilience and broaden its functionalities. Durability is critical, and the current graphene–PLA sensor can significantly benefit from adopting rigorous scalability assessments and cyclic mechanical and thermal stress evaluations as performed by Wang et al. [79], ensuring consistent long-term reliability particularly in AGV-dominated warehouse settings. Furthermore, incorporating predictive analytics using AI-driven methods outlined by Ryu et al. [81] can proactively forecast thermal anomalies, thereby optimizing maintenance schedules and overall operational efficiency. In doing so, the conundrum of limited data availability in industrial settings for training of AI models will also need to be addressed [83]. Finally, sustainable manufacturing practice, such as optimizing graphene–PLA filament production through solvent-free extrusion, can mitigate environmental impacts of such CPS designs, alongside lifecycle assessments, e.g., comparing the carbon footprint of AM sensors with that of conventional metal-oxide alternatives, and eventually implementing a systematic material selection approach [84].

4. Conclusions

This demonstrative case study integrated 3D printing of a conductive nanocomposite sensor with XR and the IoT capability towards a simulated smart factory warehouse, where the goal is to enable the user’s safe and remote monitoring of parts temperature while enhancing their safety and experience. The main findings included:
  • The graphene-PLA sensor exhibited a thermal coefficient of resistance (TCR) of approximately 0.0061 °C−1, demonstrating a promising capability for real-time temperature assessments and achieving a response time of 1.1 min while maintaining a drift of approximately −0.5% over a 12-h period.
  • The user study experiment data, based on both quantitative and qualitative metrics, favored the sensor-XR-based temperature monitoring and control system over the traditional manual training method using thermal camera. Namely, implementing the sensor in conjunction with the XR interface led to improved user response efficiency, reducing the task completion time to 1.97 s compared to 4.36 s of the conventional method. The new system elevated the accuracy metric, with an error of 0.91 °C versus 2.23 °C.
  • Another improvement was the fact that participants were able to monitor and control the temperature without the need to physically move from their monitoring location (as opposed to the manual method). This would reduce fatigue when using the sensor-XR system while enhancing safety, for example, when handling components with excessive temperature or radiation. The average recorded movement speed for participants during the manual method was 0.191 m/s.
  • Participants commented on the increased degree of freedom and multitasking capabilities provided by the sensor-XR system within the working floor space. However, they also indicated concerns regarding trust in such automated systems, reflected in a relatively low score of 2.83/5.00. This suggests a broader issue for future studies regarding the enhancement of the user acceptance of emerging digital technologies under Industry 4.0, as well as the continual training and upskilling of operators in their use.

Supplementary Materials

The following supporting information can be downloaded at: https://www.mdpi.com/article/10.3390/jsan14040068/s1, Supplementary Video S1: The XR demonstration.

Author Contributions

Conceptualization, R.J.K.; methodology, R.J.K. and A.S.M.; software, R.J.K.; validation, R.J.K. and A.S.M.; formal analysis, R.J.K.; investigation, R.J.K.; resources, R.J.K. and A.S.M.; data curation, R.J.K.; writing-original draft preparation, R.J.K.; writing review and editing, R.J.K. and A.S.M.; visualization, R.J.K.; supervision, A.S.M.; project administration, A.S.M.; funding acquisition, A.S.M. All authors have read and agreed to the published version of the manuscript.

Funding

This research was funded by Natural Sciences and Engineering Research Council (NSERC) of Canada, under CREATE in Immersive Technologies program.

Data Availability Statement

Data will be made available upon request.

Acknowledgments

The authors are grateful to their colleagues at the Composites Research Network for stimulating discussions during the study.

Conflicts of Interest

The authors declare no conflict of interest.

Appendix A. Other (Secondary) Experimental Factors Considered

Table A1. Other experimental factors considered to ensure a within-subject user study (in which all participants are exposed to every treatment or condition equally).
FactorDescription
Distance from the TargetThe object of the temperature control can be defined as the target. Regarding thermal cameras, the temperature measurement accuracy is directly related to the distance between the camera and the object being measured. Furthermore, the distance between the physical control switch also affects the time taken to respond to a high-temperature measurement. Similarly, when using the XR tool, the camera’s focus can be affected by the distance between the user and the object, and the image target might not be activated. However, because of the IoT, the temperature control is not affected by the distance between the object and the user. Here, the distance between the users was fixed at 2 m. In addition, the floor was marked with red tape to ensure the users maintained the distance uniformly.
Number of targetsThe number of targets to measure can affect the experiment’s time and the user’s fatigue level. Here, the target number was fixed at one object. However, the model can be scaled to as many targets as needed.
Devices usedThe instruments used during tests can impact the user experience, response time, fatigue, and other factors due to the device’s specifications, such as screen size, camera focal length, phone weight, and device resolution. Here, to expose all participants to the same device treatment, the same FLIR E8 thermal camera was used (for Experiment 1) and the same Samsung M30 Android smartphone (for Experiment 2).
Target location and directionChanges in the direction of the target at each trial would introduce interactions, and differences in the target could demand increased mobility, which may contribute to the user’s fatigue and increase the time taken to complete the task. Here, throughout the experiments, the target was placed in the same direction in front of the user.

References

  1. Nuanmeesri, S.; Tharasawatpipat, C.; Poomhiran, L. Transfer Learning Artificial Neural Network-based Ensemble Voting of Water Quality Classification for Different Types of Farming. Eng. Technol. Appl. Sci. Res. 2024, 14, 15384–15392. [Google Scholar] [CrossRef]
  2. Klieštik, T.; Kral, P.; Bugaj, M.; Durana, P. Generative Artificial Intelligence of Things Systems, Multisensory Immersive Extended Reality Technologies, and Algorithmic Big Data Simulation and Modelling Tools in Digital Twin Industrial Metaverse. Equilibrium. Q. J. Econ. Econ. Policy 2024, 19, 429–461. [Google Scholar] [CrossRef]
  3. Nuanmeesri, S. The Affordable Virtual Learning Technology of Sea Salt Farming across Multigenerational Users through Improving Fitts’ Law. Sustainability 2024, 16, 7864. [Google Scholar] [CrossRef]
  4. Zheng, D.; Fu, X.; Liu, X.; Xing, L.; Peng, R. Modeling and Analysis of Cascading Failures in Industrial Internet of Things Considering Sensing-Control Flow and Service Community. IEEE Trans. Reliab. 2024, 74, 2723–2737. [Google Scholar] [CrossRef]
  5. Fu, X.; Pace, P.; Aloi, G.; Li, W.; Fortino, G. Toward robust and energy-efficient clustering wireless sensor networks: A double-stage scale-free topology evolution model. Comput. Netw. 2021, 200, 108521. [Google Scholar] [CrossRef]
  6. Baumers, M.; Tuck, C.; Wildman, R.; Ashcroft, I.; Hague, R. Shape Complexity and Process Energy Consumption in Electron Beam Melting: A Case of Something for Nothing in Additive Manufacturing? J. Ind. Ecol. 2016, 21, S157–S167. [Google Scholar] [CrossRef]
  7. Ching, N.T.; Ghobakhloo, M.; Iranmanesh, M.; Maroufkhani, P.; Asadi, S. Industry 4.0 Applications for Sustainable Manufacturing: A Systematic Literature Review and a Roadmap to Sustainable Development. J. Clean. Prod. 2022, 334, 130133. [Google Scholar] [CrossRef]
  8. Yao, X.; Ma, N.; Zhang, J.; Wang, K.; Yang, E.; Faccio, M. Enhancing Wisdom Manufacturing as Industrial Metaverse for Industry and Society 5.0. J. Intell. Manuf. 2022, 35, 235–255. [Google Scholar] [CrossRef]
  9. Kammerer, K.; Pryss, R.; Sommer, K.; Reichert, M. Towards Context-Aware Process Guidance in Cyber-Physical Systems with Augmented Reality. In Proceedings of the 2018 4th International Workshop on Requirements Engineering for Self-Adaptive, Collaborative, and Cyber Physical Systems (RESACS), Banff, AB, Canada, 20 August 2018; pp. 44–49. [Google Scholar] [CrossRef]
  10. Mourtzis, D.; Angelopoulos, J. Development of an Extended Reality-Based Collaborative Platform for Engineering Education: Operator 5.0. Electronics 2023, 12, 3663. [Google Scholar] [CrossRef]
  11. Yang, C.; Tu, X.; Autiosalo, J.; Ala-Laurinaho, R.; Mattila, J.; Salminen, P.; Tammi, K. Extended Reality Application Framework for a Digital-Twin-Based Smart Crane. Appl. Sci. 2022, 12, 6030. [Google Scholar] [CrossRef]
  12. Liu, X.; Cao, J.; Yang, Y.; Jiang, S. CPS-based smart warehouse for Industry 4.0: A survey of the underlying technologies. Computers 2018, 7, 13. [Google Scholar] [CrossRef]
  13. Odeyinka, O.F.; Omoegun, O.G. Warehouse Operations: An Examination of Traditional and Automated Approaches in Supply Chain Management. IntechOpen 2023. [Google Scholar] [CrossRef]
  14. Sodiya, E.O.; Umoga, U.J.; Amoo, O.O.; Atadoga, A. AI-driven warehouse automation: A comprehensive review of systems. GSC Adv. Res. Rev. 2024, 18, 272–282. [Google Scholar] [CrossRef]
  15. Oliveira, G.; Röning, J.; Plentz, P.; Carvalho, J. Efficient task allocation in smart warehouses with multi-delivery stations and heterogeneous robots. arXiv 2022, arXiv:2203.00119. [Google Scholar] [CrossRef]
  16. Sahara, C.; Aamer, A. Real-time data integration of an Internet-of-Things-based smart warehouse: A case study. Int. J. Pervasive Comput. Commun. 2021, 18, 622–644. [Google Scholar] [CrossRef]
  17. Affia, I.; Aamer, A. An Internet of Things-based smart warehouse infrastructure: Design and application. J. Sci. Technol. Policy Manag. 2021, 13, 90–109. [Google Scholar] [CrossRef]
  18. Geest, M.; Teki, B.; Catal, C. Smart warehouses: Rationale, challenges and solution directions. Appl. Sci. 2021, 12, 219. [Google Scholar] [CrossRef]
  19. Hefnawy, A.; Bouras, A.; Cherifi, C. IoT for smart city services. In Proceedings of the 2016 Augmented Human International Conference, Geneva, Switzerland, 25–27 February 2016; pp. 10–15. [Google Scholar] [CrossRef]
  20. Zheng, P.; Lin, T.; Chen, C.; Xu, X. A systematic design approach for service innovation of smart product-service systems. J. Clean. Prod. 2018, 201, 657–667. [Google Scholar] [CrossRef]
  21. Zhang, J.-H.; Li, Z.; Liu, Z.; Li, M.; Guo, J.; Du, J.; Cai, C.; Zhang, S.; Sun, N.; Li, Y.; et al. Inorganic Dielectric Materials Coupling Micro-/Nanoarchitectures for State-of-the-Art Biomechanical-to-Electrical Energy Conversion Devices. Adv. Mater. 2025, 2419081. [Google Scholar] [CrossRef]
  22. Bose, S.; Kar, B.; Roy, M.; Gopalakrishnan, P.; Basu, A. Adepos. In Proceedings of the ASPDAC 19: 24th Asia and South Pacific Design Automation Conference, Tokyo, Japan, 21–24 January 2019; pp. 597–602. [Google Scholar] [CrossRef]
  23. Tan, Y.; Yang, W.; Yoshida, K.; Takakuwa, S. Application of IoT-aided simulation to manufacturing systems in cyber-physical system. Machines 2019, 7, 2. [Google Scholar] [CrossRef]
  24. Dewi, I.; Shofa, R. Development of warehouse management system to manage warehouse operations. JAISI 2023, 1, 15–23. [Google Scholar] [CrossRef]
  25. Burns, M.; Manganelli, J.; Wollman, D.; Boring, R.L.; Gilbert, S.; Griffor, E.; Lee, Y.C.; Nathan-Roberts, D.; Smith-Jackson, T. Elaborating the human aspect of the NIST framework for cyber-physical systems. Proc. Hum. Factors Ergon. Soc. Annu. Meet. 2018, 62, 450–454. [Google Scholar] [CrossRef]
  26. Dafflon, B.; Moalla, N.; Ouzrout, Y. The challenges, approaches, and used techniques of CPS for manufacturing in Industry 4.0: A literature review. Int. J. Adv. Manuf. Technol. 2021, 113, 2395–2412. [Google Scholar] [CrossRef]
  27. Peng, X.; Kuang, X.; Roach, D.J.; Wang, Y.; Hamel, C.M.; Lu, C.; Qi, H.J. Integrating digital light processing with direct ink writing for hybrid 3D printing of functional structures and devices. Addit. Manuf. 2021, 40, 101911. [Google Scholar] [CrossRef]
  28. Xu, Z.; Kolev, S.; Todorov, E. Design, Optimization, Calibration, and a Case Study of a 3D-Printed, Low-Cost Fingertip Sensor for Robotic Manipulation. In Proceedings of the 2014 IEEE International Conference on Robotics and Automation (ICRA), Hong Kong, China, 31 May–7 June 2014; Available online: https://ieeexplore.ieee.org/document/6907253 (accessed on 15 June 2025).
  29. Patel, S.; Park, H.; Bonato, P.; Chan, L.; Rodgers, M. A review of wearable sensors and systems with application in rehabilitation. J. Neuroeng. Rehabil. 2012, 9, 21. [Google Scholar] [CrossRef]
  30. Luo, Y.; Abidian, M.R.; Ahn, J.-H.; Akinwande, D.; Andrews, A.M.; Antonietti, M.; Bao, Z.; Berggren, M.; Berkey, C.A.; Bettinger, C.J.; et al. Technology Roadmap for Flexible Sensors. ACS Nano 2023, 17, 5211–5295. [Google Scholar] [CrossRef]
  31. Dasarathy, B. Sensor fusion potential exploitation—Innovative architectures and illustrative applications. IEEE J. Mag. 1997, 85, 24–38. [Google Scholar] [CrossRef]
  32. Ando, B.; Baglio, S. All-Inkjet Printed Strain Sensors. IEEE J. Mag. 2013, 13, 4874–4879. [Google Scholar] [CrossRef]
  33. Correia, V.; Caparros, C.; Casellas, C.; Francesch, L.; Rocha, J.G.; Lanceros-Mendez, S. Development of inkjet printed strain sensors. Smart Mater. Struct. 2013, 22, 105028. [Google Scholar] [CrossRef]
  34. Luo, X.; Cheng, H.; Chen, K.; Gu, L.; Liu, S.; Wu, X. Multi-Walled Carbon Nanotube-Enhanced Polyurethane Composite Materials and the Application in High-Performance 3D Printed Flexible Strain Sensors. Compos. Sci. Technol. 2024, 257, 110818. [Google Scholar] [CrossRef]
  35. Kim, K.; Park, J.; Suh, J.-H.; Kim, M.; Jeong, Y.; Park, I. 3D printing of multiaxial force sensors using carbon nanotube (CNT)/thermoplastic polyurethane (TPU) filaments. Sens. Actuators A Phys. 2017, 263, 493–500. [Google Scholar] [CrossRef]
  36. Nag, A.; Feng, S.; Mukhopadhyay, S.C.; Kosel, J.; Inglis, D. 3D printed mould-based graphite/PDMS sensor for low-force applications. Sens. Actuators A Phys. 2018, 280, 525–534. [Google Scholar] [CrossRef]
  37. Lee, B.M.; Nguyen, Q.H.; Shen, W. Flexible Multifunctional Sensors Using 3-D-Printed PEDOT:PSS Composites. IEEE J. Mag. 2024, 24, 7584–7592. [Google Scholar] [CrossRef]
  38. Qian, F.; Jia, R.; Cheng, M.; Chaudhary, A.; Melhi, S.; Mekkey, S.D.; Zhu, N.; Wang, C.; Razak, F.; Xu, X.; et al. An overview of polylactic acid (PLA) nanocomposites for sensors. Adv. Compos. Hybrid Mater. 2024, 7, 75. [Google Scholar] [CrossRef]
  39. Ionel, R.; Mâțiu-Iovan, L. Flying probe measurement accuracy improvement by external LCR integration. Measurement 2022, 190, 110703. [Google Scholar] [CrossRef]
  40. Wolterink, G.; Sanders, R.; Krijnen, G. Thin, Flexible, Capacitive Force Sensors Based on Anisotropy in 3D-Printed Structures. In Proceedings of the 2018 IEEE SENSORS, New Delhi, India, 28–31 October 2018. [Google Scholar] [CrossRef]
  41. Kebede, G.A.; Ahmad, A.R.; Lee, S.-C.; Lin, C.-Y. Decoupled Six-Axis Force–Moment Sensor with a Novel Strain Gauge Arrangement and Error Reduction Techniques. Sensors 2019, 19, 3012. [Google Scholar] [CrossRef] [PubMed]
  42. Shatokhin, O.; Dzedzickis, A.; Pečiulienė, M.; Bučinskas, V. Extended Reality: Types and Applications. Appl. Sci. 2025, 15, 3282. [Google Scholar] [CrossRef]
  43. Munir, A.; Aved, A.; Blasch, E. Situational Awareness: Techniques, Challenges, and Prospects. AI 2022, 3, 55–77. [Google Scholar] [CrossRef]
  44. Alhakamy, A. Extended Reality (XR) Toward Building Immersive Solutions: The Key to Unlocking Industry 4.0. ACM Comput. Surv. 2024, 56, 1–38. [Google Scholar] [CrossRef]
  45. Dodoo, J.E.; Al-Samarraie, H.; Alzahrani, A.I.; Tang, T. XR and Workers’ safety in High-Risk Industries: A comprehensive review. Saf. Sci. 2025, 185, 106804. [Google Scholar] [CrossRef]
  46. Xi, N.; Chen, J.; Gama, F.; Riar, M.; Hamari, J. The challenges of entering the metaverse: An experiment on the effect of extended reality on workload. Inf. Syst. Front. 2023, 25, 659–680. [Google Scholar] [CrossRef]
  47. Rivera, F.M.-L.; Mora-Serrano, J.; Oñate, E.; Montecinos-Orellana, S. A Comprehensive Framework for Integrating Extended Reality into Lifecycle-Based Construction Safety Management. Appl. Sci. 2025, 15, 5690. [Google Scholar] [CrossRef]
  48. Lesch, V.; Züfle, M.; Bauer, A.; Iffländer, L.; Krupitzer, C.; Kounev, S. A literature review of IoT and CPS—What they are, and what they are not. J. Syst. Softw. 2023, 200, 111631. [Google Scholar] [CrossRef]
  49. Mosqueira-Rey, E.; Hernández-Pereira, E.; Alonso-Ríos, D.; Bobes-Bascarán, J.; Fernández-Leal, Á. Human-in-the-loop machine learning: A state of the art. Artif. Intell. Rev. 2023, 56, 3005–3054. [Google Scholar] [CrossRef]
  50. Yang, S.J.; Ogata, H.; Matsui, T.; Chen, N.-S. Human-centered artificial intelligence in education: Seeing the invisible through the visible. Comput. Educ. Artif. Intell. 2021, 2, 100008. [Google Scholar] [CrossRef]
  51. Chen, H.; Li, S.; Fan, J.; Duan, A.; Yang, C.; Navarro-Alarcon, D.; Zheng, P. Human-in-the-Loop Robot Learning for Smart Manufacturing: A Human-Centric Perspective. IEEE J. Mag. 2025, 22, 11062–11086. [Google Scholar] [CrossRef]
  52. Hassan, M.; Shraban, S.S.; Islam, A.; Basaruddin, K.S.; Ijaz, M.F.; Bin Kamarrudin, N.S.; Takemura, H. Integration of Extended Reality Technologies in Transportation Systems: A Bibliometric Analysis and Review of Emerging Trends, Challenges, and Future Research. Results Eng. 2025, 21, 105334. [Google Scholar] [CrossRef]
  53. Conductive Graphene Filament. Filament2Print. Available online: https://filament2print.com/en/conductive/653-1508-conductive-graphene.html#/217-diameter-175_mm/626-format-spool_100_g (accessed on 15 June 2025).
  54. ESP32 Wi-Fi & Bluetooth SoC | Espressif Systems. Available online: https://www.espressif.com/en/products/socs/esp32 (accessed on 15 June 2025).
  55. Espressif Systems ESP32-DEVKITC-32E. DigiKey Electronics. Available online: https://www.digikey.in/en/products/detail/espressif-systems/ESP32-DEVKITC-32E/12091810 (accessed on 15 June 2025).
  56. Espressif, GitHub—Espressif/Arduino-esp32: Arduino Core for the ESP32. GitHub. Available online: https://github.com/espressif/arduino-esp32 (accessed on 15 June 2025).
  57. Firebase Data Storage. Available online: https://firebase.google.com/?gad_source=1&gad_campaignid=20100026061&gbraid=0AAAAADpUDOjTXyaVcul8Qsj3QW48AyiOT&gclid=CjwKCAjw3rnCBhBxEiwArN0QE9iPcmRp5jltY4X3ODtGV4-u2JhlcV74SBcdlbvRTm_j6PNmhUr8dBoCXS8QAvD_BwE&gclsrc=aw.ds (accessed on 15 June 2025).
  58. An Introduction to QR Code Technology. IEEE Conference Publication|IEEE Xplore. Available online: https://ieeexplore.ieee.org/document/7966807 (accessed on 15 June 2025).
  59. Ozturkcan, S. Service innovation: Using augmented reality in the IKEA Place app. J. Inf. Technol. Teach. Cases 2020, 11, 8–13. [Google Scholar] [CrossRef]
  60. Nuanmeesri, S.; Poomhiran, L. Perspective electrical circuit simulation with virtual reality. Int. J. Online Biomed. Eng. 2019, 15, 28–37. [Google Scholar] [CrossRef]
  61. Liu, J.; Chen, H.; Zhao, Y. Thermal coefficient of resistance in thin films: Implications for temperature-sensitive devices. Appl. Phys. Lett. 2020, 116, 123501. [Google Scholar] [CrossRef]
  62. Kuo, C.; Lin, Y.; Chang, C. Understanding the thermal coefficient of resistance in thermistors for enhanced performance. Sens. Actuators A 2019, 284, 232–241. [Google Scholar] [CrossRef]
  63. Wang, Y.; Zhang, H. Characterization of the thermal coefficient of resistance in conductive polymers. Polym. Test. 2021, 92, 106828. [Google Scholar] [CrossRef]
  64. Chen, L.; Li, Y. The influence of temperature on the electrical resistance of conductive materials. Mater. Sci. Eng. B 2017, 223, 1–23. [Google Scholar] [CrossRef]
  65. Oksiuta, Z.; Jalbrzykowski, M.; Mystkowska, J.; Romanczuk, E.; Osiecki, T. Mechanical and Thermal Properties of Polylactide (PLA) Composites Modified with Mg, Fe, and Polyethylene (PE) Additives. Polymers 2020, 12, 2939. [Google Scholar] [CrossRef]
  66. Pérez, M.A.; González, J. Thermal properties of polylactic acid (PLA) and its blends. Mater. Sci. Eng. C 2017, 80, 785. [Google Scholar] [CrossRef]
  67. Rasal, R.M.; Janorkar, A.V.; Hirt, D.E. Poly(lactic acid) modifications. Prog. Polym. Sci. 2008, 33, 391–410. [Google Scholar] [CrossRef]
  68. Auras, R.; Lim, L.T.; Selke, S.E.M.; Tsuji, H. Poly(Lactic Acid): Synthesis, Structures, Properties, Processing, and Applications; John Wiley & Sons: Hoboken, NJ, USA, 2013. [Google Scholar]
  69. Tsuji, H.; Eto, T.; Sakamoto, Y. Synthesis and Hydrolytic Degradation of Substituted Poly(DL-Lactic Acid)s. Materials 2011, 4, 1384–1398. [Google Scholar] [CrossRef]
  70. Zhang, Y.; Zhao, Y.; Zhang, J. Graphene-based thermistors on flexible PDMS substrates for temperature sensing applications. Sens. Actuators A 2018, 273, 147–158. [Google Scholar] [CrossRef]
  71. Htwe, Y.Z.N. and Mariatti, M. Printed graphene and hybrid conductive inks for flexible, stretchable, and wearable electronics: Progress, opportunities, and challenges. J. Sci. Adv. Mater. Devices 2022, 7, 100435. [Google Scholar] [CrossRef]
  72. Makwana, M.V.; Patel, A.M. Multiwall Carbon Nanotubes: A Review on Synthesis and Applications. Nanosci. Nanotechnol. Asia 2022, 12, e131021197215. [Google Scholar] [CrossRef]
  73. Xu, M.; Fralick, D.; Zheng, J.Z.; Wang, B.; Tu, X.M.; Feng, C. The differences and similarities between two-sample t-test and paired t-test. Shanghai Arch. Psychiatry 2017, 29, 184–188. [Google Scholar] [CrossRef] [PubMed]
  74. Derrac, J.; García, S.; Molina, D.; Herrera, F. A practical tutorial on the use of nonparametric statistical tests as a methodology for comparing evolutionary and swarm intelligence algorithms. Swarm Evol. Comput. 2011, 1, 3–18. [Google Scholar] [CrossRef]
  75. O’Malley, M.; Woods, J.; Byrant, J.; Miller, L. How is western lowland gorilla (Gorilla gorilla gorilla) behavior and physiology impacted by 360° visitor viewing access? Anim. Behav. Cogn. 2021, 8, 468–480. [Google Scholar] [CrossRef]
  76. Valencia, A.; Hincapie, R.A.; Gallego, R.A. Integrated Planning of MV/LV Distribution Systems with DG Using Single Solution-Based Metaheuristics with a Novel Neighborhood Search Method Based on the Zbus Matrix. J. Electr. Comput. Eng. 2022, 2022, 2617125. [Google Scholar] [CrossRef]
  77. Akbulut, A.S. The effect of TMJ intervention on instant postural changes and dystonic contractions in patients diagnosed with dystonia: A case study. Diagnostics 2023, 13, 3177. [Google Scholar] [CrossRef]
  78. Ding, M.; Zhao, D.; Wei, R.; Duan, Z.; Zhao, Y.; Li, Z.; Lin, T.; Li, C. Multifunctional elastomeric composites based on 3D graphene porous materials. Exploration 2023, 4, 20230057. [Google Scholar] [CrossRef]
  79. Wang, K.; Sun, X.; Cheng, S.; Cheng, Y.; Huang, K.; Liu, R.; Yuan, H.; Li, W.; Liang, F.; Yang, Y.; et al. Multispecies-coadsorption-induced rapid preparation of graphene glass fiber fabric and applications in flexible pressure sensor. Nat. Commun. 2024, 15, 5040. [Google Scholar] [CrossRef] [PubMed]
  80. Jiang, Q.; Wan, Y.; Qin, Y.; Qu, X.; Zhou, M.; Huo, S.; Wang, X.; Yu, Z.; He, H. Durable and Wearable Self-powered Temperature Sensor Based on Self-healing Thermoelectric Fiber by Coaxial Wet Spinning Strategy for Fire Safety of Firefighting Clothing. Adv. Fiber Mater. 2024, 6, 1387–1401. [Google Scholar] [CrossRef]
  81. Ryu, W.M.; Lee, Y.; Son, Y.; Park, G.; Park, S. Thermally Drawn Multi-material Fibers Based on Polymer Nanocomposite for Continuous Temperature Sensing. Adv. Fiber Mater. 2023, 5, 1712–1724. [Google Scholar] [CrossRef]
  82. Yin, W.; Qin, M.; Yu, H.; Sun, J.; Feng, W. Hyperelastic Graphene Aerogels Reinforced by In-suit Welding Polyimide Nano Fiber with Leaf Skeleton Structure and Adjustable Thermal Conductivity for Morphology and Temperature Sensing. Adv. Fiber Mater. 2023, 5, 1037–1049. [Google Scholar] [CrossRef]
  83. Golkarnarenji, G.; Naebe, M.; Badii, K.; Milani, A.S.; Jazar, R.N.; Khayyam, H. A Machine Learning Case Study with Limited Data for Prediction of Carbon Fiber Mechanical Properties. Comput. Ind 2019, 105, 123–132. [Google Scholar] [CrossRef]
  84. Kasaei, A.; Abedian, A.; Milani, A.S. An Application of Quality Function Deployment Method in Engineering Materials Selection. Mater. Des. 2014, 55, 912–920. [Google Scholar] [CrossRef]
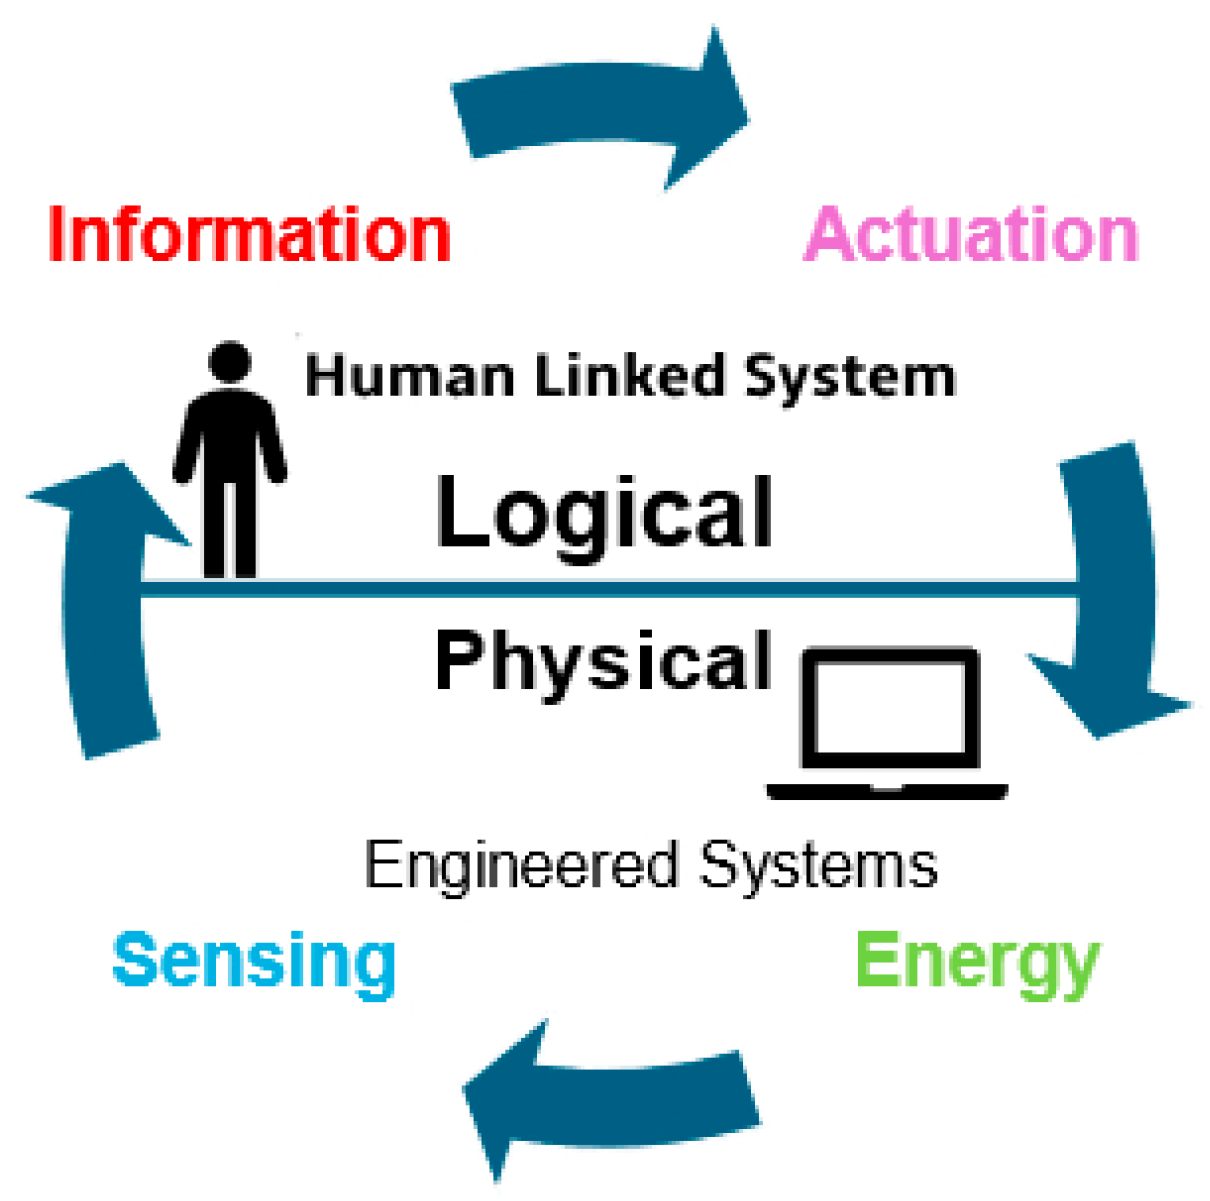
Figure 1. Key factors to consider in design of CPSs with a human-in-the-loop perspective [25]. Complementing CPSs is the Internet of Things (IoT), which interconnects myriad devices ranging from RFID tags and wireless sensor networks to advanced cameras and BLE beacons via robust wireless networks [48].
Jsan 14 00068 g001
Figure 2. Illustration of the proposed integrated system components. A 3D-printed graphene–PLA sensor (fabricated via additive manufacturing) as a physical component attached to the part in a hypothetical warehouse. The sensor, managed by a microcontroller and router, connects to a developed extended reality (XR) application on a mobile device. The system then enables human operator to access real-time temperature data and make rapid, metric-driven control decisions on-site or remotely (e.g., to turn on/off the heater adjacent to the affected part); see alsoSupplementary Video S1.
Jsan 14 00068 g002
Figure 3. The user interface under the IoT for real-time temperature monitoring and control.
Jsan 14 00068 g003
Figure 4. (a) Conventional heater setup with the QR code placed on the sample box for XR tracking. (b) Real-world arrangement of the experimental system (c) showcasing the manual thermal camera (used as the control) versus the developed XR-based temperature monitoring and control system.
Jsan 14 00068 g004
Figure 5. (a) A side-by-side comparison of the thermal camera-based and the sensor–XR-based user experiments; in the mobile app, (b) the cube color changes to green to indicate the part temperature of 50 °C, (c) to yellow to indicate 60 °C, (d) and to red to indicate 65 °C, as measured by the GPLA sensor and communicated in real-time to the UI. When the temperature reaches 65 °C, the user should turn off the heater manually (using its switch) versus through the mobile app equipped with Firebase and a relay to control the heater.
Jsan 14 00068 g005
Figure 6. (a) The 3D-printed sensor resistance to temperature variation (master curve; the measurement was performed at each applied constant temperature). (b) The sensor’s resistance within dynamic temperature cycles between 0 °C and 100 °C.
Jsan 14 00068 g006
Table 1. Summary of the user-study results using the mean (M) and standard deviation (SD) values of the response time (Metric 1) and its error (Metric 2); and the Holistic Presence Questionnaire scores (HPQs) for the qualitative ‘presence’ (Metric 3).
Control MethodResponse Time (s)Error (°C)HPQs
MSDMSD
Manual4.361.972.20.71SensoryEmotionalCognitiveBehavioralReasoning
XR-based1.970.730.90.40M 3.50M 3.83M 3.50M 3.83M 4.0
SD 1.95SD 1.60SD 1.60SD 1.64SD 1.67
Table 2. Results of the Metric 4 analysis in the user study (M—mean, SD—standard deviation).
Control
Method
Ease and Frequency of UseIntuitiveTrustFatigueReliabilitySpeed
MSDMSDMSDMSDMSDMSD
XR-based4.50.834.170.752.831.471.830.983.830.754.670.51
Manual1.830.982.00.893.001.264.00.894.170.752.501.04
Disclaimer/Publisher’s Note: The statements, opinions and data contained in all publications are solely those of the individual author(s) and contributor(s) and not of MDPI and/or the editor(s). MDPI and/or the editor(s) disclaim responsibility for any injury to people or property resulting from any ideas, methods, instructions or products referred to in the content.