


Making IoT Networks Highly Fault-Tolerant Through Power Fault Prediction, Isolation and Composite Networking in the Device Layer

 ,
, 
Abstract
:1. Introduction
- The research questions
- How will the device power depletion rate in the IoT network’s device layer affect its longevity and fault tolerance?
- At what power level of the devices will the power faults be inducted into the IoT network?
- To what extent does the success rate of an IoT improve due to the implementation of a cross-bar network connecting devices in the device layer to cluster heads, through which communication is carried to the base stations?
- Is there any effect on the fault tolerance of the IoT network due to an increase in the false alarm rate caused due to furious signals generated within the devices?
- Major Contributions of the Research
- A method of finding the power depletion rate of the devices using assert macros and predicting the possibility of the occurrence of the power fault and isolating such devices.
- A networking topology that helps connect cluster heads to devices and provides alternate paths for communication, thereby increasing the fault tolerance of the IoT network.
- A method to compute fault tolerance of an IoT network that has linear and mesh connectivity among devices and cluster heads through which communication is carried through base stations.
- Usage and Applicability
2. Related Work
3. Methods and Techniques
3.1. Existing Methods and Proposed Methods
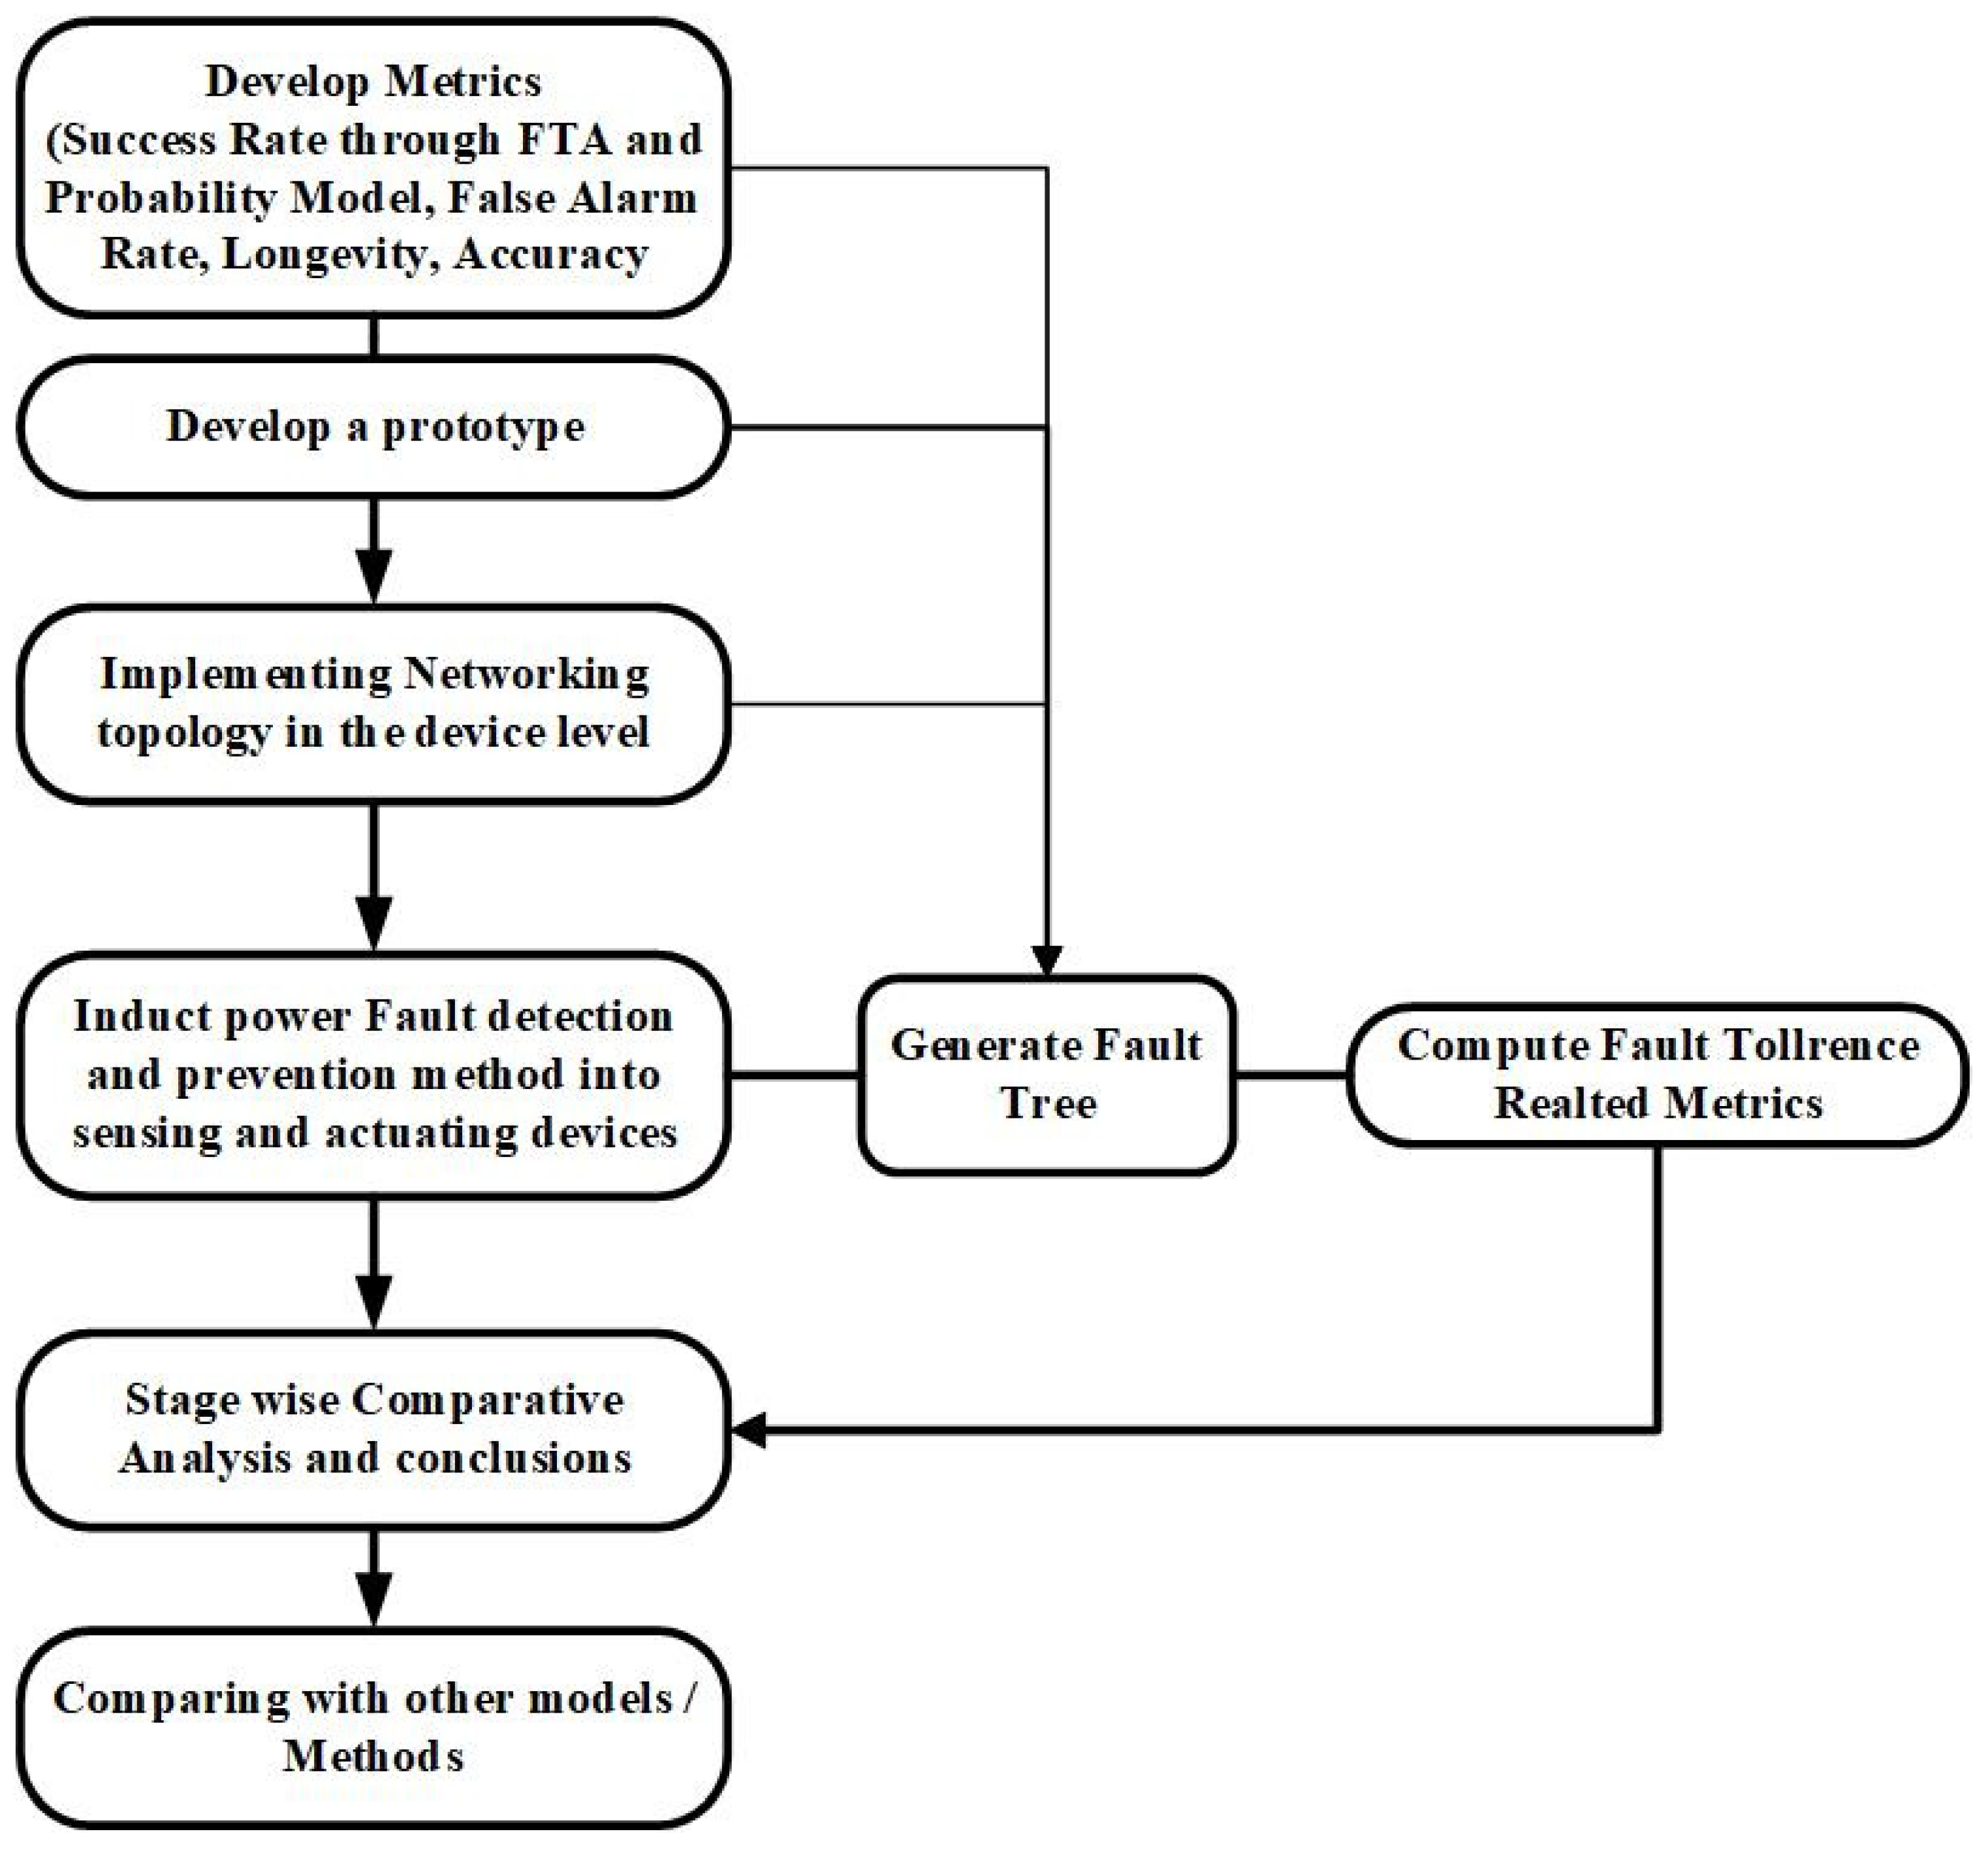
3.2. Overall Methodology Used for Implementing the Proposed Changes in the IoT Network
3.3. Metrics for Computing the Fault Tolerance of an IoT Network
3.3.1. Metric for Computing the Fault Rate of a Device in an IoT Network
- = Fault rate at the given supply voltage.
- = Raw fault rate at maximum voltage.
- = Maximum voltage.
- V = Supply voltage.
- = The amount of increase in fault rate with one step decrease in voltage.
3.3.2. Metrics for Computing the Fault Rate of an IoT Network
- = Probability that a Link is Faulty.
- = Probability that a link and a switch box are not faulty.
- N = Number of inputs.
- M = Number of outputs.
- = Fault rate of the hybrid model.
- = fault rate of the linear model computed using Equation (2).
- = Fault rate computed using the probability of model which applies to a networking topology such as Crossbar as shown in Equation (3).
3.4. Metrics for Computing Longuity, False Alarm Rate, Power Depletion Rate and Accuracy of Fault Tolerance Computation
3.4.1. Metric for Computing Longuity of a Device in an IoT Network
- = Power depletion rate per byte.
- = Number of bytes of data transmitted.
- = Lifetime of device d measured in microseconds.
- = Rate power of device d.
- = power depletion rate of the device d.
- = Byte Transmission time of the device in microseconds.
3.4.2. Metric for Computing the Fault Alarm Rate
- = number of false positives.
- = Number of True Negative.
- N = Total number of negatives.
3.4.3. Metric for Computing the Accuracy of an IoT Network
- = Total True Negatives (A set of examples that feed data representing the sensor output that lead to zero fault rate of the IoT network).
- = Total Positives (A set of examples that feed data representing the sensor output that lead to an exact calculation of the fault rate of the IoT network).
- = Total False Positives (a set of examples that feed data representing the sensor output that leads to the exact fault rate while the fault rate is expected to be zero).
- = Total False Negatives (A set of examples that feed data representing the sensor output that leads to zero fault rate while the actual fault rate is the expected fault rate).
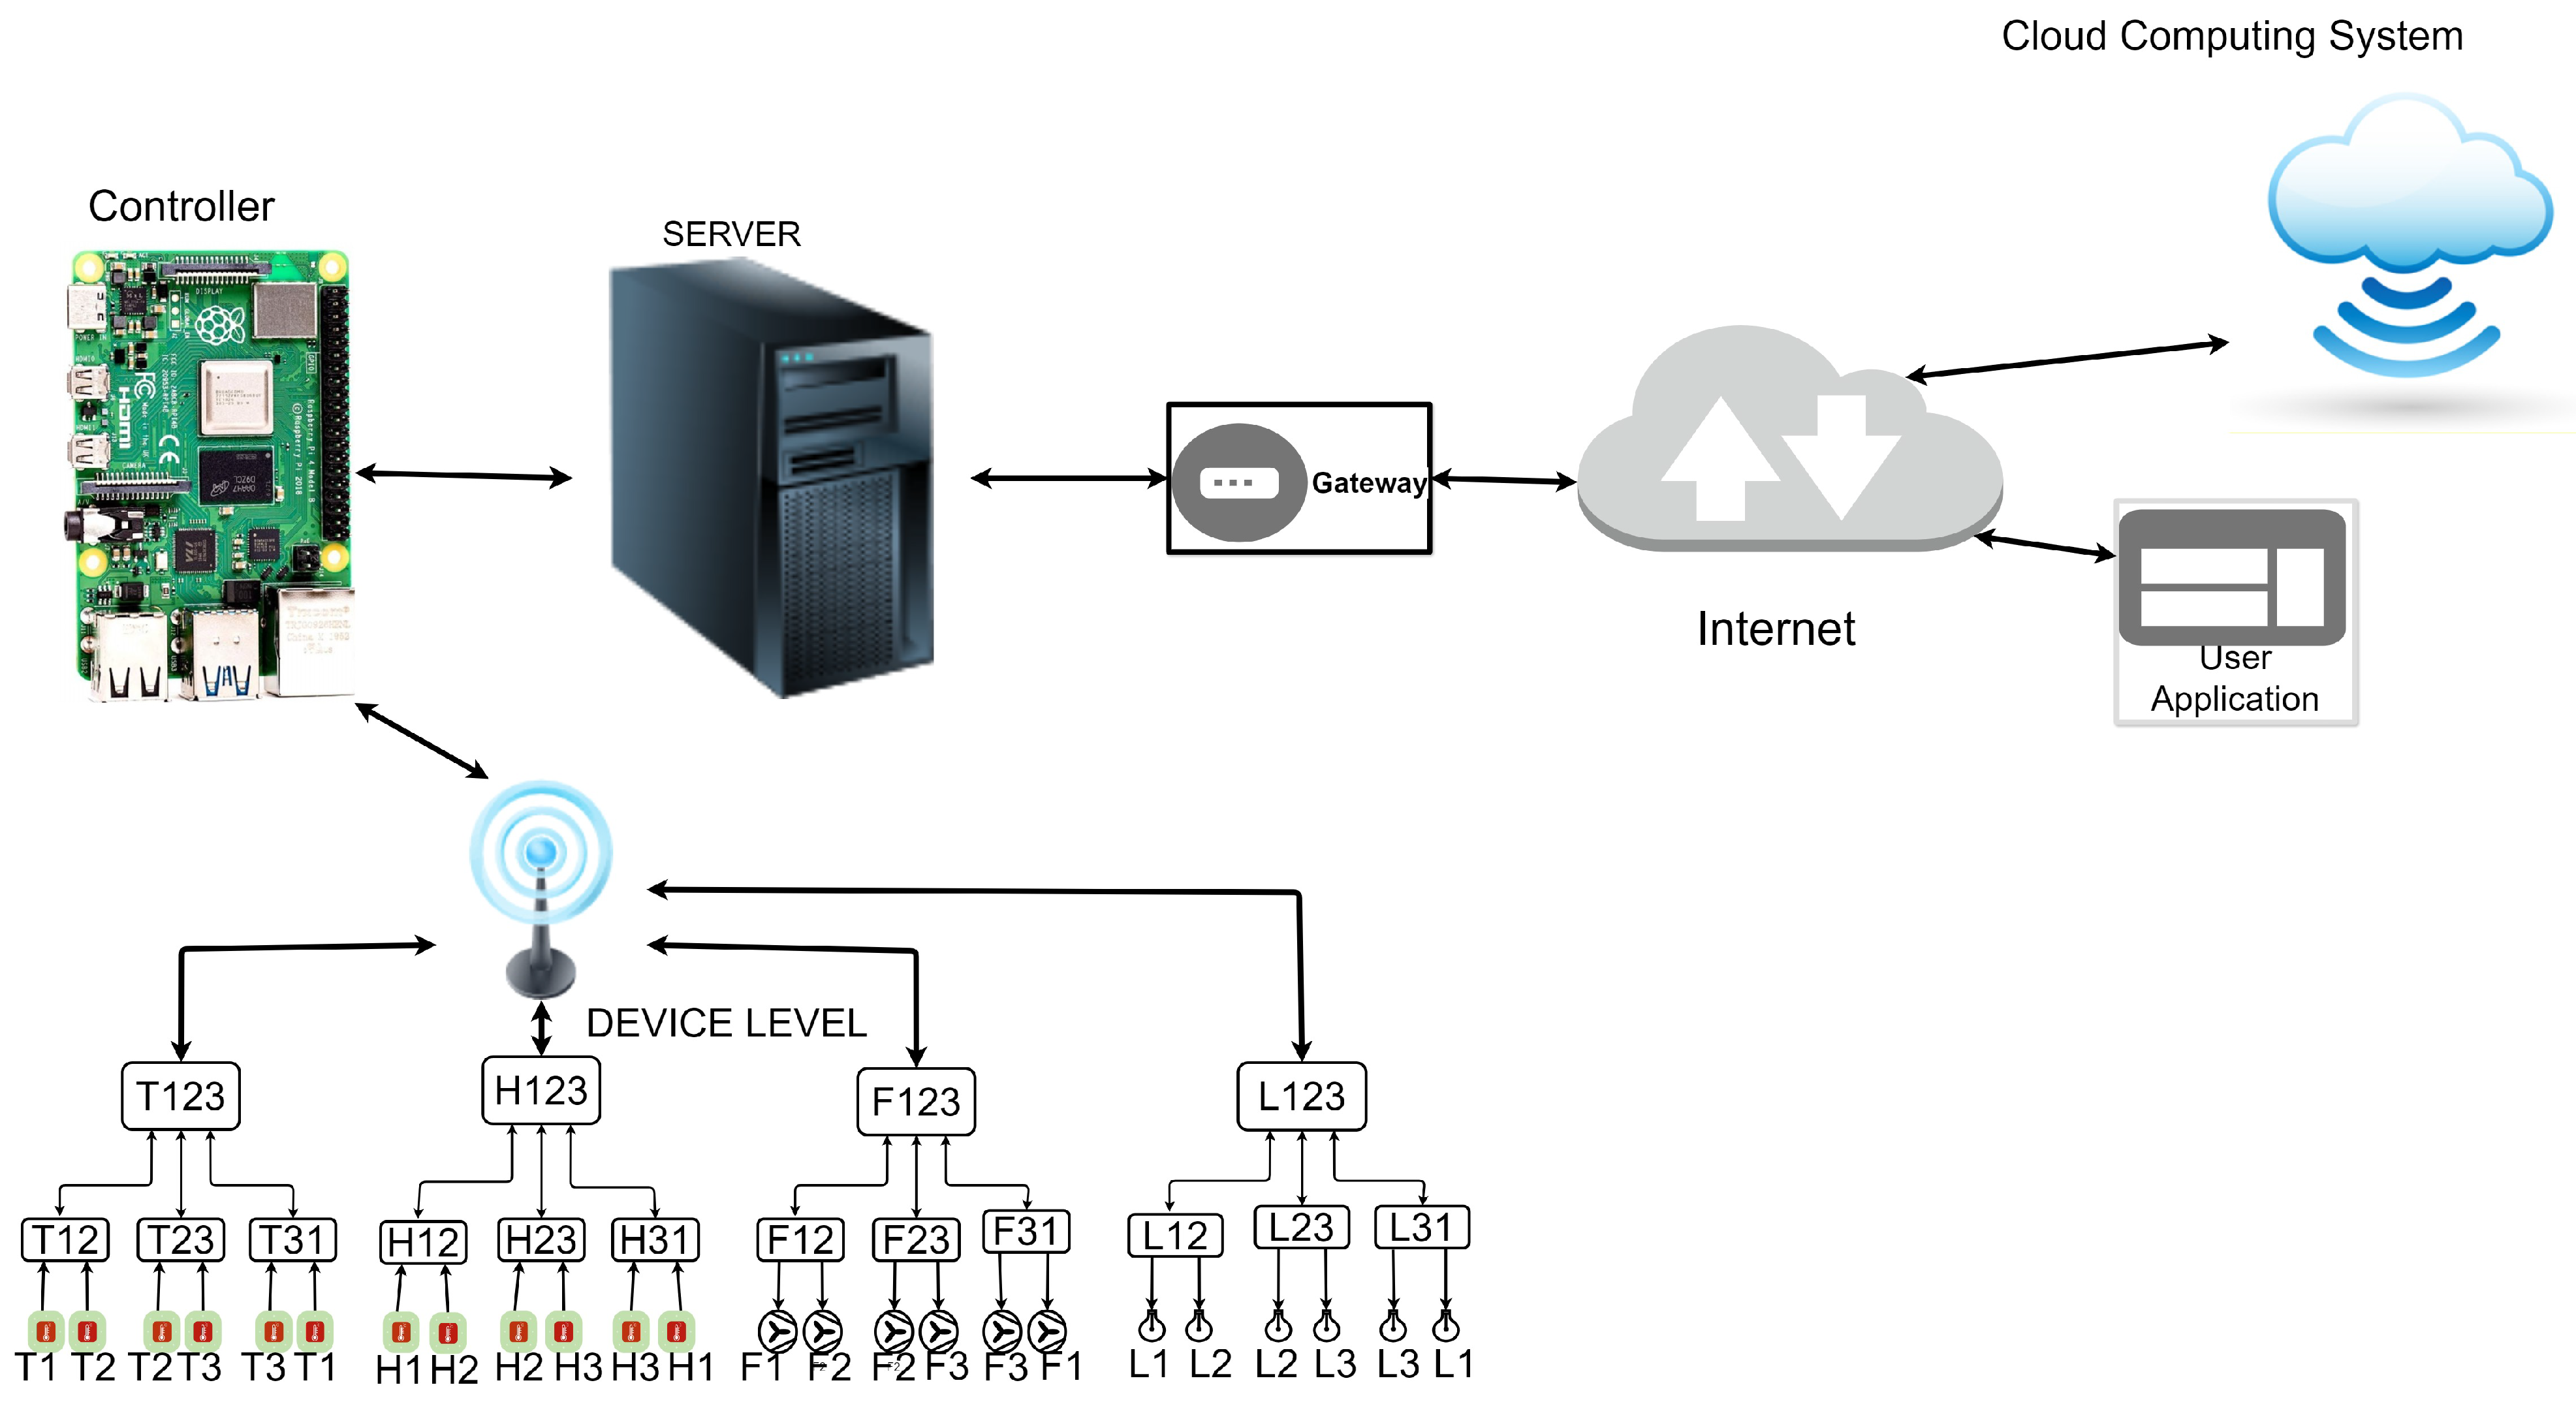
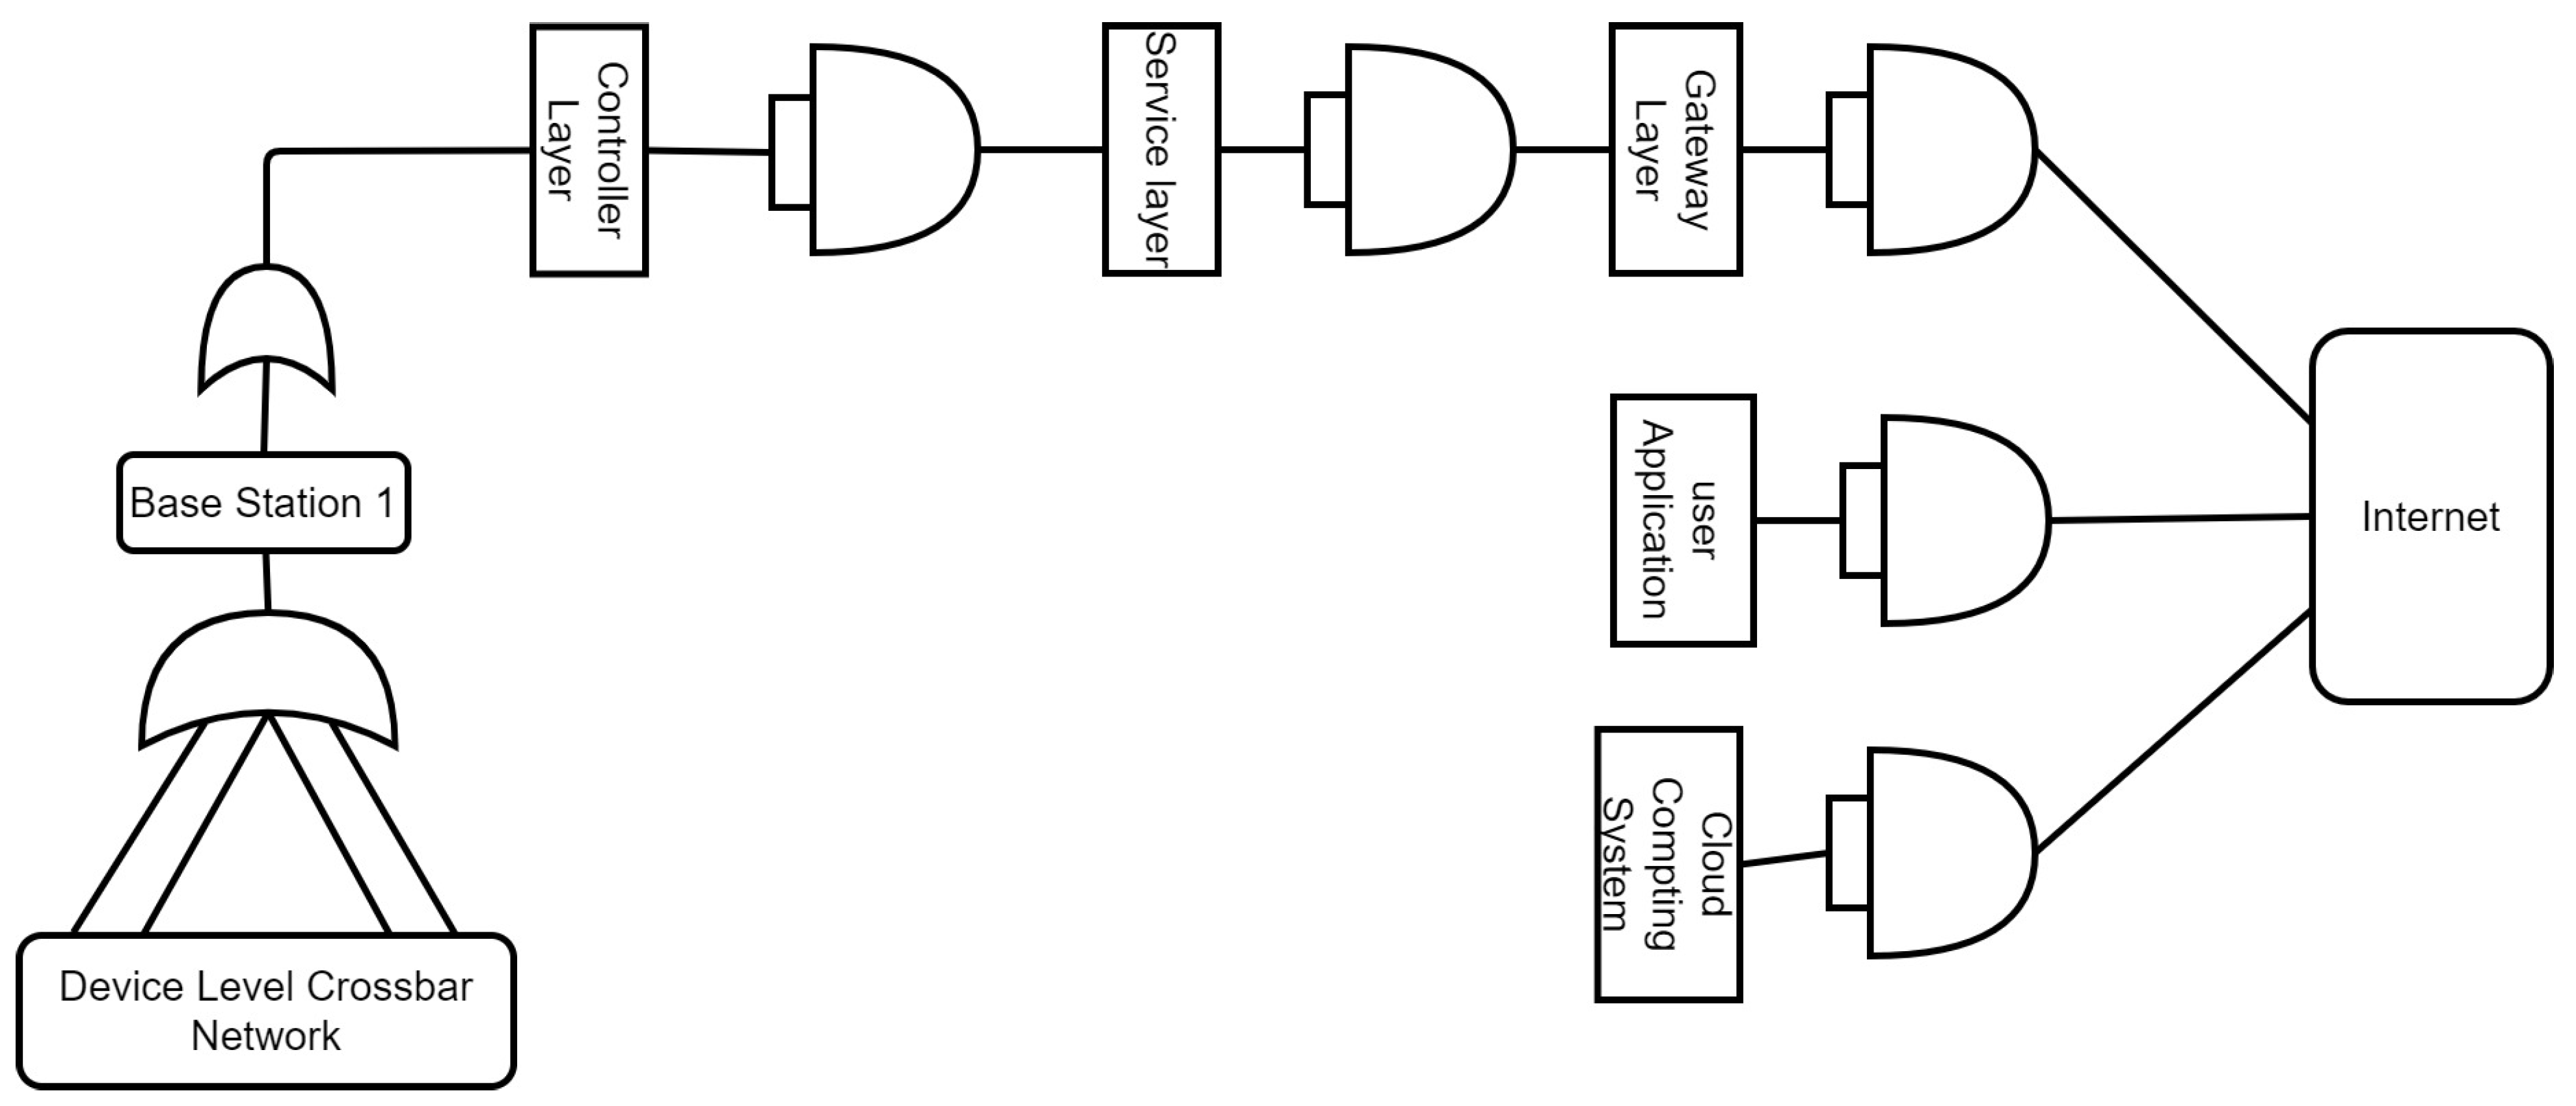
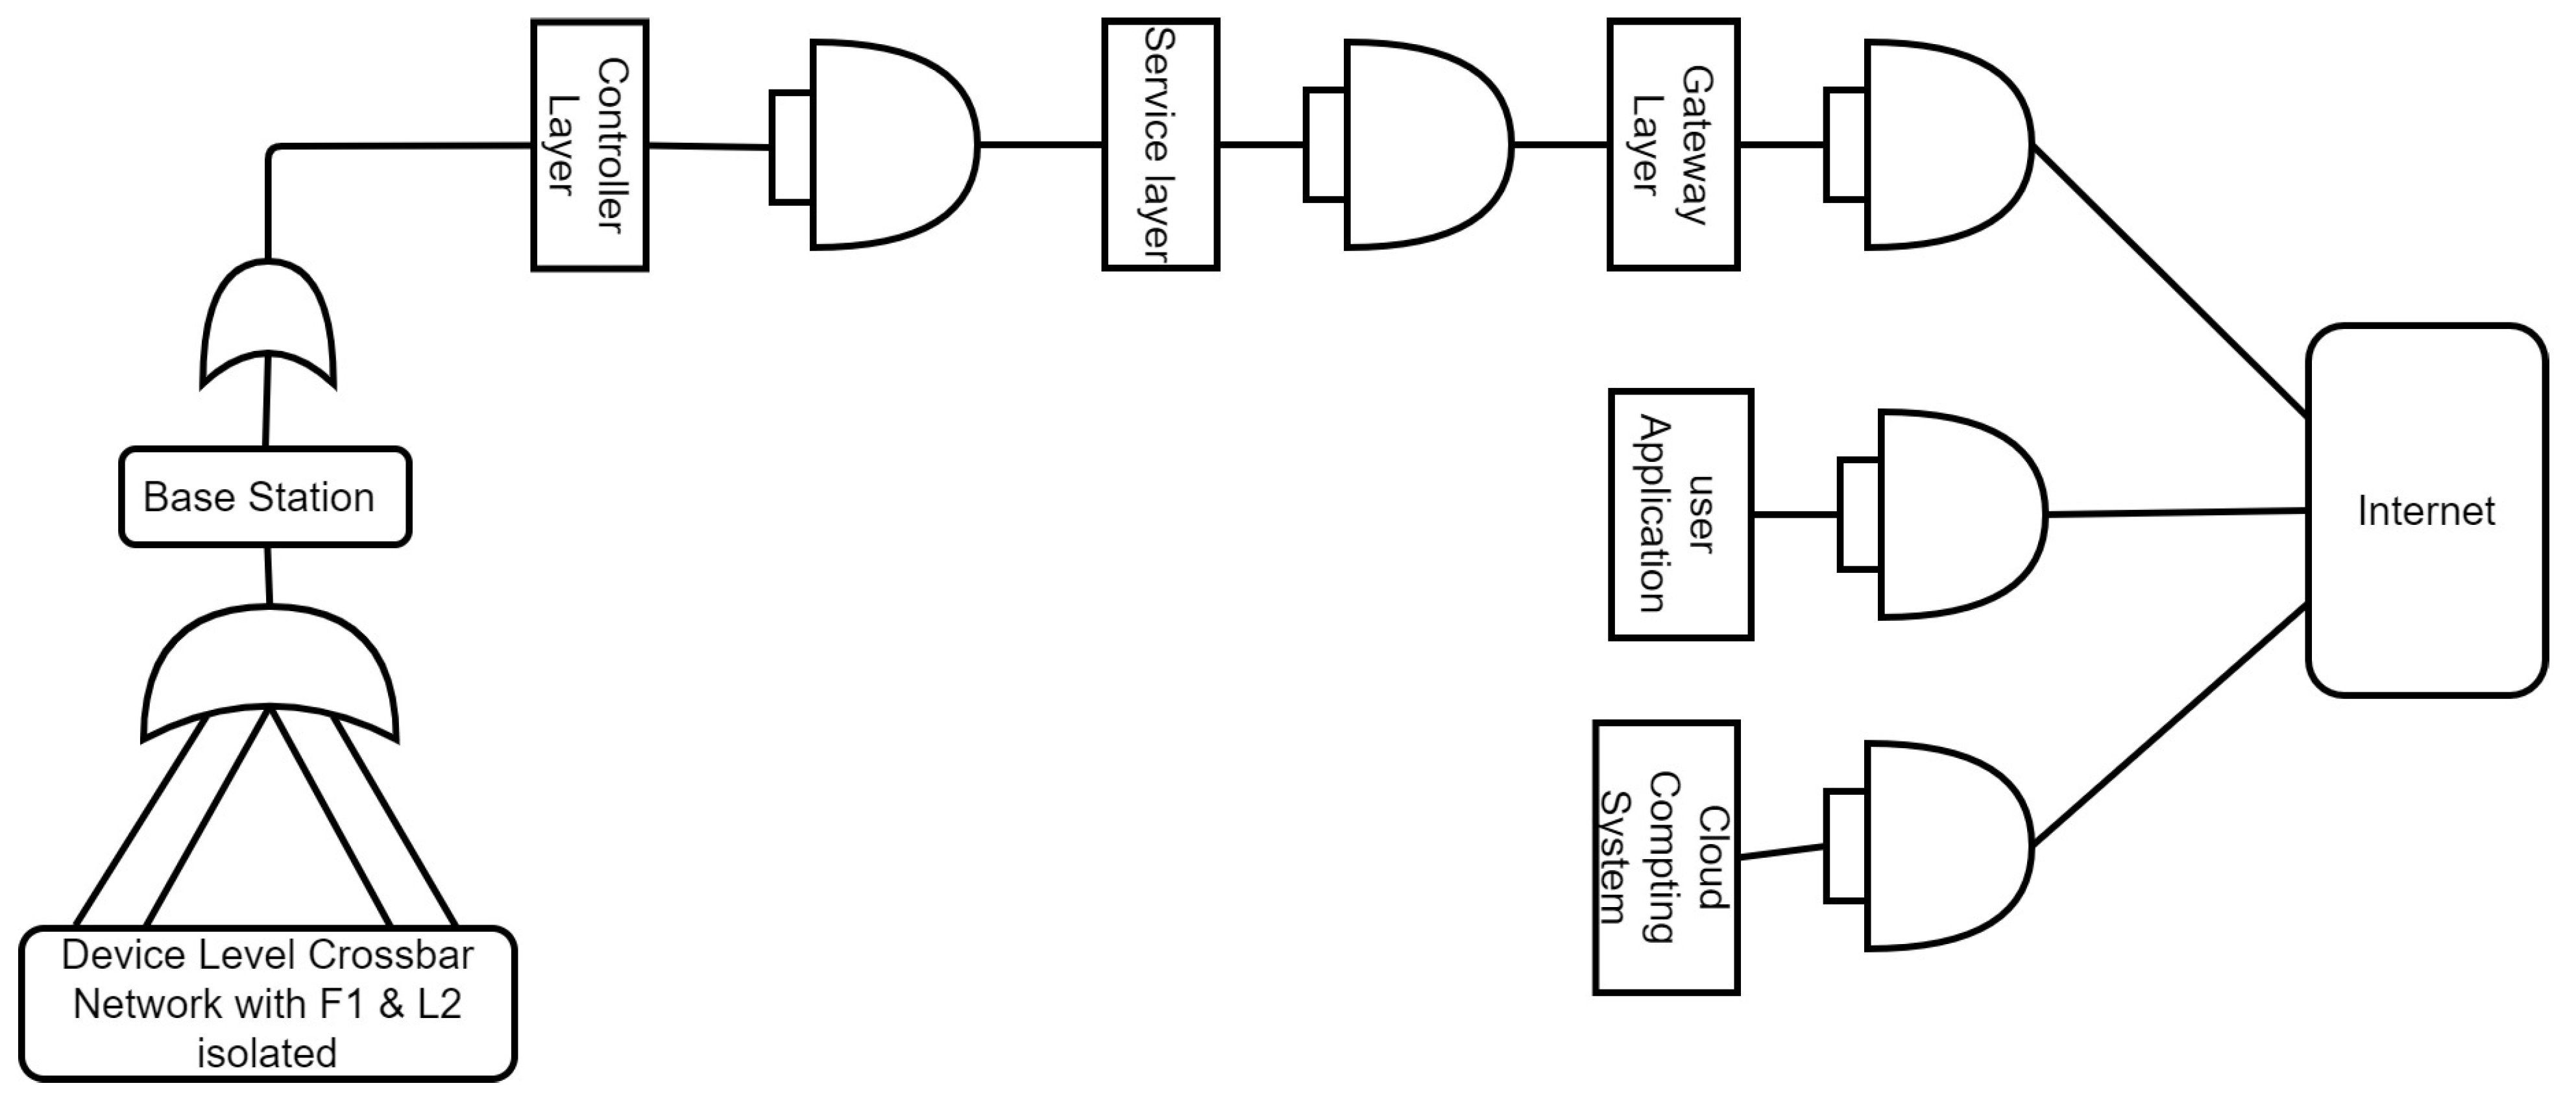
3.5. Prototype IoT Network and FTA Development
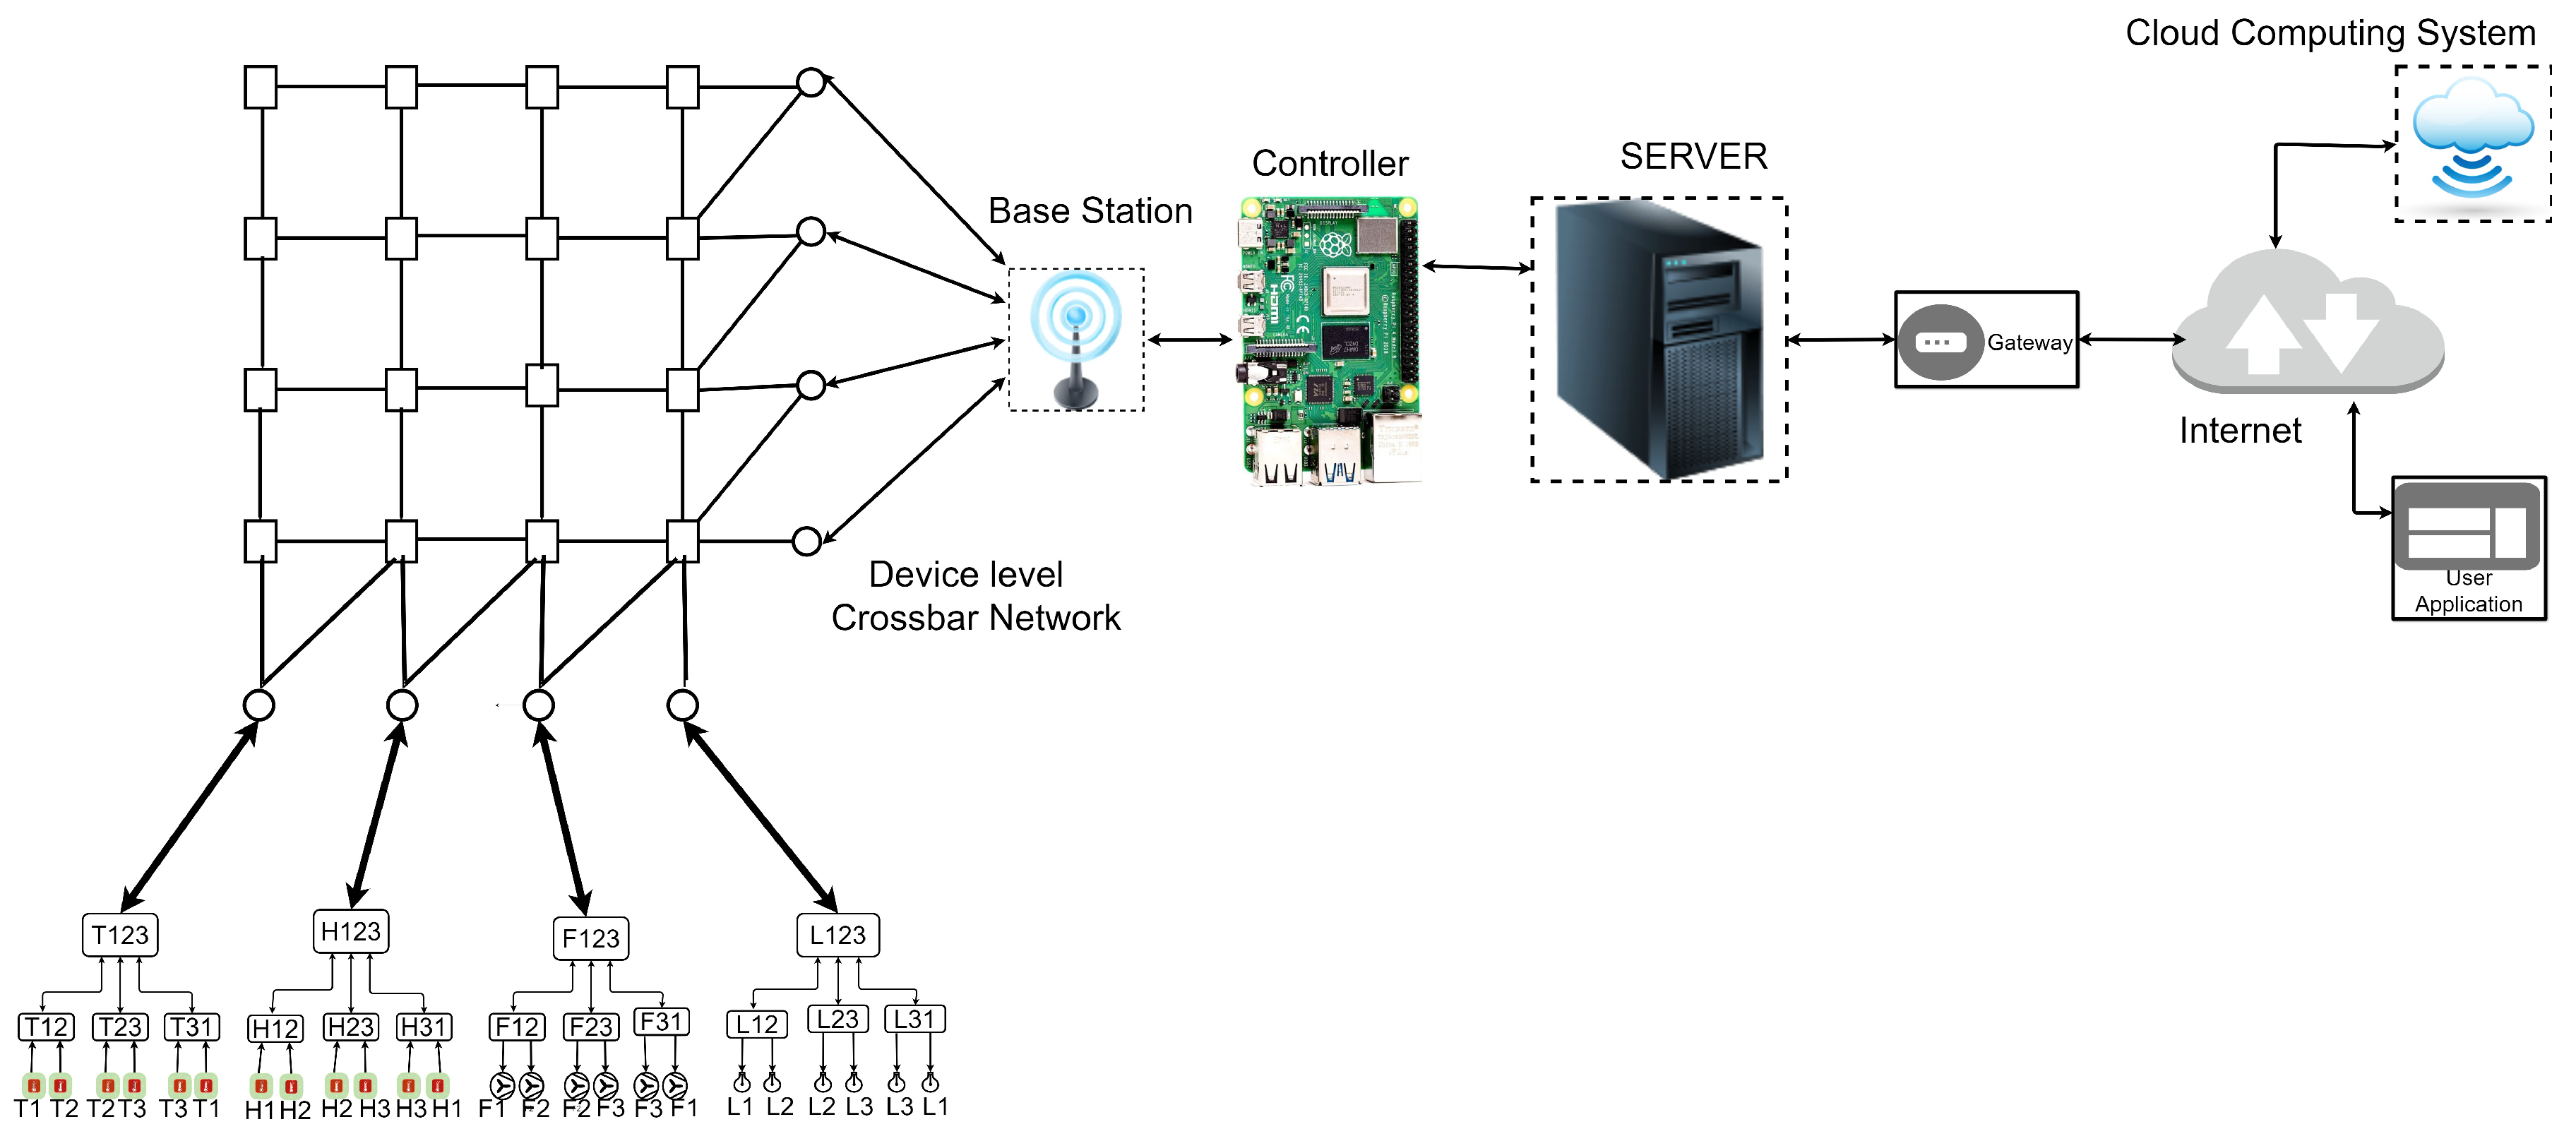
3.6. Computing the Fault Rate of the Revised IoT Network with Crossbar Network Included in the Device Layer
3.7. Computing the Fault Rate Considering Cross Bar Network and Firmware in the Devices
| Algorithm 1 algorithm caption |
| INPUT Battery-rated power Battery-Thresh-Hold Value Outputframe-of-battery Data-buff OUTPUT False-Alarm Rate Battery-Left-Over-Power Number-Of Bytes-Transmitted Power depletion rate Response-Time-For-Transmission PROCESS Initialize WiFi While (TRUE) { BatteryManager ( ) CommunicationManager ( ) DeviceSensingManager ( ) } BatteryManager( ) { Compute Battery Leftover power. Trace Outputframe Compute False Alaran Rate if Outframe – NULL and Battery Leftover power > Threshold power level. Display Battery Left Over Power Display False Alarm Rate Display Outputframe of battery Display Number Of Bytes Transmitted Display Power Depletion Rate Display Response Time For Transmission } CommunicationManager ( ) { Time1 = Current CPU Time Transmit Data buff Time2 = Current CPU Time Response Time For Transmission += (Time2 − Time1) Number Of Bytes Transmitted += Size(Databuff) } DeviceSensingManager ( ) { Read Data-Buff } Output Metrics
|
3.8. Modelling Residual Crossbar Model
4. Results and Discussion
- = Probability that a Link is Faulty.
- = Probability that a link and a switch box are not faulty.
- N = Number of inputs.
- M = Number of outputs.
- Longuity calculation
- Calculation of false alarm rate
- Power depletion rate computation
- Computation of accuracy
Comparative Analysis
5. Conclusions and Future Scope
Author Contributions
Funding
Institutional Review Board Statement
Informed Consent Statement
Data Availability Statement
Conflicts of Interest
References
- Ciccozzi, F.; Crnkovic, I.; Di Ruscio, D.; Malavolta, I.; Pelliccione, P.; Spalazzese, R. Model-Driven Engineering for Mission-Critical IoT Systems. IEEE Soft. 2017, 34, 46–53. [Google Scholar] [CrossRef]
- Mardiyah, N.; Setyawan, N.; Retno, B.; Has, Z. Active Fault Tolerance Control for Sensor Fault Problem in Wind Turbine Using SMO with LMI Approach. In Proceedings of the 2018 5th International Conference on Electrical Engineering, Computer Science, and Informatics (EECSI), Malang, Indonesia, 16–18 October 2018; pp. 336–340. [Google Scholar] [CrossRef]
- Sowmya, K.V.; Sastry, J.K.R. Performance optimization within the device layer of IoT networks. J. Eng. Sci. Technol. 2021, 16, 5087–5109. [Google Scholar]
- Sowmya, K.V.; Sastry, J.K.R. Improving the Performance of Heterogeneous IoT Networks through Multi-Stage and Parallel Computing Systems. Iran. Sci. 2003, 30, 1714–1730. [Google Scholar] [CrossRef]
- Young, M. The Technical Writer’s Handbook; University Science: Mill Valley, CA, USA, 1989. [Google Scholar]
- Sowmya, K.V.; Sastry, J.K.R. Implementing load-balanced concurrent service layer to improve an IoT network’s response time. J. Eng. Sci. Technol. 2022, 17, 4487–4504. [Google Scholar]
- Sowmya, K.; Sastry, J.K.R. Enhancing Performance of IoT Networks through High-Performance Computing. Int. J. Adv. Trends Comput. Sci. Eng. 2019, 8, 432–442. [Google Scholar] [CrossRef]
- Mohsin, A.; Naqvi, S.I.R.; Khan, A.U.; Naeem, T.; AsadUllah, M.A. A comprehensive framework to quantify fault tolerance metrics of web centric mobile applications. In Proceedings of the 2017 International Conference on Communication Technologies (ComTech), Rawalpindi, Pakistan, 19–21 April 2017. [Google Scholar] [CrossRef]
- Dugan, J.B.; Bavuso, S.J. Dynamic Fault-Tree Models for Fault-Tolerant Computer Systems. IEEE Trans. Reliab. 1992, 41, 3–9. [Google Scholar] [CrossRef]
- Yazdi, M.; Nikfar, F.; Nasrabadi, M. Failure probability analysis by employing fuzzy fault tree analysis. Int. J. Syst. Assur. Eng. Manag. 2017, 8 (Suppl. 2), 1177–1193. [Google Scholar] [CrossRef]
- Chokara, B.; Jammalamadaka, S.K.R. Hybrid Models for Computing Fault Tolerance of IoT Networks. Telkomnika Telecommun. Comput. Electron. Control 2023, 21, 333–345. [Google Scholar] [CrossRef]
- Rathore, S.S.; Kumar, S. An empirical study of some software fault prediction techniques for the number of faults prediction. Soft Comput. 2017, 21, 7417–7434. [Google Scholar] [CrossRef]
- Lin, J.; Chelliah, P.R.; Hsu, M.; Hou, J. Efficient Fault-Tolerant Routing in IoT Wireless Sensor Networks Based on Bipartite-Flow Graph Modeling. IEEE Access 2019, 7, 14022–14034. [Google Scholar] [CrossRef]
- Biabani, M.; Yazdani, N.; Fotouhi, H. REFIT: Robustness Enhancement Against Cascading Failure in IoT Networks. IEEE Access 2021, 9, 40768–40782. [Google Scholar] [CrossRef]
- Xing, L. Cascading Failures in Internet of Things: Review and Perspectives on Reliability and Resilience. IEEE Internet Things J. 2021, 8, 44–64. [Google Scholar] [CrossRef]
- Power, A.; Kotonya, G. BoboCEP: Distributed Complex Event Processing for Resilient Fault-Tolerance Support in IoT. In Proceedings of the 2020 IEEE Sixth International Conference on Big Data Computing Service and Applications (Bigdata Service), Oxford, UK, 3–6 August 2020; pp. 109–112. [Google Scholar]
- Malarski, K.M.; Ballal, K.D.; Ruepp, S. D2D-enabled Failure-tolerance in Cellular IoT. In Proceedings of the 2021 12th International Conference on Network of the Future (NoF), Coimbra, Portugal, 6–8 October 2021; pp. 1–5. [Google Scholar] [CrossRef]
- Safari, S.; Ansari, M.; Khdr, H.; Gohari-Nazari, P.; Yari-Karin, S.; Yeganeh-Khaksar, A.; Hessabi, S.; Ejlali, A.; Henkel, J. A Survey of Fault-Tolerance Techniques for Embedded Systems From the Perspective of Power, Energy, and Thermal Issues. IEEE Access 2022, 10, 12229–12251. [Google Scholar] [CrossRef]
- Norris, M.; Celik, B.; Venkatesh, P.; Zhao, S.; McDaniel, P.; Sivasubramaniam, A.; Tan, G. IoTRepair: Systematically Addressing Device Faults in Commodity IoT. In Proceedings of the 2020 IEEE/ACM Fifth International Conference on Internet-of-Things Design and Implementation (IoTDI), Sydney, Australia, 21–24 April 2020; pp. 142–148. [Google Scholar] [CrossRef]
- Power, A.; Kotonya, G. Complex Patterns of Failure: Fault Tolerance via Complex Event Processing for IoT Systems. In Proceedings of the 2019 International Conference on Internet of Things (iThings) and IEEE Green Computing and Communications (GreenCom) and IEEE Cyber, Physical and Social Computing (CPSCom) and IEEE Smart Data (SmartData), Atlanta, GA, USA, 14–17 July 2019; pp. 986–993. [Google Scholar]
- Zhao, X.; Lucani, D.E.; Shen, X.; Wang, H. Minimizing Bandwidth Use in IoT Storage with Random Device Failures. In Proceedings of the European Wireless 2019, 25th European Wireless Conference, Aarhus, Denmark, 2–4 May 2019; pp. 1–5. [Google Scholar]
- Sastry, J.K.R.; Bhupathi, S. Enhancing Fault Tolerance of IoT Networks within Device Layer. Int. J. Emerg. Trends Eng. Res. 2020, 8, 491–509. [Google Scholar] [CrossRef]
- Geethika Reddy, A.; Upendra, Y.; Sastry, J.K.R.; Bhupathi, S. An Approach to Compute Fault Tolerance of an IoT Network Having Clustered Devices Using Cross Bar Networks. Int. J. Emerg. Trends Eng. Res. 2020, 8, 987–1004. [Google Scholar] [CrossRef]
- Samanta, A.; Esposito, F.; Nguyen, T.G. Fault-Tolerant Mechanism for Edge-Based IoT Networks with Demand Uncertainty. IEEE Internet Things J. 2021, 8, 16963–16971. [Google Scholar] [CrossRef]
- Kumar, S.; Ranjan, P.; Singh, P.; Tripathy, M.R. Design and Implementation of Fault Tolerance Technique for Internet of Things (IoT). In Proceedings of the 2020 12th International Conference on Computational Intelligence and Communication Networks (CICN), Bhimtal, India, 25–26 September 2020; pp. 154–159. [Google Scholar]
- Zaiter, M.; Hacini, S. A Distributed Fault Tolerance Mechanism for an IoT Healthcare system. In Proceedings of the 2020 21st International Arab Conference on Information Technology (ACIT), Giza, Egypt, 28–30 November 2020; pp. 1–6. [Google Scholar]
- Thomas, D.; Orgun, M.; Hitchens, M.; Shankaran, R.; Mukhopadhyay, S.C.; Ni, W. A Graph-Based Fault-Tolerant Approach to Modeling QoS for IoT-Based Surveillance Applications. IEEE Internet Things J. 2021, 8, 3587–3604. [Google Scholar] [CrossRef]
- Bhupathi, J.K.R.; Sastry, A. Framework for effecting fault tolerance within IoT network. J. Adv. Res. Dyn. Control Syst. 2018, 10, 424–432. [Google Scholar]
- Salehi, M.; Kriebel, F.; Rehman, S.; Shafique, M. Power-Aware Fault-Tolerance for Embedded Systems. In Dependable Embedded Systems; Springer: Cham, Switzerland, 2021. [Google Scholar] [CrossRef]
- Rajaiyan, A.; Sobati-Moghadam, S. Optimized Power Consumption Formula for Designing IoT-Based Systems. In Proceedings of the 2022 Second International Conference on Distributed Computing and High-Performance Computing (DCHPC), Qom, Iran, 2–3 March 2022; pp. 74–77. [Google Scholar] [CrossRef]
- Xu, T.; Potkonjak, M. Energy-efficient fault tolerance approach for Internet of Things applications. In Proceedings of the 2016 IEEE/ACM International Conference on Computer-Aided Design (ICCAD), Austin, TX, USA, 7–10 November 2016; pp. 1–8. [Google Scholar]
- Lavanya, S.; Prasanth, A.; Jayachitra, S.; Shenbagarajan, A. A Tuned classification approach for efficient heterogeneous fault diagnosis in IoT-enabled WSN applications. Measurement 2021, 183, 109771. [Google Scholar] [CrossRef]
- Prasanth, A. Certain Investigations on Energy-Efficient Fault Detection and Recovery Management in Underwater Wireless Sensor Networks. J. Circuits Syst. Comput. 2020, 30, 2150137. [Google Scholar] [CrossRef]
- Agarwal, V.; Tapaswi, S.; Chanak, P. Intelligent Fault-Tolerance Data Routing Scheme for IoT-enabled WSNs. IEEE Internet Things J. 2022, 9, 16332–16342. [Google Scholar] [CrossRef]
- Bukhsh, M.; Abdullah, S.; Rahman, A.; Asghar, M.N.; Arshad, H.; Alabdulatif, A. An Energy-Aware, Highly Available, and Fault-Tolerant Method for Reliable IoT Systems. IEEE Access 2021, 9, 145363–145381. [Google Scholar] [CrossRef]
- Zhang, W.; Lu, Q.; Yu, Q.; Li, Z.; Liu, Y.; Lo, S.K.; Chen, S.; Xu, X.; Zhu, L. Blockchain-Based Federated Learning for Device Failure Detection in Industrial IoT. IEEE Internet Things J. 2021, 8, 5926–5937. [Google Scholar] [CrossRef]
- Li, J.; Xuan, C.; Shao, B.; Ji, H.; Ren, C. A new connected device-based Failure Mode and Effects Analysis model. In Proceedings of the 2014 IEEE International Conference on Service Operations and Logistics, and Informatics, Qingdao, China, 8–10 October 2014; pp. 1–5. [Google Scholar] [CrossRef]
- Ara, T.; Prabhakar, M.; Bali, M. Fault Prediction in Wireless Sensor Networks using Soft Computing. In Proceedings of the 2020 International Conference on Smart Technologies in Computing, Electrical and Electronics (ICSTCEE), Bengaluru, India, 9–10 October 2020; pp. 532–538. [Google Scholar]
- Zhang, J.; Jiang, Y.; Li, X.; Huo, M.; Luo, H.; Yin, S. An adaptive remaining useful life prediction approach for single battery with unlabeled small sample data and parameter uncertainty. Reliab. Eng. Syst. Saf. 2022, 222, 108357. [Google Scholar] [CrossRef]
- Zhang, J.; Jiang, Y.; Li, X.; Luo, H.; Yin, S.; Kaynak, O. Remaining Useful Life Prediction of Lithium-Ion Battery with Adaptive Noise Estimation and Capacity Regeneration Detection. IEEE/Asme Trans. Mechatron. 2022, 28, 632–643. [Google Scholar] [CrossRef]
- Zhang, J.; Li, X.; Tian, J.; Jiang, Y.; Luo, H.; Yin, S. A variational local weighted deep sub-domain adaptation network for remaining useful life prediction facing cross-domain conditions. Reliab. Eng. Syst. Saf. 2023, 231, 108986. [Google Scholar] [CrossRef]
- Sastry, J.K.R.; Ch, B.; Budaraju, R.R. Implementing Dual Base Stations within an IoT Network for Sustaining the Fault Tolerance of an IoT Network through an Efficient Path Finding Algorithm. Sensors 2023, 23, 4032. [Google Scholar] [CrossRef]
- Jammalamadaka, S.K.R.; Chokara, B.; Jammalamadaka, S.B.; Duvvuri, B.K.; Budaraju, R. Enhancing the Fault Tolerance of a Multi-Layered IoT Network through Rectangular and Interstitial Mesh in the Gateway Layer. Sens. Actuator Netw. 2023, 12, 76. [Google Scholar] [CrossRef]
- Jammalamadaka, S.K.R.; Chokara, B.; Jammalamadaka, S.B.; Duvvuri, B.K. Using DL Models in the Service Layer to Enhance the Fault Tolerance of IoT Networks. J. Electron. 2024, 13, 4334. [Google Scholar] [CrossRef]
- Jammalamadaka, S.K.R.; Chokara, B.; Jammalamadaka, S.B.; Duvvuri, B.K. Networking Microcontrollers and Balancing the Load on the Service Servers to Enhance the Fault Tolerance of the IoT Networks. J. Math. 2024, 12, 3730. [Google Scholar] [CrossRef]
- Shafin, S.S.; Karmakar, G.; Mareels, I.; Balasubramanian, V.; Kolluri, R.R. Sensor Self-Declaration of Numeric Data Reliability in the Internet of Things. IEEE Trans. Reliab. 2024, 99, 1–15. [Google Scholar] [CrossRef]


| Reference Number of the Author | Collection of Power Degradation Data | Degradation Domain Used | Noise Filtering Used | Power Based Fault Prediction Method Used | Detection Method | Power Based Fault Mitigation Method Used | The Basis Used for Power Fault | Type of Networking Used in the Device Layer | Fault Rate Computing at the Entire Network/ Method Based | Type of Model Used for Assessing the Fault Tolerance |
|---|---|---|---|---|---|---|---|---|---|---|
| Proposed | Online Un labelled | Nil | Nil | Assert Macros | Assert Macros | Device dropout | Spurious signal detection | Crossbar | Network-based | Hybrid, Network-Based |
| [34] | Labelled Data | Nil | Nil | Nil | SVM | Data Filtering | Nil | Clustered | Local method based | Fault Graph based method |
| [35] | Labelled Data | Nil | Nil | Nil | Hidden Markov Chain Model | Data Filtering | Nil | Clustered | Local method based | Availability of bandwidth |
| [36] | Labelled Data | Nil | Nil | Nil | Multi-Objective Deep hidden | Data Filtering | Nil | Clustered | Local method based | Network Failures |
| [37] | Labelled Data | Nil | Nil | Nil | Cluster Broker Selection | Data Filtering | Nil | Clustered | Local method based | Device Failures |
| [38] | Labelled Data | Nil | Nil | Nil | Block Chain model | Data Filtering | Nil | Clustered | Local method based | QoS surveillance |
| [39] | Labelled Data | Nil | Nil | Nil | Mode and Effects Analysis model | Data Filtering | Nil | Clustered | Local method based | Failures within SDN |
| [40] | Labelled Data | Nil | Nil | Nil | time series analysis | Data Filtering | Nil | Clustered | Local method based | Link Failures |
| [41] | Unlabelled data | Nil | Kalman Filter | Nil | Expectation Maximum | Data Filtering | Nil | Clustered | Local method based | Device Failures |
| [42] | Labelled Data | Nil | Particle Filter | Nil | Expectation maximization-unscented particle filter-Wilcox on rank sum test | Data Filtering | Nil | Clustered | Local method based | Link failures |
| [43] | Both Labelled and Unlabelled online data | Used | Nil | auto-encoder-long–short-term memory network-local weighted | Data Filtering | Nil | Clustered | Local method based | Transmission failures |
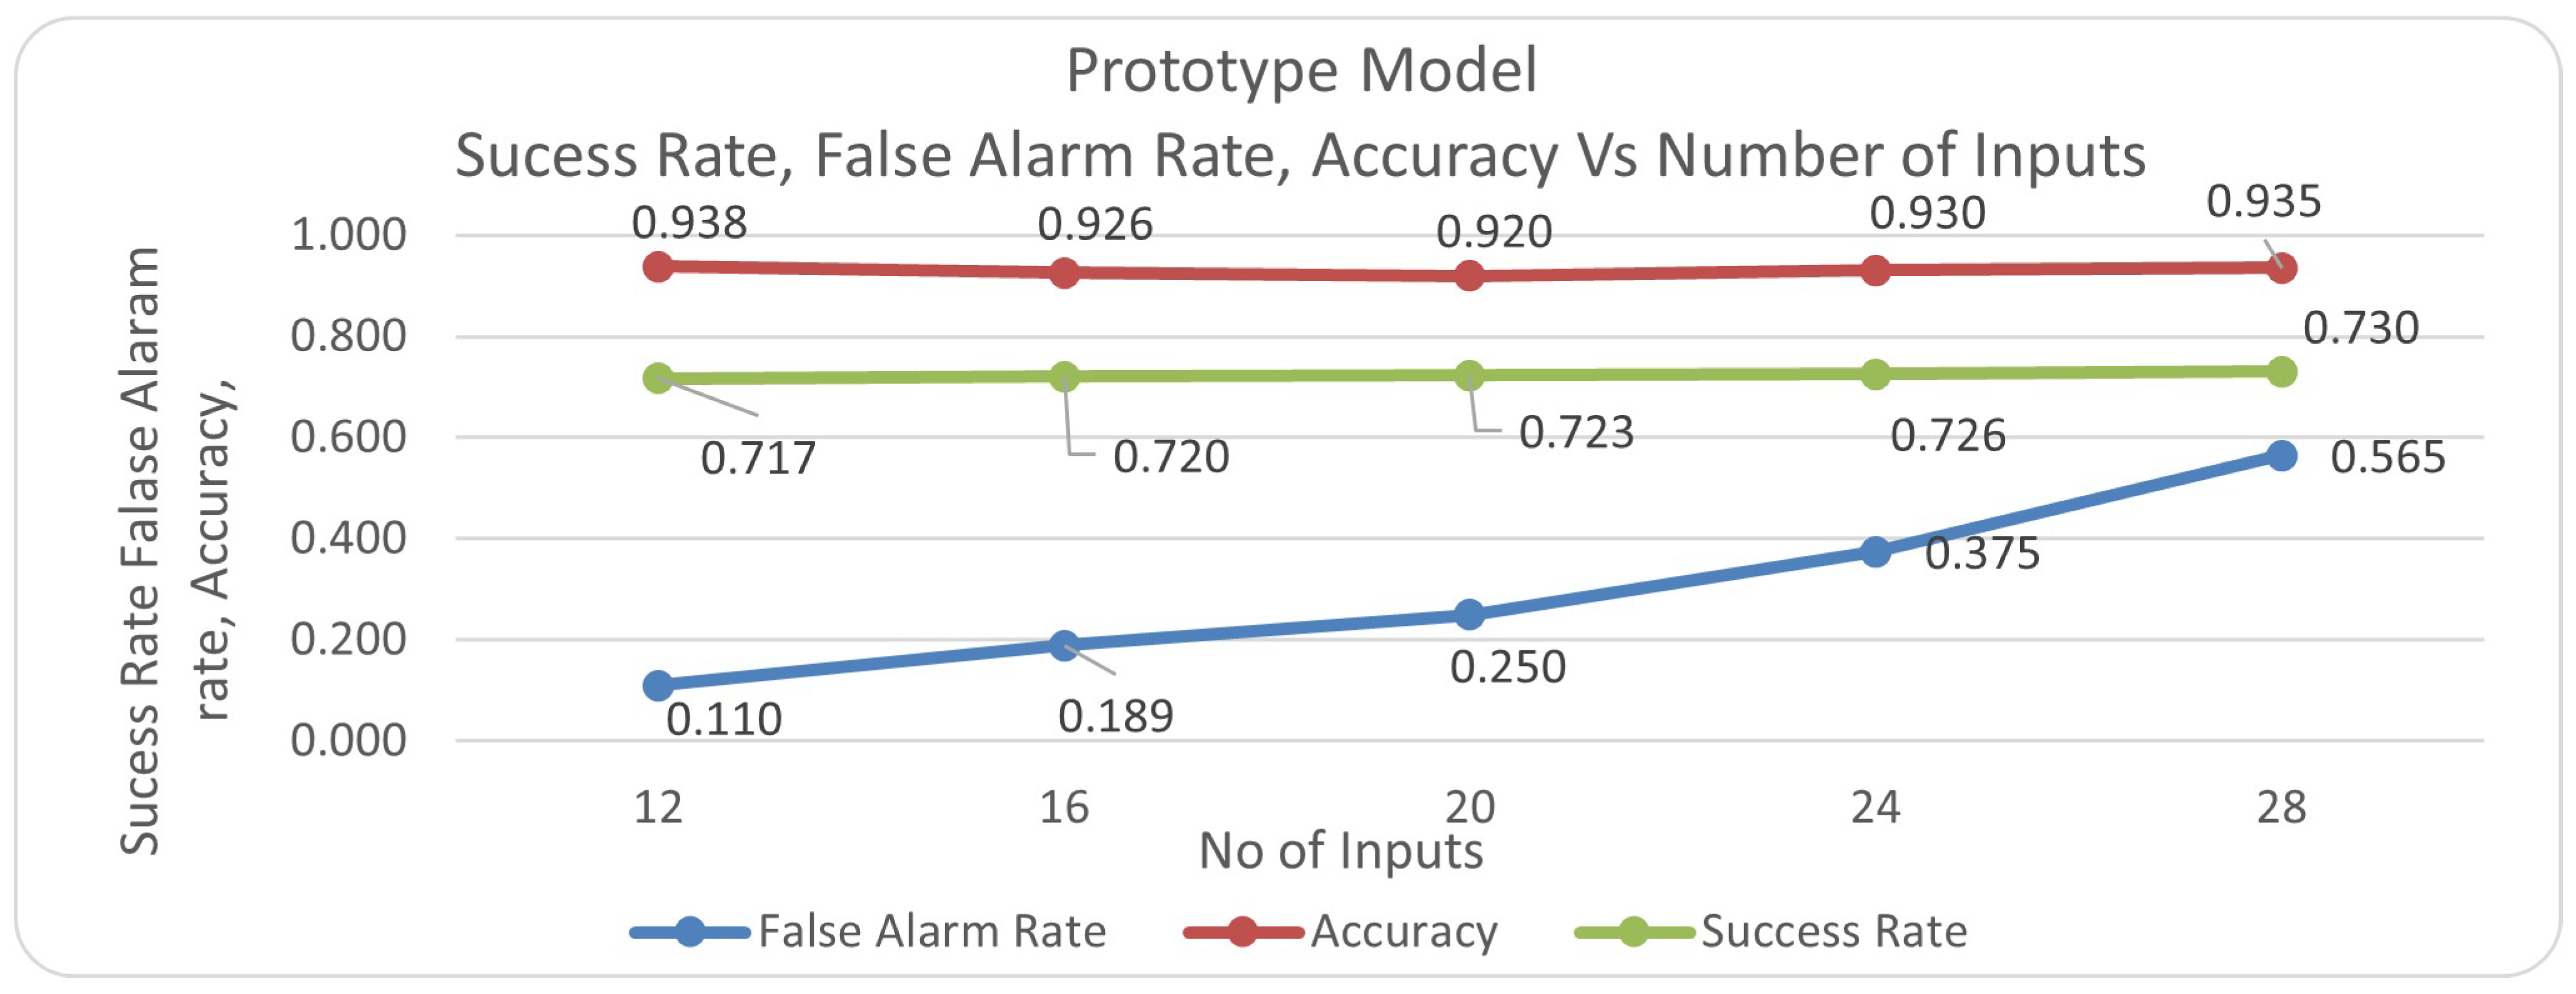
| Number of Inputs | Bytes Transmitted | Power Depletion | Longevity | TN | FP | TP | FN | False Alarm Rate | Accuracy | Success Rate |
|---|---|---|---|---|---|---|---|---|---|---|
| 12 | 1,033,730 | 3.87 × 10⁻⁶ | 37 | 89 | 11 | 849 | 51 | 0.11 | 0.938 | 0.717 |
| 16 | 775,297 | 3.87 × 10⁻⁶ | 37 | 86 | 20 | 840 | 54 | 0.189 | 0.926 | 0.72 |
| 20 | 620,238 | 3.87 × 10⁻⁶ | 37 | 60 | 20 | 860 | 60 | 0.25 | 0.92 | 0.723 |
| 24 | 516,865 | 3.87 × 10⁻⁶ | 37 | 25 | 15 | 905 | 55 | 0.375 | 0.93 | 0.726 |
| 28 | 443,027 | 3.87 × 10⁻⁶ | 37 | 10 | 13 | 925 | 52 | 0.565 | 0.935 | 0.73 |
| avg | 677,831.5 | 0.298 | 0.93 | 0.723 |
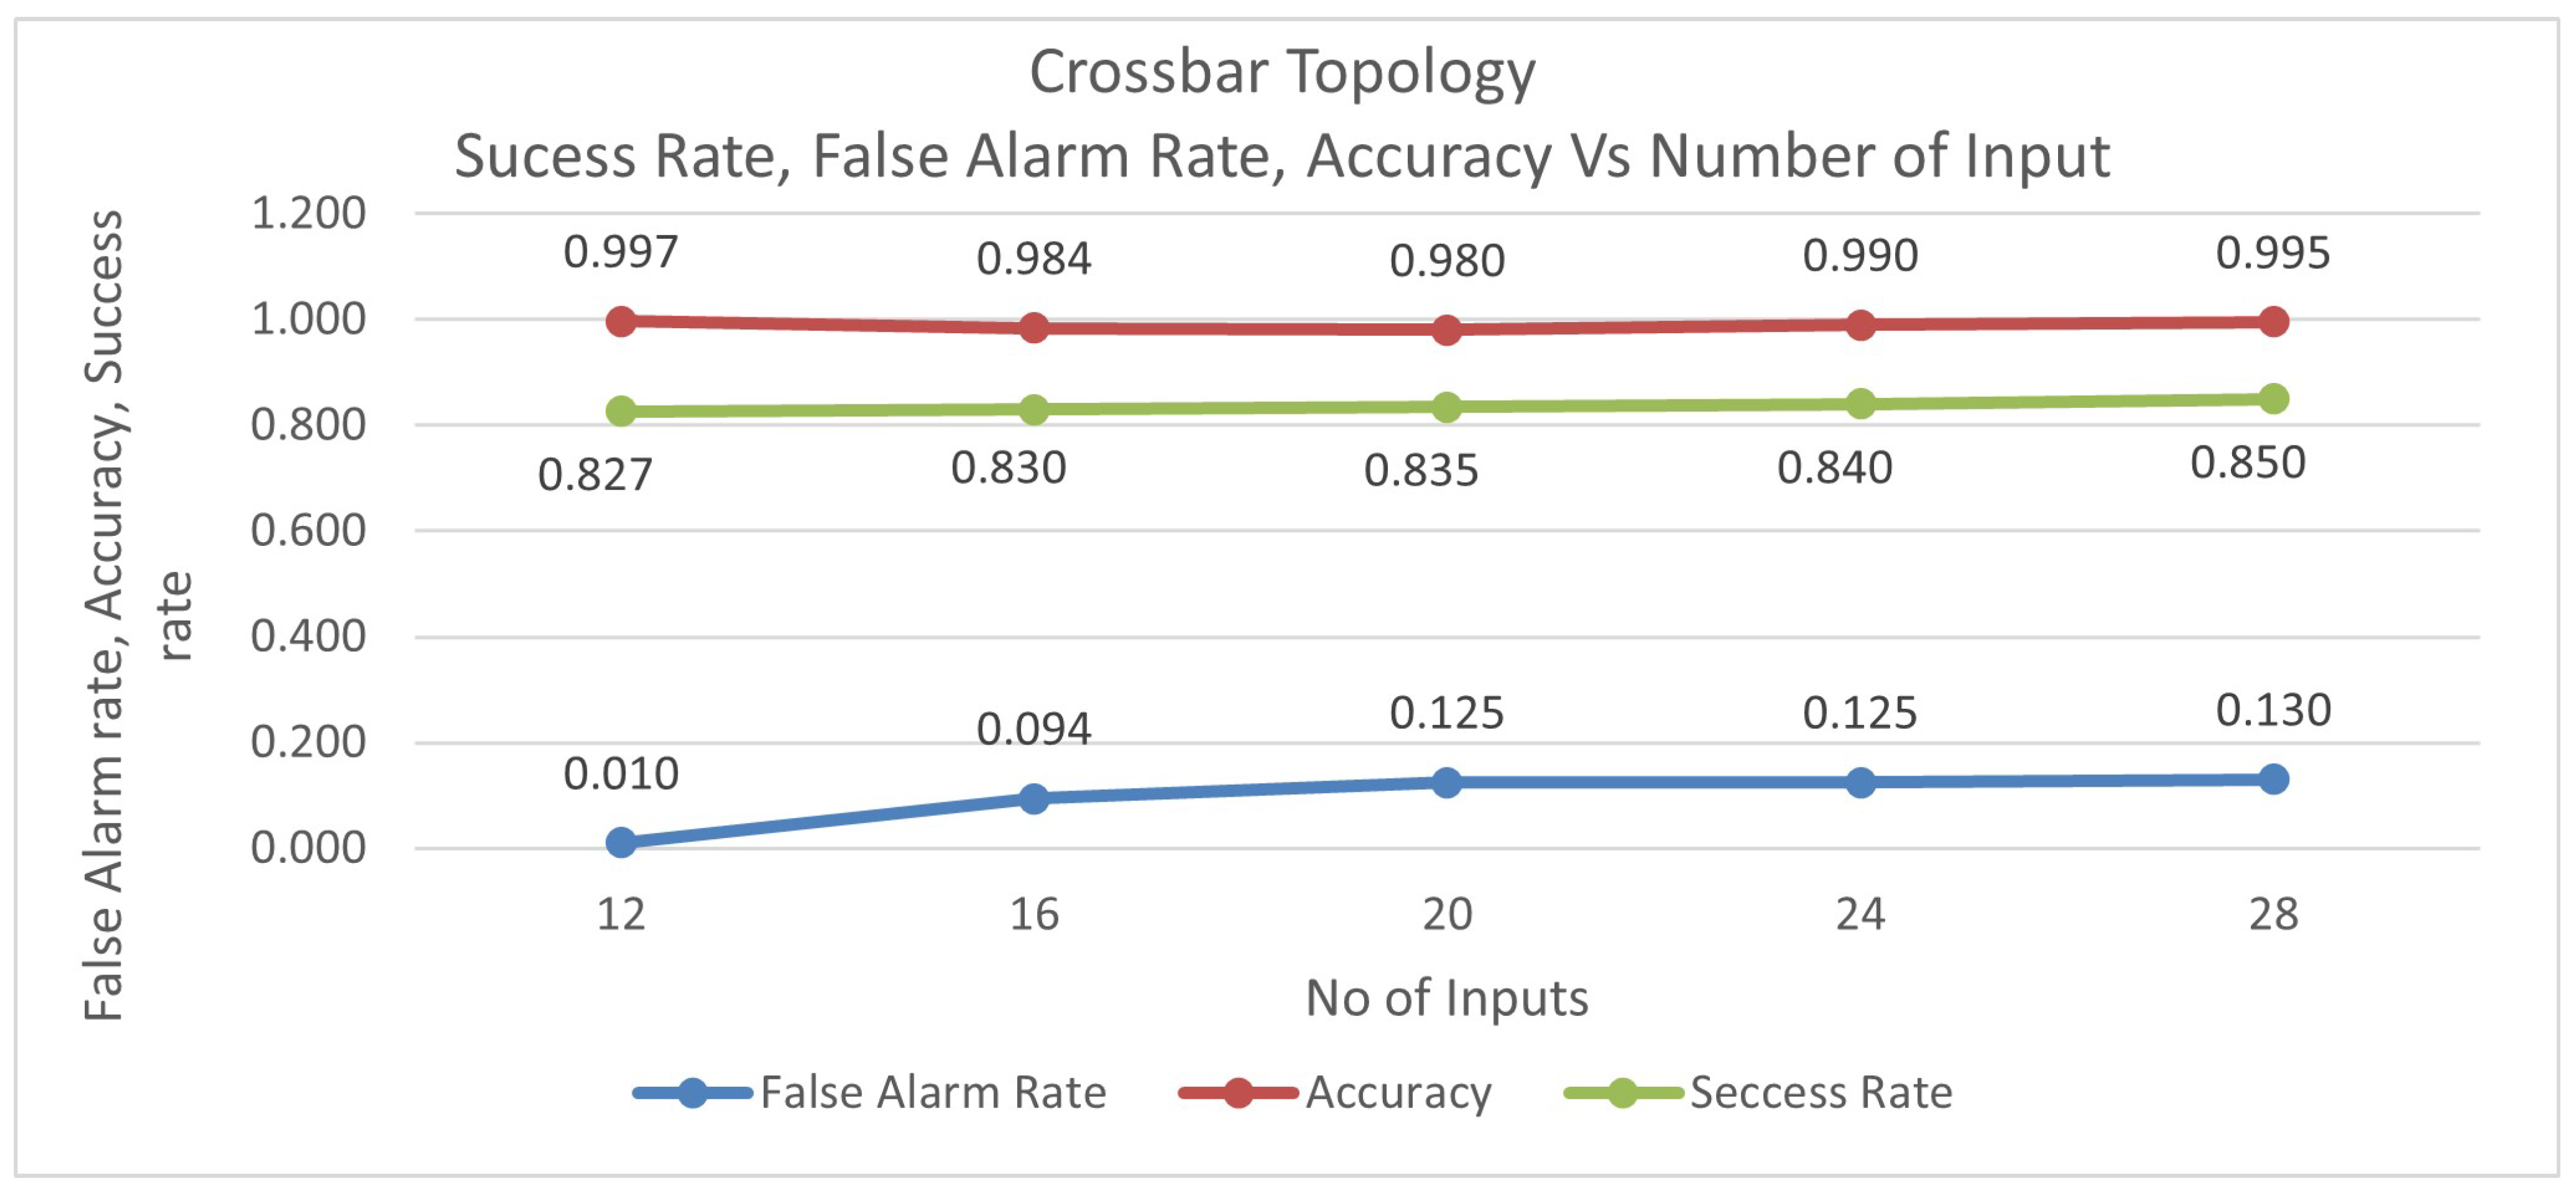
| Number of Inputs | Bytes Transmitted | Power Depletion | Longevity | TN | FP | TP | FN | False Alarm Rate | Accuracy | Success Rate |
|---|---|---|---|---|---|---|---|---|---|---|
| 12 | 2,158,897 | 2.40 × 10⁻⁶ | 50 | 99 | 1 | 898 | 2 | 0.010 | 0.997 | 0.827 |
| 16 | 1,619,172 | 2.40 × 10⁻⁶ | 50 | 96 | 10 | 888 | 6 | 0.094 | 0.984 | 0.830 |
| 20 | 1,295,338 | 2.40 × 10⁻⁶ | 50 | 70 | 10 | 910 | 10 | 0.125 | 0.980 | 0.835 |
| 24 | 1,079,448 | 2.40 × 10⁻⁶ | 50 | 35 | 5 | 955 | 5 | 0.125 | 0.990 | 0.840 |
| 28 | 711,724 | 2.40 × 10⁻⁶ | 50 | 20 | 3 | 975 | 2 | 0.130 | 0.995 | 0.850 |
| avg | 1,088,938 | 0.097 | 0.989 | 0.836 |
| Number of Inputs | Bytes Transmitted | Power Depletion | Longevity | TN | FP | TP | FN | False Alarm Rate | Accuracy | Success Rate |
|---|---|---|---|---|---|---|---|---|---|---|
| 12 | 2,158,897 | 1.85 × 10⁻⁶ | 58.5 | 99 | 1 | 899 | 1 | 0.01 | 0.998 | 0.835 |
| 16 | 1,619,172 | 1.85 × 10⁻⁶ | 58.5 | 96 | 10 | 890 | 4 | 0.094 | 0.986 | 0.840 |
| 20 | 1,295,338 | 1.85 × 10⁻⁶ | 58.5 | 80 | 10 | 900 | 10 | 0.111 | 0.98 | 0.845 |
| 24 | 1,079,448 | 1.85 × 10⁻⁶ | 58.5 | 40 | 5 | 950 | 5 | 0.111 | 0.99 | 0.85 |
| 28 | 925,241 | 1.85 × 10⁻⁶ | 58.5 | 20 | 2 | 975 | 2 | 0.13 | 0.995 | 0.855 |
| avg | 1,415,619 | 0.091 | 0.99 | 0.845 |
| Sl.no | Device | Success Rate | Gates Used For Connection | Preceding Devices | ||||
|---|---|---|---|---|---|---|---|---|
| Device Name D1 | Device Name D2 | Device Name D3 | Device Name D4 | Combined Success Rate | ||||
| Success Rate S1 | Success Rate S2 | Success Rate S3 | Success Rate S4 | |||||
| 1 | Cluster Head1 | 0.950 | 0.950 | |||||
| 2 | Cluster Head2 | 0.950 | 0.950 | |||||
| 3 | Cluster Head3 | 1.000 | 1.000 | |||||
| 4 | Cluster Head4 | 1.000 | 1.000 | |||||
| 5 | CrossBar network | 0.987 | OR | Cluster Head1, | Cluster Head2, | Cluster Head3 | Cluster Head4 | 0.950 |
| 0.950 | 0.950 | 1.0 | 1.0 | |||||
| 6 | Base Station 1 | 0.997 | OR | Device Level Crossbar NW (DLCB) | 0.997 | |||
| 0.95 | ||||||||
| 7 | CONTROLLER | 0.900 | OR | Base Station 1 | 0.997 | |||
| 0.997 | ||||||||
| 8 | REST SERVER | 0.900 | AND | CONTROLLER | 0.8973 | |||
| 0.997 | ||||||||
| 9 | GATEWAY | 0.98 | AND | REST SERVER | 0.879 | |||
| 0.8973 | ||||||||
| 10 | INTERNET | 0.95 | AND | GATEWAY | 0.835 | |||
| 0.879 | ||||||||
| IoT Network Models | Longevity in Months | False Alarm Rate | Accuracy | Success Rate | Data Transfer Rate |
|---|---|---|---|---|---|
| Prototype Model | 37 | 0.298 | 0.930 | 0.723 | 677,831 |
| Crossbar Topology | 50 | 0.097 | 0.989 | 0.836 | 1,088,938 |
| Crossbar Topology with power management | 59 | 0.091 | 0.990 | 0.845 | 1,415,619 |
| % of improvement over the prototype model | 37 | 69 | 6 | 17 | 109 |
| IoT Network Models | Longevity in Months | False Alarm Rate | Accuracy | Success Rate |
|---|---|---|---|---|
| Crossbar Topology with power management | 59 | 0.091 | 0.990 | 0.845 |
| SVM Model [39] | 23 | 0.150 | 0.990 | 0.710 |
| Hidden Markov Model [24] | 38 | 0.200 | 0.990 | 0.700 |
| Multi-Objective Deep Hidden [38] | 36 | 0.300 | 0.980 | 0.690 |
| Cluster Broker Selection [25] | 33 | 0.400 | 0.980 | 0.698 |
| Time Series Analysis Model [18] | 31 | 0.305 | 0.940 | 0.700 |
| % of improvement | 61 | 77 | 1 | 21 |
Disclaimer/Publisher’s Note: The statements, opinions and data contained in all publications are solely those of the individual author(s) and contributor(s) and not of MDPI and/or the editor(s). MDPI and/or the editor(s) disclaim responsibility for any injury to people or property resulting from any ideas, methods, instructions or products referred to in the content. |
© 2025 by the authors. Licensee MDPI, Basel, Switzerland. This article is an open access article distributed under the terms and conditions of the Creative Commons Attribution (CC BY) license (https://creativecommons.org/licenses/by/4.0/).
Share and Cite
Jammalamadaka, K.R.S.; Chokara, B.; Jammalamadaka, S.B.; Duvvuri, B.K. Making IoT Networks Highly Fault-Tolerant Through Power Fault Prediction, Isolation and Composite Networking in the Device Layer. J. Sens. Actuator Netw. 2025, 14, 24. https://doi.org/10.3390/jsan14020024
Jammalamadaka KRS, Chokara B, Jammalamadaka SB, Duvvuri BK. Making IoT Networks Highly Fault-Tolerant Through Power Fault Prediction, Isolation and Composite Networking in the Device Layer. Journal of Sensor and Actuator Networks. 2025; 14(2):24. https://doi.org/10.3390/jsan14020024
Chicago/Turabian StyleJammalamadaka, Kodanda Rama Sastry, Bhupati Chokara, Sasi Bhanu Jammalamadaka, and Balakrishna Kamesh Duvvuri. 2025. "Making IoT Networks Highly Fault-Tolerant Through Power Fault Prediction, Isolation and Composite Networking in the Device Layer" Journal of Sensor and Actuator Networks 14, no. 2: 24. https://doi.org/10.3390/jsan14020024
APA StyleJammalamadaka, K. R. S., Chokara, B., Jammalamadaka, S. B., & Duvvuri, B. K. (2025). Making IoT Networks Highly Fault-Tolerant Through Power Fault Prediction, Isolation and Composite Networking in the Device Layer. Journal of Sensor and Actuator Networks, 14(2), 24. https://doi.org/10.3390/jsan14020024