Article

A Novel Road Maintenance Prioritisation System Based on Computer Vision and Crowdsourced Reporting

1
Department of Mechatronics Engineering, Universidad Católica Boliviana “San Pablo”, La Paz 4807, Bolivia
2
Electronic Engineering and Computer Science School, Queen Mary University of London, London E1 4FZ, UK
*
Author to whom correspondence should be addressed.
J. Sens. Actuator Netw. 2022, 11(1), 15; https://doi.org/10.3390/jsan11010015
Submission received: 6 January 2022 / Revised: 2 February 2022 / Accepted: 9 February 2022 / Published: 14 February 2022
(This article belongs to the Special Issue Machine Learning in IoT Networking and Communications)

Abstract

:
The maintenance of critical infrastructure is a costly necessity that developing countries often struggle to deliver timely repairs. The transport system acts as the arteries of any economy in development, and the formation of potholes on roads can lead to injuries and the loss of lives. Recently, several countries have enabled pothole reporting platforms for their citizens, so that repair work data can be centralised and visible for everyone. Nevertheless, many of these platforms have been interrupted because of the rapid growth of requests made by users. Not only have these platforms failed to filter duplicate or fake reports, but they have also failed to classify their severity, albeit that this information would be key in prioritising repair work and improving the safety of roads. In this work, we aimed to develop a prioritisation system that combines deep learning models and traditional computer vision techniques to automate the analysis of road irregularities reported by citizens. The system consists of three main components. First, we propose a processing pipeline that segments road sections of repair requests with a UNet-based model that integrates a pretrained Resnet34 as the encoder. Second, we assessed the performance of two object detection architectures—EfficientDet and YOLOv5—in the task of road damage localisation and classification. Two public datasets, the Indian Driving Dataset (IDD) and the Road Damage Detection Dataset (RDD2020), were preprocessed and augmented to train and evaluate our segmentation and damage detection models. Third, we applied feature extraction and feature matching to find possible duplicated reports. The combination of these three approaches allowed us to cluster reports according to their location and severity using clustering techniques. The results showed that this approach is a promising direction for authorities to leverage limited road maintenance resources in an impactful and effective way.

1. Introduction

Roads are an essential factor in the economic and social development of any country. The investment in new road infrastructure always results in new opportunities for services and asset interchange between the connected populations. Once a new road is finished, it can provide many years of satisfactory service. However, similar to any type of infrastructure, roads can be damaged over time, due to a number of factors including weather conditions, traffic action (starting and stopping), and moisture infiltration. Consequently, different types of distress start appearing on the surface of roads as cracks, potholes, and corrugation, of which potholes are the most threatening. A pothole can cause serious accidents to motorcycle and car drivers, up to the point of causing deaths. For instance, the Ministry of Transport and Highways in India declared that 2015 people lost their lives in 2018 due to pothole-related accidents [1]. Surprisingly, this figure corresponds to an average of more than five daily deaths, which according to the same source keeps growing year by year.
Although many local governments in developing countries have created entire road maintenance departments to collect, process, and complete repair tasks, the majority cannot afford new technologies to automate them. Normally, potholes and road abnormalities are detected in situ by professional inspectors, even though this adds delays to the road maintenance process [2]. In many cases, other maintenance departments ask complainers to register their requests via phone calls, letters, or emails [3], but these do not include a graphical visualisation of the road defect and, hence, cannot alleviate the volume of work of professional inspectors. To improve citizen participation in road damage reporting, some governments have launched public reporting initiatives to let citizens register and track their repair requests online. Some examples are provided in Table 1. From basic web forms to sophisticated mobile apps, many institutions let citizens report road issues and other infrastructure-related repairs. These solutions are beneficial to road maintenance departments because they convert citizens into public infrastructure sensors. However, this process comes with its own set of challenges because road authorities still require human intervention to find duplicate or fake reports, as well as to classify reports’ severity, which frequently causes delays, the rapid accumulation of reports, and public disappointment.
In this work, we propose a system that automates the process of receiving, validating, and prioritising road repair requests by analysing visual data from crowdsourced road reports. We made use and augmented existent large datasets collected in developing countries to fit the proposed unstructured urban environment, where streets are not well delineated with crosswalks or lanes, contain multiple flaws, and are maintained infrequently [4,5]. Some examples of these unstructured environments can be seen in Figure 1. Our main contributions are as follows:
  • We investigated a semantic segmentation model that extracts road segments from images attached to the repair requests. Since reports provided by citizens are unreliable, the system compares feature descriptors of new and previous images in order to find potential duplicate or fake reports;
  • We experimented with recent deep learning architectures to detect and classify road defects into three categories: single cracks, crocodile cracks, and potholes. In contrast to many real-time road damage detection proposals, we focused on finding accurate detection methods for offline automated image analysis;
  • We propose a combined supervised and unsupervised approach for request clustering according to their location. Then, all clusters and inner repair requests are prioritised based on the number and types of issues found in them from visual data, so that the worst areas are attended to first and the less affected ones later.
The remainder of this paper is organised as follows. In Section 2, we analyse the current strategies for automatic road damage inspection and prioritisation. Section 3 describes the deep learning methods, as well as the computer vision pipeline implemented in the project. The evaluation results presented in Section 4 are promising and show the potential benefits of deep learning and computer vision to prioritise the work performed by any road maintenance authority. Section 5 draws the conclusions based on the results and provides suggestions for future work.

2. Related Works

2.1. Active and Passive Sensing

Even though extensive research has been carried out on automatic road damage recognition, the majority has focused on potholes since they are the worst structural failures on roads. No road surface is purely impermeable, and moisture, in addition to overloaded vehicles and a lack of maintenance, is the main cause of pothole formation. Current research on pothole detection algorithms can be clustered into three groups: 2D vision based [6,7,8,9,10,11,12,13,14], 3D reconstruction based [6,15,16,17,18,19,20,21,22,23,24,25], and IoT based [26,27,28,29]. Usually, this last group proposes to fit Internet of Things (IoT) sensors (accelerometer, gyroscope, and GPS sensors) onto citizens’ vehicles to map surface irregularities while driving. Nevertheless, the IoT strategy was initially discarded for this work not only because it requires tracking users continuously, but also because it was proven to cause many false positives due to bumps, train tracks, or trash [7]. Due to privacy concerns, more research may be needed to collect pothole information with this approach.
Three-dimensional reconstruction for road surface modelling is the main technique applied by private companies that offer road monitoring services [30]. Two major sensing modalities are used in 3D reconstruction for road modelling, namely active sensing with RGB-D cameras [15,16], LiDAR sensors [17], or laser scanners [6,18], and passive sensing with two or more synchronised stereo vision cameras [19,20,21,22,23,24,25]. A major problem of active sensing is that a shortage of funding can make it inaccessible to low-income governments. Although there have been significant attempts to make active sensing accessible to the public using affordable devices such as Microsoft Kinect, these devices do not work outdoors or under sunlight. To cope with these problems, the researchers in [16] proposed to use four Kinect sensors inside a closed box heading to the ground in order to detect road anomalies. Furthermore, the authors in [18] posed the combination of a single camera and a laser pointer to reconstruct potholes by recognising the light patterns; however, this strategy is not effective in wet conditions [7].
In contrast with active sensing, 3D reconstruction based on passive sensing benefits from lower costs and greater accessibility. The main passive sensing technology is stereo vision, which can be implemented in road condition assessment using two regular cameras aligned at the same height, calibrated with a chessboard, and pointed at the surface. Then, both input images can be compared to estimate the depth or distance per pixel in the scene. The result, also known as a disparity map, can be compared later with the disparity map of a regular road surface to find potential anomalies [7]. Even though the authors in [20,21] proposed new techniques to more accurately calculate the disparity between normal and irregular surfaces, these approaches would be severely affected by the road surface variability present in unstructured urban environments where streets are not well delineated and maintained. In addition, stereo vision also demands detecting matching points and extrinsic/intrinsic parameters frequently for accurate alignment and calibration, which might require expert knowledge to use the tool. Although the authors in [19,20,21,22,23,24,25] highlighted that stereo vision is not affected by illumination changes and is more accurate when volume/distance measurements are needed, its major drawback is that it is not widely available. Thus, this approach would limit public engagement for crowdsourcing for road data collection.
This review led us to focus on 2D vision methods, whose data can be collected by digital cameras, mobile devices, and embedded systems. Furthermore, this type of data is predominantly present in the pothole reporting systems listed in Table 1. Due to the ever-increasing availability of embedded cameras, many studies have focused on real-time pothole avoidance for autonomous and conventional vehicles [10,11], while others have prioritised offline automatic analysis for maintenance optimisation [8]. Two groups of 2D vision-based strategies can be clearly recognised in this research thread [7]: image processing and feature extraction techniques for road distress segmentation and deep learning for automatic pothole detection. The former commonly enhances images using point processing and image filtering techniques and then applies classical thresholding algorithms such as Otsu’s method [12,13] or watershed segmentation [13]. In contrast, the latter leverages the recent progress of deep neural networks to obtain better generalisation than overly elaborate processing pipelines [7]. For example, the researchers in [7] compared the results of stereo-vision-based techniques with deep-learning-based models, and they found that fine-tuning Mask-RCNN and YOLOv2 with the CIMAT Challenging Sequences for Autonomous Driving dataset (CCSAD) [31] could be used to detect potholes under very challenging weather conditions, whereas stereo vision failed in this attempt.

2.2. Deep-Learning-Based Road Assessment

Several comprehensive studies have covered the application of deep neural networks for pothole detection. For instance, the authors in [10] collected and annotated images of real-world scenes and fine-tuned various object detection models. An average precision of 82% using a combination of R-CNN and Resnet101 ended up being their best experiment. In 2020, Silva et al. [14] proposed the use of YOLOv4 for pothole detection from images taken by a drone, where the model achieved a promising accuracy of 95%. Furthermore, the authors in [11] presented the implementation of YOLOv3 for geolocated potholes in 330 images sampled in Malaysia. These and other papers showed that learning methods to address the pothole detection problem have become the norm currently. Nonetheless, progress in the development of methods for locating and classifying different types of road defects remain slower, as a consequence of the lack of large public datasets.
By 2016, some research centres collected and published large street image datasets such as KITTI [32] (2013) and CityScapes [33] (2016). Nevertheless, the majority of samples was collected in well-structured street scenarios where drivers, as well as pedestrians behave in a predictable manner. In such scenarios, roads are well defined and properly maintained during the year. Since then, the advent of more powerful cameras embedded in mobile phones allowed access to low-cost outdoor data collection. For example, in 2018, researchers at the University of Tokyo [34] presented a new road damage dataset (RDD) [5], which was collected in many Japanese municipalities. Over the years, this dataset has become the biggest multi-country road damage dataset as new samples per damage category and from different cities were included.
The class distribution and current damage categories of the last version of RDD (as of October 2021) are summarised in Table 2. In addition, the authors also launched three contests named the Global Road Damage Detection Challenge (2018, 2019, and 2020) that yielded compelling proposals for road damage localisation and classification [34]. For instance, V. Hegde et al. [35] won the last version of this contest by training an Ultralytics-YOLO (u-YOLO) model with data generated from the test time data augmentation method. Then, they applied non-maximum suppression to select the best bounding boxes and obtained an F1-score of 0.67. This paper motivated us to choose Ultralytics-YOLO, which evolved to become YOLOv5, to perform our experiments.
Table 2 reveals that the dataset is unbalanced and requires further work to equalise the number of damage instances per category. Furthermore, some state-of-the-art papers, which are listed in Table 3, used the dataset and proposed models considering the most meaningful categories for better performance: D00, D10, D20, and D40. Apart from the works listed in Table 3, the researchers in [36] posited the application of YOLO with a dataset of 45,788 images that were collected in the streets of Shanghai with an industrial high-resolution camera for damage classification. This approach deviates from what is proposed in the current paper: analysing images taken by mid-range mobile phones. On the other hand, Reference [37] proposed to use an algorithm to collect street images from Google Earth for road irregularity classification and localisation. Although the annotation process was the main constraint for taking advantage of this source, it would be a compelling strategy for future works.
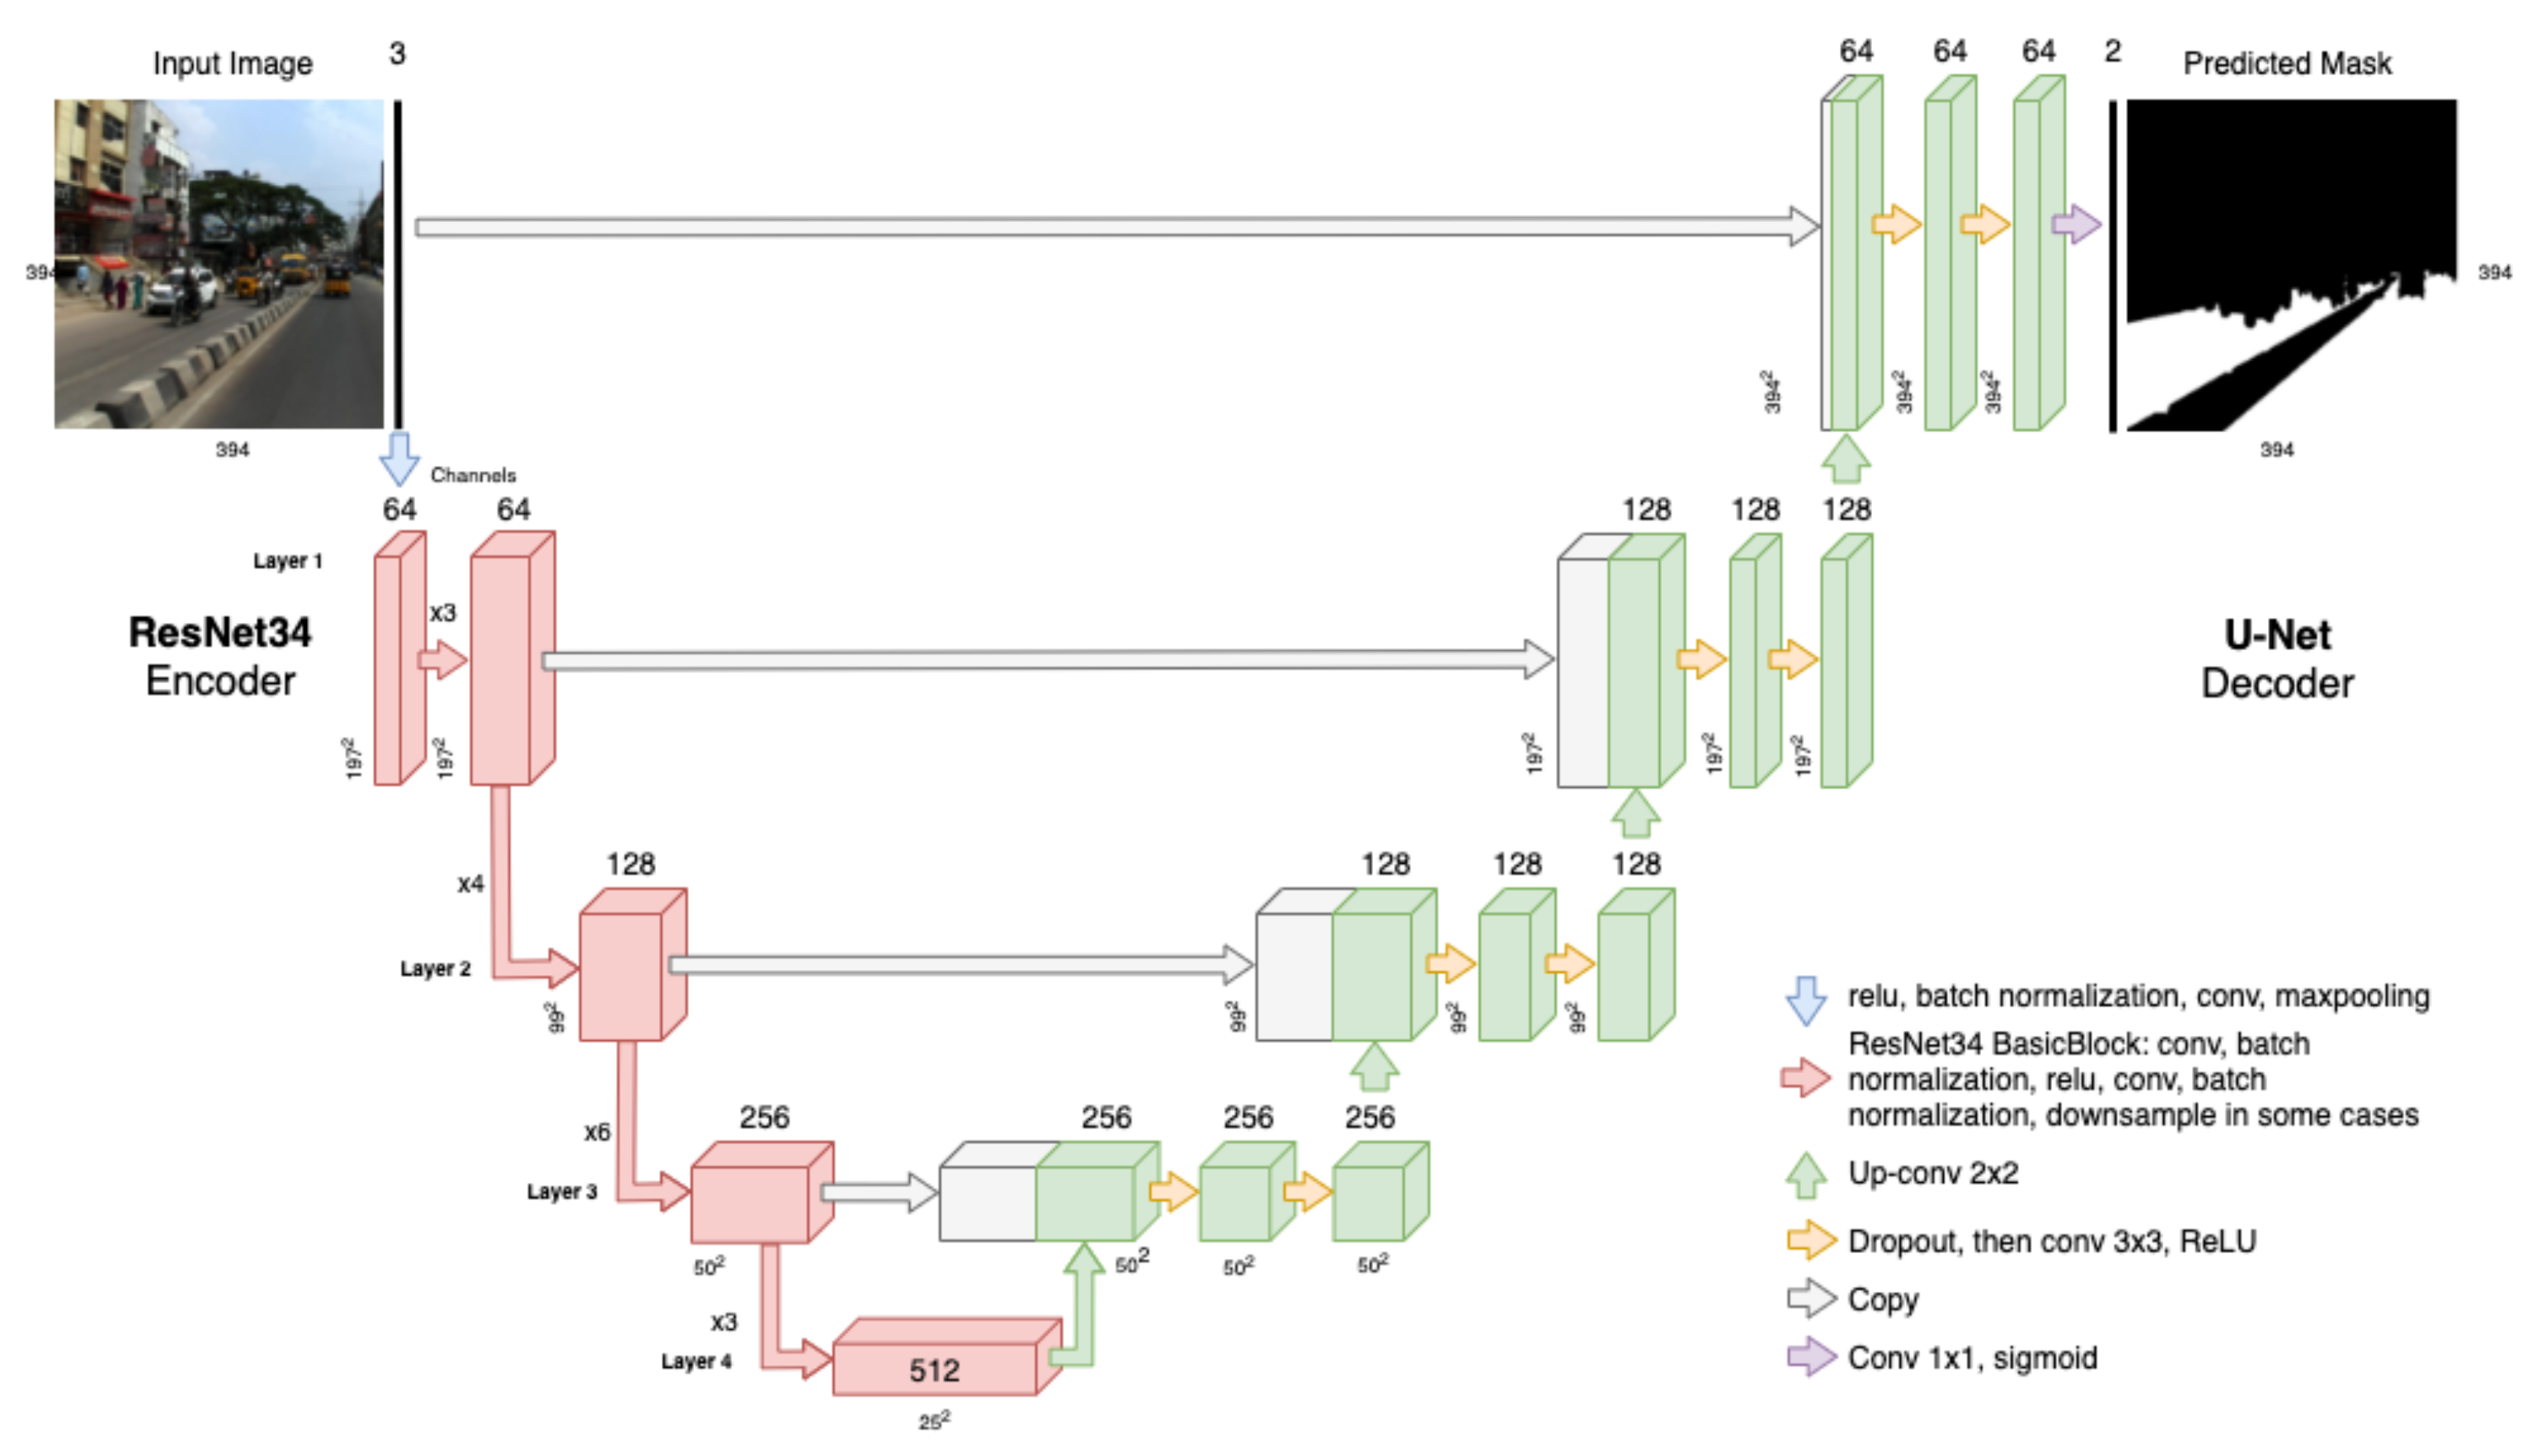
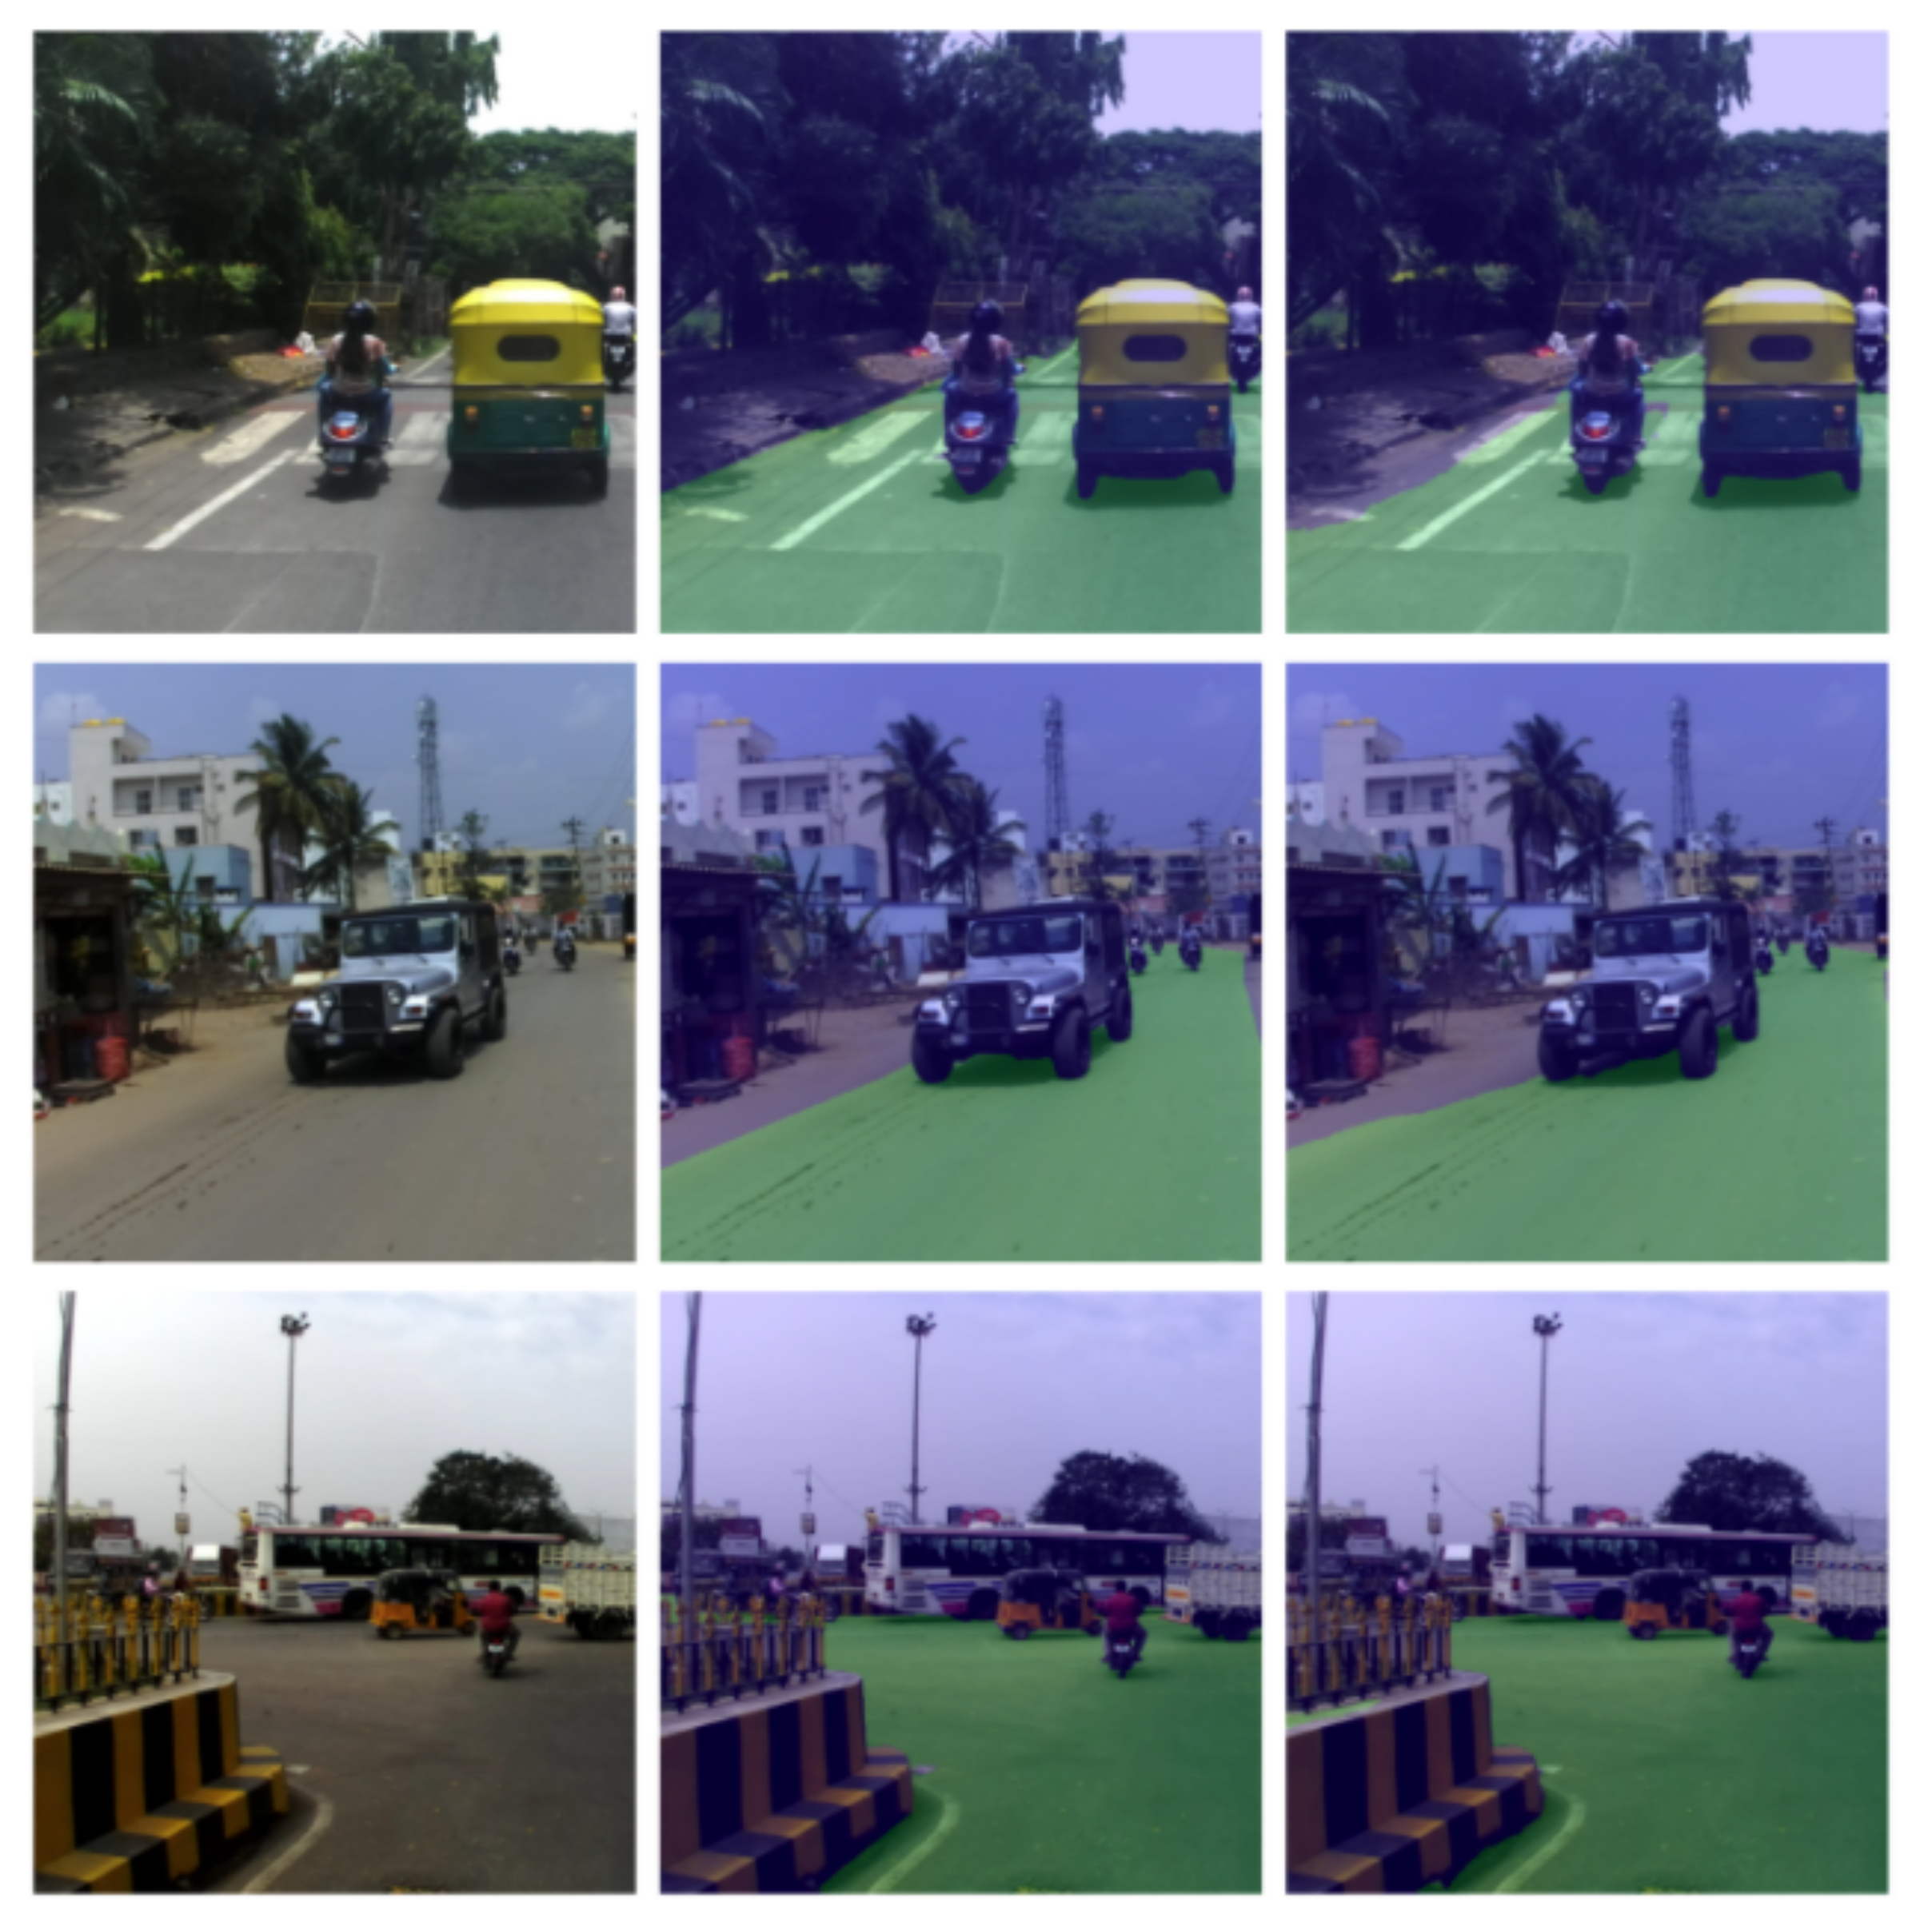
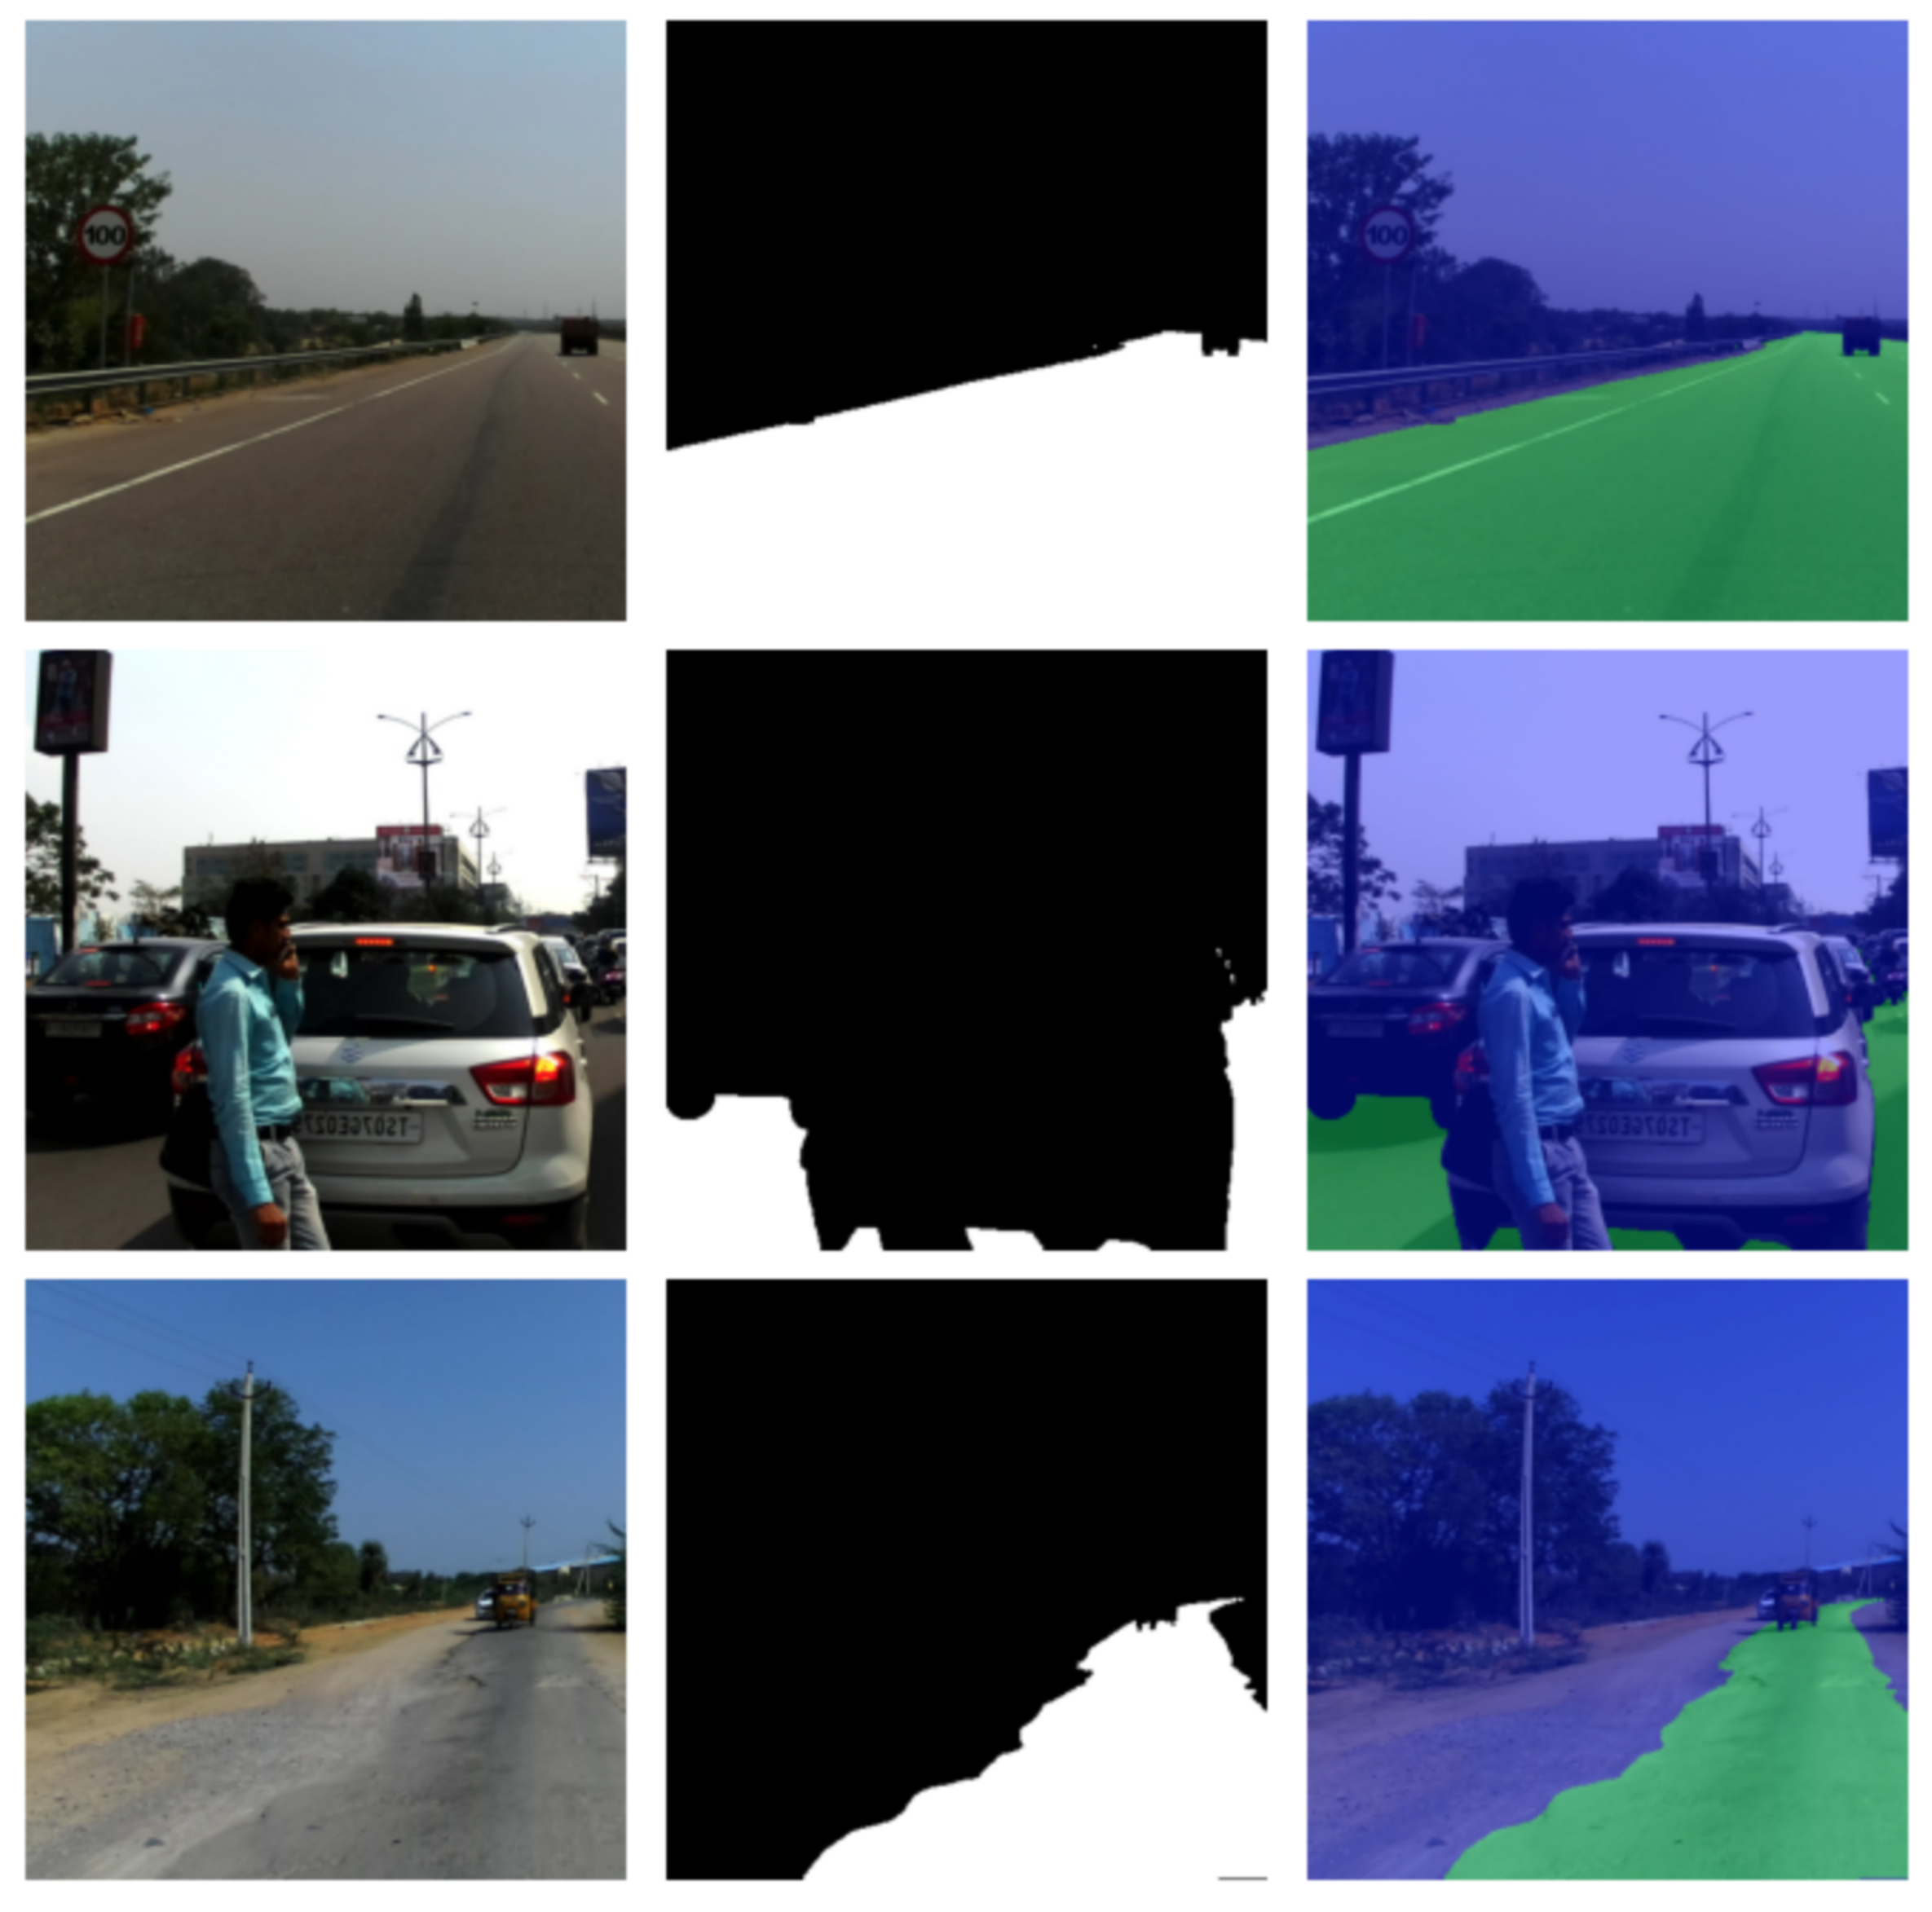
Although images with street scenes contain rich information, only parts with road segments are important for road damage analysis. Such segments would contribute later to finding potential duplicated or fake repair requests. Semantic segmentation is the task of labelling each pixel in an image with a single class such as lane, road, or traffic sign. The Indian Driving Dataset (IDD) [4] is currently one of the biggest image collections with 16,062 unstructured urban images annotated for semantic segmentation tasks. Similar to the RDD dataset, researchers at IIIT Hyderabad, Intel Bangalore, and University of California San Diego created a dataset for autonomous navigation suitable for the needs of the Indian context. Later, they organised the AutoNUE 2019 and NCVPRIPG 2019 contests where the best teams achieved meaningful results. The first part of our methodology was inspired by the NCVPRIPG 2019 winners [40], who proposed a transfer-learning-based architecture named Eff-UNet. This proposal combines EfficientNet as the encoder for feature extraction, with UNet as the decoder. Different from our problem, the NCVPRIPG 2019 organisers challenged the participants to use a subset of IDD, known as IDD Lite, in order to develop resource-constrained models. The proposal developed by [40] managed to achieve a 0.7376 and 0.6276 mean Intersection over Union (mIoU) on the validation and test subsets, respectively.

2.3. Road Maintenance Prioritisation

The management and optimisation of road maintenance based on computational modelling is not a recent approach and dates back at least to the 1980s, when road information computer systems were available [41]. Since then, many maintenance systems have been proposed to optimise how resources are located from a series of financial, location, social, and political perspectives. For instance, in 2018, Ma et al. [42] introduced a dynamic programming method to minimise the traffic caused by road maintenance in cities. The method was capable of identifying the best combination of roads to be maintained at the same time and considered the available resources, the vehicle fluency per street, and the travel time to go through them. A similar research problem was investigated by Ankang et al. [43] in 2020, who presented the application of particle swarm optimisation and Markov chains to predict the pavement post-conditions after simulating multiple maintenance strategies. Consequently, the approach was able to find the optimal strategy while meeting multiple constraints.
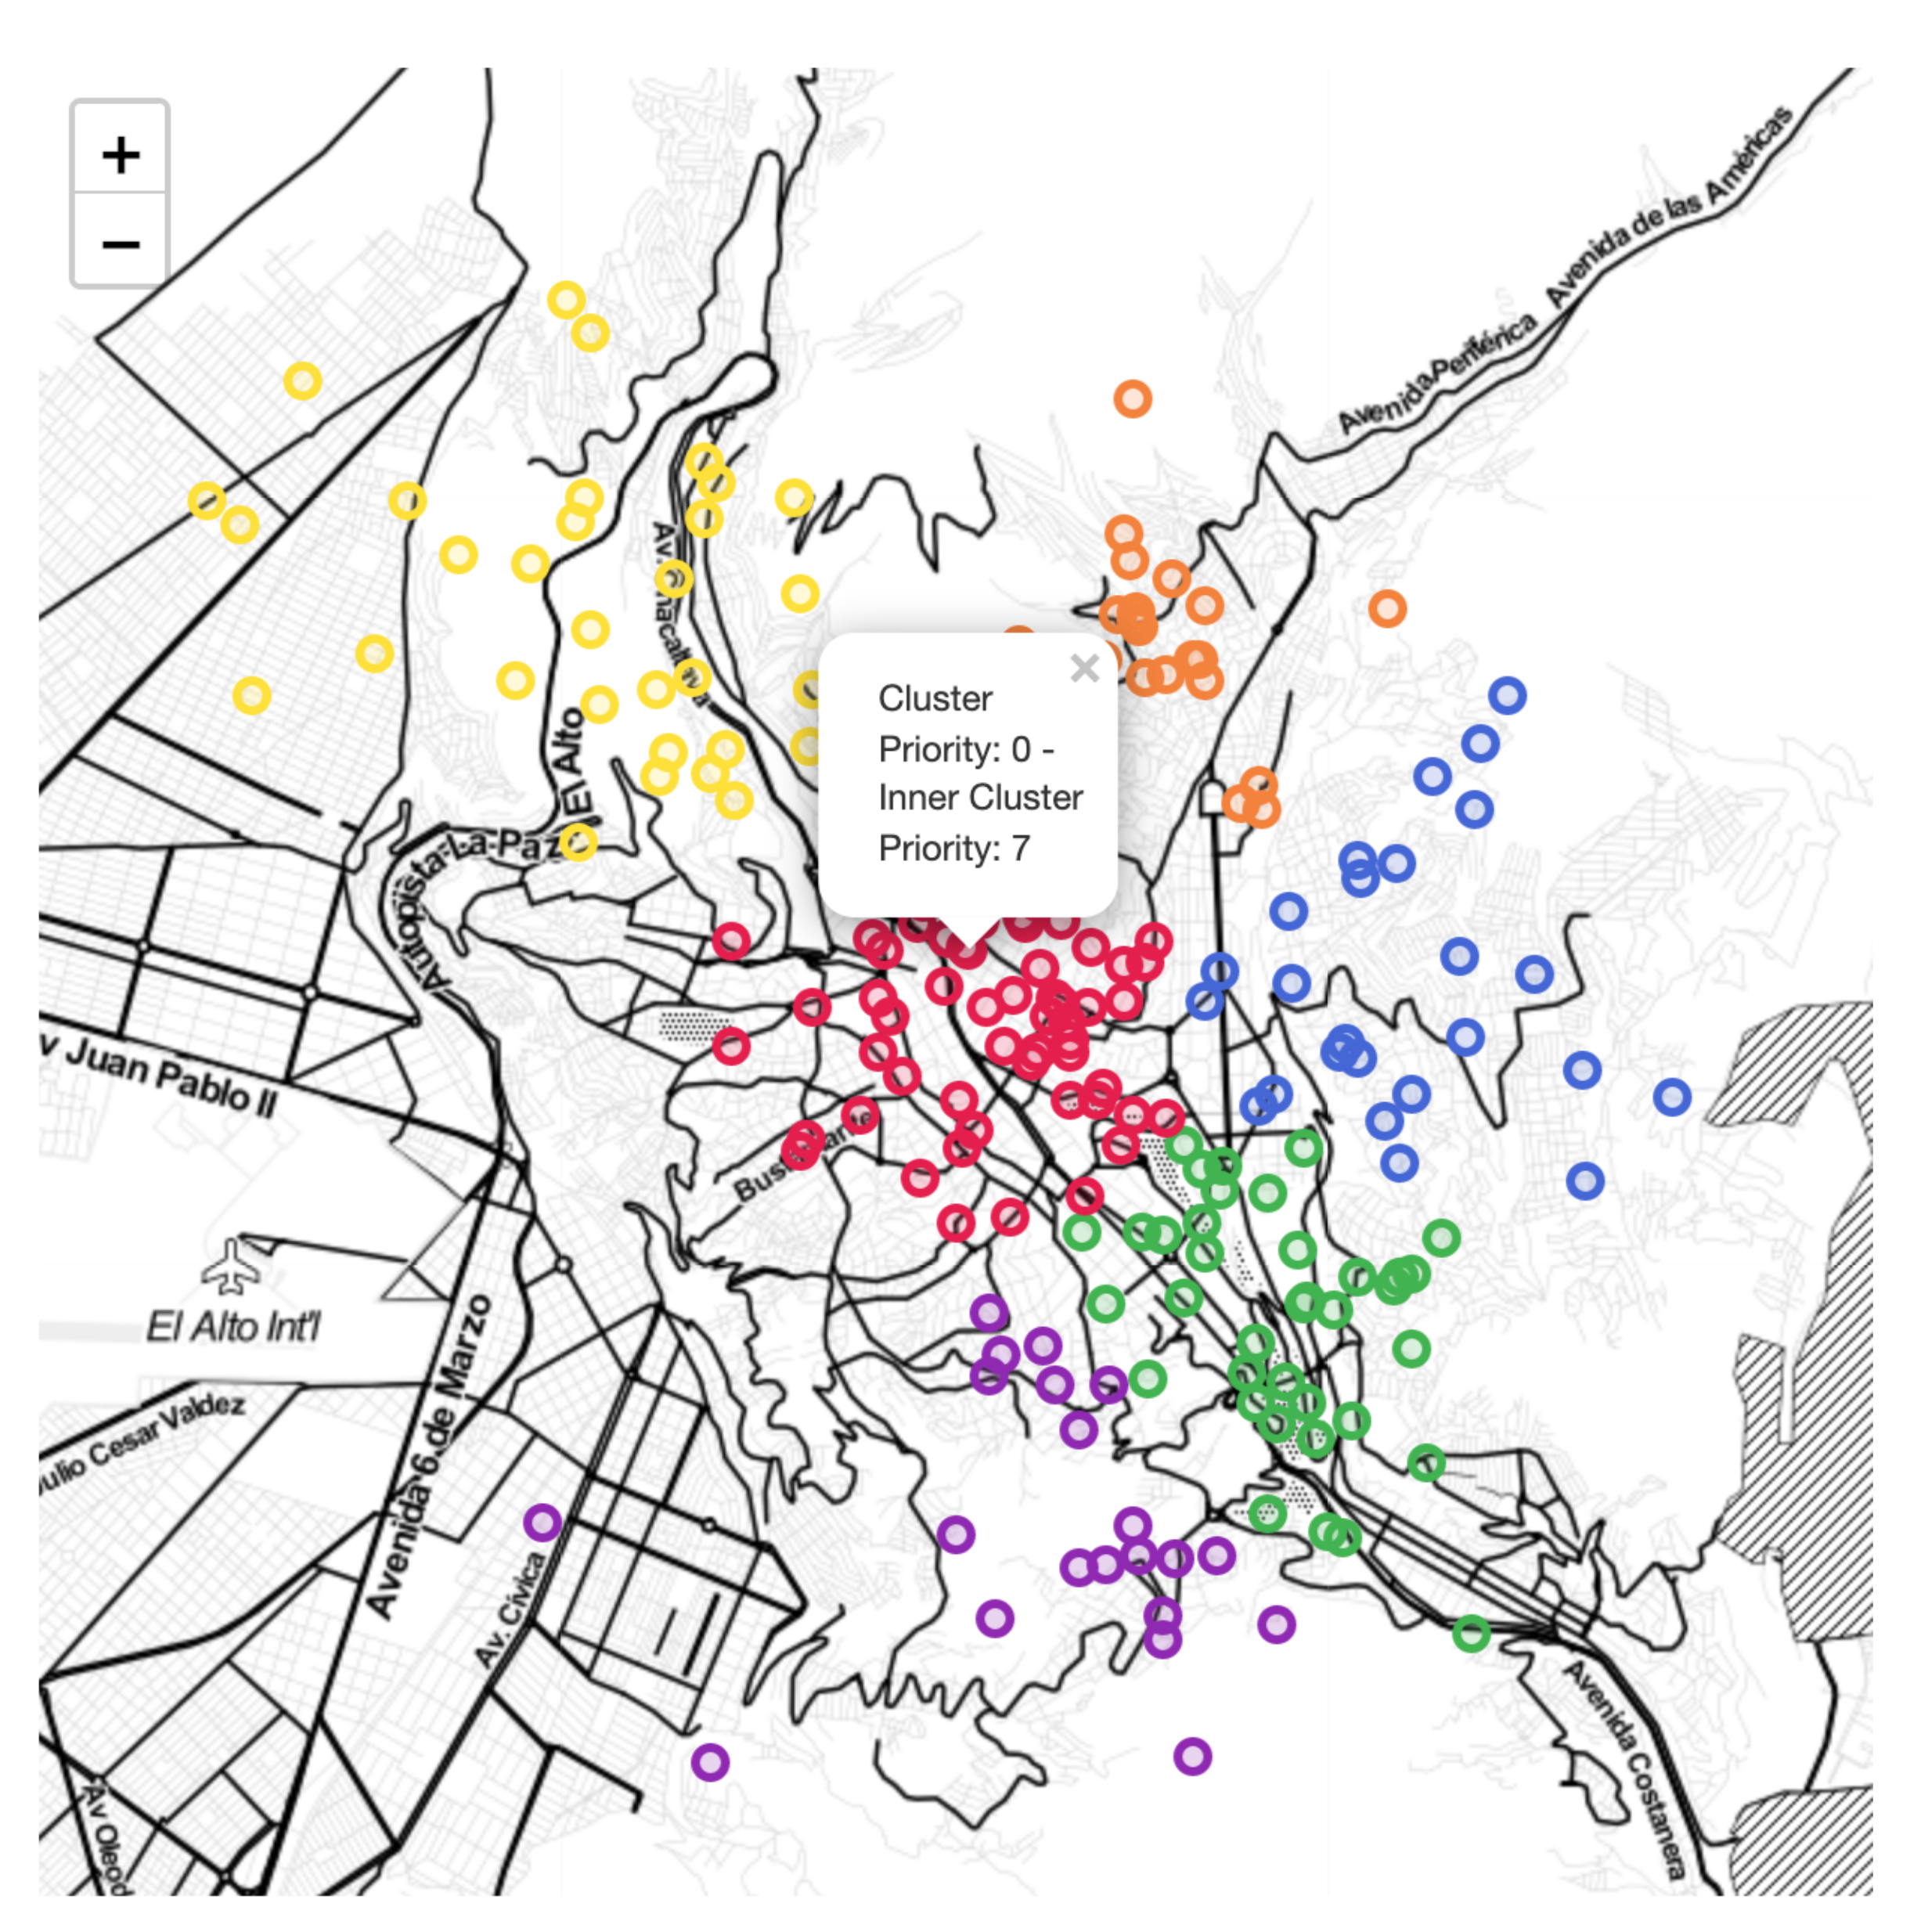
Different from the optimisation strategies, clustering approaches can be applied to real scenarios when available data is unstructured or when the optimisation search space becomes high dimensional. Road damage clusters can provide meaningful information about the similitude among their samples. In the present paper, visual data attached to reports can provide factual information about road damages in an area and can notably help find clustering patterns. The researchers in [44] considered this approach to cluster potholes and road distress sensed by moving vehicles with accelerometers. Given that these sensors can register false positives due to trash or mud, the proposal introduced a clustering algorithm to find true anomalies in multiple records. Even more sophisticated clustering algorithms were applied in [45], where the authors combined georeferenced data on roads and crashes to identify streets that needed urgent, regular, or any maintenance.

3. Materials and Methods

In this section, we first describe the architecture of our framework. Second, we explain the methods and datasets used for the road damage segmentation and detection models. Then, we define our approach to detect duplicated repair requests based on their attached images. Finally, we discuss different aspects of the road damage clustering and prioritisation methods.

3.1. Proposed Architecture

The architecture diagram of the proposed system is illustrated in Figure 2, where the system consists of three main layers:
(A) Data collection: New pothole reports can be created by citizens using a web application, whose architecture and main interface can be seen in Figure 2 and Figure A1, respectively. The web application is accessible from any web browser and communicates with the server to retrieve or save road damage information. Figure 2 also depicts some subfolders and databases where segmentation masks, images, feature descriptors, prioritisation ranks, and reports are saved;
(B) Computer vision analysis: This layer processes images and extracts visual information such as road segments and irregularities. Furthermore, this component is responsible for identifying potential fake or duplicated repair requests based on the road segments;
(C) Prioritisation: This uses clustering techniques to find clusters of repair requests that need urgent maintenance according to the location and damage information found by the previous layer. Inside each cluster, reports are also prioritised according to the number of present road irregularities.
In this paper, we focused on detailing the (B) and (C) components. They are part of our computer vision analysis framework and are shown in Figure 3. Each part of this framework is described in the following sections.

3.2. Road Segmentation

3.2.1. Dataset Description and Preprocessing

The Indian Driving Dataset (IDD), proposed by G. Varma et al. [4], is 25.8 Gb and contains 16,063 colour images in PNG format, where each sample has its respective polygonal annotations in a JSON file. All images contain Indian urban and rural scenes where one can find muddy terrain and few traffic signs and lanes. Such scenarios are typical in developing countries, where models previously trained in well-structured scenarios might probably fail. After applying Exploratory Data Analysis (EDA), we noticed that each annotated polygon belongs to 1 of 41 classes; however, only the “road” polygons were potentially relevant for the present task. Furthermore, EDA let us notice that 96% of the dataset has a 16:9 aspect ratio (1920 × 1080 and 1280 × 720 resolutions) while 4% has variable sizes.
The required preprocessing steps were defined by our findings with EDA and by what we would require to correctly fit the data into a deep learning model. Thus, we initially converted polygon annotations to segmentation masks considering all 41 classes and then discarded all pixels labelled different from “road”. Since 96% of the dataset had a 16:9 ratio, we started augmenting the dataset by splitting the images into two, flipping one side, and resizing them as 394 × 394 images. To avoid the risk of overfitting, several data augmentation techniques that were based on special weather conditions were applied. For instance, we applied sudden brightening or darkening, shadows, raining, fog, gravel, and sun flares. The semantic segmentation task required applying all preprocessing methods in parallel to both images and masks. In the end, the augmented version of the dataset contained 40,000 images with their corresponding segmentation masks. Three resulting samples are shown in Figure 1.

3.2.2. UNet Architecture and Training

We considered road segmentation methods offering high precision at inference time, even if they involved longer computation times. This approach was motivated by the fact that reports sent by citizens do not require an immediate response. We implemented the UNet architecture, proposed by Ronneberg et al. in 2015 [46]. UNet first captures high- and low-level visual features in the original image by applying sequentially multiple convolution, pooling, and downsampling steps. This stage is known as the encoder and outputs low-dimensional feature maps. UNet then proceeds by sequentially upsampling via deconvolutions the low-dimensional feature map produced by the encoder, until a label image is produced. This stage is known as the decoder, and the produced label image contains the predicted label for each pixel in the input image. The reasons for choosing UNet are as follows: (i) compared to other architectures, UNet has demonstrated an excellent performance in image segmentation by better restoring the initial visual information through its encoder–decoder mechanism; (ii) UNet has proven to achieve good results with small datasets, so the initial 40,000 images would be a good starting point before collecting more images from citizen reports.
Rather than only training from scratch, we also propose to use a Resnet34 network as the encoder and our base UNet implementation as the decoder. This practice is known as fine-tuning and can help a model recognise basic shapes faster in its initial layers, as well as complex features in its final layers. Resnet34 is a 34-layer deep convolutional neural network that is known for overcoming the vanishing gradient problem [47]. Currently, most deep learning frameworks provide a version of Resnet34 pretrained with the well-known ImageNet dataset. Leveraging a pretrained version of Resnet34 helped us reach good metrics faster than the previous UNet implementation. The layers, resolution, and channels of the final architecture are illustrated in Figure 4. Previous proposals based on the IDD considered the problem of classifying pixels with all 41 classes. In contrast, our method considers the problem of classifying a pixel as road or background. Therefore, comparing other methods trained on the IDD with our proposal is not appropriate as their purposes were different.
To optimise the model, we used the BCEWithLogitsLoss function provided by PyTorch to achieve greater numerical stability. This loss function extends the binary cross entropy loss function by applying additional sigmoid activations f to the output vectors coming from the decoder. In general, binary cross entropy has the purpose of quantifying the probability that each data point belongs to each class in a binary classification task. A mathematical representation of BCEWithLogitsLoss is shown in Equation (1), where y i and y i ^ represent a ground truth binary classification vector and a predicted binary classification vector, respectively. Moreover, T is the number of data points, and the sigmoid activation function f is shown in Equation (2).
B C E = 1 T i = 0 T y i · l o g ( f ( y i ^ ) ) + ( 1 y i ) · l o g ( 1 f ( y i ^ ) )
f ( s i ) = 1 1 + e s i
The output of the UNet implementation is a tensor of dimensions N × M × X × Y, where N is the input image batch size, M is the number of pixel classes, X is the image width, and Y is the height. We computed the similarity between the predicted mask and the ground truth mask using the intersection over union metric, also known as the Jaccard index [5], commonly defined as:
I o U = | G P | | G P |
where G is the ground truth segmentation mask and P is the predicted segmentation mask. Finally, we used the Adam optimiser combined with schedulers such as ReduceLROnPlateau and ChainedScheduler to optimise the learning rate dynamically.

3.3. Road Damage Detection and Classification

3.3.1. Dataset Description and Preprocessing

Road damage detection requires further analysis because there are more types of road irregularities than only potholes. According to the U.S. Department of Transportation, a road irregularity can be classified into fatigue cracking, block cracking, edge cracking, longitudinal cracking, reflection cracking, and transverse cracking [48]. On the other hand, the Japanese government classifies road damages into longitudinal cracks (D00, D01), lateral cracks (D10, D11), alligator cracks (D20), and other damages (D40, D43, D44), which are further explained in Table 2. In general, road damage classification might differ from country to country and from local authorities to general authorities. For this paper, we used the RDD [5] to build a road damage detection model because it is the largest dataset with road damage images collected in Japan, India, and the Czech Republic. Furthermore, we used the Japanese category system because RDD is based on it. However, we combined longitudinal cracks with lateral cracks and defined three main categories for the project: single cracks (D00, D10), crocodile cracks (D20), and potholes (D40). This approach was motivated by the fact that repair request images sent by citizens may be captured from different perspectives, and lateral and longitudinal cracks are very similar if they change their orientation. The final classes also depict how roads start deteriorating with separate cracks, progressing to form crocodile patterns with multiple criss-crossed cracks, and continuing with small to big potholes on roads.
Another important reason to use RDD is because it was fully collected using middle-range smartphones. These devices are commonly used by citizens, so new images sent by them would be similar to the ones used to build the road damage detection model. The initial EDA process let us identify and quantify all damage types, which are shown in Table 2. Later, we found that the new object distribution was imbalanced with the merging of D00 and D10 and the definition of the new target categories: single cracks (11,038), crocodile cracks (8381), and potholes (5627). A model trained with such an imbalanced dataset would perform well with only some types of damages; consequently, it was important to balance all categories first.
In 2018, Angulo et al. [49], concerned by the present category imbalance in a previous version of the RDD dataset, proposed to include 2979, 1042, 1036, and 1609 instances collected in Mexico for the D00, D10, D20, and D40 categories, respectively. The dataset collected by the authors, named RSDD, is available online and was used for the current project. Our EDA process let us find many flaws in its annotations, so we labelled it manually again with the Roboflow annotation tool for better performance. In addition, we also included the Roboflow Pothole Dataset (RPD) available at Roboflow.com [50] with 1740 pothole instances.
After combining the three datasets, namely RDD, RSDD, and RPD, we augmented the dataset by implementing a series of random geometrical and quality distortions: flipping, warping, blurring, and zooming, so that each category consisted of 20,000 instances now. Moreover, an additional segmented version of the augmented dataset was generated by passing all images through the Resnet34+UNet model, as detailed in Section 3.2. Table 4 shows the number of instances in the original RDD, the combined version, the augmented dataset, and the segmented one. The total number of images in the augmented and segmented dataset was 26,120.

3.3.2. Model Selection and Training

Our approach to implement, train, and evaluate state-of-the-art object detection models was different than the semantic segmentation task because some of the best performing models are available from deep learning libraries such as TensorFlow 2 [51] or YOLO [52]. These deep learning frameworks mainly require the use of command-line interfaces to train and evaluate a model, which means that they mainly need the data in a specific format (COCO or VOC), as well as some hyperparameters to start training. Based on the stated performance of the listed models with regards to the COCO dataset [51,52], the YOLO5 and EfficientDet models outperform the others; hence, they were selected in this project. It follows that each of these models, with different hyper-parameters, is trained for 10 to 15 epochs. We discarded the low-performing models before moving to the next step.
We downloaded pretrained versions of YOLOv5 and EfficientDet from the Ultralytics official repository [52] and the TensorFlow 2 Object Detection Zoo Model [51], respectively. In the case of YOLOv5, this is available in four versions for its reuse with a custom dataset: YOLOv5s, YOLOv5m, YOLOv5l, and YOLOv5x. These versions are ordered by the number of parameters and model footprint with YOLOv5s as the lightest and YOLOv5x as the heaviest. Since the classification problem at hand does not require an immediate response, the selection criteria were governed by the best accuracy as opposed to the fastest response. As such, the YOLO51 and YOLO5x versions were used in this project. In contrast, EfficientDet comes in eight versions that range from EfficientDet D0 to EfficientDet D7. For this project, EfficientDet D1 was sufficient to outperform the state-of-the-art models available on the TensorFlow 2 Object Detection Zoo Model repository [51], e.g., models based on the ResNet architecture or SSD architectures. We evaluated each model considering their Average Precision (AP) per class, which can be calculated by finding the area under the precision–recall curve [53]:
A P = 0 1 p ( r ) d r .
where p is the proportion of true positives (precision) and r is the proportion of true positives out of the possible positives (recall). Both variables are always between 0 and 1. Therefore, the average precision per class falls within 0 and 1 as well.

3.4. Fake and Duplicate Report Detection

The number of road damage reports sent by citizens may increase considerably in a day due to the wide access to mobile devices and the Internet. Although a great number of reports are expected to be sent by citizens who want prompt maintenance of their streets, it is unavoidable that several reports could be fake or duplicated. In the current project, a report is considered fake if it does not contain road segments detected by the road segmentation model. This discrimination between fake and real repair request images is defined by the percentage of road pixels in the image and a road segment threshold, usually set as 3%. On the other hand, a report is considered duplicated if the same road damage or damages were already reported by the same or different citizen. To detect duplicate reports, we propose an approach based on content-based image retrieval systems, where an image is represented by a feature vocabulary that consists of low-level image features. These feature vocabularies are obtained with local feature extractors such as Scale-Invariant Feature Transform (SIFT) [54], Speeded Up Robust Features (SURF) [55], and Oriented Fast and Rotated Brief (ORB) [56] and can be compared with feature matching algorithms such as Brute Force Matcher (BFM) or the Fast Library for Approximate Nearest Neighbours (FLANN) [57]. Once an image is recognised as fake or duplicated, it is labelled as such and presented in the web interface for further scrutiny by the road maintenance authorities.
Our experiments let us find SIFT descriptors as the best visual features to retrieve duplicate images. SIFT was proposed by Lowe D. in [54] to create visual descriptors that represent the main local features in an image, also known as image keypoints. This method comprises five steps: space scale creation, keypoint localisation, keypoint selection, orientation assignment, and histogram of gradients. The first step comprises a series of Difference of Gaussians (DoG) applications to Gaussian-blurred versions of an image at different scales, which ensures that the features are scale independent. Secondly, each pixel neighbourhood in the resulting images from applying DoG is evaluated keeping the maxima and the minima as potential keypoints. Third, Taylor series is applied to remove those keypoints that had low contrast or were poorly localised along an edge. The following step calculates the magnitude and orientation of each pixel in the raw image and creates a weighted direction histogram in the neighbourhood of each keypoint. Consequently, the longest orientation in the histogram is assigned to the keypoint so that it became consistent with the image rotation. Finally, the neighbouring pixels, their orientations, and their magnitude are used to generate a unique fingerprint for each keypoint. All generated fingerprints of an image become a SIFT descriptor, and they are invariant to contrast, scale, and rotation.
Feature descriptors generated by SIFT are usually compared using the Euclidean distance or other histogram-based metrics. In this paper, although we experimented with BFM and FLANN algorithms, we ended up finding FLANN as the best method to compare the similarity and distance between the descriptors of two images. The accuracy of FLANN is determined by the quality of the extracted features. Our experimental process let us find many false positive matching features in street images due to the presence of people, cars, and buildings. Therefore, we defined segmenting all road sections first with a semantic segmentation model. Figure 5 displays an example of duplicate image retrieval from the segmented dataset, which was augmented and found two similar instances in the figure. All extracted features were saved in text files so that they could be rapidly consulted in the next search for duplicate images.

3.5. Prioritisation

The final part of this investigation was oriented toward categorising the importance of reports sent by citizens. As road maintenance departments plan their work according to streets or areas that require urgent maintenance, the proposed approach creates clusters of reports based on their geolocation. This unsupervised clustering is performed by the k-means algorithm, which aims to split all samples into k clusters that minimise the intra-cluster sample scatter, i.e., the dispersion of samples around the centre of the cluster [58]. Even though k-means is a popular clustering method, it has some major issues such as the initial specification of the number of clusters and their high sensitivity to outliers.
In order to deal with outliers, we identified all outliers first by performing thresholding against the highest and lowest quantiles of the latitudes and longitudes. After performing clustering with k-means, outliers were classified with the supervised learning algorithm K-Nearest Neighbour (k-NN) [59]. As its name suggest, this method classifies new instances according to their closeness to the pre-categorised samples. Then, in order to select the number of clusters K automatically, we performed a series of k-means runs with different k number of clusters, and we calculated the silhouette score per each run. This score, which is defined in Equation (5) [53], evaluates the quality of clusters created by calculating the average similarity among the instances inside every cluster a and the average difference among all clusters b. Furthermore, it ranges from −1 to 1, meaning wrongly assigned clusters and well-distinguished clusters, respectively.
S i l h o u e t t e S c o r e = ( b a ) m a x ( a , b )
Finally, we assigned priorities to all clusters according to the weighted sum of damages recognised in their reports. This weighting is defined as:
P r i o r i t y = n p w p + m c w c + o s w s
where n p , m c , and o s are the number of potholes, cracks in crocodile shapes, and single cracks, respectively. We usually set w p with higher values (e.g., 0.6) than w c and w s (e.g., 0.3 and 0.1, respectively). Once this weighting was calculated, we proceeded to sort all clusters according to their priorities, and we also ordered all reports inside each cluster to attend urgent areas first. A sample of this clustering approach can be seen in Figure 6, where the central pop up is shown after selecting a repair request. This contains the cluster priority and the repair request priority with respect to the other requests in the cluster. In both cases, the smaller the number, the higher the priority is.

4. Experimental Results

4.1. Road Segmentation

The model implementation, training, and testing were all completed with PyTorch 1.0.2, whose torchvision module provided a pretrained version of Resnet34. Before the training stage, the dataset was split into a training set (70%), a validation set (20%), and a test set (10%). While the training and testing subsets were used in the training and testing stages separately, the validation set was used after each training epoch to evaluate the model learning continually. Google Colab enabled us to implement the model and the processing pipeline, as well as the training, validating, and testing functions. All data processing and storage were carried out remotely by mounting Google Drive on Google Colab. This platform also let us use the NVIDIA Tesla K80 GPU with 12 Gb of memory to train the models. Each image and segmentation mask had a 394 × 394 resolution for all learning stages. Consequently, new images for inference would require regularisation first to fit these dimensions. Finally, we optimised the training and validation process by implementing MLFlow to log the partial results into the Neptune web platform.
We performed parallel experiments varying some variables to find that 30 epochs, a batch size of 32, a learning rate of 0.0003, and the Adam optimiser were the best hyperparameters for the UNet and Resnet34+UNet models. The best-performing models are shown in Table 5, for which Resnet34+UNet achieved a 0.90 IoU for the augmented dataset. Furthermore, the experimentation process enabled us to discover that the model was obtaining better results with colour images and image dimensions of 394 × 394 pixels. Furthermore, Neptune showed us visually that the training process was struggling to enhance the performance after the 30th epoch. Figure 7 displays some examples of the semantic segmentation results using the test subset. Note the unstructured nature of the second example where the street is not delimited and does not have lanes. Although the segmentation mask prediction failed to predict some pixels of this sample, the model recognised the road segment acceptably. In the project, predicted road segments did not have to be perfect, but needed to differentiate between roads and the rest of the elements present in a street. Then, that condition was met for the second sample in Figure 7. Furthermore, this example of an unstructured environment is common in developing countries and entails challenges for models trained with images of structured urban environments.
Finally, we evaluated the ResNet43+UNet model using the KITTI road benchmark [60]. This is a subset of the KITTI dataset [32] to evaluate road segmentation models and considers three categories: Urban Unmarked (UU), Urban Marked (UM), and Urban Multiple Marked (UMM) roads. Similar to IDD [4], we normalised the KITTI road benchmark dataset and converted its dimensions to 394 × 394 px images, so the number of labelled samples grew from 289 to 867. The average precision and maximum F1-score were calculated with the test subset and are included in Table 6, achieving 0.91 and 0.93, respectively. Even though these results did not overpass the results of the state-of-the-art models [61,62], they are promising because our model was trained with an augmented dataset that contains more complex data than KITTI. For instance, our model can segment road sections despite the weather conditions, which was described in Section 3.2.1. The unstructured nature of the IDD gives our model better chances to deal with unseen unstructured and complex street environments where roads are not delineated.

4.2. Road Damage Detection and Classification

YOLOv5l, YOLOv5x, and EfficientDet D1 achieved compelling results with 100 epochs and a batch size of 16. Their AP per class can be seen in Table 7. Furthermore, Figure 8 shows the confusion matrix for the best-performing model YOLOv5l, which reports that any misclassified area inside an image is considered a false negative, namely a background FN. The results showed that the task was performed well in comparison with initial training iterations where the AP per class did not overpass 0.50 in many cases. Based on the results, 0.61 and 0.53 for single and crocodile cracks, respectively, we note that the road damage detection classification and localisation task is indeed challenging because single cracks are very similar to cracks in crocodile patterns. As a consequence, potholes were the best identified objects since they can be easily differentiated from the other two classes. Although the models would have achieved better metrics with the original dataset proposed by Maeda et al. [5], the preprocessing and augmentation steps improved the generalisation. Even though we expected YOLOv5x to achieve better results, the model started overfitting from the 50th epoch because of its longer architecture.
In Figure 9, we show some inference examples of the test subset processed by the best model, namely YOLOv5l. This clearly shows that road irregularities were correctly localised and classified. Furthermore, a comparison of the training loss curves using YOLOv5l, the augmented dataset, and the base RDD is shown in Figure 10. Despite the increase in road damage cases, this plot depicts a clear improvement in the model’s generalisation when using the augmented dataset. Furthermore, the plot shows that the learning rate decreased after the first sixty epochs.
Given that the segmented dataset had the same annotations as the augmented version, we also tried to train YOLOv5l with it, but the results were not successful. In that experiment, the model reached an AP lower than 0.30 for all categories. This was performed with the goal of creating an attention mechanism for road damage detection. Attention, in human visual perception, can be described as the way humans focus on important sections in a scene instead of focusing on everything at the same time. In the road damage detection context, it made sense to only focus on road sections instead of the complete street scene. The bad results were probably caused by the different properties of the RDD and IDD datasets. However, this approach remains as an open research thread for road damage detection based on deep learning models.
Finally, we performed a comparative assessment to evaluate whether our best model achieved compelling results against other state-of-the-art models. The outcome of this analytical exercise is summarised in Table 3. We can assert that the data augmentation and preprocessing methods to improve the original dataset were effective because our model obtained a 0.62 F1-score in the test subset, which positions it among the best models for the RDD. In addition, we must highlight that our model can deal with more complex cases because we joined two additional big datasets [49,50] in order to minimise the existent problems in the RDD dataset. For instance, RDD is unbalanced and has less samples with potholes, whereas they are more common in developing countries. Thus, our model is more suitable for unstructured street environments than the other models listed in Table 3. Note that the D00 and D10 classes were combined for our model because they are similar in shape and only vary in their direction. Since our proposed system is meant to process any image sent by citizens, the direction and perspective of depicted road issues might vary, and the system should deal with this variance. In contrast, the RDD dataset uniquely considers images captured from the front window of a vehicle. Consequently, our model is more invariant to rotation and viewpoint changes.

4.3. Duplicate Detection

This section provides the details about the evaluation approach to find the best combination of the feature extraction and feature matching algorithms. We made use of the segmented dataset, described in Table 4, to find coincidences in road segments. To perform an experiment, we tested and examined ten times the possible duplicate images retrieved in response to a query image. All query images were compared with 5000 randomly selected images based on their features. For feature extraction, we initially tested the SIFT, SURF, and ORB methods. Furthermore, comparisons were performed with the BFM and FLANN feature matchers to find coincidences between the extracted keypoints from two images.
Since extracting features might require long times for a big number of samples, we saved all feature descriptors in text files, so that they would be loaded when trying to find matches between two road segments. Two parameters affected the experiments significantly: the number of feature vectors found by the feature extraction algorithm and the threshold number of good matches. Each set of runs for an experiment resulted in a sum of the number relevant retrieved images and the total number of retrieved images, which were used to calculate the precision defined as:
P r e c i s i o n = N u m b e r o f r e l e v a n t i m a g e s r e t r i e v e d T o t a l n u m b e r o f i m a g e s r e t r i e v e d
The initial experiments combining SIFT, SURF, BFM, and FLANN guided us to try further with SIFT and FLANN. Therefore, we focused on varying the matching threshold and the vocabulary size parameters for retrieving potential duplicates in 10 runs. The precision results can be seen in Table 8. The best mean average precision was obtained using the algorithms with a descriptor size of 90 keypoints and a threshold of 20. Finally, a query example using the method can be seen in Figure 5.

5. Conclusions

In this paper, we proposed deep-learning and computer-vision-based methods for an automatic road damage detection and prioritisation system. The approach aimed to leverage pictures sent by citizens that report road damage cases, namely crowdsourcing, and want them fixed as soon as possible. The final output of the system is a map with information about what clusters of reported cases have high and low priority. Furthermore, the approach is aligned to work in developing countries where road conditions vary and more irregularities are present, previously defined as unstructured urban environments. With this idea, we aimed at finding and processing large datasets collected in countries where unstructured urban environments are common such as the Czech Republic, India, and Mexico (IDD [4] and RDD [5]). Moreover, we applied several data processing strategies to balance and augment the datasets, which in turn let us obtain a better generalisation of our models.
To begin with, UNet—a widely used deep CNN architecture for semantic segmentation —was able to detect road areas in images. Then, the initial implementation of UNet was combined with a pretrained instance of the Resnet34 architecture as its encoder and yielded better results. The model achieved a 0.91 average precision with the benchmark dataset proposed in [60], showing its high accuracy to extract road segments from images. Those segments were used to label repair request images without road sections as “fake” for further evaluation by road maintenance authorities. Furthermore, road segments helped identify potentially duplicated reports that could add noise to the prioritisation process. We explored three feature extractors (ORB, SIFT, and SURF) and two feature matching algorithms (BFM and FLANN) that let us query a big archive of 5000 randomly selected images to find potential duplicates. Our results showed that we could achieve high accuracy by combining SIFT and FLANN with a threshold of 20 best keypoints and a vocabulary size of 90 feature vectors.
After filtering fake and duplicate images, we conducted a series of experiments with the YOLOv5 and EfficientDet architectures to find the most accurate road damage detector for the RDD [5]. Following the processing of the RDD, we extended it by including other big image datasets with road damage issues [49,50]. The results demonstrated that YOLOv5l was the best road damage detector model for our joint dataset and our proposed types of road damage: single cracks, crocodile cracks, and potholes. Consequently, we compared our best model with various state-of-the-art models proposed for the RDD dataset, from which we can conclude that our model was among the best recent models as described in Table 3. This classification benefits the system because citizens could report any road damage as a pothole without considering the different severities of road damages. Thus, a road damage detection and classification model helps provide the correct input for the prioritisation approach.
Finally, we proposed to use an unsupervised method (k-means) to cluster crowdsourced images by their geolocation, so that zones with multiple reported issues in urban areas can be easily distinguished. Outliers were separated first and classified later with k-NN to avoid adding noise to the clustering process. Then, the importance of all clusters was assigned based on single cracks, crocodile cracks, and potholes. Reports inside a cluster were also prioritised to guide the work of a maintenance team in situ. Given that the clustering experiments were based on synthetic data, future work for the clustering approach should also consider external data sources such as financial budget, traffic density, and the number of historic accidents per street.
As a continuation of this research, we plan to extend the prioritisation framework by including variables such as traffic density, importance, and approximate time needed to maintain per street. In addition, we intend to enhance the models’ accuracy by including newer sample images. Enhancing the approach could let us realise a more accurate decision-making tool for road maintenance authorities. Furthermore, complementing the current solution with a mobile light-weight road damage detector deployed at the edge would increase the sources for data collection.

Author Contributions

Conceptualisation, E.S., M.J. and J.R.C.; data curation, E.S.; formal analysis, E.S., M.J. and J.R.C.; investigation, E.S.; methodology, E.S.; resources, E.S.; software, E.S.; supervision, M.J. and J.R.C.; validation, E.S.; visualisation, E.S.; writing—original draft, E.S.; writing—review and editing, M.J. and J.R.C. All authors have read and agreed to the published version of the manuscript.

Funding

This research received no external funding.

Data Availability Statement

We used three dataset for road segmentation and road damage detection: IDD, RDD, RSDD, and Roboflow Pothole Dataset. The IDD is available at https://idd.insaan.iiit.ac.in/ (accessed on 4 July 2021). The RDD is available at https://data.mendeley.com/datasets/5ty2wb6gvg/1 (accessed on 14 September 2021). The RSDD is available at https://ieee-dataport.org/documents/road-surface-damages (accessed on 21 September 2021). We ended up re-labelling this dataset due to multiple annotation flaws. The new version is publicly available at https://app.roboflow.com/rdd/rsdd/overview with a previous login. The Roboflow Pothole Dataset is available at https://public.roboflow.com/object-detection/pothole (accessed on 22 September 2021).

Conflicts of Interest

The authors declare no conflict of interest.

Appendix A

Figure A1. Main interface of the web application.
Jsan 11 00015 g0a1

References

  1. 2015 Pedestrians Lost Their Lives Due to Potholes in 2018. Available online: https://www.business-standard.com/article/current-affairs/2-015-pedestrians-lost-their-lives-due-to-potholes-in-2018-govt-119120200747_1.html (accessed on 4 December 2021).
  2. Pavement Inspection Guidelines. 2016. Available online: https://openjicareport.jica.go.jp/pdf/12286001_01.pdf (accessed on 4 December 2021).
  3. Request for Pothole Repair in Argentina. 2019. Available online: https://ciudaddecorrientes.gov.ar/tramites/obras-publicas/solicitud-de-arreglo-de-bache (accessed on 3 August 2021).
  4. Varma, G.; Subramanian, A.; Namboodiri, A.; Chandraker, M.; Jawahar, C. IDD: A Dataset for Exploring Problems of Autonomous Navigation in Unconstrained Environments. In Proceedings of the 2019 IEEE Winter Conference on Applications of Computer Vision (WACV), Waikoloa, HI, USA, 8–10 January 2019; pp. 1743–1751. [Google Scholar] [CrossRef] [Green Version]
  5. Arya, D.; Maeda, H.; Ghosh, S.; Toshniwal, D.; Sekimoto, Y. RDD2020: An annotated image dataset for automatic road damage detection using deep learning. Data Brief 2021, 36, 107133. [Google Scholar] [CrossRef] [PubMed]
  6. Tsai, Y.; Chatterjee, A. Pothole Detection and Classification Using 3D Technology and Watershed Method. J. Comput. Civ. Eng. 2018, 32, 04017078. [Google Scholar] [CrossRef]
  7. Dhiman, A.; Klette, R. Pothole Detection Using Computer Vision and Learning. IEEE Trans. Intell. Transp. Syst. 2020, 21, 3536–3550. [Google Scholar] [CrossRef]
  8. Ryu, S.; Kim, T.; Kim, Y. Image-Based Pothole Detection System for ITS Service and Road Management System. Math. Probl. Eng. 2015, 2015, 968361. [Google Scholar] [CrossRef] [Green Version]
  9. Fan, R.; Bocus, M.; Yilong, Z.; Jianhao, J.; Wang, L.; Ma, F.; Cheng, S.; Liu, M. Road Crack Detection Using Deep Convolutional Neural Network and Adaptive Thresholding. In Proceedings of the 2019 IEEE Intelligent Vehicles Symposium (IV), Paris, France, 9–12 June 2019; Available online: https://arxiv.org/abs/1904.08582 (accessed on 1 October 2021).
  10. Yebes, J.; Montero, D.; Arriola, I. Learning to Automatically Catch Potholes in Worldwide Road Scene Images. IEEE Intell. Transp. Syst. Mag. 2021, 13, 192–205. [Google Scholar] [CrossRef]
  11. Yik, Y.; Alias, N.; Yusof, Y.; Isaak, S. A Real-time Pothole Detection Based on Deep Learning Approach. J. Phys. Conf. Ser. 2021, 1828, 012001. [Google Scholar] [CrossRef]
  12. Akagic, A.; Buza, E.; Omanovic, S.; Karabegovic, A. Pavement crack detection using Otsu thresholding for image segmentation. In Proceedings of the 2018 41st International Convention on Information and Communication Technology, Electronics and Microelectronics (MIPRO ’18), Opatija, Croatia, 21–25 May 2018. [Google Scholar] [CrossRef]
  13. Chung, T.; Khan, M. Watershed-based Real-time Image Processing for Multi-Potholes Detection on Asphalt Road. In Proceedings of the 2019 IEEE 9th International Conference on System Engineering and Technology (ICSET ’19), Jakarta, Indonesia, 23 November 2019; pp. 268–272. [Google Scholar] [CrossRef]
  14. Silva, L.; Sanchez San Blas, H.; Peral García, D.; Sales Mendes, A.; Villarubia González, G. An Architectural Multi-Agent System for a Pavement Monitoring System with Pothole Recognition in UAV Images. Sensors 2020, 20, 6205. [Google Scholar] [CrossRef]
  15. Anggoro, W.; Nasution, A.; Rosohadi, I. Design of pothole detection system based on digital image correlation using Kinect sensor. In Proceedings of the Third International Seminar on Photonics, Optics, and Its Applications (ISPhOA 2018), Java, Indonesia, 1 August 2018; p. 1104409. [Google Scholar] [CrossRef]
  16. Becerik-Gerber, B.; Masri, S.; Jahanshahi, M. An Inexpensive Vision-Based Approach for the Autonomous Detection, Localization, and Quantification of Pavement Defects. 2015. Available online: https://www.trb.org/Main/Blurbs/173687.aspx (accessed on 1 July 2021).
  17. Kang, B.; Choi, S. Pothole detection system using 2D LiDAR and camera. In Proceedings of the 2017 Ninth International Conference on Ubiquitous and Future Networks (ICUFN), Milan, Italy, 4–7 July 2017; pp. 744–746. [Google Scholar] [CrossRef]
  18. Ahmed, A.; Ashfaque, M.; Ulhaq, M.; Mathavan, S.; Kamal, K.; Rahman, M. Pothole 3D Reconstruction With a Novel Imaging System and Structure From Motion Techniques. IEEE Trans. Intell. Transp. Syst. 2021, 1–10. [Google Scholar] [CrossRef]
  19. Zhang, Z.; Ai, X.; Chan, C.; Dahnoun, N. An efficient algorithm for pothole detection using stereo vision. In Proceedings of the 2014 IEEE International Conference on Acoustics, Speech and Signal Processing (ICASSP ’14), Florence, Italy, 4–9 May 2014; pp. 564–568. [Google Scholar] [CrossRef]
  20. Fan, R.; Liu, M. Road Damage Detection Based on Unsupervised Disparity Map Segmentation. IEEE Trans. Intell. Transp. Syst. 2020, 21, 4906–4911. [Google Scholar] [CrossRef]
  21. Fan, R.; Ozgunalp, U.; Hosking, B.; Liu, M.; Pitas, I. Pothole Detection Based on Disparity Transformation and Road Surface Modeling. IEEE Trans. Image Process. 2020, 29, 897–908. [Google Scholar] [CrossRef] [Green Version]
  22. Fan, R.; Ai, X.; Dahnoun, N. Road Surface 3D Reconstruction Based on Dense Subpixel Disparity Map Estimation. IEEE Trans. Image Process. 2018, 27, 3025–3035. [Google Scholar] [CrossRef] [Green Version]
  23. Li, Y.; Papachristou, C.; Weyer, D. Road Pothole Detection System Based on Stereo Vision. In Proceedings of the IEEE National Aerospace and Electronics Conference 2018 (NAECON ’18), Dayton, OH, USA, 23–26 July 2018; pp. 292–297. [Google Scholar] [CrossRef] [Green Version]
  24. Bangalore Ramaiah, N.; Kundu, S. Stereo Vision Based Pothole Detection System for Improved Ride Quality. SAE Int. J. Adv. Curr. Pract. Mobil. 2021, 3, 2603–2610. [Google Scholar] [CrossRef]
  25. Akagic, A.; Buza, E.; Omanovic, S. Pothole detection: An efficient vision based method using RGB color space image segmentation. In Proceedings of the 2017 40th International Convention on Information and Communication Technology, Electronics and Microelectronics (MIPRO ’17), Opatija, Croatia, 22–26 May 2017; pp. 1104–1109. [Google Scholar] [CrossRef]
  26. Bansal, K.; Mittal, K.; Ahuja, G.; Singh, A.; Gill, S. DeepBus: Machine learning based real time pothole detection system for smart transportation using IoT. Internet Technol. Lett. 2020, 3, e156. [Google Scholar] [CrossRef]
  27. Bosi, I.; Ferrera, E.; Brevi, D.; Pastrone, C. In-Vehicle IoT Platform Enabling the Virtual Sensor Concept: A Pothole Detection Use-case for Cooperative Safety. In Proceedings of the 2019 4th International Conference on Internet of Things, Big Data and Security, Heraklion, Crete, Greece, 2–4 May 2019; pp. 232–240. [Google Scholar] [CrossRef]
  28. Ghadge, M.; Pandey, D.; Kalbande, D. Machine learning approach for predicting bumps on road. In Proceedings of the 2015 International Conference on Applied and Theoretical Computing and Communication Technology (iCATccT ’15), Davangere, Karnataka, India, 29–31 October 2015; Volume 1, pp. 481–485. [Google Scholar] [CrossRef]
  29. Wu, C.; Wang, Z.; Hu, S.; Lepine, J.; Na, X.; Ainalis, D.; Stettler, M. An Automated Machine-Learning Approach for Road Pothole Detection Using Smartphone Sensor Data. Sensors 2020, 20, 5564. [Google Scholar] [CrossRef]
  30. Companies Offering Road Monitoring. 2021. Available online: https://roadscanners.com/services/road-asset-management/ (accessed on 3 August 2021).
  31. Guzmán, R.; Hayet, J.-B.; Klette, R. Towards ubiquitous autonomous driving: The CCSAD dataset. In Proceedings of the International Conference in Computer Analysis of Images and Patterns (CAIP 2015), Valletta, Malta, 2–4 September 2015; pp. 582–593. [Google Scholar] [CrossRef]
  32. Geiger, A.; Lenz, P.; Stiller, C.; Urtasun, R. Vision meets robotics: The KITTI dataset. Int. J. Robot. Res. 2013, 32, 1231–1237. [Google Scholar] [CrossRef] [Green Version]
  33. Cordts, M.; Omran, M.; Ramos, S.; Rehfeld, T.; Enzweiler, M.; Benenson, R.; Franke, U.; Roth, S.; Schiele, B. The Cityscapes Dataset for Semantic Urban Scene Understanding. In Proceedings of the 2016 IEEE Conference on Computer Vision and Pattern Recognition (CVPR ’16), Las Vegas, NV, USA, 26 June–1 July 2016. [Google Scholar] [CrossRef] [Green Version]
  34. Maeda, H.; Sekimoto, Y.; Seto, T.; Kashiyama, T.; Omata, H. Road Damage Detection and Classification Using Deep Neural Networks with Smartphone Images. Comput.-Aided Civ. Infrastruct. Eng. 2018, 33, 1127–1141. [Google Scholar] [CrossRef]
  35. Hegde, V.; Trivedi, D.; Alfarrarjeh, A.; Deepak, A.; Ho Kim, S.; Shahabi, C. Yet Another Deep Learning Approach for Road Damage Detection using Ensemble Learning. In Proceedings of the 2020 IEEE International Conference on Big Data, Virtual, 10–13 December 2020; pp. 5553–5558. [Google Scholar] [CrossRef]
  36. Du, Y.; Pan, N.; Xu, Z.; Deng, F.; Shen, Y.; Kang, H. Pavement distress detection and classification based on YOLO network. Int. J. Pavement Eng. 2020, 22, 1659–1672. [Google Scholar] [CrossRef]
  37. Menghini, L.; Bella, F.; Sansonetti, G.; Gagliardi, V. Evaluation of road pavement conditions by Deep Neural Networks (DNN): An experimental application. In Proceedings of the 8th Earth Resources and Environmental Remote Sensing/GIS Applications, Warsaw, Poland, 11–15 September 2020. [Google Scholar] [CrossRef]
  38. Doshi, K.; Yilmaz, Y. Road Damage Detection using Deep Ensemble Learning. In Proceedings of the 2020 IEEE International Conference on Big Data, Virtual, 10–13 December 2020; pp. 5540–5544. [Google Scholar] [CrossRef]
  39. Arya, D.; Maeda, H.; Ghosh, S.; Toshniwal, D.; Mraz, A.; Kashiyama, T.; Sekimoto, Y. Deep learning-based road damage detection and classification for multiple countries. Autom. Constr. 2021, 132, 103935. [Google Scholar] [CrossRef]
  40. Baheti, B.; Innani, S.; Gajre, S.; Talbar, S. Eff-UNet: A Novel Architecture for Semantic Segmentation in Unstructured Environment. In Proceedings of the 2020 IEEE/CVF Conference on Computer Vision and Pattern Recognition Workshops (CVPRW), Virtual, 14–19 June 2020; pp. 1473–1481. [Google Scholar] [CrossRef]
  41. Dekker, R. Applications of maintenance optimization models: A review and analysis. Reliab. Eng. Syst. Saf. 1996, 51, 229–240. [Google Scholar] [CrossRef] [Green Version]
  42. Ma, J.; Cheng, L.; Li, D. Road Maintenance Optimization Model Based on Dynamic Programming in Urban Traffic Network. J. Adv. Transp. 2018, 2018, 4539324. [Google Scholar] [CrossRef]
  43. Ji, A.; Xue, X.; Wang, Y.; Luo, X.; Zhang, M. An integrated multi-objectives optimization approach on modelling pavement maintenance strategies for pavement sustainability. J. Civ. Eng. Manag. 2020, 26, 717–732. [Google Scholar] [CrossRef]
  44. Li, Z.; Filev, D.; Kolmanovsky, I.; Atkins, E.; Lu, J. A New Clustering Algorithm for Processing GPS-Based Road Anomaly Reports With a Mahalanobis Distance. IEEE Trans. Intell. Transp. Syst. 2017, 18, 1980–1988. [Google Scholar] [CrossRef]
  45. Janstrup, K.; Møller, M.; Pilegaard, N. A clustering approach to integrate traffic safety in road maintenance prioritization. Traffic Inj. Prev. 2019, 20, 442–448. [Google Scholar] [CrossRef]
  46. Ronneberger, O.; Fischer, P.; Brox, T. UNet: Convolutional Networks for Biomedical Image Segmentation. In Proceedings of the Medical Image Computing and Computer-Assisted Intervention (MICCAI ’15), Munich, Germany, 5–9 October 2015; Volume 9351. [Google Scholar] [CrossRef] [Green Version]
  47. He, K.; Zhang, X.; Ren, S.; Sun, J. Deep Residual Learning for Image Recognition. In Proceedings of the 2016 IEEE Conference on Computer Vision and Pattern Recognition (CVPR ’16), Las Vegas, NV, USA, 26 June–1 July 2016; pp. 770–778. [Google Scholar] [CrossRef] [Green Version]
  48. U.S. Department of Transportation. Distress Identification Manual for the Long-Term Pavement Performance Program. 2014. Available online: https://www.fhwa.dot.gov/publications/research/infrastructure/pavements/ltpp/13092/13092.pdf (accessed on 25 October 2021).
  49. Angulo, A.; Vega-Fernández, J.; Aguilar-Lobo, L.; Natraj, S.; Ochoa-Ruiz, G. Road Damage Detection Acquisition System Based on Deep Neural Networks for Physical Asset Management. Adv. Soft Comput. 2019, 3–14. [Google Scholar] [CrossRef] [Green Version]
  50. Roboflow, Inc. Pothole Detection Dataset. 2020. Available online: https://public.roboflow.com/object-detection/pothole/ (accessed on 16 September 2021).
  51. TensorFlow 2 Detection Model Zoo. 2021. Available online: https://github.com/tensorflow/models/blob/master/research/object_detection/g3doc/tf2_detection_zoo.md (accessed on 1 July 2021).
  52. YOLOv5. 2021. Available online: https://github.com/ultralytics/yolov5 (accessed on 11 September 2021).
  53. Fathy, Y.; Jaber, M.; Brintrup, A. Learning With Imbalanced Data in Smart Manufacturing: A Comparative Analysis. IEEE Access 2021, 9, 2734–2757. [Google Scholar] [CrossRef]
  54. Lowe, D. Distinctive Image Features from Scale-Invariant Keypoints. Int. J. Comput. Vis. 2004, 60, 91–110. [Google Scholar] [CrossRef]
  55. Bay, H.; Ess, A.; Tuytelaars, T.; Van Gool, L. Speeded-Up Robust Features (SURF). Comput. Vis. Image Underst. 2008, 110, 346–359. [Google Scholar] [CrossRef]
  56. Rublee, E.; Rabaud, V.; Konolige, K.; Bradski, G. ORB: An efficient alternative to SIFT or SURF. In Proceedings of the 2011 International Conference on Computer Vision (ICCV ’11), Barcelona, Spain, 6–13 November 2011. [Google Scholar] [CrossRef]
  57. Feature Matching. 2020. Available online: https://docs.opencv.org/4.x/dc/dc3/tutorial_py_matcher.html (accessed on 30 September 2021).
  58. Lloyd, S. Least squares quantization in PCM. IEEE Trans. Inf. Theory 1982, 28, 129–137. [Google Scholar] [CrossRef] [Green Version]
  59. Fix, E.; Hodges, J. Discriminatory Analysis. Nonparametric Discrimination: Consistency Properties. Int. Stat. Rev./Rev. Int. Stat. 1989, 57, 238. Available online: https://www.jstor.org/stable/1403797 (accessed on 10 December 2021). [CrossRef]
  60. Fritsch, J.; Kuhnl, T.; Geiger, A. A new performance measure and evaluation benchmark for road detection algorithms. In Proceedings of the IEEE Conference on Intelligent Transportation Systems (ITSC 2013), Hague, The Netherlands, 6–9 October 2013. [Google Scholar] [CrossRef] [Green Version]
  61. Chen, Z.; Zhang, J.; Tao, D. Progressive LiDAR adaptation for road detection. IEEE/CAA J. Autom. Sin. 2019, 6, 693–702. [Google Scholar] [CrossRef] [Green Version]
  62. Wang, H.; Fan, R.; Cai, P.; Liu, M. SNE-RoadSeg+: Rethinking Depth-Normal Translation and Deep Supervision for Freespace Detection. In Proceedings of the IEEE/RSJ International Conference on Intelligent Robots and Systems (IROS 2021), Prague, Czech Republic, 27 September–1 October 2021. [Google Scholar] [CrossRef]
  63. Chen, Z.; Chen, Z. RBNet: A Deep Neural Network for Unified Road and Road Boundary Detection. Neural Inf. Process. 2017, 677–687. [Google Scholar] [CrossRef]
  64. Gu, S.; Zhang, Y.; Tang, J.; Yang, J.; Kong, H. Road Detection through CRF based LiDAR-Camera Fusion. In Proceedings of the International Conference on Robotics and Automation (ICRA 2019), Montreal, QC, Canada, 20–24 May 2019. [Google Scholar] [CrossRef]
Figure 1. Preprocessed samples of the Indian Driving Dataset (IDD) [4], which depict unstructured urban environments where streets are not well delineated and pedestrians or drivers rarely stick to the rules. The centre and right columns show the ground truth segmentation masks per sample.
Jsan 11 00015 g001
Figure 2. Proposed architecture of a road damage acquisition and analysis system.
Jsan 11 00015 g002
Figure 3. Proposed methodology for the automated computer-vision-based analysis of repair requests sent by users. Section (A) receives new repair requests and preprocesses them. Section (B) extracts road segments, finds and locates road damages, and retrieves potential duplicated requests. Section (C) has the task of clustering and prioritising all repair requests according to the number and types of damages detected in the images.
Jsan 11 00015 g003
Figure 4. Resnet34+UNet: final architecture implemented with PyTorch for road segmentation.
Jsan 11 00015 g004
Figure 5. Sample of duplicate images found by combining the Scale-Invariant Feature Transform (SIFT) and Fast Library for Approximate Nearest Neighbors (FLANN) algorithms.
Jsan 11 00015 g005
Figure 6. Example of repair request clustering and prioritisation using k-means and k-Nearest Neighbours (k-NN).
Jsan 11 00015 g006
Figure 7. Results of road segmentation on the augmented dataset. The first column shows the input images, while the second and third columns show the ground truth masks and predicted segmentation masks overlapped on the input image, respectively.
Jsan 11 00015 g007
Figure 8. Confusion matrix on the test subset of the augmented dataset running YOLOv5l.
Jsan 11 00015 g008
Figure 9. Examples of detection results with the best-performing model: YOLOv5l. It is good to note that the sample at the centre of the bottom row fails to contain an additional bounding box for the visible crocodile crack.
Jsan 11 00015 g009
Figure 10. Training and validation loss curves for the augmented and RDD base datasets.
Jsan 11 00015 g010
Table 1. Public reporting platforms in developing countries.
App/WebsiteCity, CountryStatus
Bache 24Mexico City, MexicoActive
Reporta MonterreyMonterrey, MexicoActive
Ciudadano ActivoCochabamba, BoliviaActive
HuecosMedMedellin, ColombiaActive
Baches.CBABuenos Aires, ArgentinaDiscontinued
PublikoBogota, ColombiaDiscontinued
Sukhad YatraNew Dheli, IndiaActive
Pothole FixBangalore, IndiaActive
JRA Find & FixJohannesburg, South AfricaDiscontinued
Table 2. Road damage types and definitions considered in Maeda et al. [5].
Damage TypeDetailClass NameInstances
Longitudinal crackWheel-marked partD006592
Construction joint partD01179
Lateral crackEqual intervalD104446
Construction joint partD1145
Alligator crackPartial/overall pavementD208381
PotholeD405627
Other damagesCrosswalk blurD43793
White line blurD445057
UtilityManholeD503581
Table 3. State-of-the-art proposals applied to the Road Damage Dataset (RDD) (2020 version) [5].
Authors and DateSupported ClassesDL MethodF1-Score
Hegde [35]D00, D10, D20, D40Ensemble learning0.67
December 2020Ultralytics-YOLO
Doshi [38]D00, D10, D20, D40Ensemble learning0.64
December 2020YOLO-v4
YOLOv5l (Ours)D20, D40YOLOv50.62
December 2021D00 and D10 combined
Menghini [37]D00, D10, D20, D40, D50YOLOv50.60
September 2021
Arya [39]D00, D10, D20, D40Transfer learningVarious according
December 2021SSD MobileNetto the target subset
Table 4. Road damage categories considered in the project and number of instances per class.
Dataset/ClassSingle CrackCrocodile CrackPothole
Maeda [5]11,03883815627
Angulo [49] (Curated)566973395573
Joint16,70715,72012,940
Augmented20,00020,00020,000
Segmented20,00020,00020,000
Table 5. Intersection over Union (IoU) on the test set with the original UNet implementation and the Resnet34+UNet model. Both models were trained and tested with the preprocessed dataset first and with the weather-based augmented dataset later.
Dataset/ModelUNetResnet34+UNet
Preprocessed0.880.91
Augmented0.860.90
Table 6. Results on the KITTI road benchmark [60] sorted by Average Precision.
ApproachAPMaxF
PLARD [61]0.940.97
SNE-RoadSeg+ [62]0.940.97
Resnet34+UNet (Ours)0.910.93
RBNet [63]0.910.95
LC-CRF [64]0.880.96
Table 7. Average precision comparison between the YOLOv5 and EfficientDet object detectors.
Metric/ClassSingle CrackCrocodile CrackPotholemAP
YOLOv5x0.570.500.690.59
EfficientDet D10.680.510.630.60
YOLOv5l0.610.530.740.63
Table 8. Precision metric obtained with 10 queries using SIFT and FLANN varying the matcher threshold and the vocabulary size from 5 to 40 and from 50 to 100, respectively. The sigma and CI rows represent the deviation and Confidence Interval for each column.
Threshold/Vocabulary Size5060708090100
578.8680.1284.1284.4784.9584.51
1079.6182.5184.4184.7384.9785.03
2078.382.1383.5985.1885.5584.4
3079.9181.7683.2185.2384.7285.53
4079.8882.6184.2484.0485.3485.05
Mean79.3181.8283.9184.7385.1184.9
Sigma0.630.590.410.600.300.40
CI±0.70±0.67±0.56±0.68±0.48±0.56
Publisher’s Note: MDPI stays neutral with regard to jurisdictional claims in published maps and institutional affiliations.

