1. Introduction
Recent developments in information and communications technology originated an urgent requirement to develop a fifth and sixth generation of networks with an unprecedented system-level spectral efficiency, which can offer higher data rates, massive device connectivity, at ultra-low latency, everything with improved energy efficiency and robust security. With the increasing amount of connected devices, enabled by the IoT paradigm, generating unprecedented amounts of traffic, wireless devices are fighting for a portion of an already crowded radio-frequency (RF) or wireless-fidelity (WiFi) spectrum. This demand has been motivating researchers to explore alternatives in the electromagnetic spectrum, new techniques, and new network architectures to address them, while still being able to meet stringent Quality-of-Service requirements. In this line, Visible Light Communication (VLC) has been introduced as a promising solution for 5G and beyond. Its reliance upon the Light Emitting Diode (LED) technology outperforms other lighting sources with increased performance and efficiency, at a fraction of the cost and weight, while its usage of an untapped and free portion of the electromagnetic spectrum (visible light range) holds the promise of achieving much higher bandwidth utilization for wireless data transmission, in some cases up to 3 Gbps [
1], while co-existing with RF communications. However, VLC has several advantages over the traditional wireless technologies that go beyond spectral efficiency or resilience to RF interference. VLC can operate within a confined space making it more secure than the radio waves that easily penetrate through walls, making them prone to security risks.
Notably, the IEEE 802.15.7 standard opens up the possibility of adoption of standardized VLC communication into a plethora of application domains such as indoor localization, gesture recognition and vehicular networking. It supports high data rate visible light communication (up to 96 Mbps) with almost 300 THz of available bandwidth [
2]. However, not all applications present the same kind of requirements, particularly in what concerns timeliness. For supporting such time critical applications, the MAC layer of IEEE 802.15.7 adopts a periodically synchronized superframe structure, which can provide guaranteed bandwidth via its Guaranteed Time Slot (GTS) mechanism. However, to effectively harness the potential of such time-critical communication mechanisms, it is vital to carry out an accurate planning of these network infrastructures, particularly in terms of timeliness and throughput. To accomplish this, it is fundamental to model the performance limits of such networks, in order to understand their behavior under worst-case conditions.
The contributions in this paper are threefold:
First, we provide a comprehensive overview on the technical aspects of the IEEE 802.15.7 and a functional overview of its MAC sub-layer.
Second, we provide a detailed formal modeling of the protocol using network calculus, enabling the computation of the worst case bounds for GTS utilization in a star topology.
Third, we complement our network modeling with a detailed numerical analysis in which we investigate the performance limits under different network configurations.
Fourth, we briefly analyze the impact of a technique to improve the scalability of the network.
In the following section, we provide a set of related works that will serve as a baseline for our work. We then provide a brief technical overview the operational layers of IEEE 802.15.7, which is followed by an in-depth functional overview of the MAC sub-layer. Then in
Section 4, we derive a formal model to determine the worst case bounds of an IEEE 802.15.7 VLC star topology, using network calculus. In
Section 5, we provide a numerical analysis to complement our network model, we analyze the impact of several network parameters upon the performance limits of such network. We finally conclude the paper by summarizing some lessons learned and proposing future research pathways.
2. Related Work
There are already some works that analyze the performance of VLC networks in terms of delay and throughput. The authors in ref. [
3] analyzed the carrier sensing multiple access with collision avoidance (CSMA/CA) mechanism of the IEEE 802.15.7. By relying upon Markov chain analysis, they derived the performance metrics for saturated traffic in a star topology network. The model was simulated over MATLAB and the authors studied metrics such as collision probability and transmission probability. Authors in ref. [
4,
5] also carried out a performance analysis using a Markov chain model for saturated traffic in a star topology network. In accordance with the evaluation service time distribution, they propose a queuing model and analyze the resulting performance improvement. However, under these analyses the worst-case bounds of the network are not clearly defined. Defining the worst case bounds can help in the adaption of this technology in time-critical applications.
Some simulation tools have also been proposed in the literature. Researchers in ref. [
6] propose a Matlab simulation framework that partially implements the MAC sub-Layer of IEEE 802.15.7 along with the necessary primitives and frame structures. However, none of these models encompass the GTS mechanism, turning them unsuitable to analyze applications with strict timeliness requirements.
Authors in ref. [
7] used a network calculus model to analyze a broadcasting topology in order to determine its performance. They also carried out an experimental evaluation with OOK modulation on both the transmitter and receiver and evaluated the throughput for various transceiver distances. By encompassing frame synchronization based TDMA over their Network Calculus model, they concluded that it would be possible to support improved levels of QoS in VLC multichannel broadcasting.
Some authors have also enhanced the existing characteristics of the IEEE 802.15.7 protocol. For instance, authors in ref. [
8] proposed a priority-enabled MAC based upon multi-parameter tuning. Using the back-off times, back-off exponent and contention window of the CSMA/CA they support different priorities to enable a multilevel differentiated service. They analyze its performance in a Visible Personal Area Network (VPAN) context using a discrete Markov chain model.
VLC have been gaining traction in several application domains such as vehicular networking, IoT and Wireless Body Area Networks. Researchers are taking a step forward in the domain of smart homes using applications like indoor presence detection systems using Optical Camera Communication (OCC) [
9]. Researchers in ref. [
10] use hybrid spatial phase-shift keying to support a communication architecture for vehicular systems. In these experiments they showcase an object detection algorithm for real-time region-of-interest tracking in city driving (at speeds around 30 km/h) and highway night driving (at a speeds >60 km/h) scenarios.
It is to be noticed that visible light communications (VLC) channels are highly dynamic, very unpredictable, and subject to many noise sources. Researchers in ref. [
11] propose a novel signal to noise ratio (SNR)-adaptive visible light communication receiver architecture aimed for automotive applications. They use an open loop signal processing technique that does a real-time SNR analysis. The receiver evaluates the SNR and re-configures its structural design in order to ensure a proper signal treatment, while providing an optimal trade-off between communication performances and computational resources usage. In this work, we propose a reconfiguration approach that will help improve the scalability of the network.
The authors in ref. [
12] argue that RF-based wireless communications are hardly suited to guarantee strict QoS requirements due to the limited bandwidth, severe interference, and multi-path reflections. Instead, in their research, they propose to integrated VLC and a VLC positioning network for IoT, to support both high-speed communication and high-accuracy positioning services in smart industry IoT networks. The security advantages of such usage in this domain are also extensively mentioned in ref. [
13], in which the authors propose a VLC system to control electrical appliances.
Recently, harmonization of protocols is becoming a key to achieve efficient trade offs in IoT for several application domains. One such methodology is the Fault-Tolerant and Medium Access Control (FTMAC) protocol for IoT over VLC. In this work [
14], the authors carry out primary data communication over a VLC link. In the event of VLC link failures, communication can be restored using a WiFi link. Such methods, besides supporting additional redundancy, can enable multiple link prioritization.
Besides these domains, IEEE 802.15.7 can easily be a forerunner in the field of wireless body area networks due to its support of large data rates, minimal latency and strong security, while avoiding RF proximity to the body or potential interference with medical equipment, for instance. Authors in ref. [
15] use full duplex bidirectional communication supported by an infrared uplink and visible light downlink. Using a ray-tracing technique they determine the overall outage performance. The approach is capable of satisfying the WBAN QoS requirements in terms of bit error rate and data rate using VLC links.
As observed, most of the work in the literature fails to achieve the full potential of this federated communication protocol, by not exploring its time critical properties. To truly foster the deployment of such communication technologies in application domains such as Industrial IoT, it is paramount to understand the performance limits in terms of latency and throughput guaranteed by such networks. In some of our previous works [
16,
17], we used network calculus to determine the worst case bounds of IEEE 802.15.4e in terms of delay and throughput for GTS utilization. This knowledge and model was then used to enable a set of critical application scenarios, like enabling a Wireless Advanced Driving Assistance System, such as in ref. [
18]. In the aforementioned application, we took the deterministic capabilities of the network and analyzed the relationship between different vehicle dynamics and the delay required for the system to operate safely, exploring the performance limits of the respective wireless network configurations. Researchers also look into the possibility of LiFi modules, which can be mounted in the head lamp as well as tail lamps of a four-wheeler, which will help to transmit real-time information such as speed data, anti-lock braking data, turn indication, certain emergencies in car, tire related data [
19].
Researchers are venturing into the possibilities of implementation of VLC networks in complex geographical monitoring systems like underground mining fields [
20] where there is a need for a reliable system of continuous personnel monitoring and localization with the aim to keep a real-time, up-to-date database of personnel, and their specific location underground.
Interestingly, the IEEE 802.15.7 also facilitates a GTS mechanism to support time-critical communications. In this paper, we take a similar approach to learn the impact of the different network parameters over the QoS of the network, drawing the performance bounds in terms of network delay and throughput. In what follows we provide a technical overview of the various PHY layers of IEEE 802.15.7 and the mechanisms of the MAC sub-layer. In
Section 4, we derive the network calculus model of the GTS service mechanism of IEEE 802.15.7. In
Section 5, we use it to compute the worst case bounds of the service in terms of delay and throughput, in regard to different settings of the protocol.
3. Technical Overview
The IEEE 802.15.7 defines the physical layer (PHY) and Medium Access Control (MAC) sub-layer for short-range optical wireless communications (OWC), which operates at a range of 10,000 nm to 190 nm using visible light. Due to its capability to support high data rates, OWC can even facilitate multimedia services such as video transmission. From a PHY perspective, this standard explores the compatibility with various light infrastructures, and tries to mitigate impairments due to noise and interference from other light sources, by relying upon different PHY configurations.
3.1. Physical Layer
Each PHY presented in this standard aims at targeting a specific application domain, as they support different data rates and modulation schemes. IEEE 802.15.7 supports 6 types of PHY layers, which are explained below:
PHY I: This PHY type is used for supporting low data rate applications for outdoor usage. This PHY layer uses ON-OFF keying (OOK) (11–100 Kbps) and variable pulse position modulation (VPPM) (35–266 Kbps). The moderate data rates along with some light source interference mitigation characteristics make it interesting for outdoor monitoring applications. There are Automated Driving Assist Systems (ADAS) [
21] that utilize the PHY I mode due its support for outdoor low rate applications.
PHY II: This PHY type is used for moderate data rate applications in indoor usage. This mode uses ON-OFF keying (OOK) (6–96 Mbps) and variable pulse position modulation (VPPM) (1.25–5 Mbps). Transmission of bio-medical signals within a hospital setting using LED lighting has been done in the literature [
22] and can be easily supported by this standard. One of the many advantages of using VLC in health care monitoring is that it can avoid interference from several electromagnetic fields such as Magnetic Resonance Imaging machines. This PHY complemented with GTS service at the MAC sub-layer can support efficient time critical communications within a single channeled VLC system. In a smart home/city setting, VLC can take retrofitting to the next notch [
23,
24,
25] because every socket in a house can be turned into a VLC-enabled light source. For typical house hold appliances, a PHY such as PHY II that uses OOK modulation and provides up to 96 Mbps will be sufficient.
PHY III: This PHY is used for applications using color-shift keying (CSK). This PHY is useful to support applications with multiple light sources and detectors, which need large data rates (12–96 Mbps), such as in a multimedia context. The CSK modulation of the IEEE 802.15.7 is power efficient and very reliable to support High Speed Wireless Visible Light Communications [
26].
PHY IV: This PHY is intended for usage with discrete light sources with data rates ranging from 10 to 18 Kbps using UFSOOK, Twinkle VPPM, S2-PSK, HS-PSK and VPWM modulations. Vehicular application scenarios, which transmit the diagnostic information of the vehicle when idle, do not demand very large data rates. The usage of UFSOOK modulation can enable such applications with low cost [
27].
PHY V: This PHY is intended for use with diffused surface light sources with data rates ranging from 120 to 400 bps using RS-FSK, C-OOK, CM-FSK, MPM modulations. Modulations like MPM provide robust data transmission performance while considering the stringent lighting constraints [
28].
PHY VI: This PHY is intended for use with video displays (short-range OWC system utilizing screens). This PHY layer supports data rates up in the range of 5–256 Kbps, using A-QL, HA-QL, VTASC, SS2DC, IDE-MPFSK Blend, IDE watermark modulations. This PHY layer is targeting VLC solutions such as Optical Camera Communication (OCC) [
29] enabling a new set of data services embedded in displays.
3.2. MAC Sublayer
The MAC sub-layer includes basic wireless communication features such as beacon management, channel access, GTS management, frame validation, acknowledged frame delivery, and association procedures, in a similar fashion to the IEEE 802.15.4. As communications use the visible light spectrum, additional functionalities are implemented such as:
- (i)
Color function: Providing information such as device status and channel quality to the human eye via color.
- (ii)
Visibility: Sending an idle pattern during idle time or the receive operation to provide continuous illumination.
- (iii)
Color stabilization: A control loop for the stabilization of the color emitted by CSK transmitters.
- (iv)
Dimming support: Reducing the radiant power of a transmitting light.
Interestingly, PHY I, II and III support over-the-air MAC and PHY configuration for increased flexibility and on-the-fly re-configurability. Additionally to these MAC data services, the protocol also supports mechanisms to mitigate the impact of dimming or flickering.
3.2.1. Flicker Mitigation
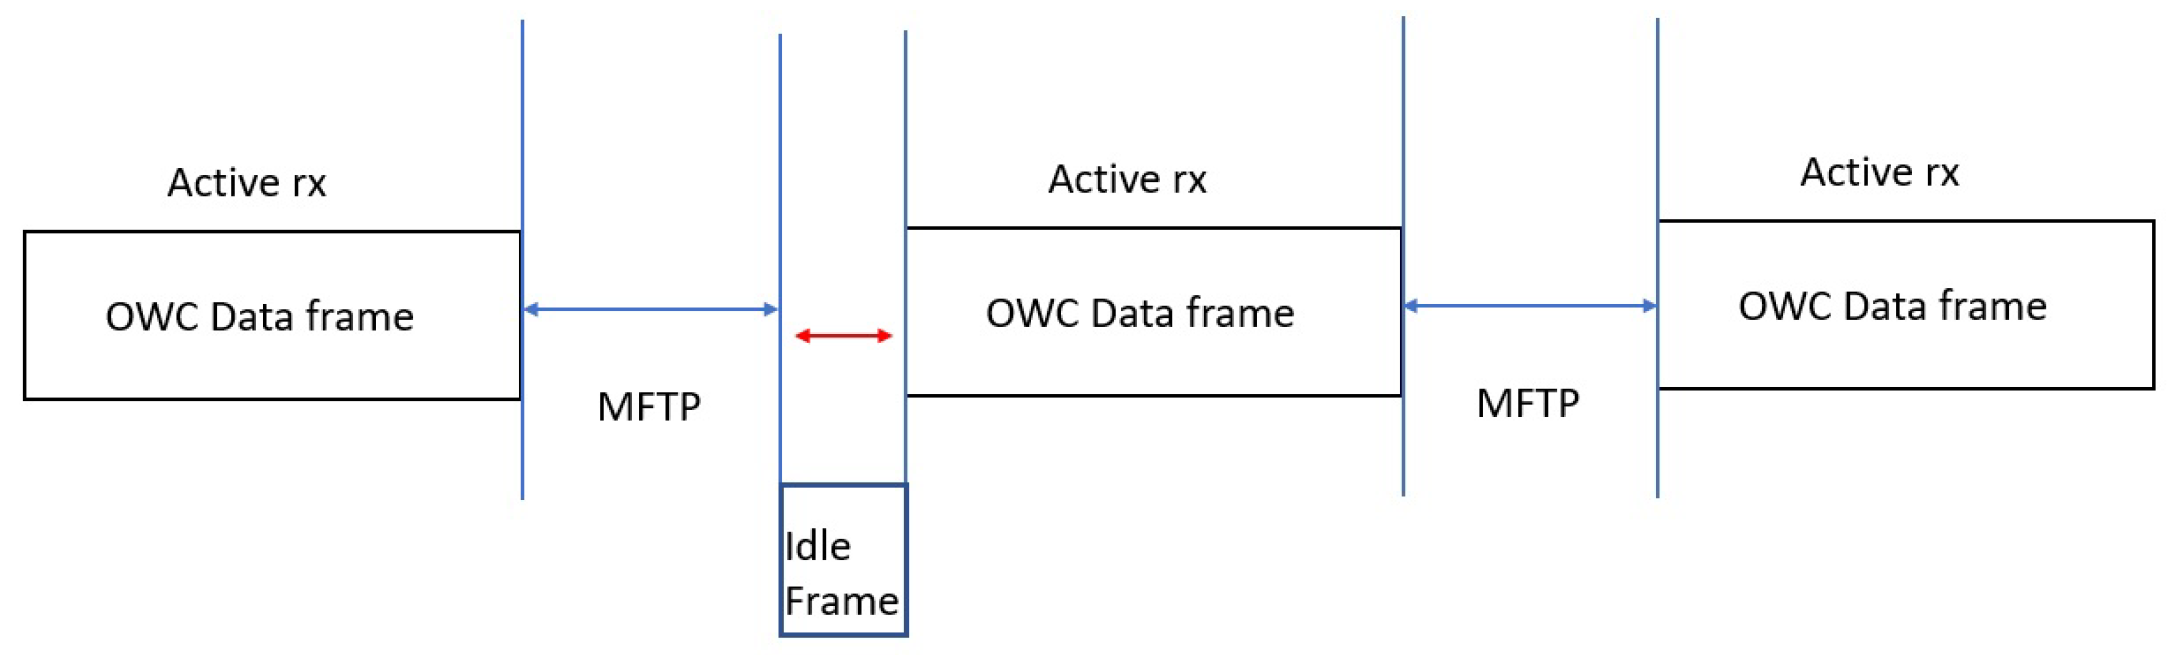
Flicker is a temporal modulation of light, which is visible by the human eye. The maximum period over which the light intensity is changing is defined as Maximum Flickering Time Period (MFTP). Flicker within the MFTP is not visible by the human eye. Any Flicker beyond the MFTP must be mitigated to assure a stable communication. If the flicker occurs within the data frame of communication, it is called intra-frame flicker. If the flicker occurs between adjacent data frames it is called inter-frame flicker.
Intra-frame flicker can be mitigated using various modulations OOK mode dimming and RLL coding. By using these modulations, the average brightness can be maintained at 50%, which in turn reduces the flicker immensely. On the other hand, inter-frame mitigation can be handled by the transmission of an idle pattern between the data frames, as shown in
Figure 1. The brightness of these idle frames will be equivalent to the data frames in order to avoid flickering.
3.2.2. Dimming Mitigation
Dimming can be defined as controlling the brightness of the light source in accordance with the users requirement. Dimming can be done by several methods such as adding compensation symbols, controlling pulse width, and controlling the amplitude of the signal. Compensation symbols are similar to an idle frame that is sent along the data frames, which will reduce the level of brightness. The other techniques include adjusting the level of brightness by a certain percentage regularly between every frame to mitigate the dimming of the light source.
3.3. Network Infrastructure
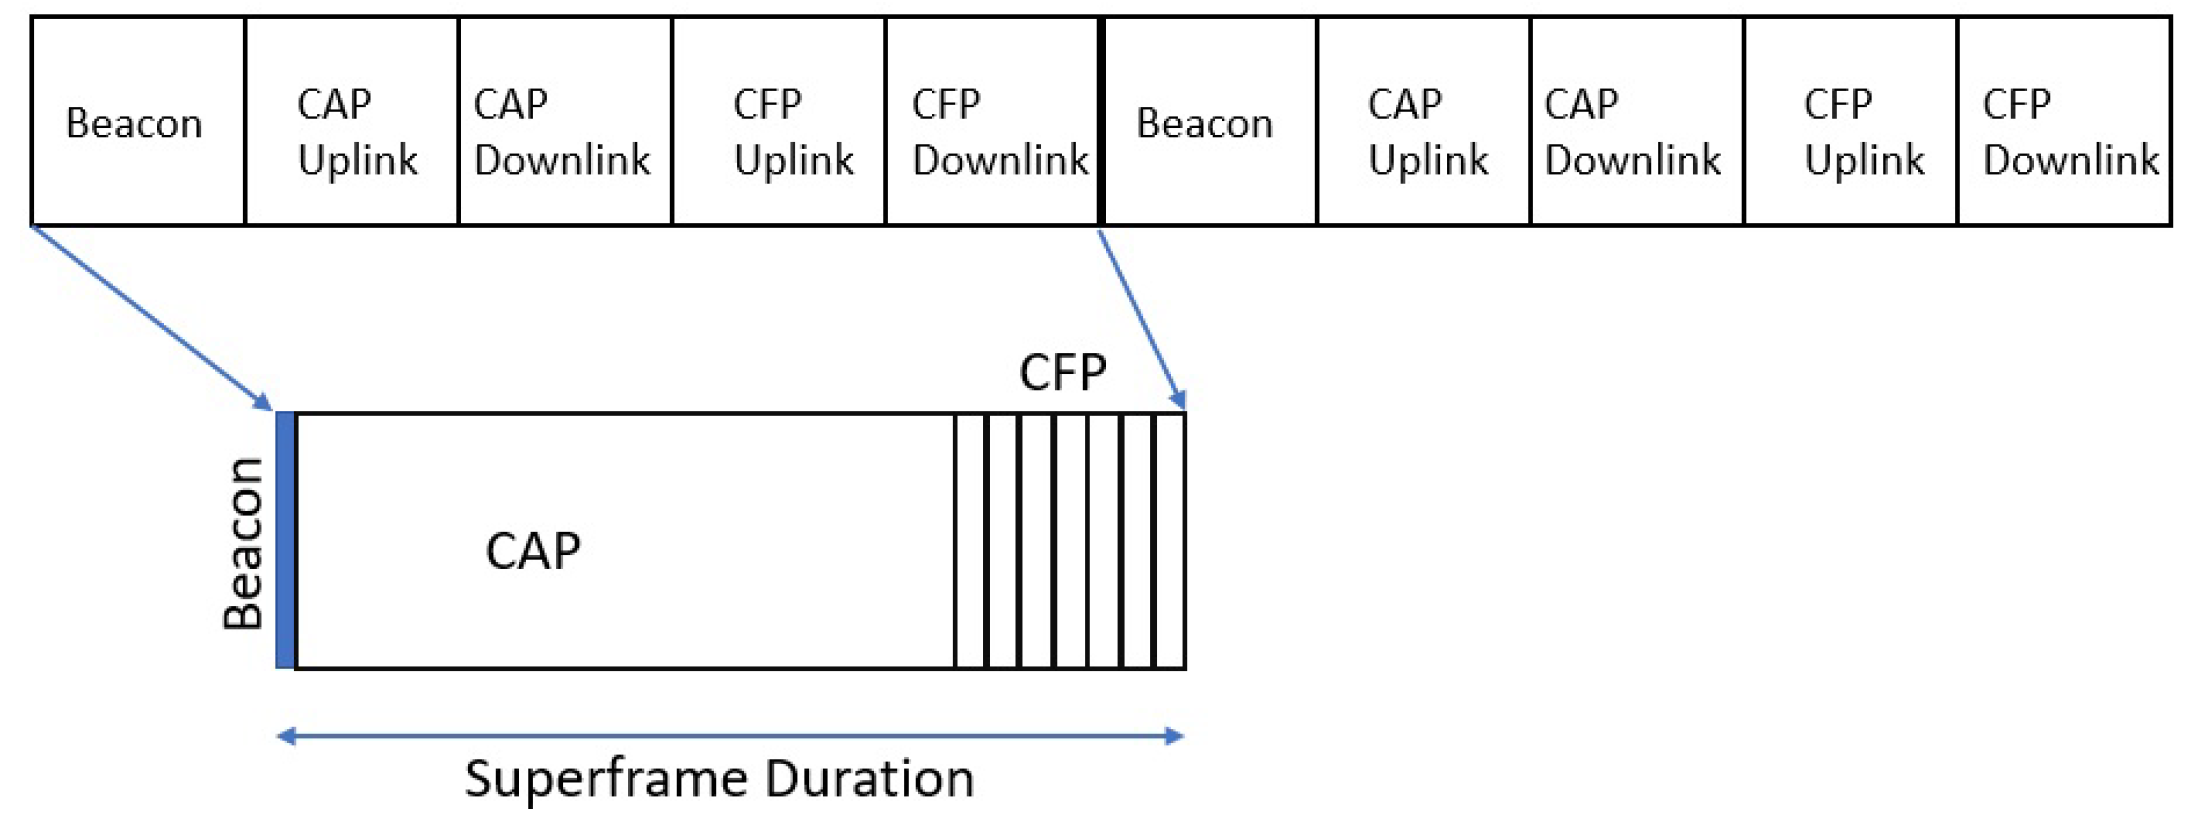
Similar to several time-critical protocols in the IEEE 802.15 family, the IEEE 802.15.7 is also supported by a superframe structure synchronized by periodic beacons. The format of the superframe is set by the coordinator based on the network topology. The superframe structure consists of a beacon period in which beacons are sent for synchronization. It consists of a Contention Access Period (CAP) in which communication is carried out using CSMA/CA, and a Contention Free Period (CFP) in which communication is carried out using Guaranteed Time Slots (GTS). In what follows we present a set of superframe structures used for various topologies:
3.3.1. Peer-to-Peer Communication
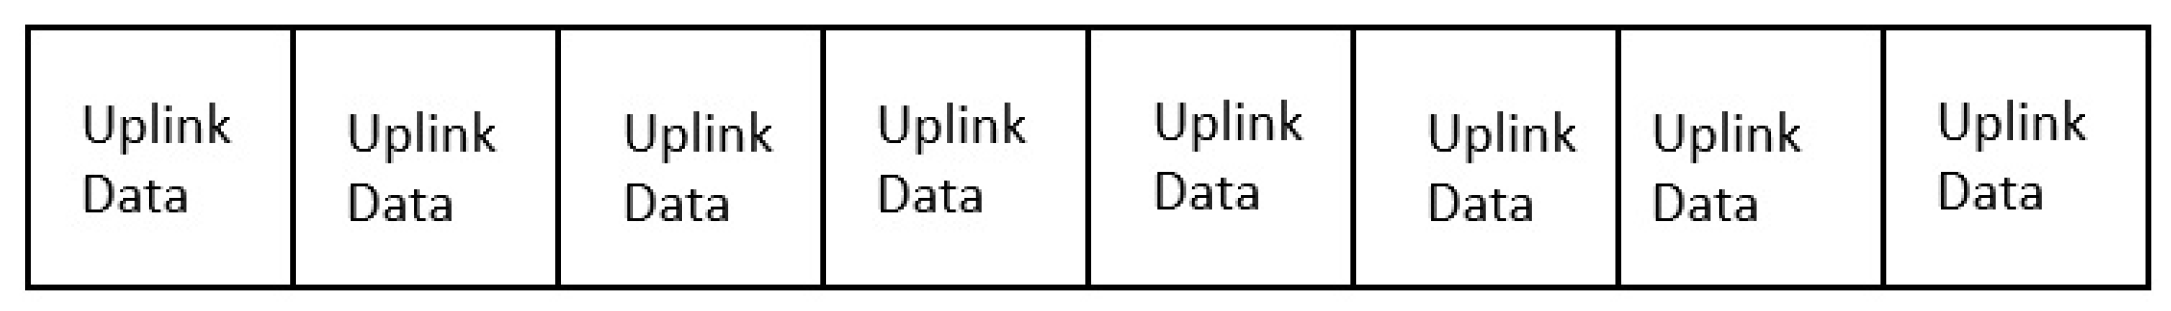
The peer-to-peer communication is usually facilitated by a series of uplink timeslots (
Figure 2). Usually, the PAN coordinator in this case, uses a non beacon enabled mode and the transmission is always carried out using unslotted random channel access using CSMA. Each device will be able to communicate with another device in its vicinity using this mode. Active channel scanning is used in this mode to discover the neighbors in its vicinity.
3.3.2. Star Topology
The star topology is facilitated by a superframe structure (
Figure 3) consisting of a beacon, contention free and contention based timeslots. The number of timeslots in the CFP is limited to seven. This topology is established between a single PAN coordinator and several slave devices. Passive scanning is used to discover the nodes in the vicinity.
3.3.3. Broadcast Topology
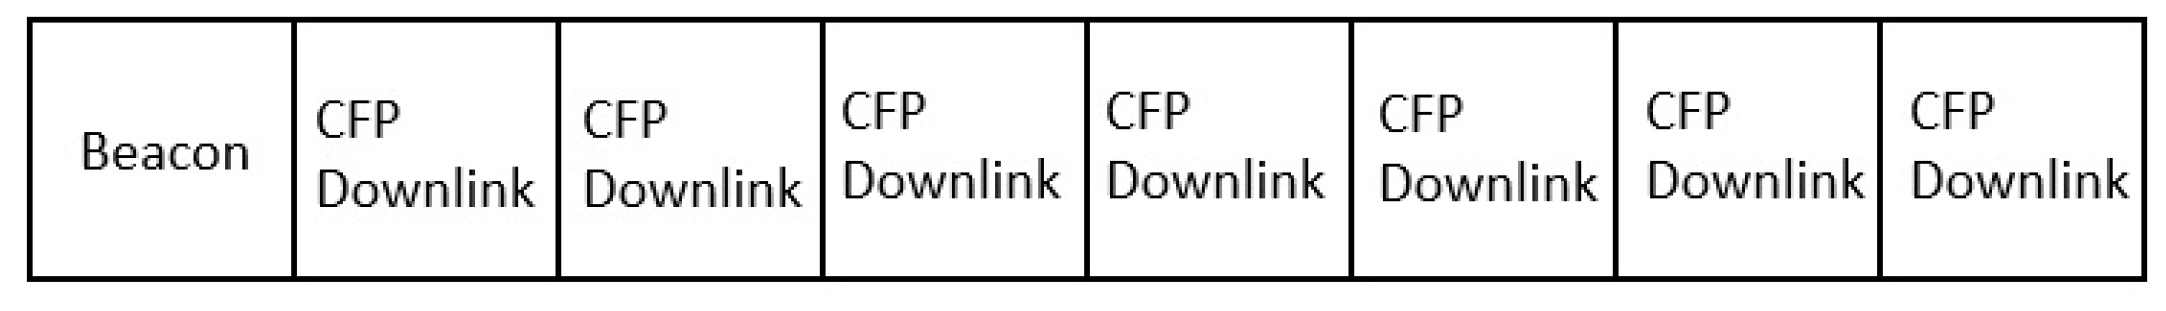
In a broadcast device, data can be transmitted to other devices without the overhead of setting up a network. The communication is unidirectional and the destination address is also not required for this communication. The broadcast is initiated by sending the primitive broadcast using a beacon at the beginning of the superframe (
Figure 4). The rest of the superframe comprises of GTS downlink timeslots. Similar to star topology, passive scanning is used to discover the devices in the vicinity. The number of timeslots in every broadcasting contention free period is not clearly defined in the standard.
4. Worst Case Bound Analysis Using Network Calculus
Network calculus is a mathematical method that is well adapted to controlled traffic sources and provides upper bounds on delays for traffic flows. In this work we will focus on the star topology based VLC network as it supports time-sensitive communication. We focus on the star topology because it supports both the contention based and guaranteed communication. Topologies like peer-to-peer support only contention based communication. The network infrastructure supporting broadcast topologies are not very deterministic as the number of slots in the CFP downlink is not clearly defined.
Network calculus is a theoretical formulation based on deterministic queuing systems. This formulation helps in understanding and determining structural properties like schedulability, delay bounds, and buffering requirements for specific bounds of traffic in an integrated network. This makes network calculus a tailored fit for analyzing and determining the worst-case bounds of the IEEE 802.15.7.
Arrival curves: To define the bounds of any network, we first have to determine the guarantees to the specific data flows. These guarantees can be defined by the so-called arrival curves. Given a wide-sense increasing function
defined for a
, we say that a flow-through
s with input
R is constrained by
for all
: Considering that the flow
R has an arrival curve of
, then the bound is be given by:
The accumulation of all the arrivals for the respective flow of can be given by . It is also equally important to learn the service provided by the system for the respective traffic flow. The service curves help in determining this bound.
Service curves: Depending on resource reservations in the network, the Service Curve can be defined as a means of expressing resource availability. Service curves can be categorized into strict, weakly strict, or even variable capacity. To guarantee a strict QoS, it is necessary to specify some minimal service bound for the server.
For a system S, and a flow-through s with input R and an output function , S offers to the flow, a service curve , if and only if is wide-sense increasing, and .
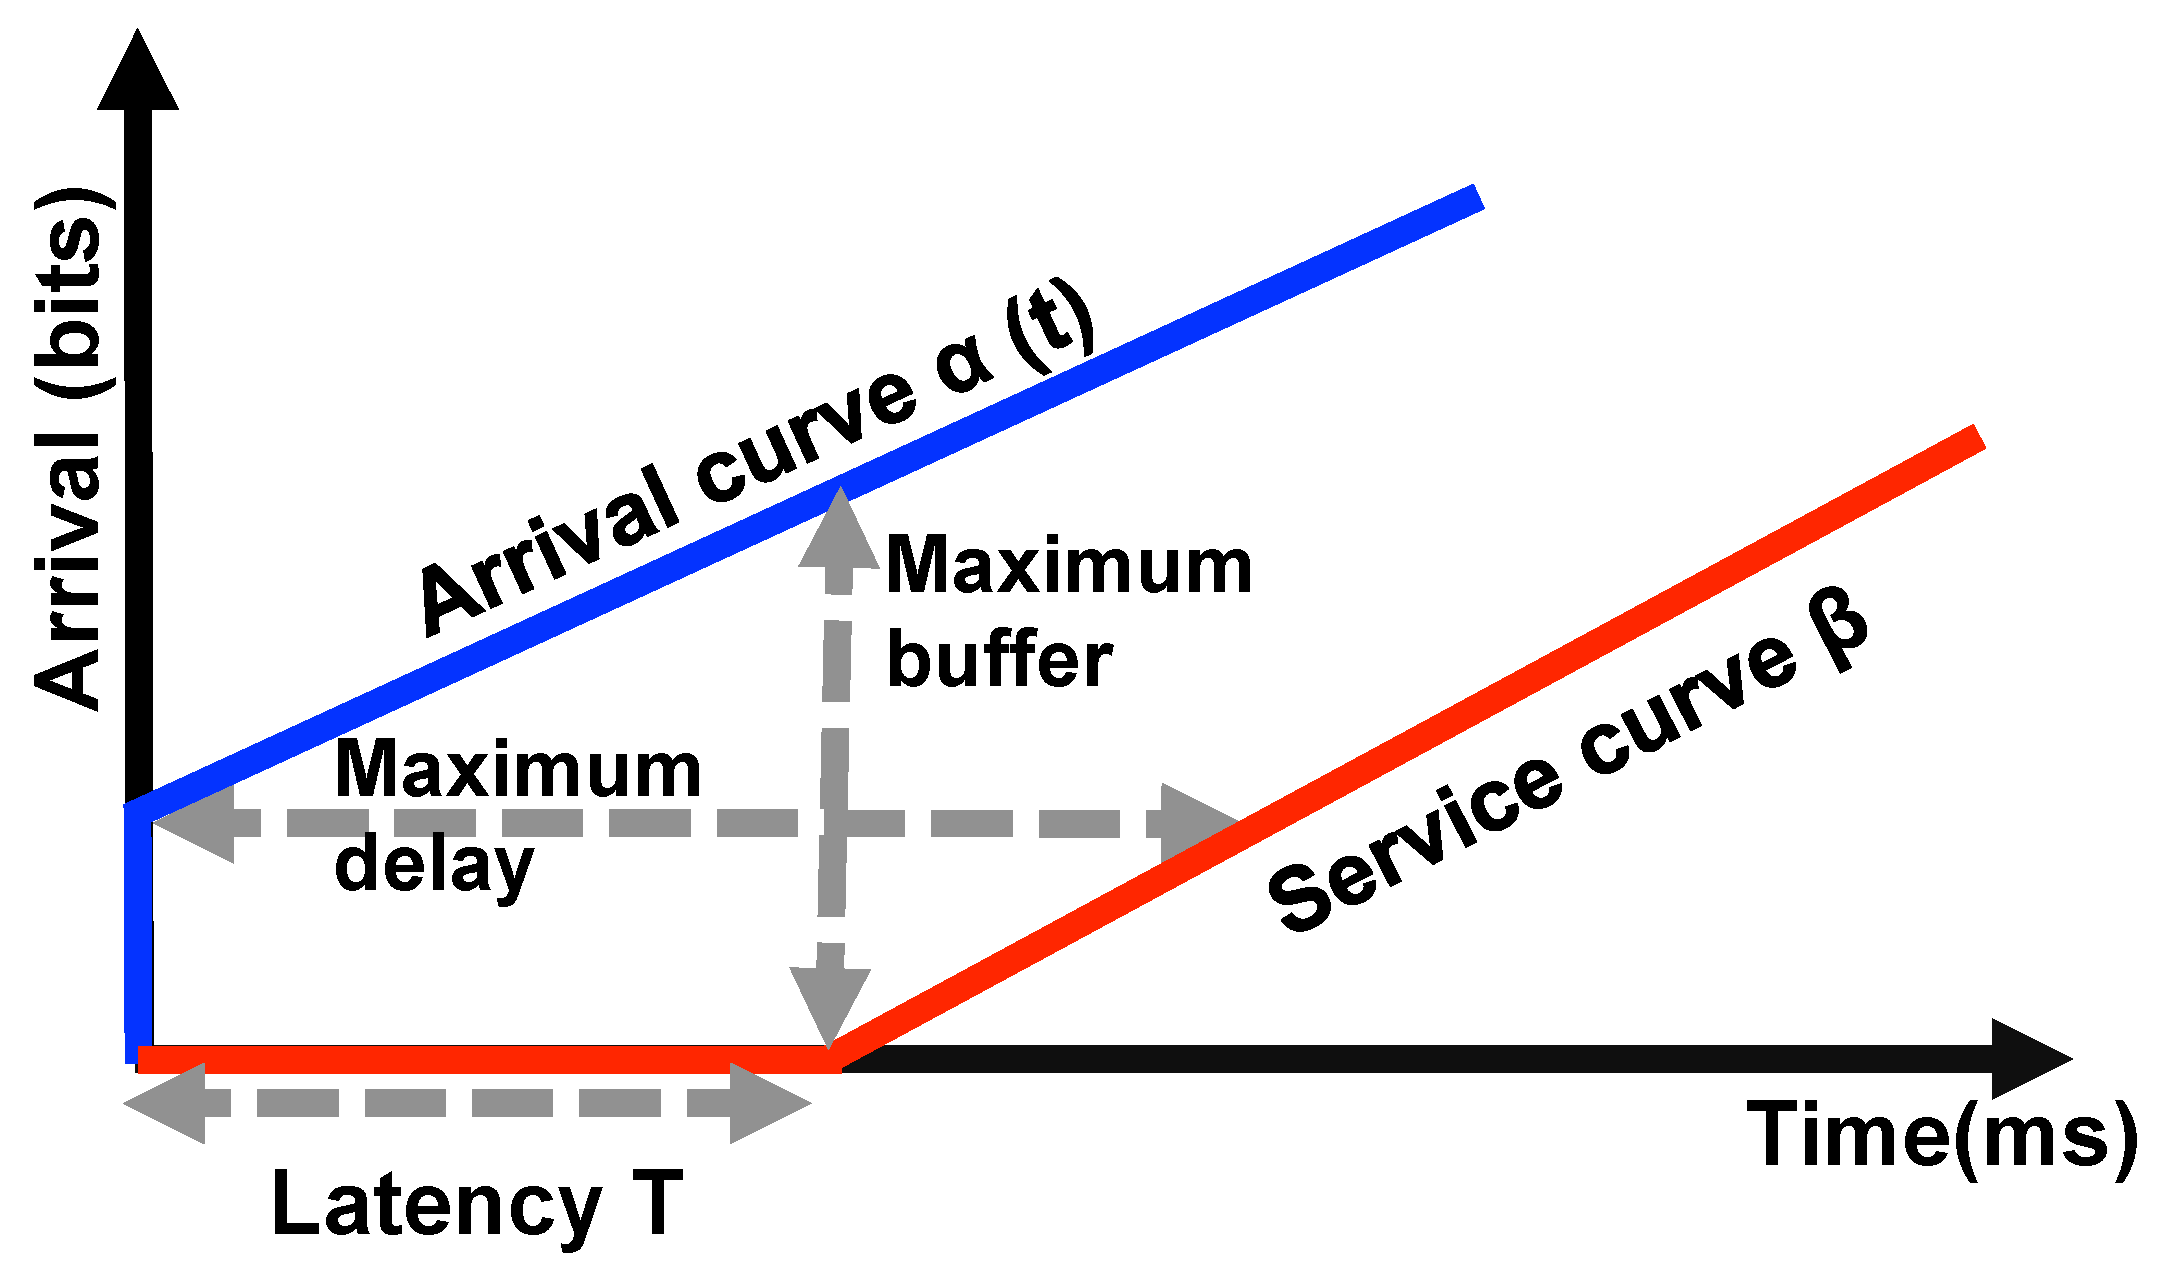
As shown in
Figure 5, the envelope of the entire service provided
will determine the overall service curve of the system. For a cumulative arrival function
, there exists an arrival curve
, where
b,
r,
t are the burst rate, the data rate, and the time interval, respectively. A minimum service curve
is guaranteed to the arrival function of
. The maximum delay bound for the arrival
that receives a rate-latency service curve
where
R is the bandwidth and
T is the maximum latency can be given by:
The variance between the
curve and the realistic model is adequate for a periodic traffic, which is often the case in Wireless Sensor Networks.
Figure 5 depicts the basic
model with the arrival and service curves, and the delay bound (expressed as maximum delay).
4.1. Service Curve Analysis of IEEE 802.15.7—Star Topology
Akin to several predecessor standards like the IEEE 802.15.4e [
30], for star topology, the PAN Coordinator sends a beacon for every superframe interval for synchronization. The Beacon Interval (
BI) and the Superframe Duration (
SD) can be represented as:
aBaseSD is the number of optical clocks forming a superframe when the superframe order (
SO) is equal to 0, this value can be given by:
The slot duration can be given as the number of optical clocks forming a superframe slot when the superframe order is equal to 0; this value is fixed to 60 optical clocks when
SO = 0.
is the number of timeslots in the superframe. It is mandatory to include the GTS transmission, the acknowledgements and the CAP region within for the worst case bounds analysis. For the sake of simplicity, we consider one data frame transmission in each a GTS per superframe. As every VLC superframe comprises 16 timeslots, the size of a single timeslot will be:
Every timeslot in a superframe comprises and . is the maximum duration used for data transmission in a GTS. in our case this is is the single occupied timeslot in the optical frame. is the time period that accommodates the acknowledgments and Inter Frame Spacing (IFS) in the network. VLC has different IFS such as: long (LIFS), short (SIFS), and reduced (RIFS). These IFS values vary based on the PHY layer the VLC operates on. The first three PHY layers that are used in outdoor communication have large IFS times ranging from 40 to 400 optical clocks. However, the latter ones that use discrete light sources have no IFS at all.
As shown in Equation (
7), the latency
T is the time for which a burst waits to gets served. This is the difference between the burst arrival at the Beacon Interval and the time at which data are served. In a worst case scenario, the burst can arrive towards the end of the superframe and get served in the beginning of the adjacent superframe.
The overall service provided by the network can be given by the product of the data rate and the time at which the system receives the service. If the network comprises idle time, it should be noted that the
BI must include the optical clocks involved in it as well. In such a case the
BI can even be twice the size of the
SD. As the overall service for the VLC network has to be calculated in accordance with a data rate, we multiply the service offered by a constant data rate “
C”. The service given for the GTS, i.e., the number of bits that has to be sent during a GTS within a time
t, is as given by Equation (
8),
This value of the service curve can now be derived for
N number of superframes, similar to the equation derived for the service curve for
n superframes of the IEEE 802.15.4 in ref. [
31]. When considering
N superframes, we must take the entire service by summing the overall service provided for the data frames. This service curve engulfs all the latencies
across the superframes taken for the VLC network. This service of the
superframe can be represented as:
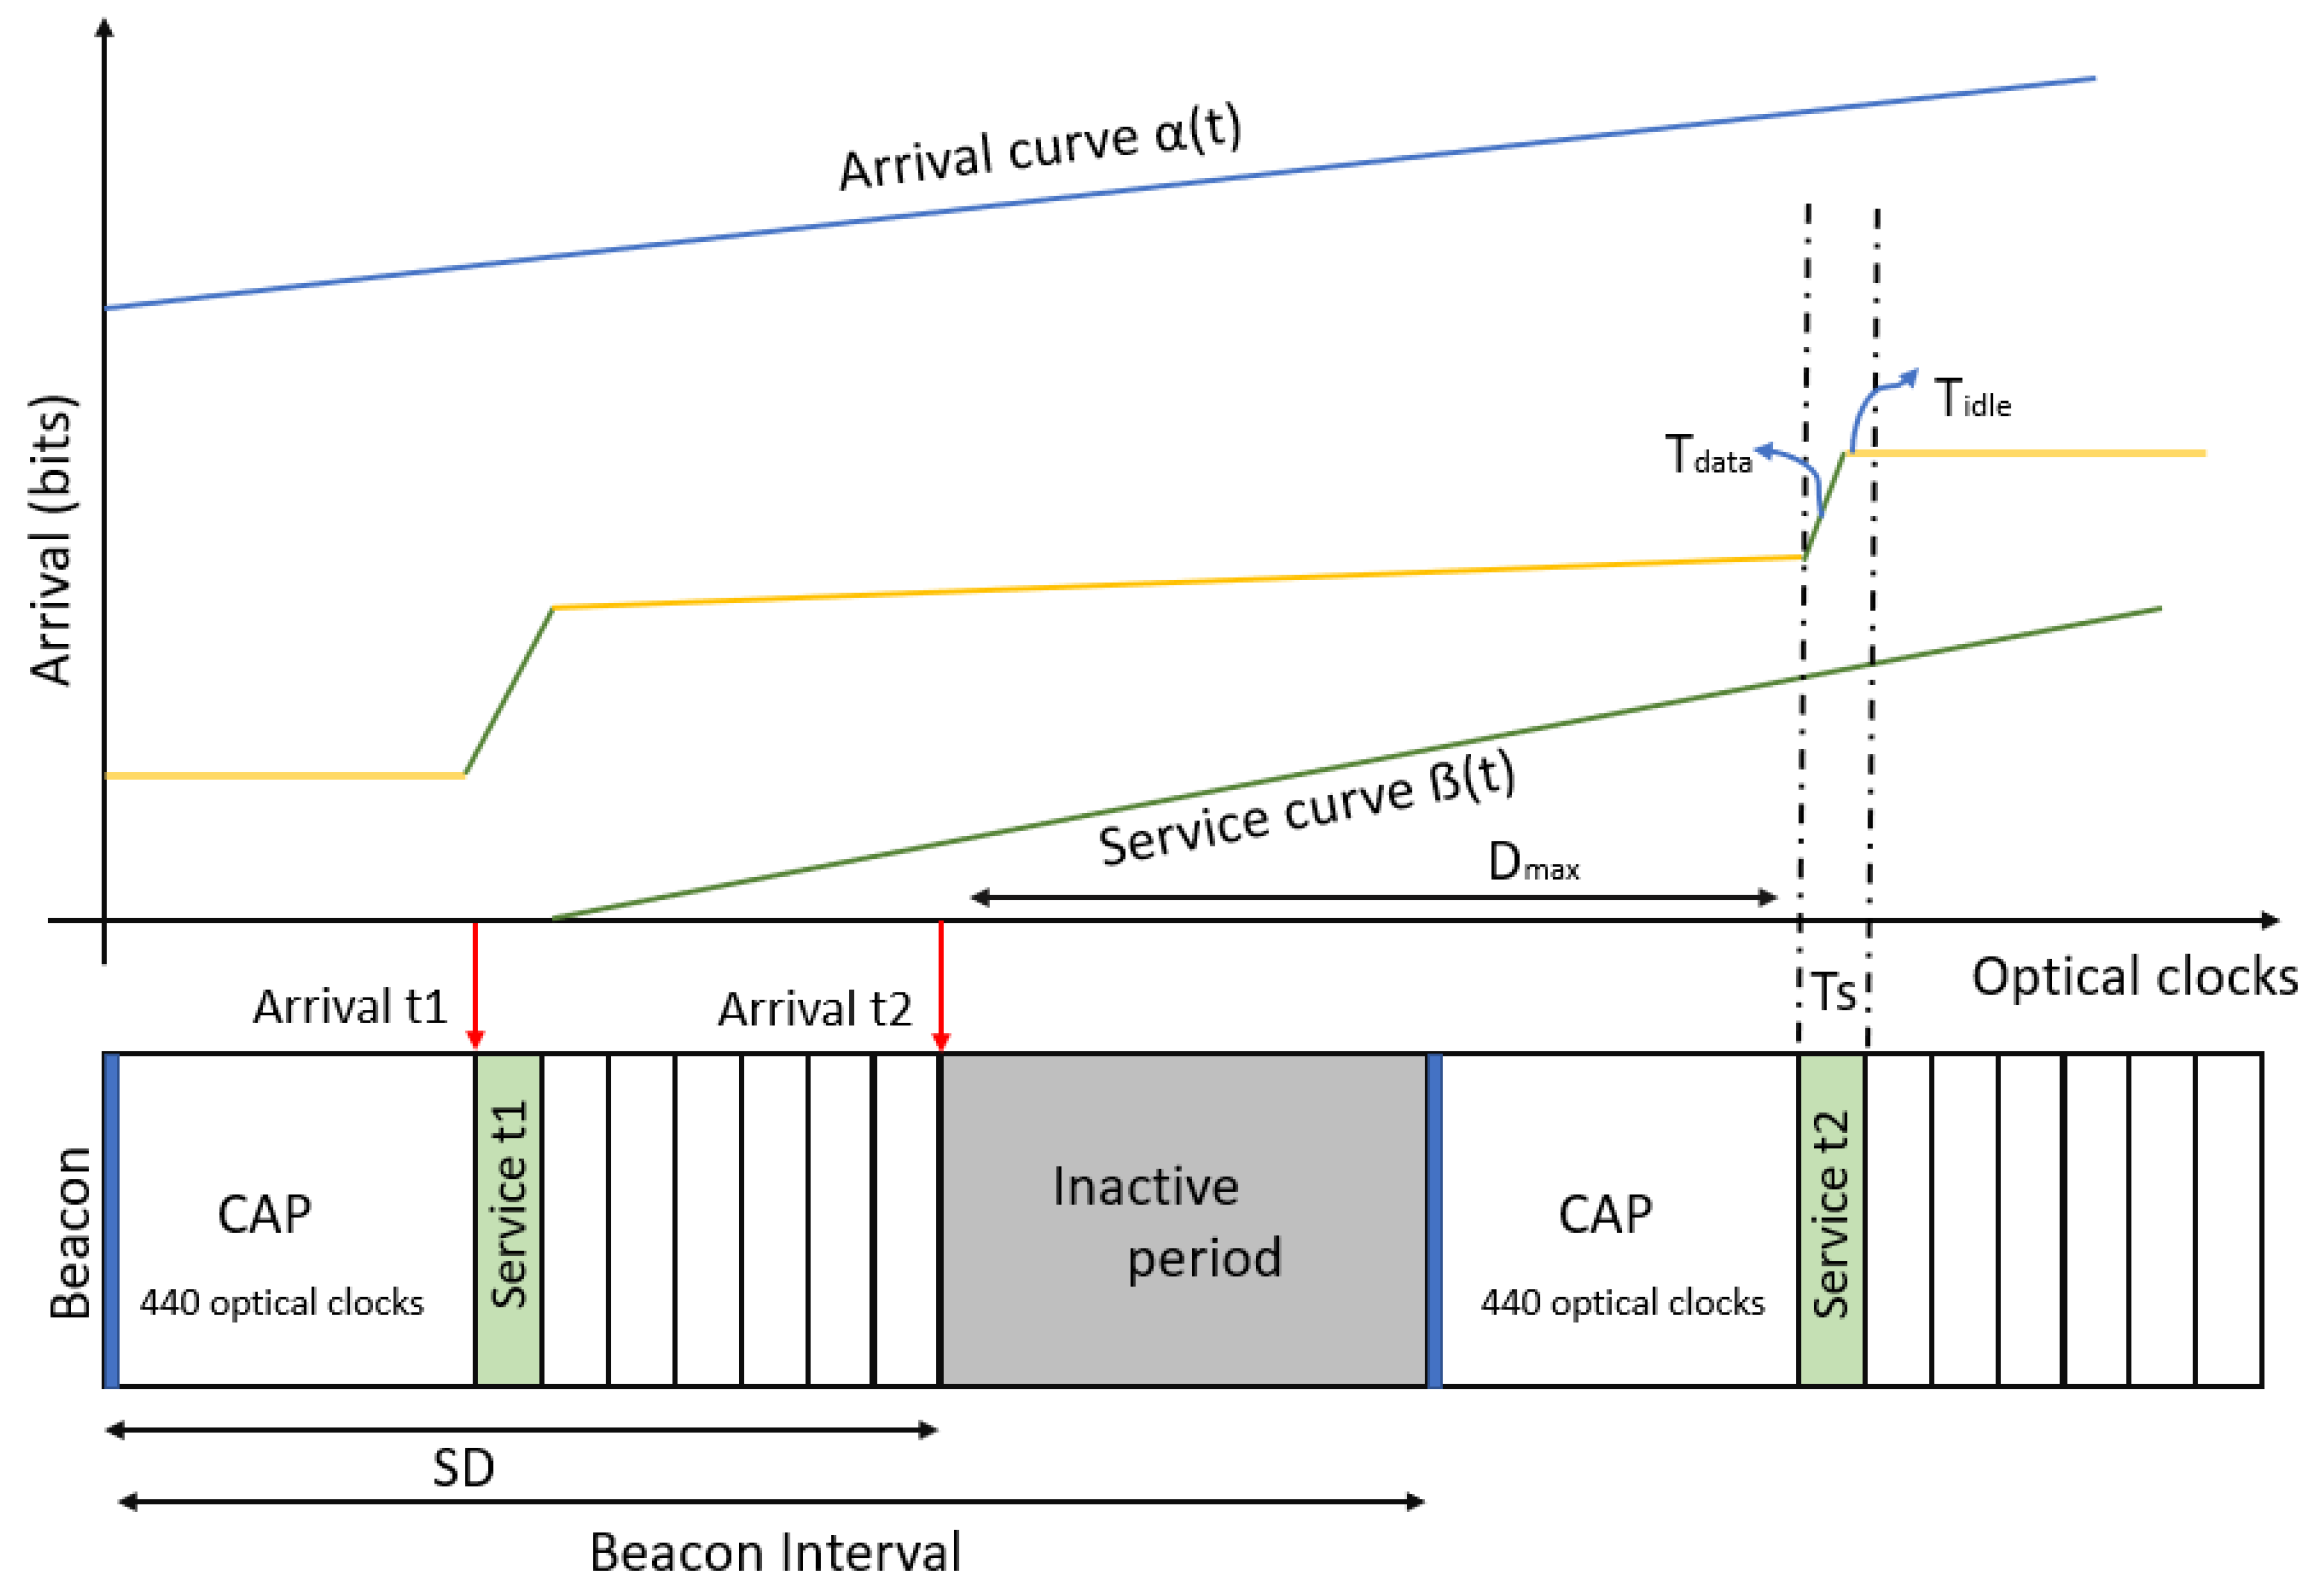
In
Figure 6, we depict the arrival and service bounds for two different cases, for the first case, we consider an arrival that starts at the beginning of the GTS and gets served immediately. We take a worst case scenario where the arrival of the timeslot occurs at the end of the
SD and the transmission has to wait an idle period and a CAP of 440 optical clocks to get served.
4.2. Maximum Delay Evaluation
The accurate delay bound in this worst case can be calculated by calculating the maximum horizontal deviation between the arrival curve and . The maximum horizontal deviation is reached at the angular point defined by the intersection between the slope of and the burst size b.
Now considering the burst size
, the delay is the maximum horizontal deviation between the angular point and the first stair. In such a case, based on Equation (
2) the maximum delay can be given as:
Considering all the guaranteed timeslots in the superframes, for
n timeslots, the delay can be given as:
The value of
R can be expressed as the rate of the number bits sent in each beacon interval, in such a case it is represented as:
Using Equation (
12) in Equation (
10) the
can be represented as:
4.3. Maximum Throughput Evaluation
The maximum throughput of a VLC network, is obviously dependant on the PHY characteristics, but even with high data-rate guarantees at this level, throughput will be heavily influenced by parameters such as burst size, arrival rate and superframe orders. The length of the
IFS period is dependent on the size of the superframe in which the data is transmitted. Frames of up to
octets in length shall be followed by a short interframe space (
SIFS) period of a duration of at least
optical clocks. Frames with lengths greater than
octets shall be followed by a long interframe space (
LIFS) period of a duration of at least
optical clocks. Burst frames shall have a reduced interframe space (
RIFS) given by
. Based on the PHY layer, the VLC network imposes different
IFS values, which are tabulated in
Table 1.
The throughput of a VLC network is determined by the maximum amount of data frames carried in the GTS. This number depends on whether the frames are sent with a
SIFS or
LIFS or
RIFS intra-frame spacings. The values of these spacings are defined by the standard and are tabulated in
Table 1. Hence, it is mandatory to include
IFS for evaluating the maximum throughput for multiple transmissions. When multiple frames with the maximum frame length (
) are to be transmitted within the GTS, they must be separated by
LIFS periods. Then, the maximum number of frames that can be transmitted is:
Now, if we consider that the GTS is fully used in the data transmission, the duration of the data with
LIFS can be given by:
includes either SIFS that is lower than or RIFS that is lower than usually towards the end of the superframe (last data transmission).
Similar to
LIFS, when multiple frames that are transmitted within the GTS are separated by
SIFS periods, the maximum number of frames that can be transmitted is given as:
Now if we consider that the GTS is fully used in the data transmission, the duration of the data with
SIFS can be given by:
includes
RIFS that is lower than
towards the end of the superframe (last data transmission). Burst frames in the VLC network are usually separated by
RIFS, the maximum number of frames that can be transmitted is given as:
The duration of the data with
SIFS can be given by:
The maximum time used in data transmission can now be derived as:
The maximum throughput of the VLC network with a data rate of
C can be given as:
Using Equation (
20) in Equation (
21), the maximum throughput can be derived as:
In the case of a partially used GTS, the actual data transmitted will be less than the
. This is due to the overhead of introducing of intra-frame spacing. In such a case the amount of bits carried by
will be higher than the result of transmission. In such a case, the value of
is given by:
Using Equation (
23) in Equation (
21), the throughput can be defined as:
Generalizing Equations (
22) and (
24), the maximum throughput can be given as:
5. Numerical Analysis
We represent the numerical analysis in two parts. First, we enumerate the throughput for the PHY layers supporting lower data rates, such as PHY I and PHY VI. Then we collectively analyze PHY II and PHY III that support larger data rates up to 96 Mbps.
5.1. Throughput Analysis
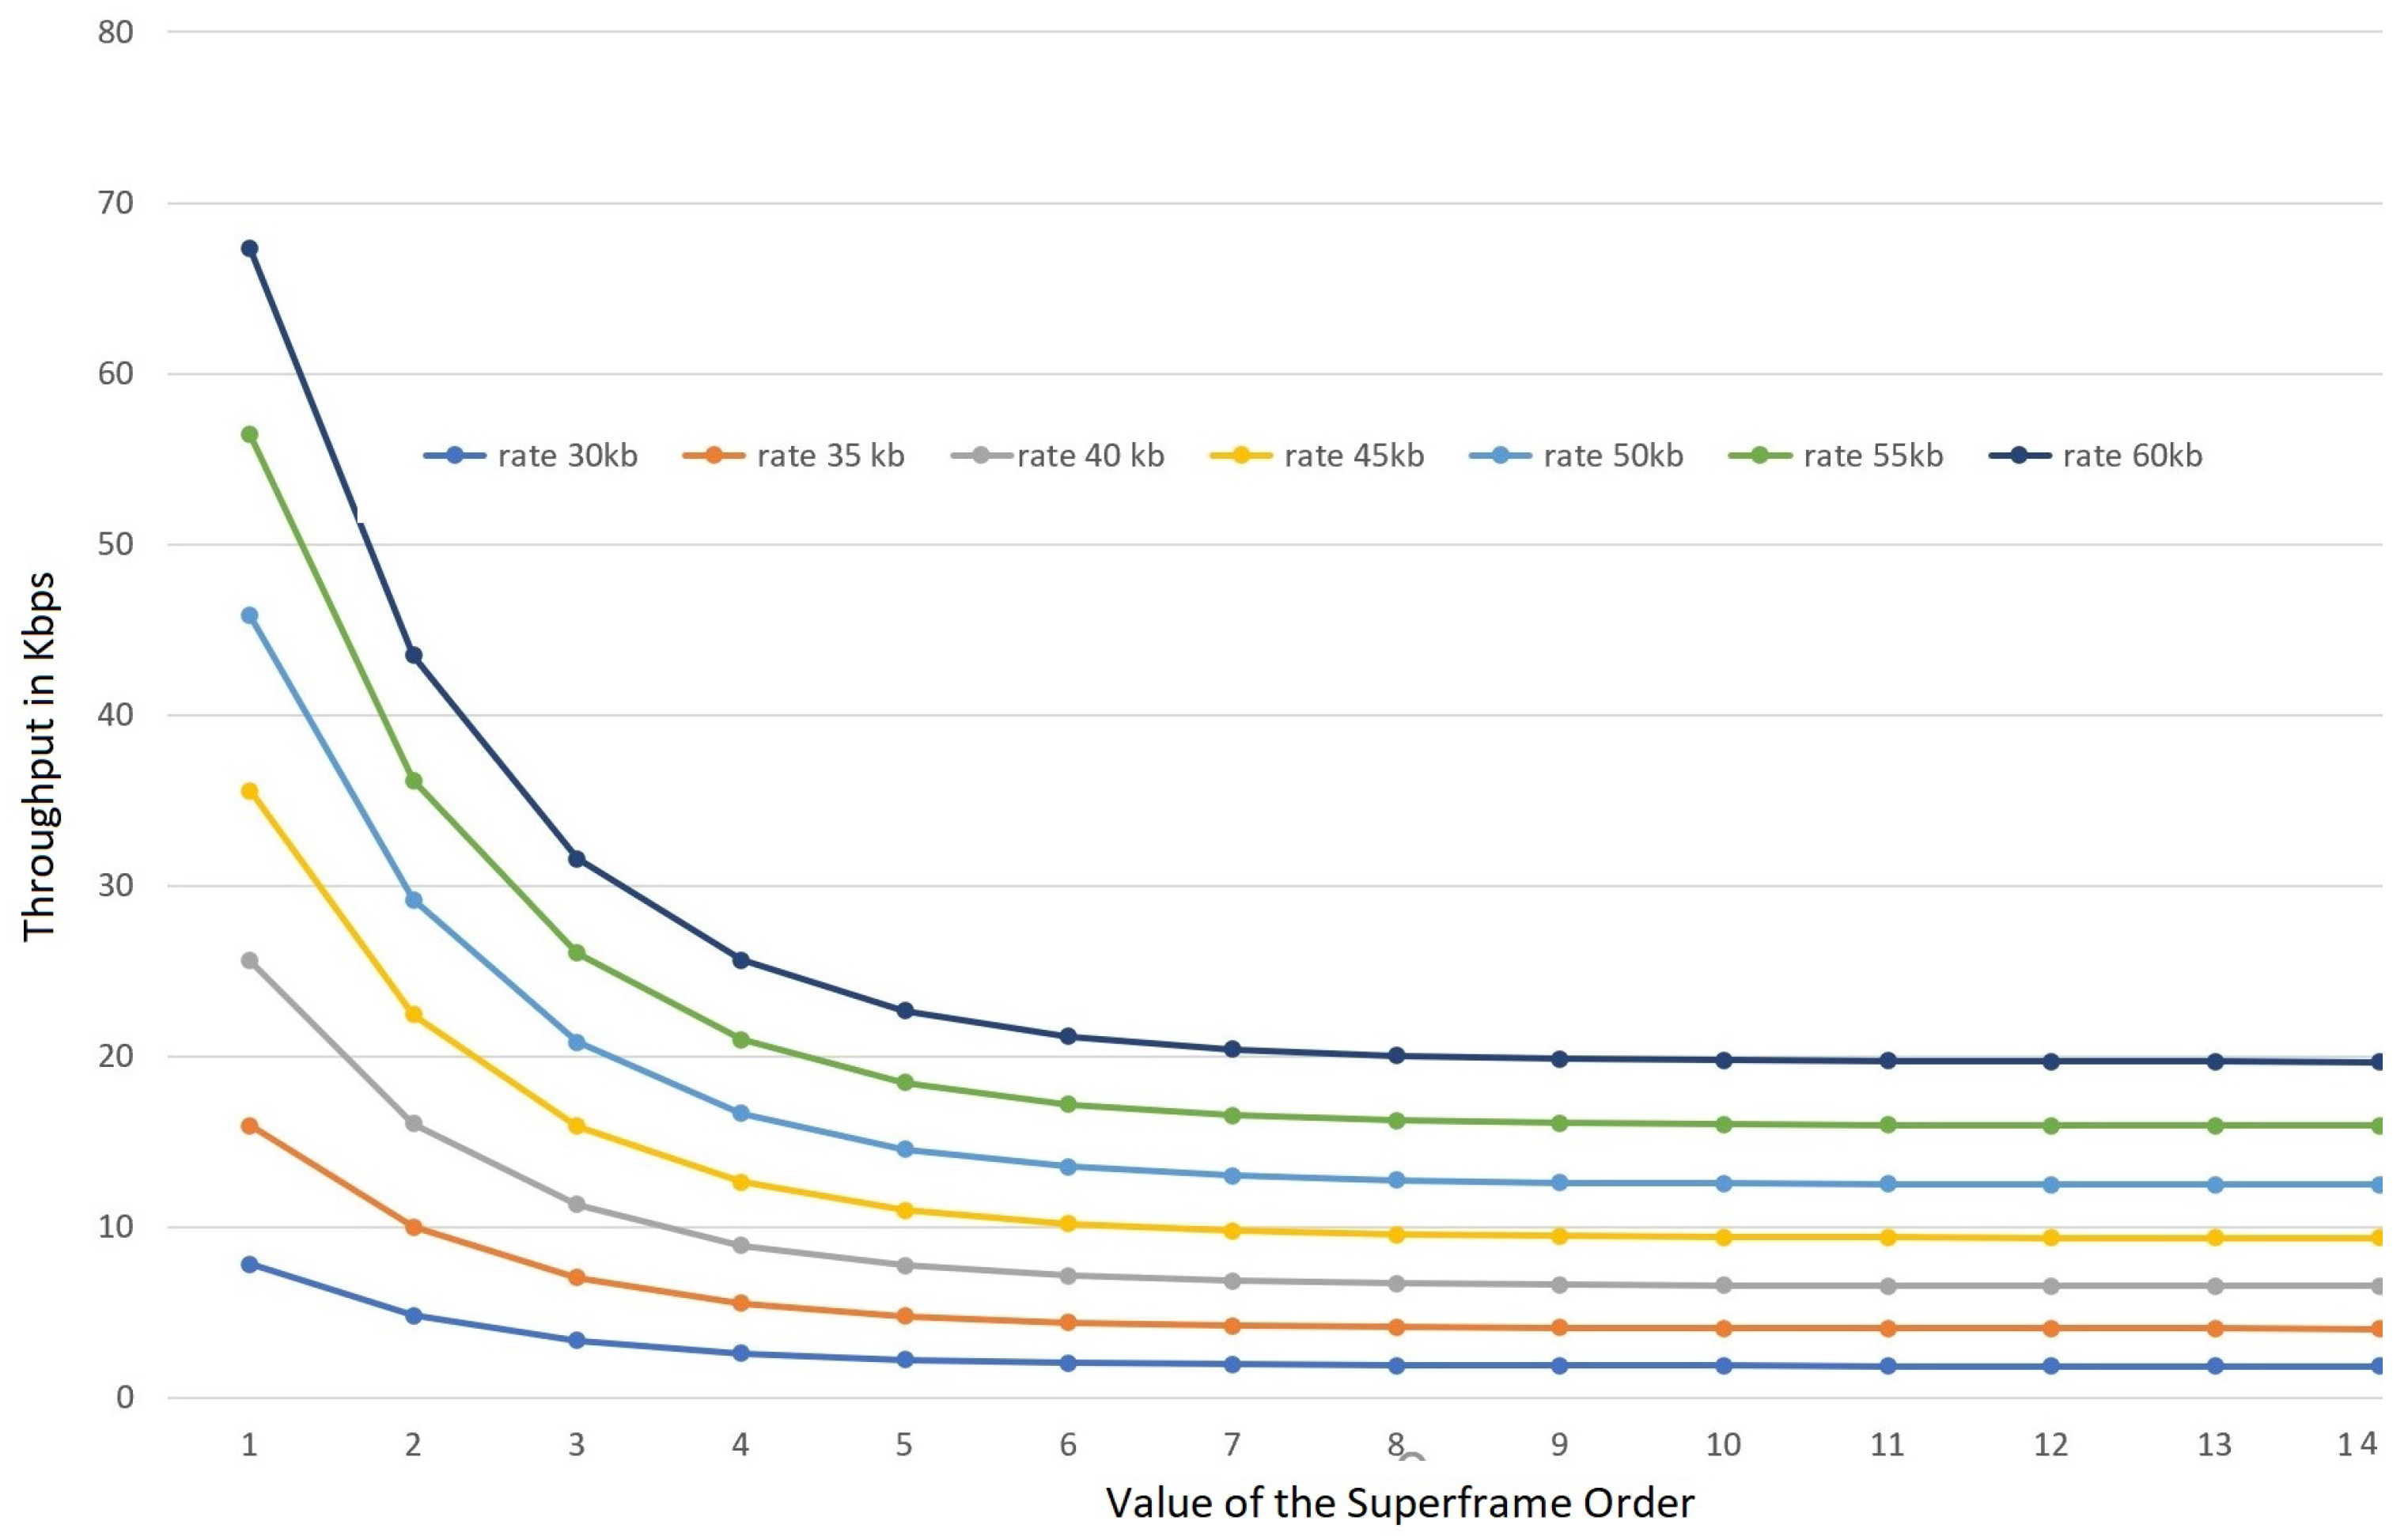
As PHY I and PHY VI support 11–100 Kbps and 5–256 Kbps, we take a burst of 30 Kb and vary the arrival rates to learn its respective impact. From
Figure 7, it is visible that the throughput is a proportionate to the arrival rate. The throughput is considerably larger for superframe orders till four. When the superframe order increases further than four, the throughput is lowered and stabilizes. The saturation and reduction in throughput for the larger superframes occurs as the size of the superframe becomes large and is thus able to accommodate the data frame, but the following data frames wait for longer optical frames to get accommodated.
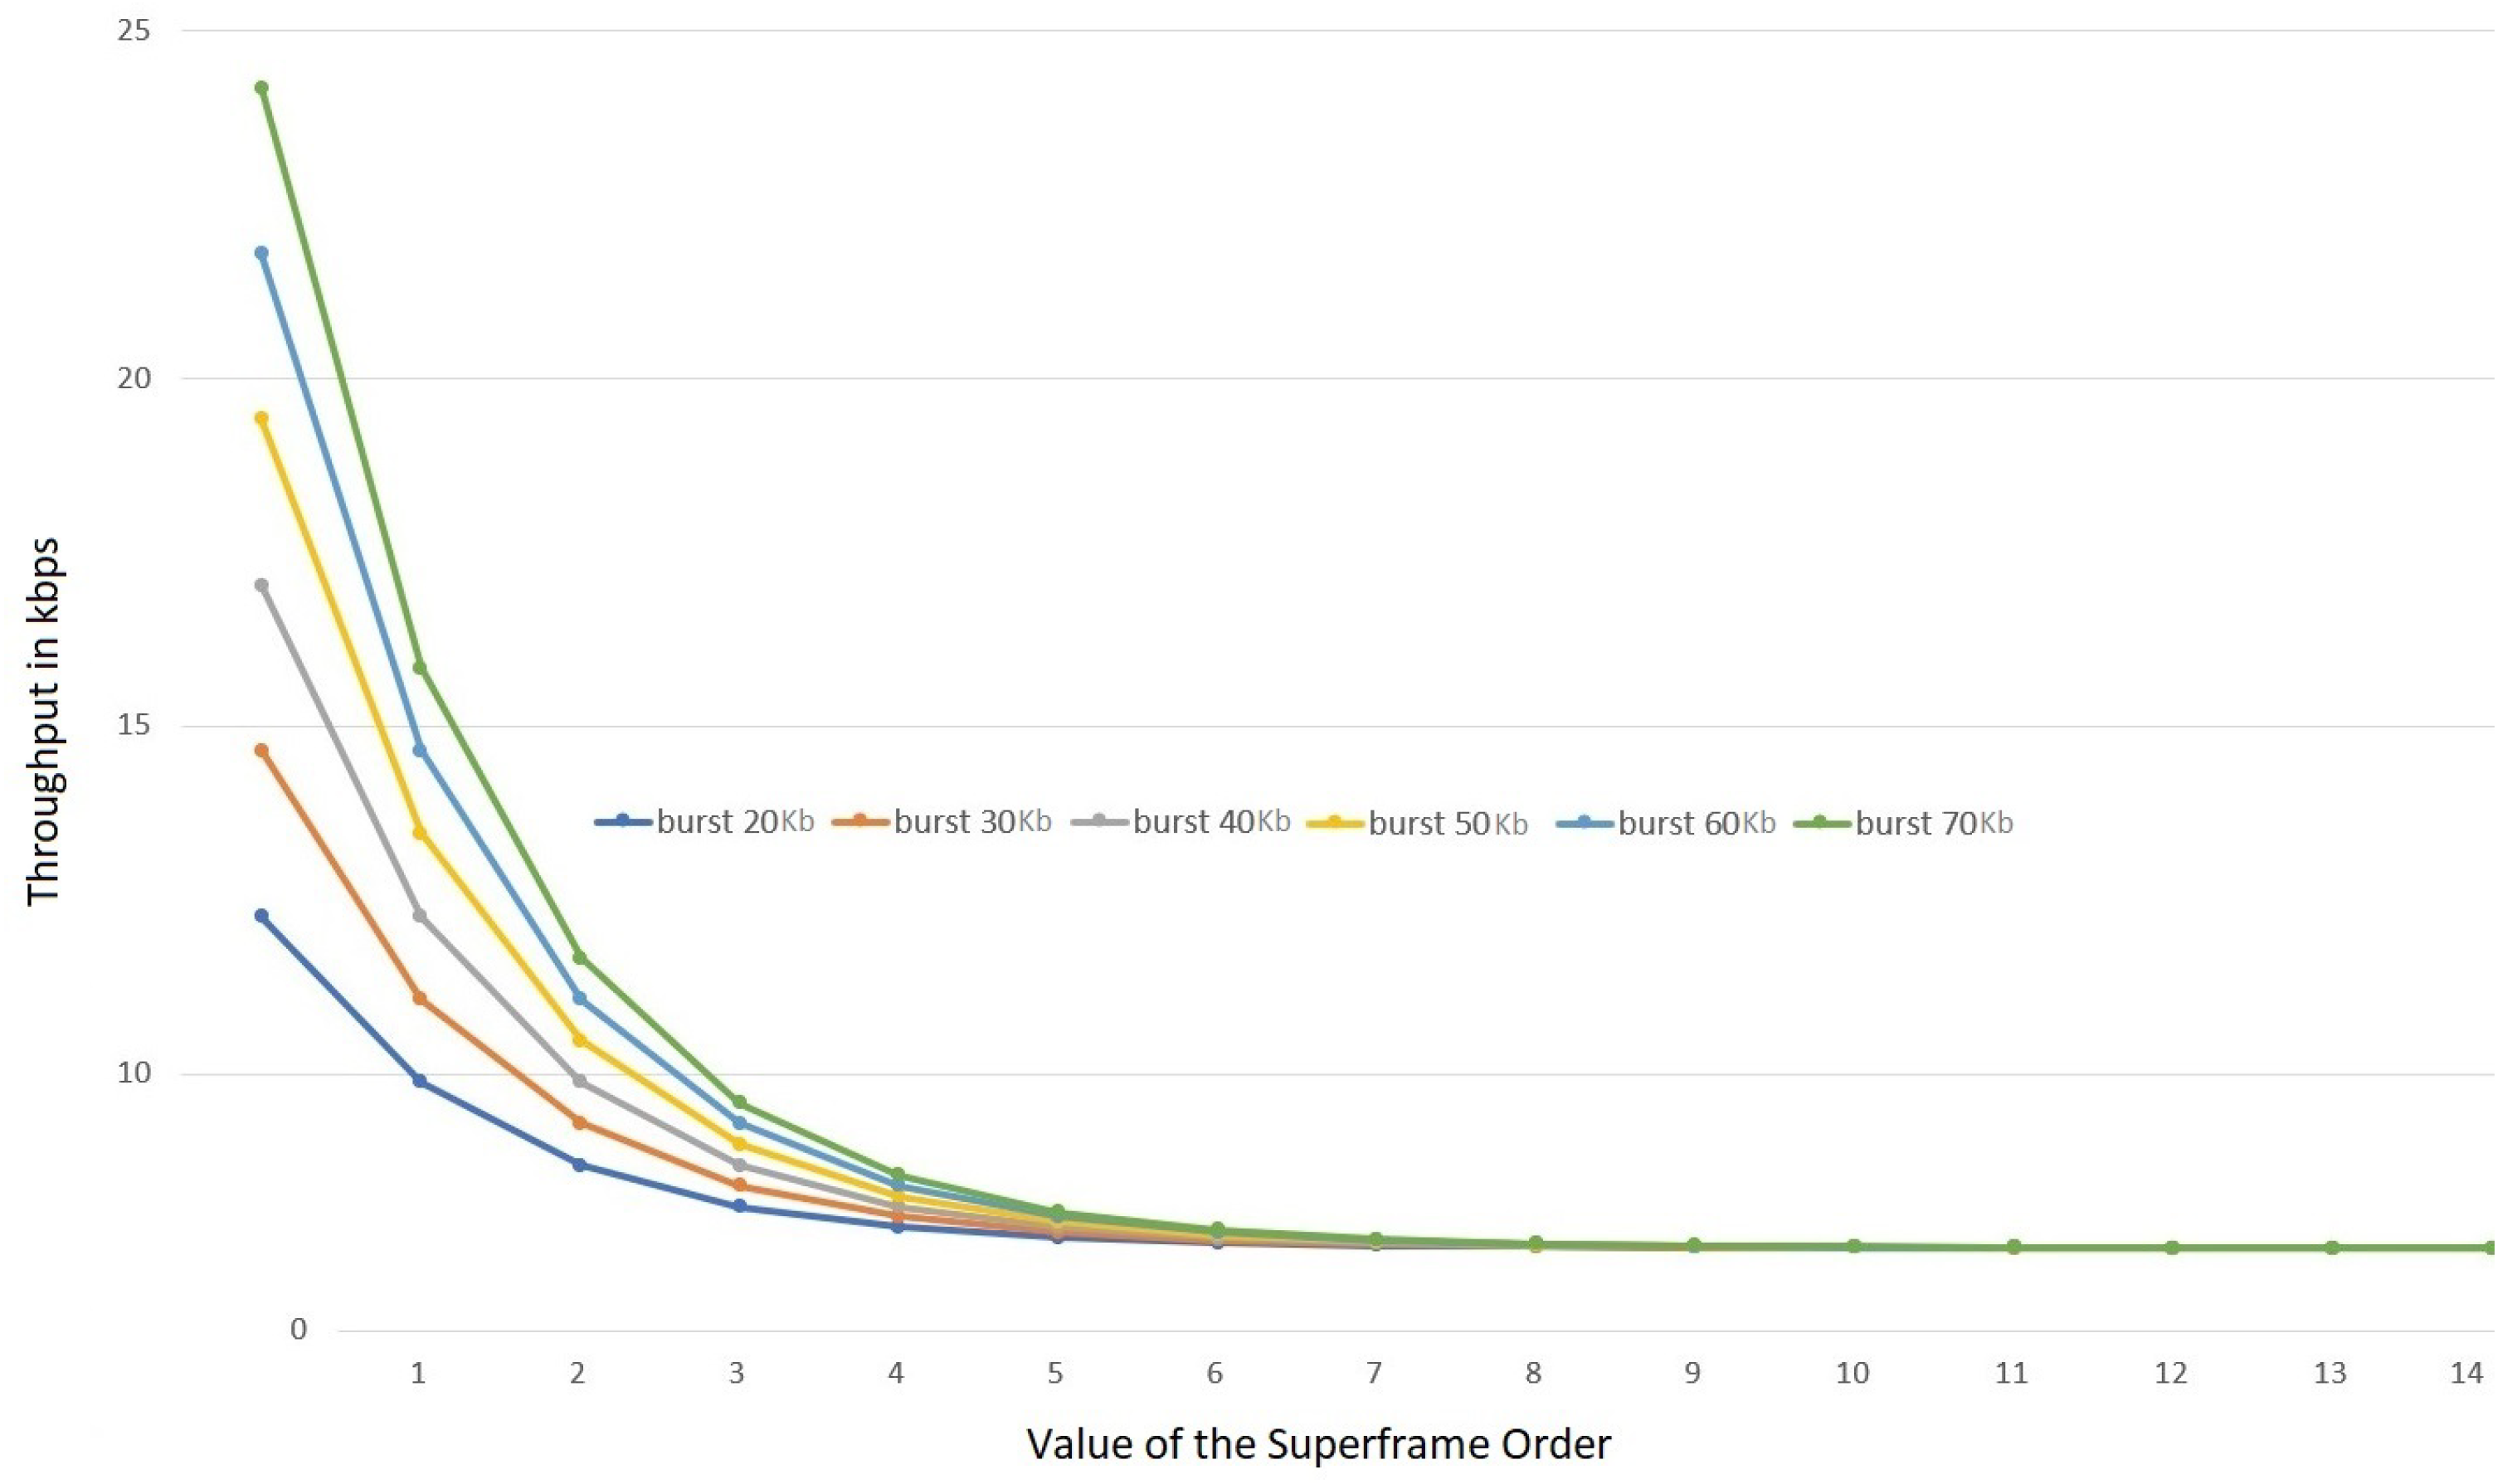
For the next set of experiments, we set the arrival rate to be constant at 120 Kbps and vary the burst sizes to learn its respective impact. From
Figure 8 it is clear that despite the size of the burst, as the superframe order goes higher, throughput reduces steeply. However, the initial superframe orders (0–4) show a larger throughput that is highly dependent on the burst size.
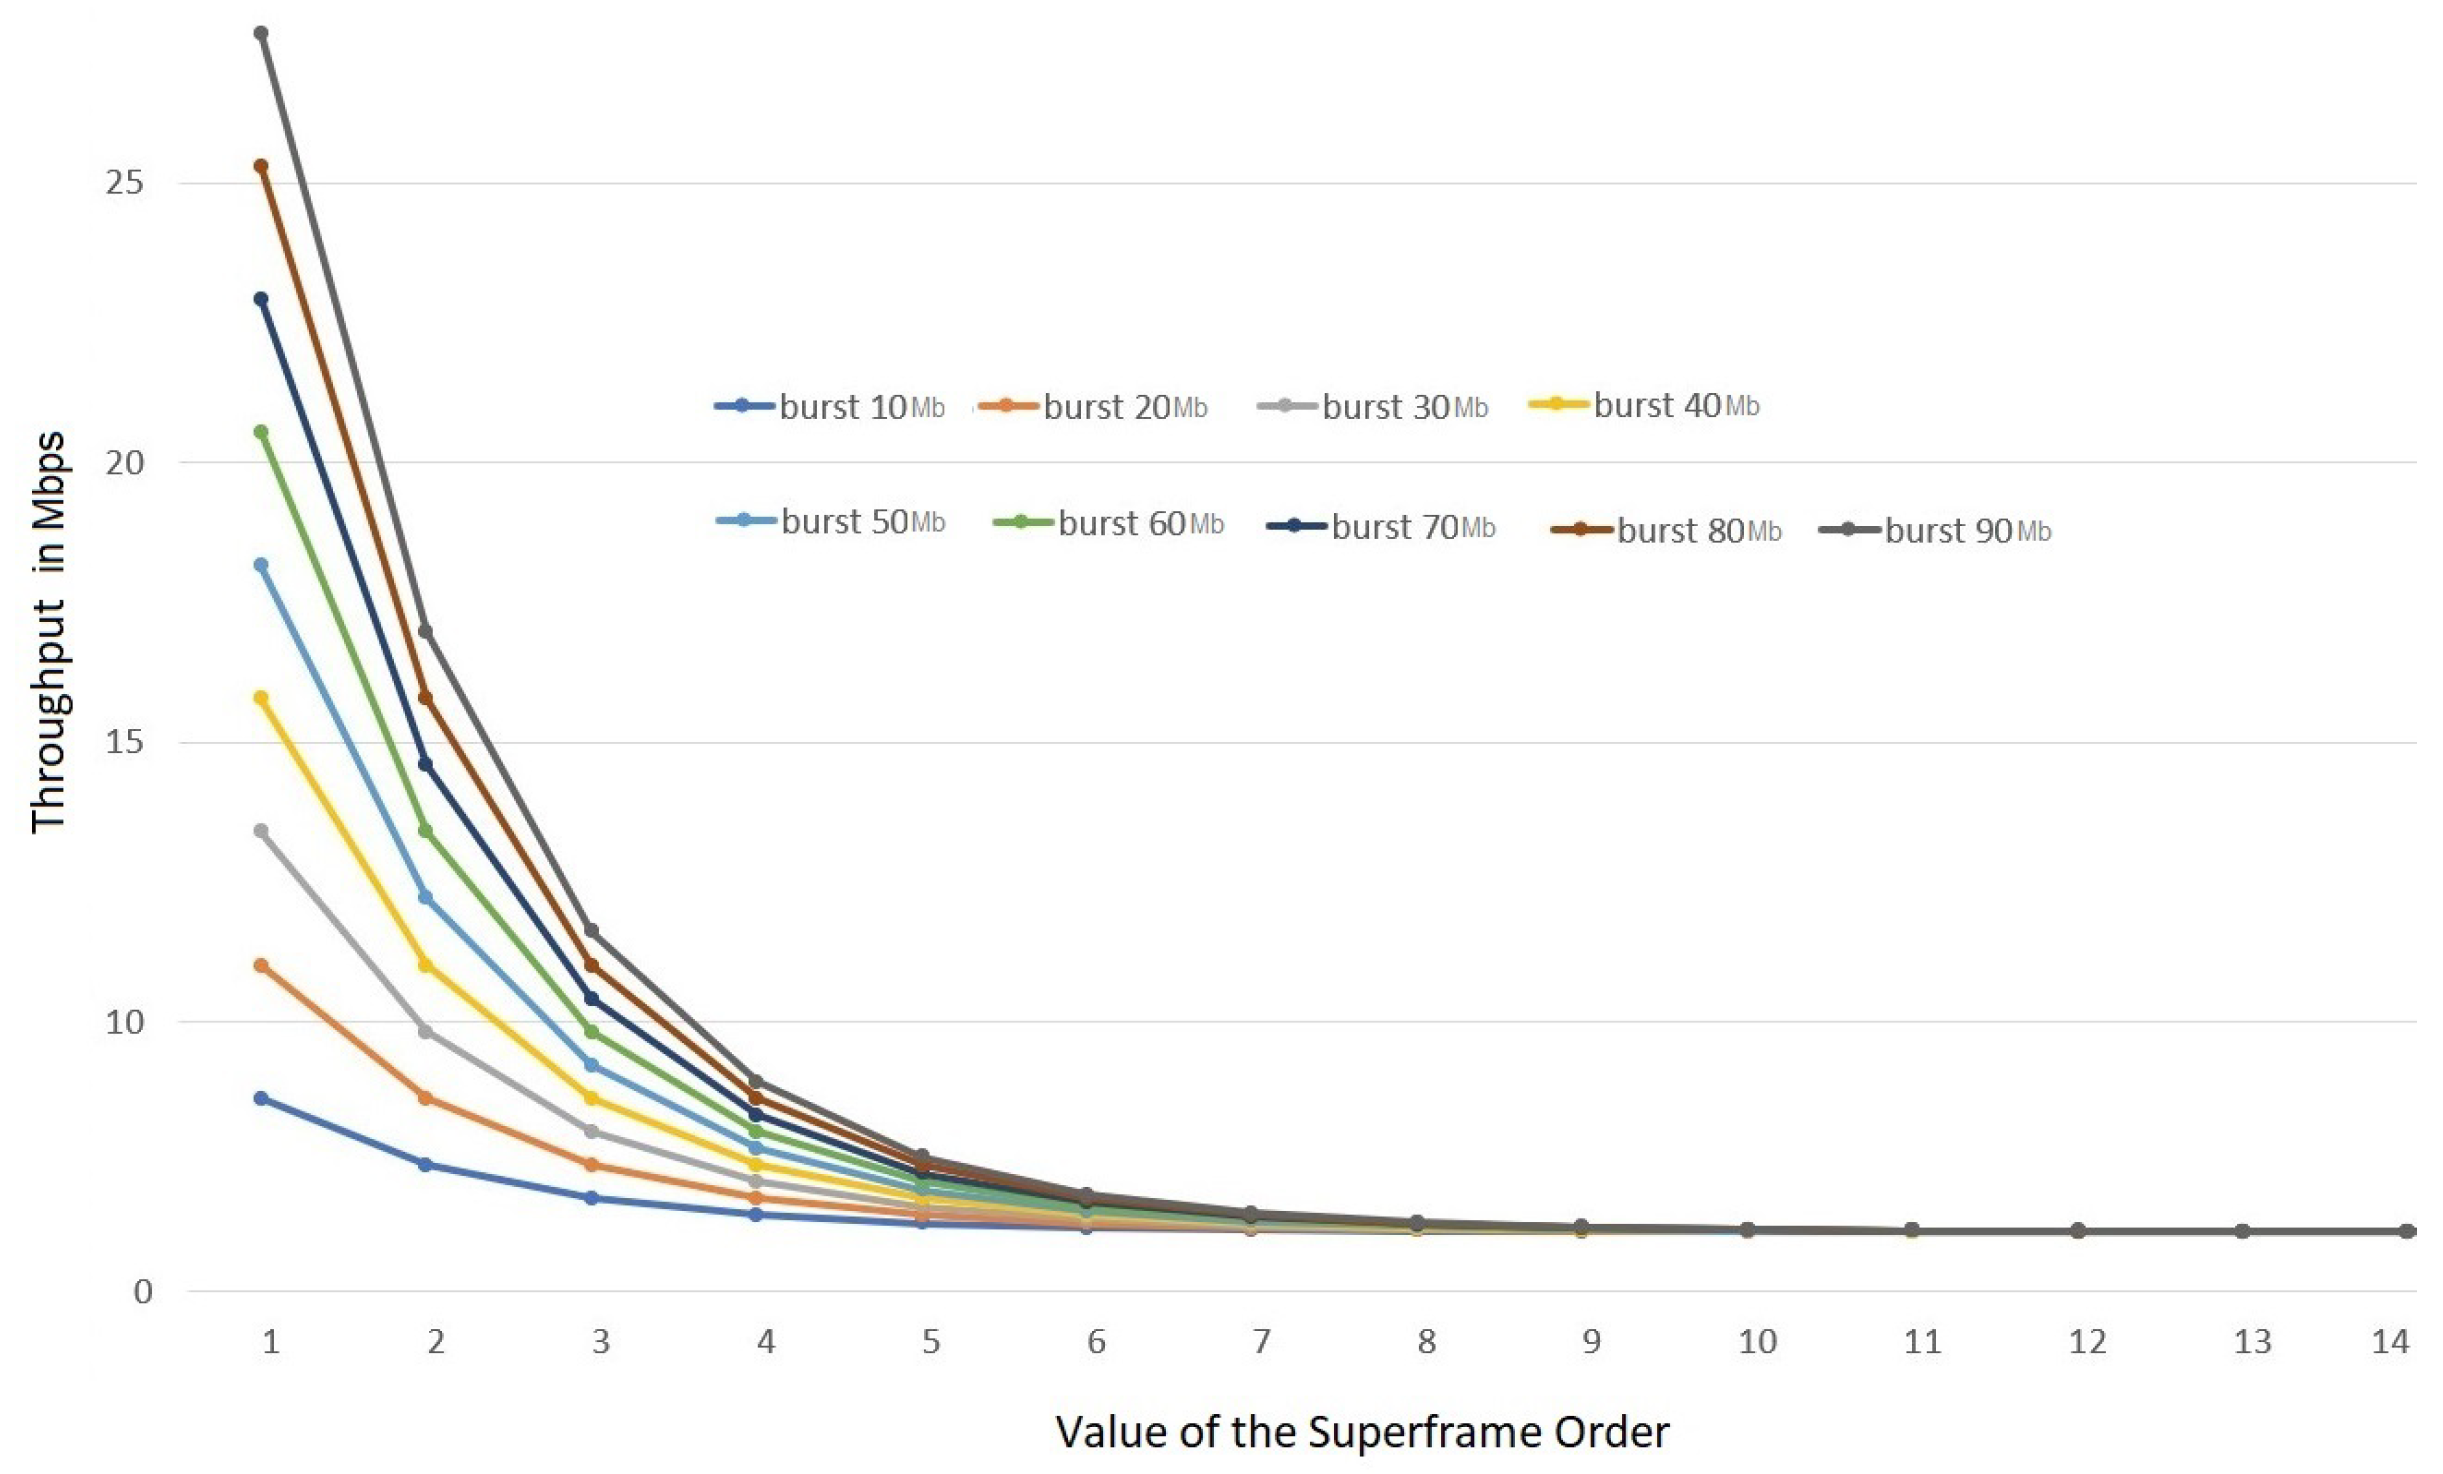
We now repeat the same set of experiments with higher data rates supported by PHY II and PHY III, respectively. For this experiment we fix a data rate of 100 Mbps and vary the size of the burst (10–90 Mb) to learn its impact.
From
Figure 9, we can learn that for these PHY that support higher data rates, they also exhibit a similar behavior to their lower data rate counterparts. As expected, larger bursts originate higher throughput; however, when the superframe order increases, the throughput reduces to almost the same level as of a lower burst size.
An important conclusion we draw from these experiments is that high superframe orders are not guaranteed to ensure efficient usage of GTS allocation in terms of throughput. This is because larger superframe orders will increase the size of the superframe and eventually result in wasted bandwidth, resulting in deterioration of the throughput.
5.2. Delay Analysis
Concerning the timeliness support of IEEE 802.15.7 via its GTS mechanism, it is vital to understand the delay bounds of the system, in to order accurately setup the network to meet the expected timeliness requirements. In
Figure 10, we represent the delay bounds of the VLC network for various superframe orders and different burst sizes. In accordance with PHY III and II, we fixed an arrival rate of 100 Mbps and checked the impact of various burst sizes on the delay.
From
Figure 10, we can see that the delay increases with the increase in the superframe order. In the case of lower superframe orders, the variance in delay is only 10–30 optical clocks. The increase in the value of the superframe order results in the increase in the size of the superframe and the timeslots, which in turn can introduce wasted bandwidth. This can result in a significant (10 fold) increase in the network delay for larger
SO, if the network designer does not carefully consider this issue.
5.3. Scalability Analysis
The IEEE 802.15.7 provides a rigid superframe structure in regard to its GTS mechanism, to support time-critical traffic. For contention free communication the standard supports seven guaranteed timeslots in every superframe. If more nodes need to use the service, they must wait for the adjacent superframe for an opportunity to transmit the data. This creates an increase in delay due to unavailability of bandwidth. Our model enables us to compute these delay bounds as we will show next.
For this experiment, each transmission corresponds to a unique node, thus in this experiment we showcase the impact of the addition of multiple nodes into the network. To showcase this phenomena, we take a fixed superframe order of six and vary the number of transmissions, analyzing its delay and bandwidth utilization. As the value of
SO is six, we have a timeslot length of 960 optical clocks and a CFP length of 6720 optical clocks. In
Figure 11, it can be noticed that until the seventh transmission, the delay increases linearly and the total available bandwidth keeps on decreasing. At the seventh transmission there is no more bandwidth in the current superframe and any other transmissions by other nodes must wait until the adjacent superframe to transmit the data, hence a steep increase in delay is visible.
Scalability is increasingly a major IoT requirement to carry out fine grained monitoring of physical properties such as in ref. [
32]. In such application domains, it is expected to find a hundred nodes relaying time-critical data to a sink. A rigid GTS structure will be a deterrent to such scenarios. Interestingly, as already mentioned, the IEEE 802.15.4 supports a quite similar GTS communication service, which also supports seven GTS. Having scalability in mind, the IEEE 802.15.4 introduced a technique called CAP reduction by which one can replace the CAP region of the adjacent superframe with additional GTS.
In some of our previous works, we explored the CAP reduction functionality of IEEE 802.15.4 and carried out a detailed performance analysis [
33]. Additionally, we proposed a dynamic switching of CAP reduction for better performance [
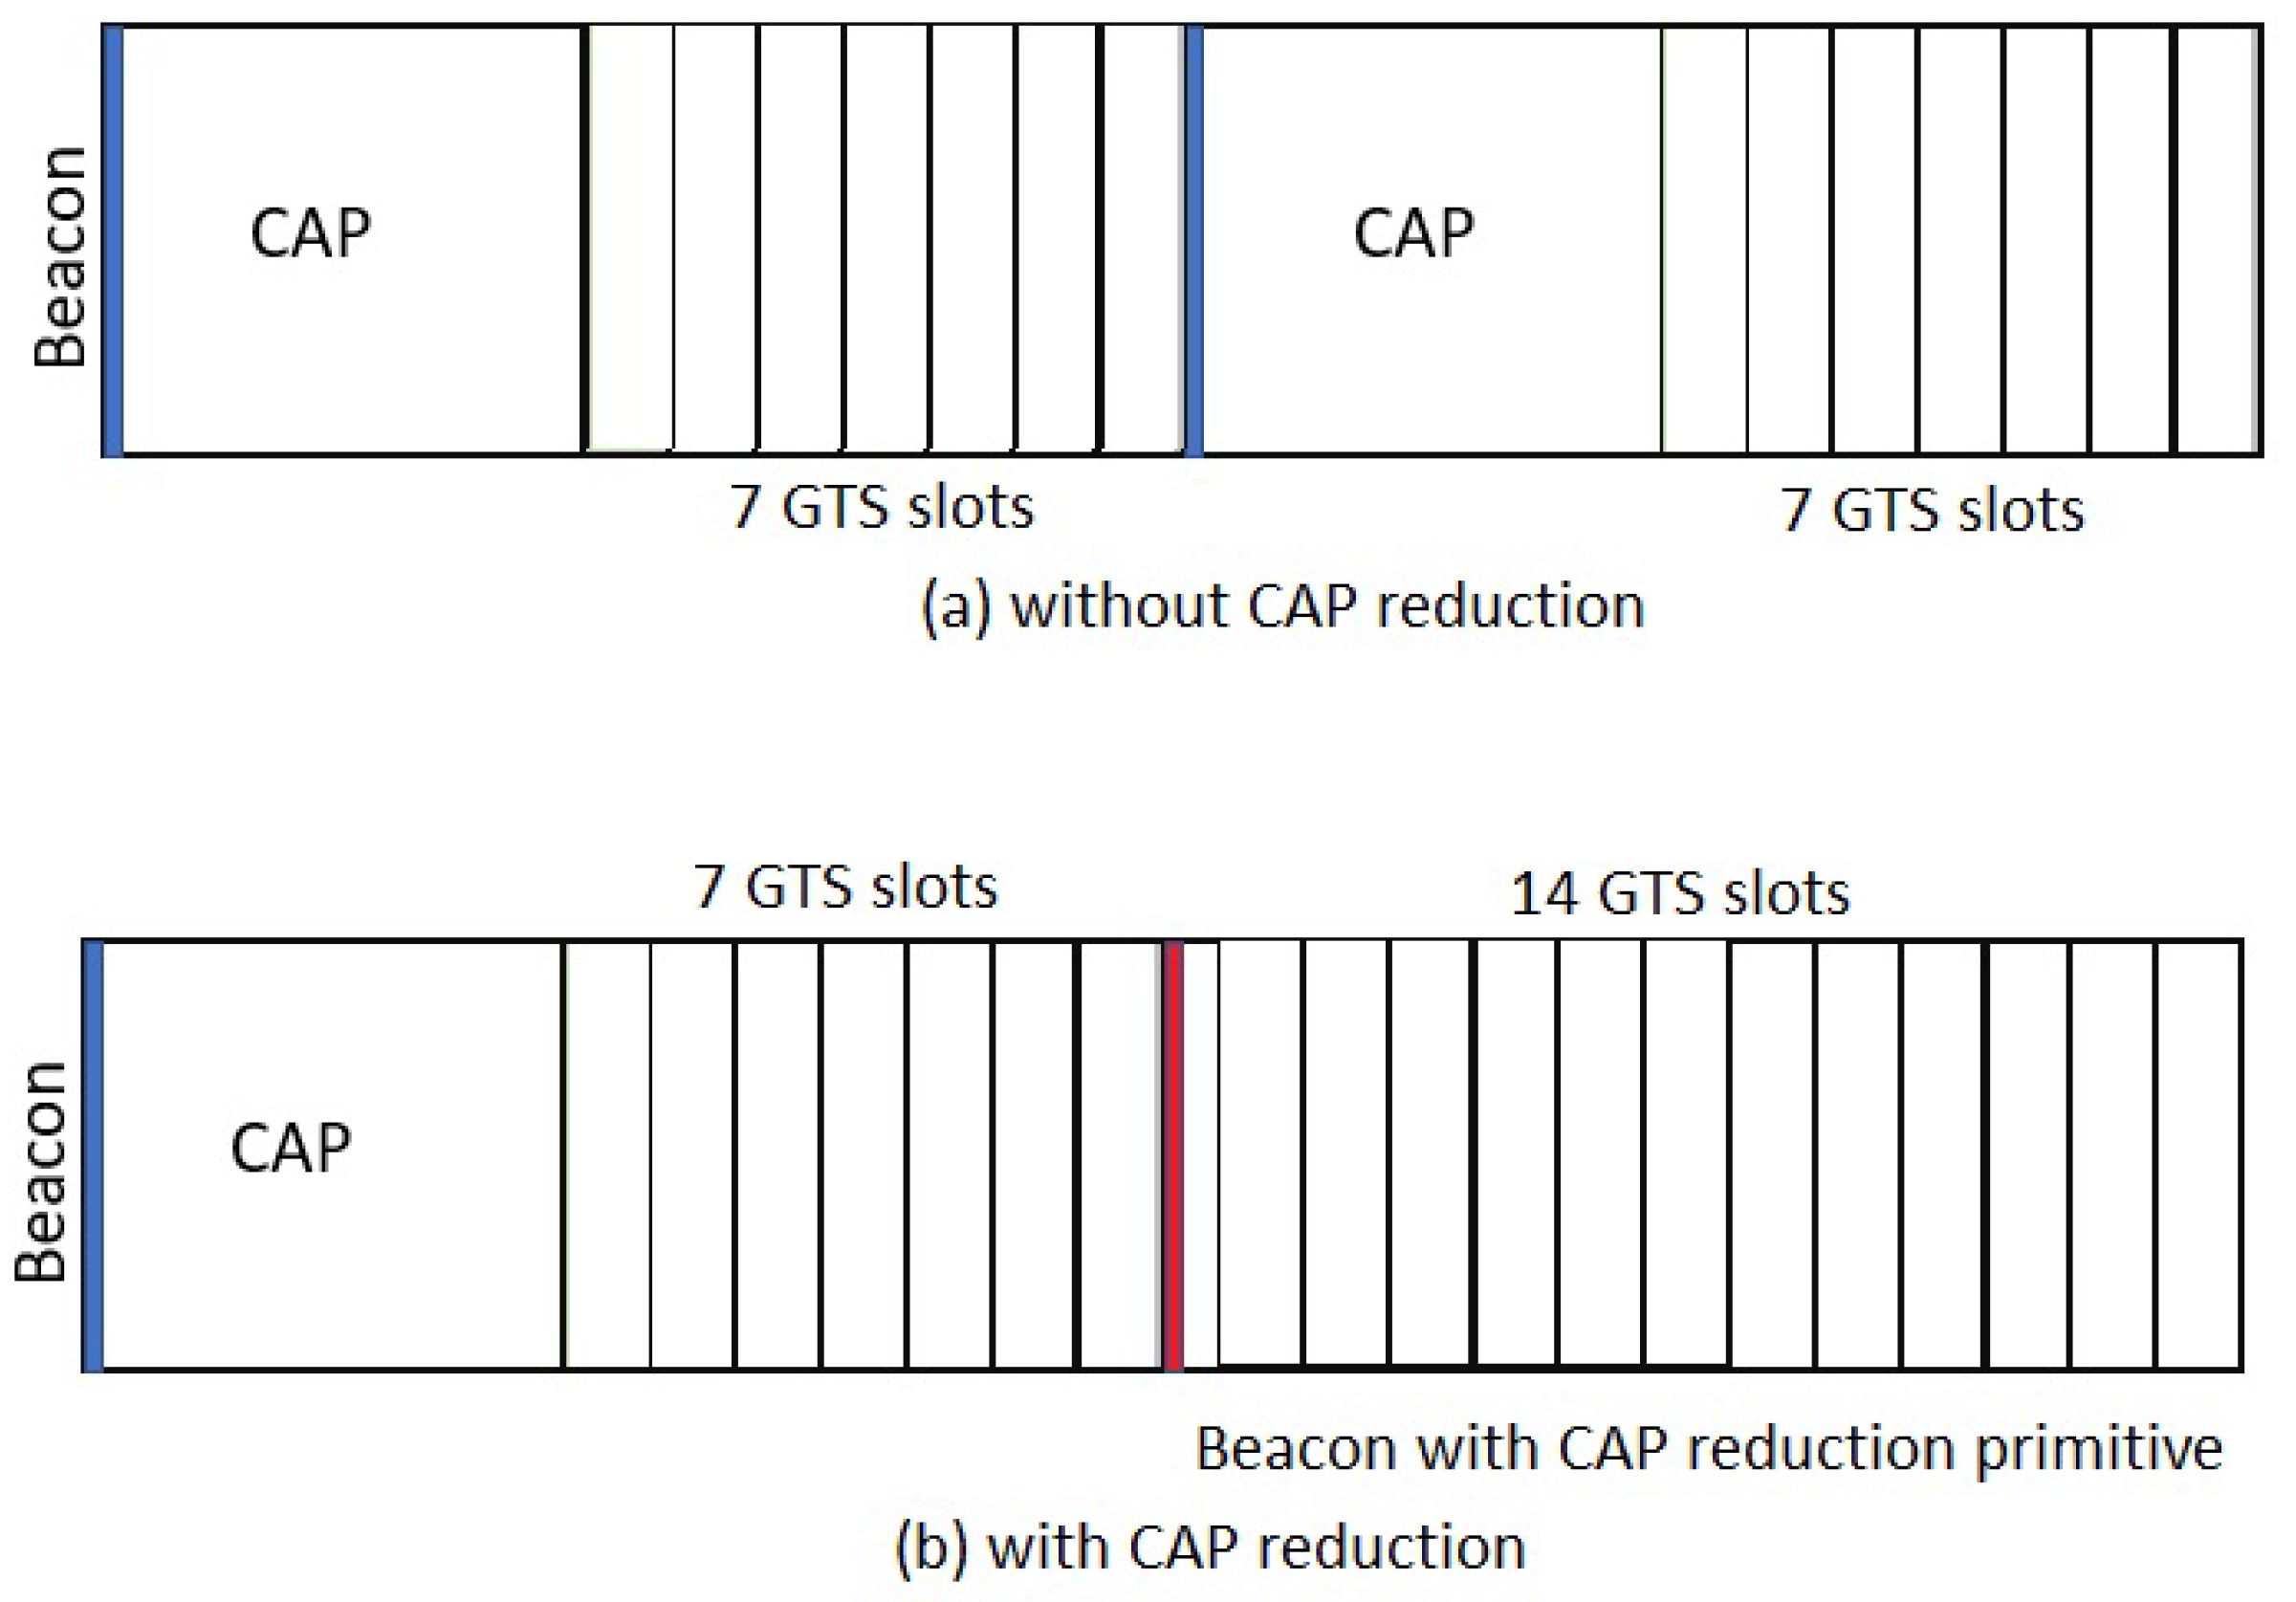
34]. In this work, we now propose to briefly analyze the impact of such a CAP reduction technique for IEEE 802.15.7 networks. With this mechanism, the CAP region of the adjacent superframe will be replaced with seven GTS as shown in
Figure 12b making an extended CFP region with 14 GTSs. Importantly, the implementation of this mechanism imposes the design of additional complexity into the protocol. For supporting CAP reduction, one must include in the Beacon payload a primitive to announce the triggering of the CAP reduction mechanism to all the nodes in the network. It is also important to set up a concept similar to what is know as mutisuperframe (in IEEE 802.15.4) into this protocol. However, the actual implementation of the technique goes beyond the scope of this paper and is to be addressed in future work. To carry out what we propose, it suffices to introduce the necessary changes into the theoretical model.
We take the architecture in
Figure 12b to analyze the impact of CAP reduction on IEEE 802.15.7 networks. We redo the same scalability test but with CAP reduction enabled. It is very evident that the delay is reduced as the transmissions at the end of the first superframe need not wait 6720 optical clocks to get accommodated in the adjacent superframe. Due to the addition of 14 additional GTS slots, there is a significant increase in the available bandwidth and results show a steady increase of its usage as expected.
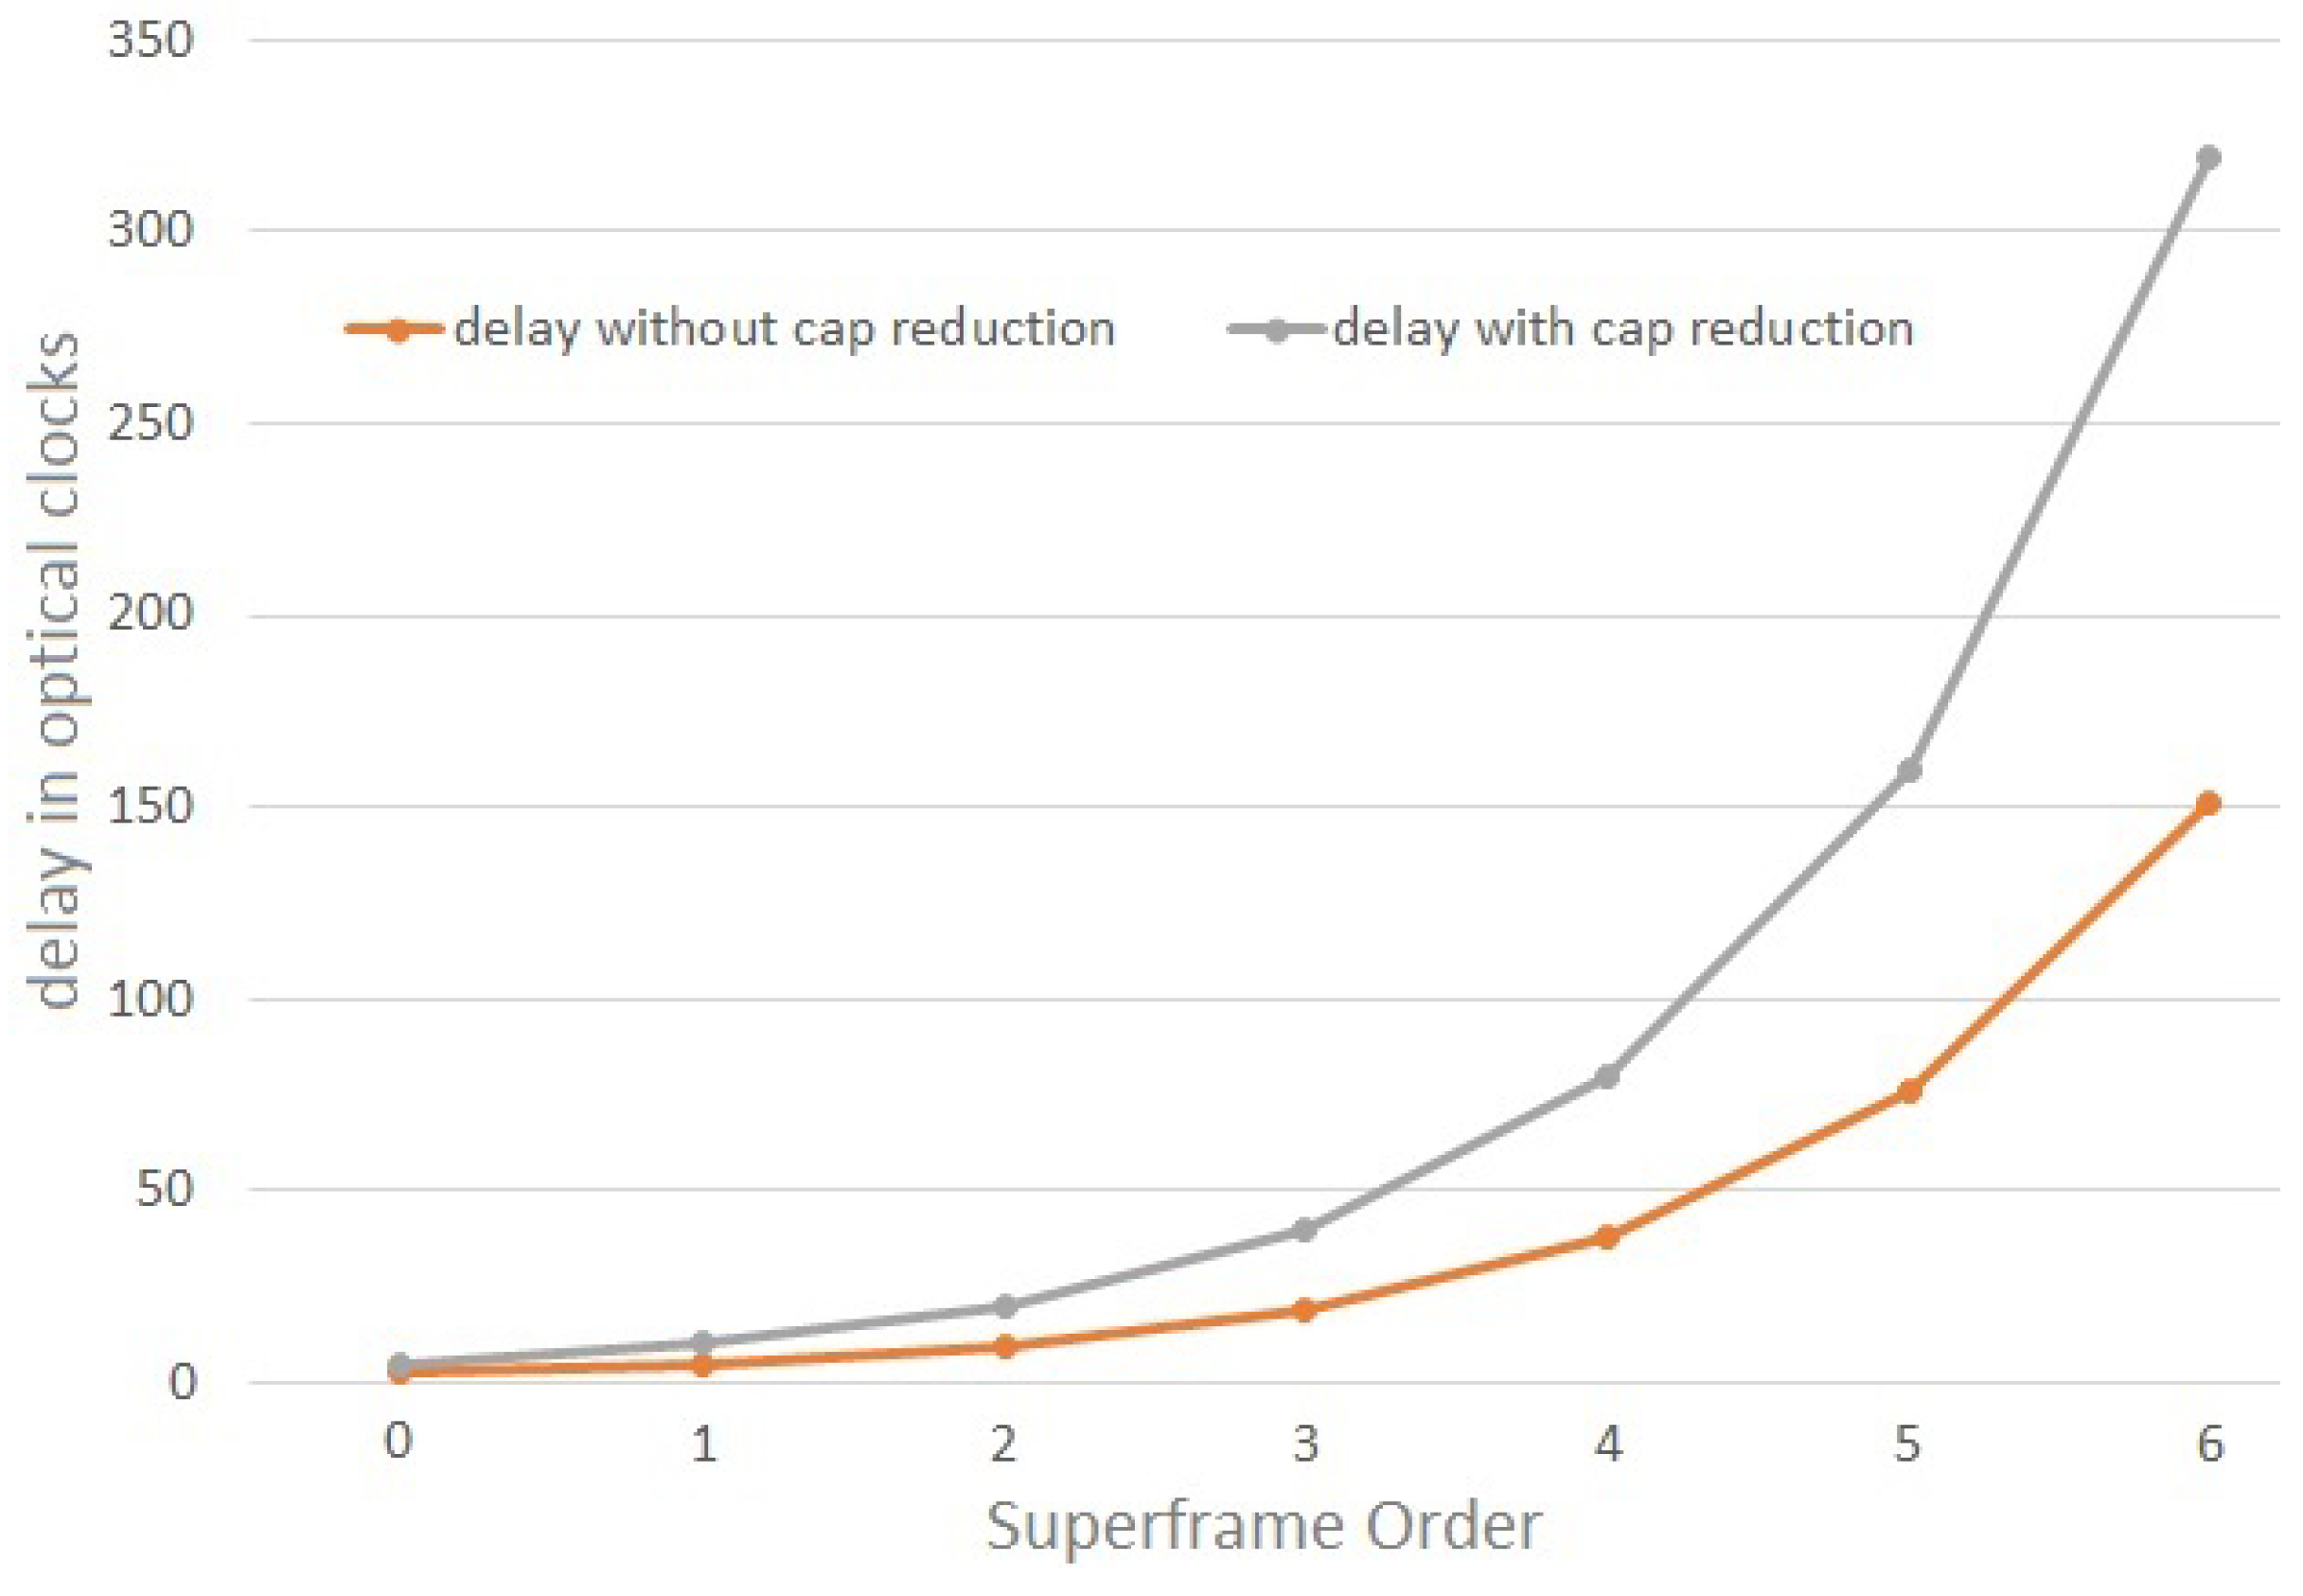
As much as the CAP reduction technique increases the available bandwidth of the network, it must be noted that having a static CAP reduction technique can also have some adverse results. For instance, we took a data set with a burst of 10 Mb and an arrival rate of 100 Mbps and verified the delay over the network. In this case, we analyze a single packet of data transmitted over the superframe; in such cases, there can be a wastage of bandwidth. For a superframe order of 10 the beacon interval would be 4300 optical clocks, when we employ CAP reduction and join an adjacent superframe, the entire available beacon interval would increase to 6451 optical clocks. In such a case, the nodes have to wait a much larger interval of time to get transmitted.
We showcase this technique over six superframe orders, we refrain from showing the higher order superframes as the delay increases very steeply.
From
Figure 13, it is clearly visible that for the lower superframe orders, the difference in delay against CAP reduction is quite small as the size of the superframe in itself is smaller. When the value of
SO increases, the size of the superframe increases along with the total available bandwidth. In cases like the one mentioned before, where only one transmission is taken into consideration, the variance in delay becomes quite significant over the value of the superframe order due to wastage of bandwidth. To avoid such adversities there is need for efficient switching techniques that would switch off and on the CAP reduction to facilitate the network with the required bandwidth.
6. Discussion and Future Work
In this paper we have derived the expressions to calculate the worst case bounds of the time-critical mechanisms of IEEE 802.15.7. We also provide an in depth numerical analysis of throughput and delay bounds of the VLC network. Such analyses are paramount to accurately design such VLC networks to meet the desired delay requirements imposed by the application. In fact, as observed, high superframe orders are not guaranteed to ensure an efficient usage of the GTS mechanism, as despite the increase in available bandwidth, there is also a significant increase in delay. Such trade-off must be accounted by the network designer. Furthermore, we also explored the variance in the performance for the different PHY layers of this protocol. Despite the high data rate PHYs, supporting large throughput, if the MAC network settings are not adequate, such benefits can actually harm the efficiency of the network due to the same above-mentioned reasons.
We also proposed and analyzed the impact of a CAP reduction technique to improve the scalability of these network infrastructures, without a steep increase in delay. We also observed that in cases of sporadic traffic, there must be an efficient switching of this technique to ensure proper utilization of the available bandwidth.
Overall, VLC time-critical supporting features are quite interesting for many applications, but these can be further improved with additional mechanisms. Many of those techniques have already been explored for protocols such as the IEEE 802.15.4, and an evaluation study of such adaptation would be in order. First there is a need for additional flexible mechanisms that can improve the stock performance of these networks and enable a more efficient usage of guaranteed bandwidth. For instance, as shown in the analysis, unused GTS slots result in wasted bandwidth, and those have an impact on the overall delay performance of the network. Mechanisms such as ref. [
33,
34] could be deployed, with minimum adaptations into these networks to enable flexible superframe order tuning. Also, possibilities of sharing GTS slots have also been explored in ref. [
35] could enable a more efficient usage of this resource without imposing change in superframe size. Such proposals if coupled with the possibility of efficient routing can further decrease the latency and improve the overall reliability of the network. In its radio frequency based counterpart standards that support low-rate communication, there have been works [
36,
37] that rely on efficient scheduling algorithms and routing layers (RPL) to achieve such goals. The same principles could be applied.
Furthermore, although the best-effort mechanisms were not explored in the analysis carried out in this work, it is clear that traffic differentiation techniques such as ref. [
38] should be explored for improved performance and support of different traffic performance levels.
Finally, the IEEE 802.15.7 standard does not provide any specific security mechanism. In safety oriented applications like vehicular communication and body sensor networks, a strong security infrastructure is mandatory to assure the veracity of the data. However, from some research works based on security [
39] on low-rate wireless sensor networks it is evident that the network suffers in terms of latency when there is an overhead due to stronger security. Hence, there is a need for low weight security mechanisms that will not greatly diminish the Quality-of-Service of the overall network.
Many of these techniques have been successfully evaluated in low-rate communications standards such as the IEEE 802.15.4, which as observed, closely resembles the structure of 802.15.7 [
40]. Such advantage should be further explored by migrating, with the necessary adaptations, such mechanisms into this VLC counterpart to maximize the already powerful potential of visible light communications, particularly in critical applications.


