Abstract
This experimental study focuses on the comparison between two different sensors for vibration signals: a magnetoresistive sensor and an accelerometer as a calibrated reference. The vibrations are collected from a variable speed inductor motor setup, coupled to a ball bearing load with adjustable misalignments. To evaluate the performance of the magnetoresistive sensor against the accelerometer, several vibration measurements are performed in three different axes: axial, horizontal and vertical. Vibration velocity measurements from both sensors were collected and analyzed based on spectral decomposition of the signals. The high cross-correlation coefficient between spectrum vibration signatures in all experimental measurements shows good agreement between the proposed magnetoresistive sensor and the reference accelerometer performances. The results demonstrate the potential of this type of innovative and non-contact approach to vibration data collection and a prospective use of magnetoresistive sensors for predictive maintenance models for inductive motors in Industry 4.0 applications.
1. Introduction
It is known that vibrations can degrade or cause many problems in industrial equipment and machinery [1]. The information gained from the vibration signals can be used to predict catastrophic failures, to reduce forced outages, to maximize utilization of available assets, to increase the life of machinery, and to reduce maintenance costs related to the health of machinery.
First, it is important to understand what a vibration is. It can be understood as a movement or mechanical oscillation of an object’s equilibrium position, be it industrial equipment or infrastructure, and can be periodic or random. Focusing on industrial machines, the existence of vibration can be an indication of the existence of a problem or deterioration of the equipment. If the causes are not identified and corrected, the undefined vibration itself can cause additional damage. The effects of vibration can be severe, causing noise, excessive energy consumption and, in the worst case, can damage the equipment so severely that it leaves it out of service. The main causes of rotary machinery vibration are well defined, and it is known that they arise due to imbalance, misalignment, wear or looseness in bearings and other components [2]. The degradation of the functioning of many mechanical components can be correlated with a change in the vibration spectrum [3], which is why vibration analysis is one of the most popular predictive maintenance techniques.
In the context of predictive maintenance, one of the strengths of Industry 4.0 is that it is important to continuously monitor machines to predict which parts are likely to fail and when. In this way, maintenance can be planned, and there is an opportunity to replace only parts that show signs of deterioration or damage. Machine vibration is one of the most common measurements in rotating equipment monitorization. Machine-mounted sensors are key components in vibration measurements and analysis. A full spectrum vibration signature can be obtained with measurements in three axes (horizontal, vertical, and axial). The accelerometer is typically used for low-to-medium frequency measurements on different parts of the equipment. In this work, another type of sensor, the magnetoresistive sensor, was tested to measure vibrations in rotating machines to establish a comparison with an accelerometer and validate the use of this type of sensor in the analysis of vibrations.
Many scientific works have been produced regarding the analysis of vibrations in motors for predictive maintenance purposes. In [4], a case study is presented for vibration analysis of electrical motors, performed under different speed conditions by means of measurements of an accelerometer. In [5], a system of neural networks was implemented for predictive maintenance in electric motors to detect the type of failure based on the analysis of vibrations. In [6], monitoring of the induction motor condition is presented through vibration analysis techniques.
Vibrations are detected by measuring displacement, velocity, and acceleration, and the piezoelectric or capacitive accelerometer is the most used sensor for making these measurements. However, there are other types of sensors that have been developed and adapted for measuring vibrations. In [7], it has been shown that magnetic sensors are quite sensitive to detect vibration by measuring the magnetic field strength and can be a low-cost alternative to the accelerometers. Magnetoresistive sensors are characterized by their high sensitivity and can be a very interesting solution. Besides vibration analysis, the magnetoresistive effect is commonly used in navigation systems [8], crankshaft position sensors [9] or magnetoresistive heads in disk drives [10], among other applications. In [11], the authors present the principles of its operation and the potential applications for industrial scenarios.
Another issue that is discussed by the scientific community is the use of non-contact instrumentation, and sensors based on magnetoresistive effect offer this possibility unlike the accelerometer that needs to be rigidly attached to analyzed equipment. One of the works where magnetoresistive sensors are used for vibration analysis is presented in [12], in this case focused on turbo-machines. Another very interesting work was developed in a master thesis [13], where the author studies the use of giant magnetoresistance sensors (GMR) in the detection of vibrations.
Accelerometers are widespread in the industry, but due to their high sensitivity and high level of integration, the magnetoresistive sensor can be as well a real alternative for measuring vibrations in industrial equipment. Based on this, present work demonstrates that it may be possible to obtain a proper vibration spectrum based on different types of sensors, and, depending on the application, one can choose the type of sensor for the most appropriate solution. Due to the high sensitivity of the magnetoresistive sensors, a lot of noise can be acquired over a wide range of frequencies; therefore, it is essential for the acquisition systems to overcome this and through well-designed filters to select the desired spectrum range. This work was developed for vibration analysis in induction motors but can be easily tested on other types of machines presented on the shop floor.
The remainder of this paper delves into the description of the proposed comparative study with the contents organized as follows: Section 2 describes the magnetoresistive sensor and electronic circuit board. Section 3 presents the proposed experimental setup and methodology. Section 4 introduces the results and discusses the comparative study, focused on spectral analysis evaluation of both sensors’ performance, when applied in an induction motor enabled with a load with an adjustable vibration setup. Finally, in Section 5, conclusions, ongoing and future works are discussed.
2. Magnetoresistive Sensor
The magnetoresistive sensor was developed by INL—International Iberian Nanotechnology Laboratory. It comprises a magnetic sensing layer stack, a magnetic reference layer stack and a tunnel barrier between the magnetic sensing layer and the magnetic reference layer stacks. In the absence of an external magnetic field, the magnetoresistive sensor is configured such that an exchange bias pinning the reference layer lies along a reference direction, an exchange bias pinning the sensing layer lies along a first direction that is orthogonal to the reference direction, and the magnetic anisotropy of the sensing layer is parallel to the first direction. The combined action of the magnetic anisotropy and sensing layer exchange coupling creates a well-defined direction along which the free layer rests in the absence of an external field. Under the influence of a magnetic field along the reference direction, the sensing layer magnetization rotates smoothly and uniformly. Thus, a high quality linear response can be achieved with no shape anisotropy [14].
The stacks consist of 464 magnetic tunnel junction (MTJ) elements connected in a series to minimize the noise of the sensor [15]. The size of each MTJ sensor is m, while electronic pads are m and separated by 250 m. The MTJ stack consists of (unit: nm) 5 Ta/15 Ru/5 Ta/15 Ru/5 Ta/5 Ru/20 IrMn/2 CoFe/0.85 Ru/2.6 CoFeB/MgO [25 k]/2 CoFeB/0.21 Ta/4 NiFe/0.20 Ru/6 IrMn/ 2 Ru/5 Ta/10 Ru [16]. As depicted in Figure 1, from data measured at INL premises, the sensor presents a short linear range (4 mT) that is adequate for applications that require high sensitivity levels, such as vibration in motors, metallic canister detection in high speed convey belts, among others. The remaining specifications of the MTJ sensor are:
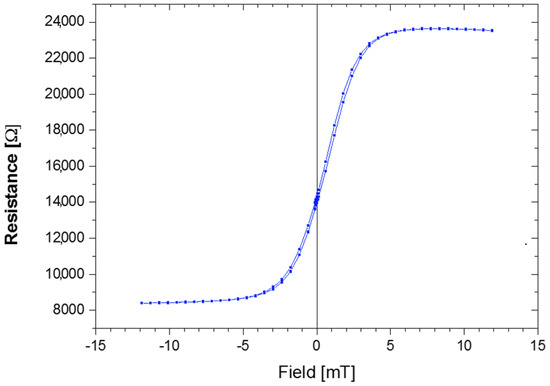
Figure 1.
Measured resistance variation of the magnetic tunnel junction (MTJ) sensor with magnetic field.
- Bias voltage between 0 V and 54 V;
- Bias current: 156 A;
- Output voltage: 223 V output voltage/1 V bias voltage/1 T magnetic field.
2.1. Printed Circuit Board
For the purpose of this investigation, four MTJ sensors were etched in a full Wheatstone bridge die structure to compensate for thermal drift and other effects. When an external magnetic field is applied normally to the side of the sensor, the magnetization vector will rotate and change the angle . This will cause the resistance value to change and produce a voltage output variation in the Wheatstone bridge. This change is directly related to the angle of the current flow and the magnetization vector. Two bridge dies were mounted in a Printed Circuit Board (PCB) shown in Figure 2c (the bridge dies are located on the opposite side). In each square from Figure 2b, there are two series of MTJs, one for each bridge, with the reference layer (RL) in the same direction:
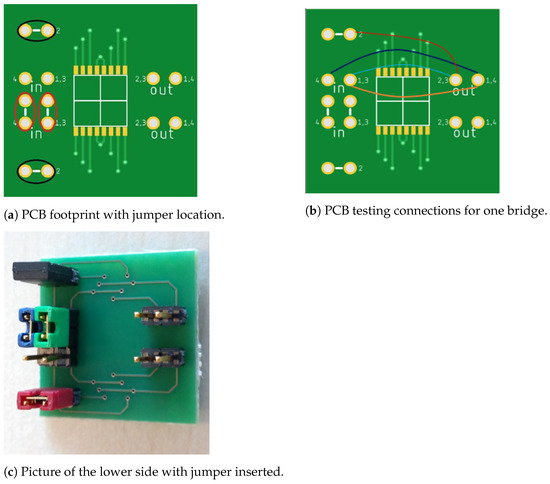
Figure 2.
PCB of the magnetoresistive sensor.
- Top left, the RL is up;
- Top right, the RL is down;
- Bottom left, the RL is left;
- Bottom right, the RL is right.
With this arrangement, the top elements are sensitive to the Y direction, while the lower elements are sensitive to X direction. Thus, both bridges are sensitive to X and Y directions of the magnetic field. The PCB was designed with several connection points, or jumpers, to facilitate individual characterization of each MTJ sensor from the bridge arms. This is a useful technique to understand the bridge offset.
From Figure 2b, the pins of the top half are connected to one bridge and the bottom half to the other bridge. All jumpers must be removed to measure the isolated elements (MTJ resistance). As an example, if the measurement is done between pins:
- 1,3 and 1,4: Resistance 1 is measured;
- 2 and 2,3: Resistance 2 is measured;
- 1,3 and 2,3: Resistance 3 is measured;
- 4 and 1,4: Resistance 4 is measured.
The same approach can be followed to the bottom part of the board to measure the resistance of isolated element from the other bridge.
From Figure 2a, when a jumper is placed in the leftmost upper jumper, the top bridge is formed. On the other hand, if a jumper is placed on the leftmost lower jumper, the bottom bridge is formed. To measure the bridges, the horizontal jumpers, on top of the horizontal white stripes, should be placed. If the vertical jumpers are disconnected, on top of the vertical white stripes, each bridge needs an input signal, and if they are connected, the input signal is shared. The output signal of each bridge is accessed between pins 2,3 and 1,4, where the word “out” is written under them.
2.2. Acquisition Circuit
The block diagram of the acquisition circuit is presented in Figure 3. 2The block diagram of the acquisition circuit is presented in Figure 3. The output voltage of the sensor bridge was input to an amplifier circuit based on AD8429 (Analog Devices, Inc., Munich, Germany) after a 128 gain amplification. Finally, a 24-bit analogue-to-digital converter AD7193 (Analog Devices, Inc., Munich, Germany) with a sampling rate of 4.847 kHz is used for data acquisition and further analysis. The final implementation in a PCB is prepared to work as an Arduino shield, responsible for data communication with a computer or other microcontrollers (Raspberry Pi or similar), via WiFi, SPI or USB interfaces.

Figure 3.
Block diagram of the magnetoresistive sensor circuit.
The physical implementation of the circuit in a PCB board is depicted in Figure 4. Each section of the board is enumerated and described as follows:
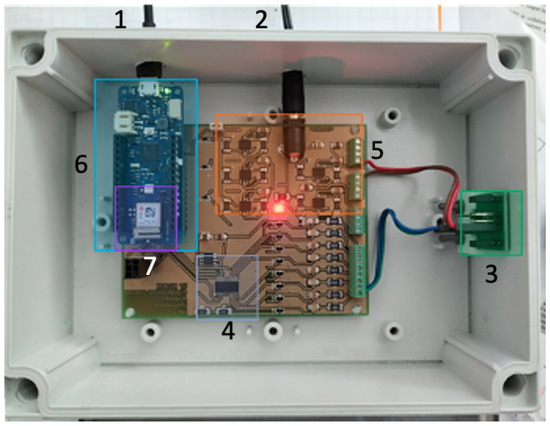
Figure 4.
Physical implementation of the magnetoresistive sensor circuit.
- Communication cable, for programing the microprocessor and retrieving measurement data;
- Power cable or batteries (between 7 V and 15 V);
- MTJ sensor that measures the magnetic field;
- Analog to digital converter with 24 bit resolution;
- Power supply for the MTJ sensor, ADC and microcontroller (Arduino);
- Microcontroller Arduino for collecting data, computing and web server;
- WiFi and Bluetooth communication SoC, to send data wirelessly.
3. Experimental Setup
The experimental setup is composed of an induction motor with variable speed, via a frequency converter. The motor shaft is directly coupled (rigid coupling) to an adjustable load, on which different faults can be emulated, such as misalignments and eccentricities on the motor shaft faults in roller bearings. By manually adjusting the relative position of the load with the motor shaft axis, unbalance and different misalignments can be emulated: angular misalignment, parallel misalignment, or a combination of both. Table 1 presents the maximum allowable defects with the experimental setup.

Table 1.
Maximum defects allowable with the experimental setup.
The specific equipments that are used in this experiment are:
- Motor drive
- A frequency converter from GUNT Hamburg.
- Tachometer
- An inductive sensor from FESTO, and associated display electronics, to measure the rotation speed of the motor (rpm).
- Electric motor
- A motor from Industrie Elektronik (typ. LGHA 63) whose characteristics are:
- Power input
- P = 0.2 kW;
- Motor speed
- n1 = 3000 rpm;
- Voltages
- Ua/Uf = 160/200 V;
- Currents
- Ia/If = 1.6/0.22 A;
- Sf
- 1.0;
- IP
- 44.
where Ua refers to the terminal armature voltage, Uf is the field excitation voltage, Ia is the terminal armature current, If is the field excitation current, Sf is the Service Factor and IP is the Ingress Protection index.
3.1. Accelerometer Setup
Besides the generic equipment described in the previous section, the specific equipments that are used in this experiment are:
- Piezoelectric accelerometer:
- It is a one-axis accelerometer—DYTRAN model 3134D, Madrid, Spain—which operates with a sensitivity of 500 mV/g.
- ICP:® signalconditioner
- It is the model 482A21 Line Powered Signal Conditioner from PCB Piezotronics (Madrid, Spain). This unit provides constant current excitation to the built-in transducer amplifier and decouples the signal from the DC bias voltage.
- ADC:
- It is a NI DAQ 6008 device from National Instruments (Lisbon, Portugal) for connection to a USB port. Its function is to digitize and serialize incoming analog signals so that the computer can interpret them.
- PC:
- Computer running LabView software to process, store and visualize data.
The accelerometer was installed on three different locations of the ball bearing structure to measure vertical, horizontal and axial vibrations, as shown in Figure 5. The accelerometer was fixed using bee wax to ensure a good energy transfer and to minimize spurious effects and damping.
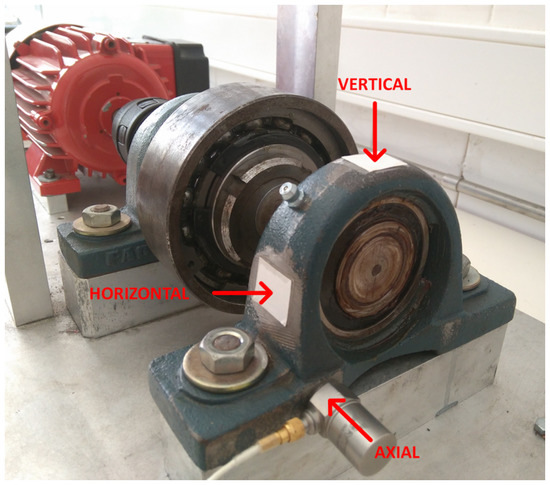
Figure 5.
Motor load with 3 locations for fixing the accelerometer for vertical, horizontal and axial measurements.
Once all the previous connection is complete, a LabVIEW application was programmed to acquire data from NI DAQ 6008, as shown in Figure 6. For that case, the acquired signal must be configured as an analog input (voltage). Since the accelerometer has a sensitivity of 500 mV/g and the NI DAQ device provides a voltage signal that needs to be converted in acceleration, we used the following conversion:
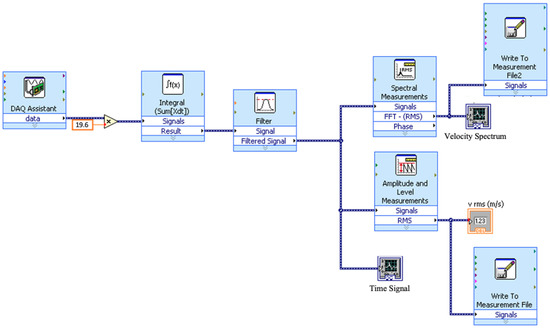
Figure 6.
Extract of the software program, developed in LabView, for acquisition, processing, visualization and storage of the signal.
Afterwards, the acceleration output is integrated to give a proportional velocity signal and filtered by a lowpass filter with a cutoff frequency of 5000 Hz, half of the sampling frequency of the NI DAQ 6008 device. From the resulting FFT, the RMS velocity value is stored in a text file for subsequent analysis. Due to the sensitivity of the accelerometer, and according to Equation (1), the scale factor applied to the acquired signal must be .
Before conducting any measurements, the accelerometer was calibrated using a handheld shaker from PCB Piezotronics, Madrid, Spain—model 394C06 [17]. The shaker consists of an electromagnetic exciter, driven by an oscillator at a frequency of Hz. A small accelerometer provides a servo feedback to maintain a constant vibration level of 1 g. This enables accelerometers with masses up to 210 g to be excited without their mass influencing the reference level. The accelerometer in use weights 48 g, well below the limit imposed by the manufacturer. The accelerometer was screwed to the shaker’s head, as shown in Figure 7a, and the resulting signal acquired. The resulting spectrum in Figure 7b shows a predominant spectral line with a peak at frequency Hz, a 0.15% deviation compared to the shaker reference frequency ( Hz).
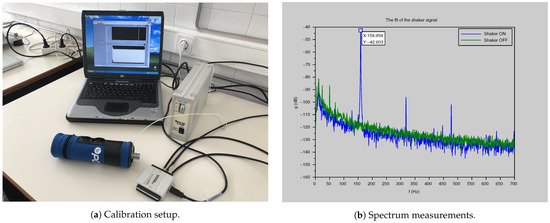
Figure 7.
Accelerometer calibration setup and spectral results.
3.2. Magnetoresistive Sensor Setup
For each measurement with the magnetoresistive sensor, a magnet was fixed to the structure of the motor load represented in Figure 5 in the same locations that the accelerometer was fixed. The magnet works like an amplifier, or transducer, and locally generates a magnetic field correlated with vibrations in the mechanical structure of the motor. The variations in the magnetic field are captured by the magnetoresistive sensor, electronically processed and spectrally analyzed. Besides mechanical vibrations caused by mechanically induced unbalance and/or misalignments, other spectral components caused by the electromagnetic field generated from the stator circuit of the motor can also be captured [18]. The magnetoresistive sensor was placed close to the magnet at approximately 30 cm, for vibration measurements in horizontal (Figure 8a), vertical (Figure 8b) and axial (Figure 8c) axes. During each measurement, the signal was acquired and sent to a computer for storage and analysis. Besides the motor and variable current drive, the specific equipments that were used in this experiment are:
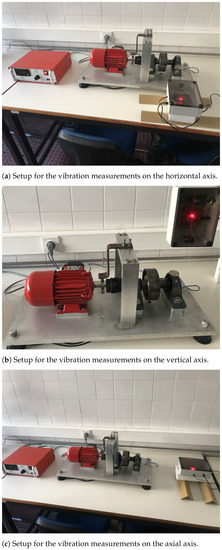
Figure 8.
Experimental setup with the magnetoresistive sensor measurement on three axis.
- Magnetoresistive sensorcircuit:
- Sensor and conditioning circuit with USB output (Figure 4).
- PC:
- Computer running a serial port acquisition software (CoolTerm [19]) to capture and store raw data from the USB port.
3.3. Vibration Measurements
Vibration measurements were acquired in axial, horizontal and vertical directions, and for three rotational speeds: 750, 1500 and 2250 rpm, as described in Table 2.

Table 2.
Measurements campaign.
For all measurements, the motor load was adjusted with an unbalance of kg·m, a parallel misalignment of mm and an angular misalignment equal to 0.23°. For each measurement campaign, the information gained from the vibration signals is stored in a computer and converted into frequency domain by processing an FFT. The parameters for collecting vibration signals are given in Table 3.

Table 3.
Parameters for vibration measurement.
We have applied a windowing function (Hanning window) and time overlap to the time samples, to avoid loss of information due to attenuation at the window edges when processing the FFT. Both sensors are using individual setups to acquire signals and convert them to a digital format, with different sampling frequencies. As such, the signal generated from the accelerometer was downsampled to the same sampling frequency as the magnetoresistive sensor signal, to accommodate cross-correlation calculations between signals in Section 4.
4. Results and Discussion
Spectral analysis was applied on the vibration velocity of the motor load, using two sensors consecutively. The measurements followed the specifications from Table 2. As an example, the spectrum measurements on the vertical axis are presented in Figure 9 for a frequency range between 10 Hz and 180 Hz. This range was selected due to high spectral lines density related to the low frequency signatures, usually found in motor vibrations. The vibration velocity u of the signal’s spectrum was also normalized, () to simplify visual inspection.
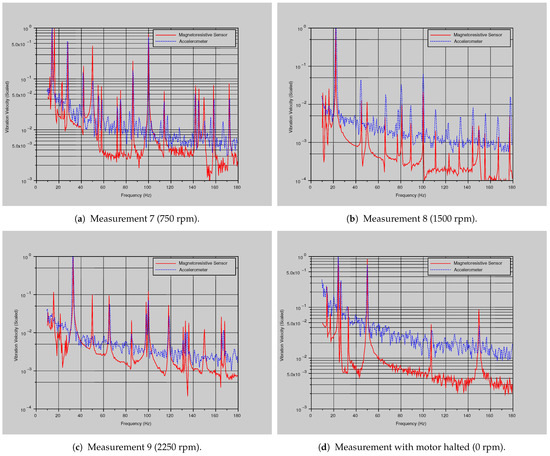
Figure 9.
Spectral analysis of velocity vibrations on the vertical axis at (a) 750, (b) 1500, (c) 2250 rpm and (d) motor halted. Full line: magnetoresistive sensor; dashed line: accelerometer.
The measured signal is strongly structured with a large number of low-range spectral components (consistent with what is expected for the mechanical movements of the various components of the motor). The appearance of main components at 12.5 Hz, 25 Hz and 37.5 Hz can be noticed, for both sensors, at Figure 9a–c for 750 rpm, 1500 rpm and 2250 rpm, respectively, which is consistent with the rotation velocity of the motor (). Other spectral components, multiple of the rotational frequency, are also noticeable, in particular in Figure 9a. The same results are also present from the measured signal on the other two axes (horizontal and axial).
As with the accelerometer, the signal captured by the magnetoresistive sensor is strongly structured at multiple spectral lines, containing information related to the mechanical movement of multiple moving parts, mechanically coupled to the structure and the magnet. Besides the spectral lines related to the movement and vibrations of mechanical parts, the results show that the magnetoresistive sensor is also particularly sensitive to spectral components at the supply frequency, 50 Hz. This is visible in Figure 9a. Therefore, the magnetoresistive sensor can detect vibration movements and magnetic field variations. This corroborates the results with the same sensor when it was tested with industrial equipment on the shop floor to detect vibration signals [20]. In relation to this work, it can be seen in the spectrum from Figure 9, that there are signal peaks at the frequency of 100 Hz; therefore, in a spectrum analysis in electric motors, it is known that there are always signal peaks at the frequency of 100 Hz, resulting mainly from the magnetic interaction between the rotor and the stator. Regardless of the number of motor pole pairs, this phenomenon occurs. It is inherent in all induction motors. However, the focus in this work is related to the comparison of measurements between two types of sensors. The presence of a magnet may affect the magnetoresistive sensor measurements, but the sensor responds correctly to the vibration measurements, and this point gives us support to continue with additional experiments with magnetoresistive sensors for vibration measurements.
Considering the accelerometer as a reference, we select a metric that can measure the performance of the magnetoresistive sensor. The Pearson product–moment correlation coefficient is computed as a measure of similarity between spectral signatures from both sensors,
where N is the number of spectral samples, and are the vibration amplitudes of the spectral components from the magnetoresistive sensor and the accelerometer, respectively. Figure 10 shows the results, where 0 means no correlation and value close to 1 means a strong association between results. Considering 0.5 as the threshold for both signals to be correlated, the majority of the measurement have passed the correlation test. The presence of noise, combined with the high sensitivity of the magnetoresistive sensor to particular spectral components, can justify the fact that no measurement attained a cross-correlation close to 1. Considering the results for each axes, the rotational speed does not seem to have a direct influence on the correlation results. The good correlation results from the vertical axis, with values between 69% and 73%, may be explained by the type of support used to fix the magnetoresistive sensor, independent of the experiment table where the engine is located, and unaffected by the vibrations caused from the motor rotation. The vibrations of the setup table may have negatively influenced the measurements on the horizontal and axial axes, since the magnetoresistive sensor was installed on the same setup table as the motor, as shown in Figure 8a,c.
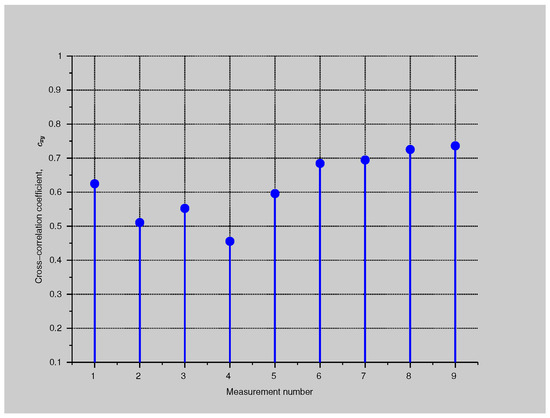
Figure 10.
Cross correlation from all measurements: 1–3 axial, 4–6 horizontal and 7–9 vertical axes.
Another important aspect that influenced the results is noise. From the experimental results, we propose two options to mitigate the influence of noise in magnetoresistive sensor measurements and increase the cross-correlation values: one related to external influences and another to internal parameters of the magnetoresistive sensor device.
One approach is to mitigate external interferences, using electromagnetic shielding of the sensor outside the direction for which the measurement is made, and taking measurements as far as possible from sources of strong electromagnetic radiation, usually found in factory shop floors, such as high voltage cables or high power luminaires.
Another approach is to adjust specific parameters from the electronic circuit that captures the signal of the magnetoresistive sensor. It can be adjusted and fined tuned to capture the spectral components and discard lower power spectral components generated from the motor vibrations. However, this option could discard useful information regarding specific spectral components, with relatively low power. Filtering the signal conveniently, removing the outer components from the spectral window under analysis (software or hardware) is, in our opinion, the preferred option. According to the standard ISO 20816-1: 2016 [21], most of the useful information is spectrally ranged between 2 Hz and 1 kHz, such as spectral components caused by misalignment and unbalance.
Comparison with Other Measurement Techniques
Other techniques to measure vibrations in induction motors are currently available, or subject to research. They can be classified as contact or non-contact vibration measurements and use different types of sensors.
Optical sensor with Fiber Bragg gratings (FBG) [22] are immune to electromagnetic noise but require a bulky setup and a permanent contact with the motor. The microelectromechanical system (MEMS) accelerometer, proposed in [23], can be reliably employed to detect simple to complex bearing faults but is sensitive to temperature and operates over a limited temperature range.
Other sensors are used for non-contact vibration measurement, such as the magnetoresistive sensor. Microwave sensors [24] are very accurate but require complex software, Phase-Locked Loop (PLL), to recover information from the reflected signal. Eddy current sensors [25] are effective in detecting shaft static displacements, unbalance response and misalignment, but are limited to measure vibrations from metallic objects at a very close distance. Hall effect sensors [26] suffer from non-linear characteristic curve and the high sensibility to environmental impacts results in a limited usability. Compared to other techniques, the key benefit of magnetoresistive sensors is that they can be bulk manufactured on silicon wafers and mounted in commercial-integrated circuit packages. This allows magnetic sensors to be auto-assembled with other circuit and system components in a small footprint.
5. Conclusions
Accelerometers are widespread in the industry, but due to their high sensitivity and high level of integration, magnetoresistive sensors can be a real alternative for measuring vibrations in industrial equipment—in particular, in cases when a contactless approach is a requirement. However, care must be taken to improve the quality of the measurements with magnetoresistive sensors by installing the sensor on a damped surface to prevent local vibrations that may adversely affect the measurement process. Due to the high sensitivity of the magnetoresistive sensors, noise can be acquired over a wide range of frequencies, so it is essential that the acquisition systems can overcome this disadvantage and, through well-designed filters, can select the desired spectrum range. Thus, the use of magnetoresistive sensors to detect vibrations in the presence of strong external disturbing magnetic fields is only advisable if appropriate care is taken in the treatment and analysis of the results. Thus, the use of magnetoresistive sensors to detect vibrations in the presence of strong external disturbing magnetic fields is only advisable if appropriate care is taken in the treatment and analysis of the results.
This work demonstrates for a specific combination of the various failures that the experimental setup can emulate, that it may be possible to obtain a good match between the spectral signatures measured from the input of different types of sensors (accelerometers and magnetoresistive sensors), and depending on the application, one can choose the type of sensor for the most appropriate solution. Additional measurements are necessary to compare both sensor performances when defective operations, caused by a single defect, are emulated. Future work will include a detailed specification of the experimental setup, for each defective operation (unbalance, parallel and angular misalignments).
This work was developed for vibration analysis in induction motors but can be easily tested on other types of machines presented on the factory shop floor. The potential of this type of innovative approach to data collection for predictive maintenance models in systems will be implemented and tested, as future work, to monitor the vibrations of refurbished industrial label loom machines as one milestone of the process to convert old, but still operational, industrial machines into Cyber Physical Systems in the scope of the Industry 4.0 paradigm.
Author Contributions
Conceptualization, R.D. and P.T.; methodology, R.D. and P.T.; validation, R.D., P.T. and R.F.; formal analysis, R.D. and P.T.; investigation, R.F. and A.R.; resources, R.F. and A.R.; writing—original draft preparation, R.D.; writing—review and editing, P.T. and A.R. All authors have read and agreed to the published version of the manuscript.
Funding
This research received no external funding.
Informed Consent Statement
Not applicable.
Data Availability Statement
Data sharing is not applicable to this article.
Conflicts of Interest
The authors declare no conflict of interest.
References
- Edwards, S.; Lees, A.W.; Friswell, M.I. Fault diagnosis of rotating machinery. Shock Vib. Dig. 1998, 30, 4–13. [Google Scholar] [CrossRef]
- Orhan, S.; Aktürk, N.; Celik, V. Vibration monitoring for defect diagnosis of rolling element bearings as a predictive maintenance tool: Comprehensive case studies. NDT E Int. 2006, 39, 293–298. [Google Scholar] [CrossRef]
- Mitchell, J.S. Introduction to Machinery Analysis and Monitoring; Pennwell Books, PennWell Publishing Company: Tulsa, OK, USA, 1993. [Google Scholar]
- Patil, S.S.; Gaikwad, J.A. Vibration analysis of electrical rotating machines using FFT: A method of predictive maintenance. In Proceedings of the 2013 Fourth International Conference on Computing, Communications and Networking Technologies (ICCCNT), Tiruchengode, India, 4–6 July 2013; pp. 1–6. [Google Scholar] [CrossRef]
- Rad, M.K.; Torabizadeh, M.; Noshadi, A. Artificial Neural Network-based fault diagnostics of an electric motor using vibration monitoring. In Proceedings of the 2011 International Conference on Transportation, Mechanical, and Electrical Engineering (TMEE), Changchun, China, 16–18 December 2011; pp. 1512–1516. [Google Scholar] [CrossRef]
- Tsypkin, M. Induction motor condition monitoring: Vibration analysis technique—A practical implementation. In Proceedings of the 2011 IEEE International Electric Machines Drives Conference (IEMDC), Niagara Falls, ON, Canada, 15–18 May 2011; pp. 406–411. [Google Scholar] [CrossRef]
- Pelegri, J.; Alberola, J.; Lajara, R.; Santiso, J. Vibration detector based on GMR sensors. In Proceedings of the 2007 IEEE Instrumentation & Measurement Technology Conference (IMTC), Warsaw, Poland, 1–3 May 2007; pp. 1–5. [Google Scholar]
- Caruso, M.J. Applications of Magnetoresistive Sensors in Navigation Systems; Technical Report, SAE Technical Paper; SAE International: Arrendale, PA, USA, 1997. [Google Scholar]
- Toth, D.M.; Dewald, R.E.; Tripathy, B. Integrated Sensor-Seal Module for Detecting Angular Position of A Crankshaft. U.S. Patent 7,341,257, 11 March 2008. [Google Scholar]
- Bajorek, C.H. Magnetoresistive (MR) Heads and the Earliest MR Head-Based Disk Drives: Sawmill and Corsair; Computer History Museum: Mountain View, CA, USA, 2014. [Google Scholar]
- Jogschies, L.; Klaas, D.; Kruppe, R.; Rittinger, J.; Taptimthong, P.; Wienecke, A.; Rissing, L.; Wurz, M.C. Recent developments of magnetoresistive sensors for industrial applications. Sensors 2015, 15, 28665–28689. [Google Scholar] [CrossRef] [PubMed]
- Tomassini, R.; Rossi, G. Noncontact vibration measurements using magnetoresistive sensing elements. In AIP Conference Proceedings; AIP Publishing LLC: Melville, NY, USA, 2016; Volume 1740, p. 020004. [Google Scholar]
- Mickael, P.W. A Near Field, Non-Contact Vibration Detector Using Giant Magnetoresistance Sensors. Master’s Thesis, Georgia Institute of Technology, Atlanta, GA, USA, 2018. [Google Scholar]
- Ferreira, R.; de Colosia Paz, E. Magnetoresistive Sensor. U.S. Patent 10,718,830, 21 July 2020. [Google Scholar]
- Paz, E.; Ferreira, R.; Freitas, P.P. Linearization of Magnetic Sensors with a Weakly Pinned Free-Layer MTJ Stack Using a Three-Step Annealing Process. IEEE Trans. Magn. 2016, 52, 1–4. [Google Scholar] [CrossRef]
- Zuo, S.; Nazarpour, K.; Böhnert, T.; Paz, E.; Freitas, P.; Ferreira, R.; Heidari, H. Integrated Pico-Tesla Resolution Magnetoresistive Sensors for Miniaturised Magnetomyography. In Proceedings of the 2020 42nd Annual International Conference of the IEEE Engineering in Medicine Biology Society (EMBC), Montréal, QC, Canada, 20–24 July 2020; pp. 3415–3419. [Google Scholar] [CrossRef]
- PCB Piezotronics Model 394C06 Handheld Shaker. Available online: https://www.pcb.com (accessed on 1 December 2020).
- Tsypkin, M. Induction motor condition monitoring: Vibration analysis technique—Diagnosis of electromagnetic anomalies. In Proceedings of the 2017 IEEE AUTOTESTCON, Schaumburg, IL, USA, 11–14 September 2017; pp. 1–7. [Google Scholar] [CrossRef]
- Meier, R. CoolTerm—Serial Port Terminal Application. Available online: http://freeware.the-meiers.org (accessed on 1 December 2020).
- Dionísio, R.; Malhão, S.; Torres, P. Development of a Smart Gateway for a Label Loom Machine using Industrial IoT Technologies. Int. J. Online Biomed. Eng. (iJOE) 2020, 16, 6–14. [Google Scholar] [CrossRef]
- ISO Central Secretary. Mechanical Vibration—Measurement and Evaluation of Machine Vibration—Part 1: General Guidelines; Standard ISO 20816-1:2016; International Organization for Standardization: Geneva, Switzerland, 2016. [Google Scholar]
- Sousa, K.M.; Dreyer, U.J.; Martelli, C.; da Silva, J.C.C. Dynamic eccentricity induced in induction motor detected by optical fiber Bragg grating strain sensors. IEEE Sens. J. 2016, 16, 4786–4792. [Google Scholar] [CrossRef]
- Maruthi, G.; Hegde, V. Application of MEMS accelerometer for detection and diagnosis of multiple faults in the roller element bearings of three phase induction motor. IEEE Sens. J. 2015, 16, 145–152. [Google Scholar] [CrossRef]
- Barusu, M.R.; Deivasigamani, M. Non-invasive vibration measurement for diagnosis of bearing faults in 3-phase Squirrel cage induction motor using microwave sensor. IEEE Sens. J. 2020, 21, 1026–1039. [Google Scholar] [CrossRef]
- Xue, X.; Dong, Y.; Wu, X. Motion induced eddy current sensor for non-intrusive vibration measurement. IEEE Sens.J. 2019, 20, 735–744. [Google Scholar] [CrossRef]
- Hegde, V.; Maruthi, G. Experimental investigation on detection of air gap eccentricity in induction motors by current and vibration signature analysis using non-invasive sensors. Energy Procedia 2012, 14, 1047–1052. [Google Scholar] [CrossRef]
Publisher’s Note: MDPI stays neutral with regard to jurisdictional claims in published maps and institutional affiliations. |
© 2021 by the authors. Licensee MDPI, Basel, Switzerland. This article is an open access article distributed under the terms and conditions of the Creative Commons Attribution (CC BY) license (http://creativecommons.org/licenses/by/4.0/).