Article

Glucosinolate Profile and Glucosinolate Biosynthesis and Breakdown Gene Expression Manifested by Black Rot Disease Infection in Cabbage

1
Department of Horticulture, Sunchon National University, 255, Jungang-ro, Suncheon, Jeonnam 57922, Korea
2
Department of Genetics and Plant Breeding, Bangladesh Agricultural University, Mymensingh 2202, Bangladesh
*
Authors to whom correspondence should be addressed.
Plants 2020, 9(9), 1121; https://doi.org/10.3390/plants9091121
Submission received: 16 July 2020 / Revised: 26 August 2020 / Accepted: 28 August 2020 / Published: 30 August 2020
(This article belongs to the Section Plant Genetics, Genomics and Biotechnology)

Abstract

:
Cabbage (Brassica oleracea var. capitata) is an economically important crop in the family Brassicaceae. Black rot disease is a top ranked cabbage disease, which is caused by Xanthomonas campestris pv. campestris (Xcc) and may reduce 50% crop loss. Therefore, we need a clear understanding of black rot disease resistance for sustainable disease management. The secondary metabolites, like Glucosinolate (GSL) presents in Brassica species, which plays a potential role in the defense mechanism against pathogens. However, there is little known about GSL-regulated resistance mechanisms and GSL biosynthesis and the breakdown related gene expression after black rot disease infection in cabbage. In this study, relative expression of 43 biosynthetic and breakdown related GSLs were estimated in the black rot resistant and susceptible cabbage lines after Xcc inoculation. Ten different types of GSL from both aliphatic and indolic groups were identified in the contrasting cabbage lines by HPLC analysis, which included six aliphatic and four indolic compounds. In the resistant line, nine genes (MYB122-Bol026204, MYB34-Bol017062, AOP2-Bo9g006240, ST5c-Bol030757, CYP81F1-Bol017376, CYP81F2-Bol012237, CYP81F4-Bol032712, CYP81F4-Bol032714 and PEN2-Bol030092) showed consistent expression patterns. Pearson’s correlation coefficient showed positive and significant association between aliphatic GSL compounds and expression values of ST5c-Bol030757 and AOP2-Bo9g006240 genes as well as between indolic GSL compounds and the expression of MYB34-Bol017062, MYB122-Bol026204, CYP81F2-Bol012237, CYP81F4-Bol032712 and CYP81F4-Bol032714 genes. This study helps in understanding the role of GSL biosynthesis and breakdown related genes for resistance against black rot pathogen in cabbage, which could be further confirmed through functional characterization either by overexpression or knock-out mutation.

1. Introduction

The bacterial species Xanthomonas campestris infects a wide range of Brassica species, including cabbage. Korea is among the larger cabbage producers and stands on fifth position in the world, worth approximately 66 million US$ from 2.12 million ton per year [1]. Black rot is a major disease in cabbage and was first identified in Korea in the 1970s [2]. It is a seed-borne disease and is caused by necrotrophic plant bacteria Xanthomonas campestris pv. campestris (Xcc) [3]. This pathogen is distributed frequently around the world and causes 50% economic loss [4]. The Xcc pathogen invades the xylem tissues after penetrating through hydathodes and wounded tissues, afterwards disease symptoms are developed in the host plants at warm and humid conditions [5]. Eleven races of the Xcc pathogen have been reported, which are proposed based on interaction between Xcc strains and differential Brassica cultivars following the gene-for-gene model [6,7]. Among them, races 1 and 4 were reported as the most virulent in cabbage [8]. Black rot disease management was attempted by using pathogen free seeds in cultivation, elimination of infected plant debris and cruciferous weeds, crop rotation and finally applying agrochemicals [9]. However, the use of resistant varieties at the farmers level will be the most sustainable way to control the disease [10].
Different defense reactions of host-pathogen such as resistance, susceptibility or lack of interaction in host plants are induced by the pathogen [11]. Glucosinolates (GSLs) were reported to show functions in plant defense mechanisms against pathogens [12,13]. GSLs are sulfur and nitrogen containing secondary metabolites broadly found in different Brassica species. They could be conferred as resistant against pathogens and insects [14]. Two important types of GSLs (aliphatic and indolic) are predominant in the crops of Brassicaceae and Arabidopsis [15,16]. GSLs are hydrolyzed by an endogenous myrosinase enzyme (β-thioglucoside glucohydrolase; EC 3.2.1.147) in ruptured cells and most of the hydrolyzed products seem to act as key regulators in tolerance reactions against Xcc pathogens [11,17]. The GSL hydrolyzed products, especially isothiocyanates (ITCs) are reported to have beneficial effects, like anti-carcinogenic and anti-oxidative activities for reducing risk of degenerative diseases in human health [18,19].
GSL content is varied within Brassica species or between cultivars due to allelic variation of GSL biosynthesis genes [20]. It has been noted that three loci (GSL-PRO, GSL-ELONG and GSL-ALK) largely regulate the aliphatic GSL profile in B. oleracea [21]. However, the GSL profile might be altered or manifested by pathogenic infections in plants. Many reports have concluded that resistance to necrotrophs, biotrophs and hemibiotrophs are related to indolic GSLs content in Brassica crops [22]. In kale, two types of aliphatic GSLs (sinigrin and glucoiberin) and one indolic GSL (glucobrassicin) in leaves are modulated upon Xcc infection [23]. In Arabidopsis, GSL is hydrolyzed by a myrosinase gene, PENETRATION2 (PEN2), and accumulated as indolic 4-methoxy-glucobrassicin in cells upon expression of CYP81F2 gene in response against fungal pathogen infection [24].
A number of studies (in vivo and in vitro) have been conducted to evaluate the effects of GSLs and their hydrolyzed products on disease development in Brassica crops. The transgenic A. thaliana with an enhanced amount of individual GSL compound showed resistance against Erwinia carotovora and Pseudomonas syringae pv. maculicola [25]. In B. napus, cultivars with higher GSLs content showed resistance against fungal pathogens (Alternaria spp. and Leptosphaeria maculans) compared to the cultivars with low GSLs [26]. The ITCs are produced upon GSL breakdown and showed biocidal effects in reducing soil-borne plant pathogens [27,28]. GSL-hydrolyzed products (GHP) were found as effective to control several plant pathogenic bacteria, such as Erwinia chrysanthemi, Agrobacterium tumefaciens, Pseudomonas tomato, Pseudomonas cichorii, X. juglandis, X. campestris [11]. Recently, a study on the interaction of kale and Xcc pathogen suggested that indolic GSL compound (glucobrassicin) is more effective in decreasing disease severity than aliphatic GSL compounds [23].
Management of black rot disease is very difficult because of the wide host range of the pathogens. Therefore, secondary metabolites could be used as an alternate biocide for sustainable disease management in Brassica crops [25,29]. To date, only few works have been reported that assess the role of GSLs and their derived products against Xcc pathogen in cabbage. The effects of GSLs, ITCs and plant phenolics have been evaluated on different Brassica species, such as Lepidium sativum, Eruca sativa, B. olerecea var. italica cv. Marathon, B. olerecea var. capitata cv. coracao de boi, B. oleracea var. tronchuda cv. Tronchuda Portuguesa. Positive associations were established among specific GSL components, total GSL content and disease severity in B. rapa against Xcc [11]. This result helps to elucidate the constitutive resistance in plants against Xcc pathogen [17]. Here, we investigated the interaction between GSL profiles of black rot susceptible and resistant cabbage inbred lines, expression profiling of GSL biosynthesis and break-down related genes after infection by Xcc race 4 pathogen. These findings will be helpful for further research to elucidate the underlying mechanism of host-pathogen interactions at biochemical and molecular levels for developing black rot resistance cabbage cultivars.

2. Materials and Methods

2.1. Selection of Plant Materials

Two cabbage genotypes SCNU-C-4072 and SCNU-C-3383 were used as source of black rot disease resistance and susceptible lines, respectively, which were selected after screening of 59 inbred cabbage lines collected from the Department of Horticulture, Sunchon National University, Korea against Xcc race 4 pathogen. This screening experiment was conducted in the greenhouse which had a temperature of 28 ± 2 °C, >80% humidity and 16/8 h day/night (Figure S1 and Table S1). Xcc race 4 (HRI-W-1279A) was collected from Horticulture Research International, Wellesbourne (HRI-W) [30]. This bacterial isolate was maintained on King’s B medium and incubated at 30 °C for 48 h [31], from which 1 × 10⁸ CFU/mL bacterial isolate was collected and used to infect 35 days old cabbage seedlings following leaf dip method after cutting 1 cm off the tip of the leaves [32]. Three biological replicates were maintained for each cabbage line and high humidity was ensured by covering the infected plants with polythene bags immediately after infection. A set of control and mock (use only water) was also maintained for each cabbage line. Disease symptoms were rated on a 0 to 3 scale after 14 days of inoculation (DAI) [30]

2.2. Collection of Leaf Samples for HPLC and PCR

Leaf samples were collected from each of the control, mock-treated and Xcc inoculated plants, at 1, 3 and 5 DAI (Figure 1) for estimating the endogenous GSLs content and expression of GSL biosynthesis and breakdown related genes. Leaf samples were stored immediately at −80 °C after freezing in liquid nitrogen for HPLC (high performance liquid chromatography) and quantitative reverse transcription PCR (qRT-PCR) analyses.

2.3. Glucosinolates Identification, Quantification and Analysis

The GSL composition of the cabbage leaf samples was estimated as desulfo-GSL from three biological replicates for each of the control, mock-treated and Xcc infected plants using a modified HPLC method as previously described [33,34]. Frozen leaf tissue was treated with methanol and stored at −80 °C and then ground to a very fine powder. The powdered leaf samples were stored at 70 °C for 10 min and then brought out at room temperature for 1 h. The samples were centrifuged at 10,000× g at 4 °C for 8 min to remove the undesirable structural components and protein molecules. The supernatant (crude GSL sample) was collected at the end of anion-exchange chromatography. Afterward, the raw GSL sample was desulfurized following the method [33,35] and the GSLs were eluted with 1 mL distilled water. The eluted desulfo-GSLs were purified by high-speed centrifugation at 20,000× g for 4 min at 4 °C followed by filtering through a PTFE (polytetrafluoroethylene) filter (13 mm, 0.2 μm, Advantec, Pleasanton, CA, USA). Purified GSLs were estimated by HPLC on Waters 2695 HPLC system (Waters, Milford, MA, USA) provided with a C18 column (Zorbax Eclipse XBD C18, 4.6 m ×150 mm; Agilent Technologies, Palo Alto, CA, USA). Water and acetonitrile were used as mobile phase solvents. HPLC-mass spectrometry analysis (Agilent 1200 series, Agilent Technologies) was used for identifying individual GSLs [35]. The individual GSL compound was measured at a wavelength of 229 nm using PDA 996 UV-visible detector. A standard curve was prepared with commercial standard sinigrin (SIN) for quantification of the identified individual GSLs.

2.4. Expression Analysis of GSL Biosynthesis Pathway and Break-Down Related Genes

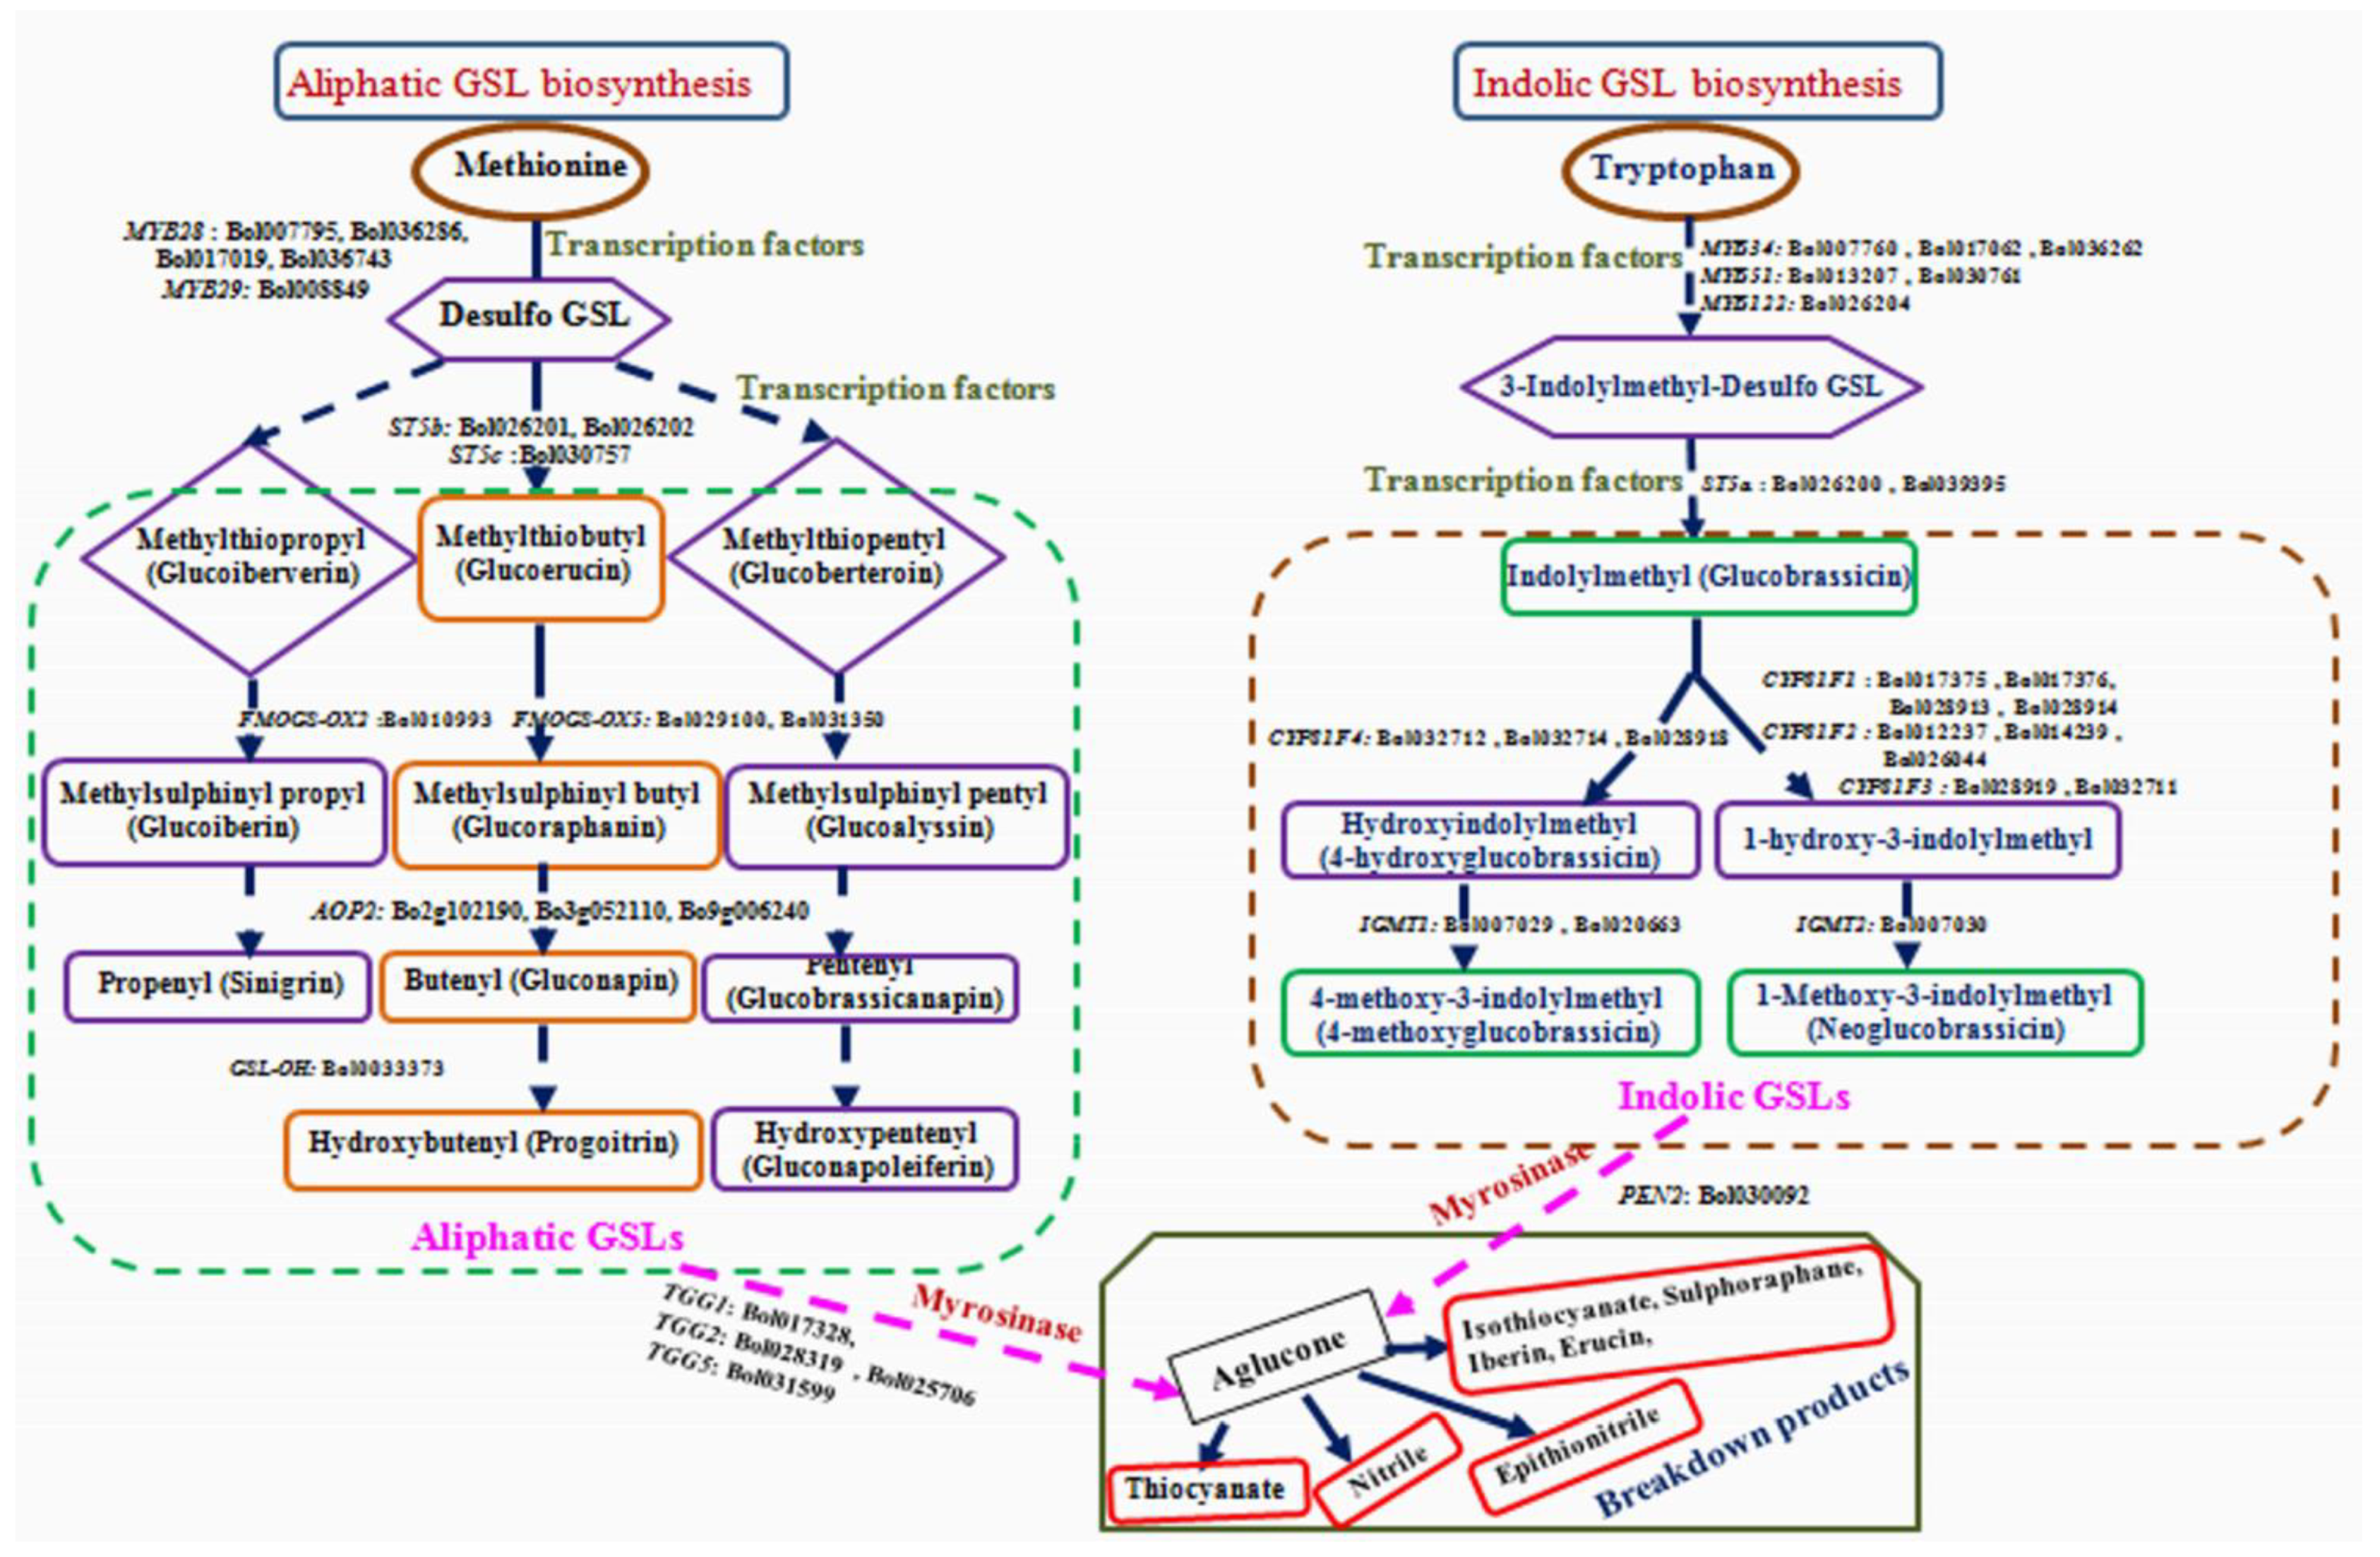
A total of 43 genes, of which 38 associated with GSL biosynthesis and 5 GSL breakdown were used for expression analysis. Among them, 11 genes belong to transcription factor (TF) (5 from aliphatic and 6 from indolic groups of GSL biosynthesis pathway). Primers were designed on twenty seven genes, of which 10 were from aliphatic and 17 from indolic GSL biosynthesis pathway (Figure 2 and Table S2). Primer efficiencies were assessed following the process [33,36] and highly efficient primers were used for expression analysis.

2.5. Total RNA Extraction, cDNA Synthesis and Quantitative Real-Time PCR Analysis

The collected leaf samples were ground in liquid nitrogen and total RNA was extracted from 100 mg leaf tissue using RNeasy mini kit (Qiagen, Valencia, CA, USA). The quantity and quality of RNA were determined using a NanoDrop ND-1000 (260/280 nm) spectrophotometer (NanoDrop, Wilmington, DE, USA) (Supplementary Figure S2) and 1% agarose gel electrophoresis, respectively, prior to use in cDNA (complementary DNA) synthesis for qRT-PCR (Supplementary Figure S3). The cDNA was synthesized using a first-strand cDNA synthesis kit (Thermo Fisher Scientific, MA, USA) following the manufacturer’s protocol. The equality of cDNA for each sample was standardized by checking the concentration (60 ng/μL) in NanoDrop as well as comparing the band thickness of end-point PCR product of each sample amplified with actin genes of B. oleracea. Primers were designed on three actin genes named as actin1, actin2, and actin3 with NCBI accessions AF044573 [38], JQ435879 [39] and XM_013753106 [40]. These genes were also used as internal controls for estimating relative gene expression. The qPCR was performed using a 20 μL reaction mixture contained 10 μL 2× Quanti Speed SYBR mix (Thermo Fisher Scientific), 1 μL (10 pmol) each of the forward and reverse gene-specific primers (Supplementary Table S2), 1 μL template cDNA (60 ng) and 7 μL distilled-deionized water. The PCR condition was fixed as initial denaturation at 95 °C for 10 min, 40 cycles of amplification with denaturation at 95 °C for 20 s, annealing at 58 °C for 20 s, and amplification and signal acquisition at 72 °C for 30 s. Each reaction was performed three times as technical replicates using LightCycler96 (Roche, Mannheim, Germany). Livak’s comparative 2-ΔΔCt method [41] was used to calculate the relative expression level of each sample. Average Cq value of three actin genes was used for estimating relative expression of GSL biosynthesis and breakdown related genes.

2.6. Statistical Analysis

One-way ANOVA (analysis of variance) and mean separation following Tukey’s pairwise comparison for relative expression of each gene and GSL content at different time courses were done using Minitab 18 statistical software (Minitab Inc., State College, PA, USA). Test statistics, degrees of freedom, F- and P-values of statistical significance for GSL content and the relative expression of GSL biosynthetic and breakdown related genes are presented in Tables S3 and S4. A heat map was constructed in Microsoft Excel using conditional formatting options to display the correlation between GSL content and expression values of genes (Tables S5–S9). Principal component analysis (PCA) was done using GSL compounds as determined by HPLC and gene expression values by Minitab 18.

3. Results

3.1. Phenotypic Evaluation of Cabbage Lines Against Black Rot Disease

Fifty nine inbred cabbage lines were screened against black rot disease after infection of Xcc race 4. Most of the lines found as susceptible, whereas lines SCNU-C-060, SCNU-C-064 and SCNU-C-4072 were identified as resistance (Table S1). The resistant lines did not show any disease symptoms on the inoculated leaves up to 14 DAI (days after inoculation); whereas, susceptible lines produced necrotic lesions with characteristic V-shaped symptoms. One resistant (SCNU-C-4072) and one susceptible (SCNU-C-3383) line was used for further study (Figure 1 and Supplementary Figure S1).

3.2. Distribution of the GSL Compounds in the Black Rot Resistant and Susceptible Lines

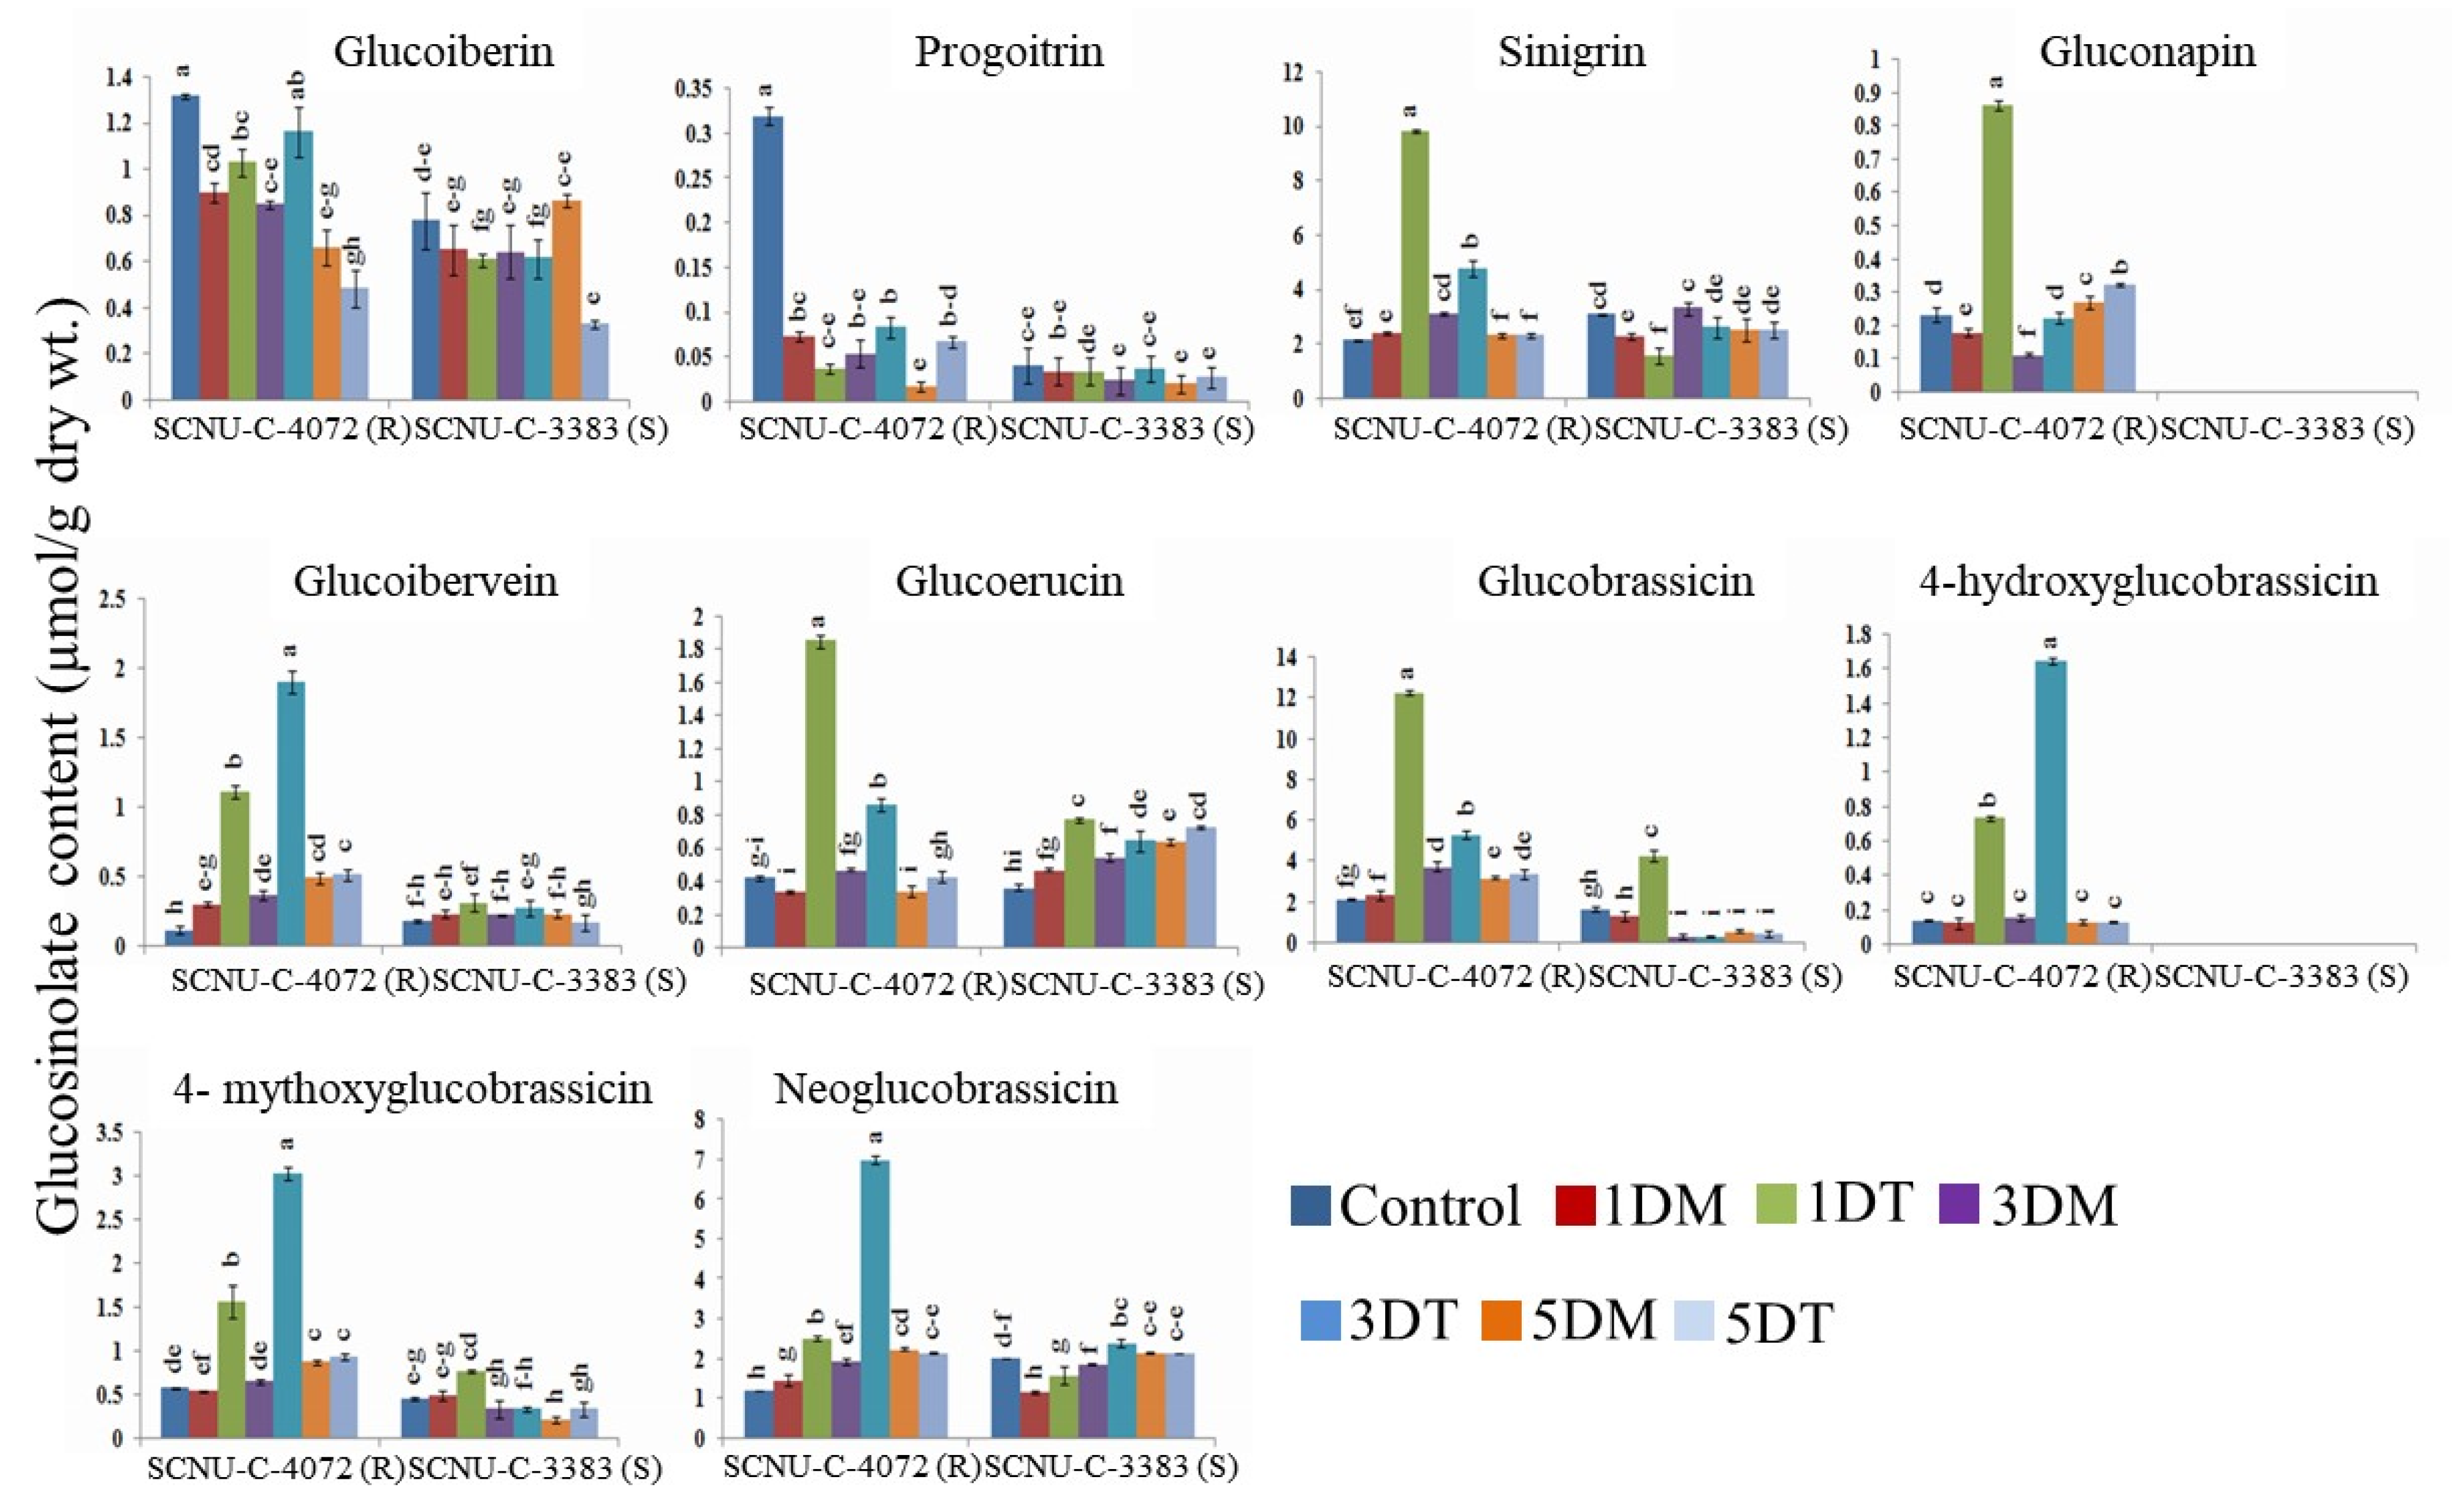
HPLC (high-performance liquid chromatography) was performed for identifying different GSL compounds in the black rot resistant (SCNU-C-4072) and susceptible (SCNU-C-3383) lines (Figure 3, Supplementary Data S1 and S2). Resistant control plants had higher amount of glucoiberin and progoitrin than susceptible line. Ten GSL compounds (glucoiberin, progoitrin, sinigrin, glucoerucin, gluconapin, glucoiberverin, hydroxyglucobrassicin, glucobrassicin, mythoxyglucobrassicin and neoglucobrassicin) were identified in the resistant line. Whereas 8 GSL compounds were identified in susceptible, except the gluconapin and hydroxyglucobrassicin lines (Figure 3). Compared to control plants, inoculated resistant and susceptible lines showed significant difference for both aliphatic and indolic GSL content. Aliphatic and indolic GSL compounds were increased significantly in the resistant line in response to Xcc, whereas it was decreased or not induced in the susceptible line. In the resistant line, levels of aliphatic compound (sinigrin and glucoiberverin) were increased significantly by 4.08- and 5.19-fold at 3 DAI and glucoerucin was increased 5.44-fold at 1 DAI after Xcc infection compared to mock (Figure 3, Tables S3 and S5). In the susceptible line, aliphatic compounds (sinigrin, glucoiberverin and glucoerucin) were decreased by 0.68-, 1.22-, and 1.64-fold, respectively, in infected plants compared to mock. The gluconapin level was increased by 4.79-fold at 1 DAI in the resistant line, whereas it was totally absent in the susceptible line (Figure 3, Tables S3 and S5). The indole GSL compounds (glucobrassicin, mythoxyglucobrassicin, and neoglucobrassicin) were increased by 5.20-fold at 1 DAI as well as 4.69- and 3.61-fold at 3 DAI, respectively, whereas hydroxyglucobrassicin was significantly increased by 10.27-fold at 3 DAI in resistant line. This indolic compound was totally absent in the susceptible line. Glucobrassicin and neoglucobrassicin were decreased by 1.02- and 1.28-fold at 1 DAI and 3 DAI, respectively, in the susceptible line. Mythoxyglucobrassicin was increased by 3.28-fold at 3 DAI in the susceptible line (Figure 3, Tables S3 and S5). Both aliphatic and indolic GSL compounds were increased in the resistant line upon Xcc infection compared to susceptible line.

3.3. Relative Expression of Transcription Factor- and GSL Biosynthesis-Related Genes in Black Rot Resistant Line

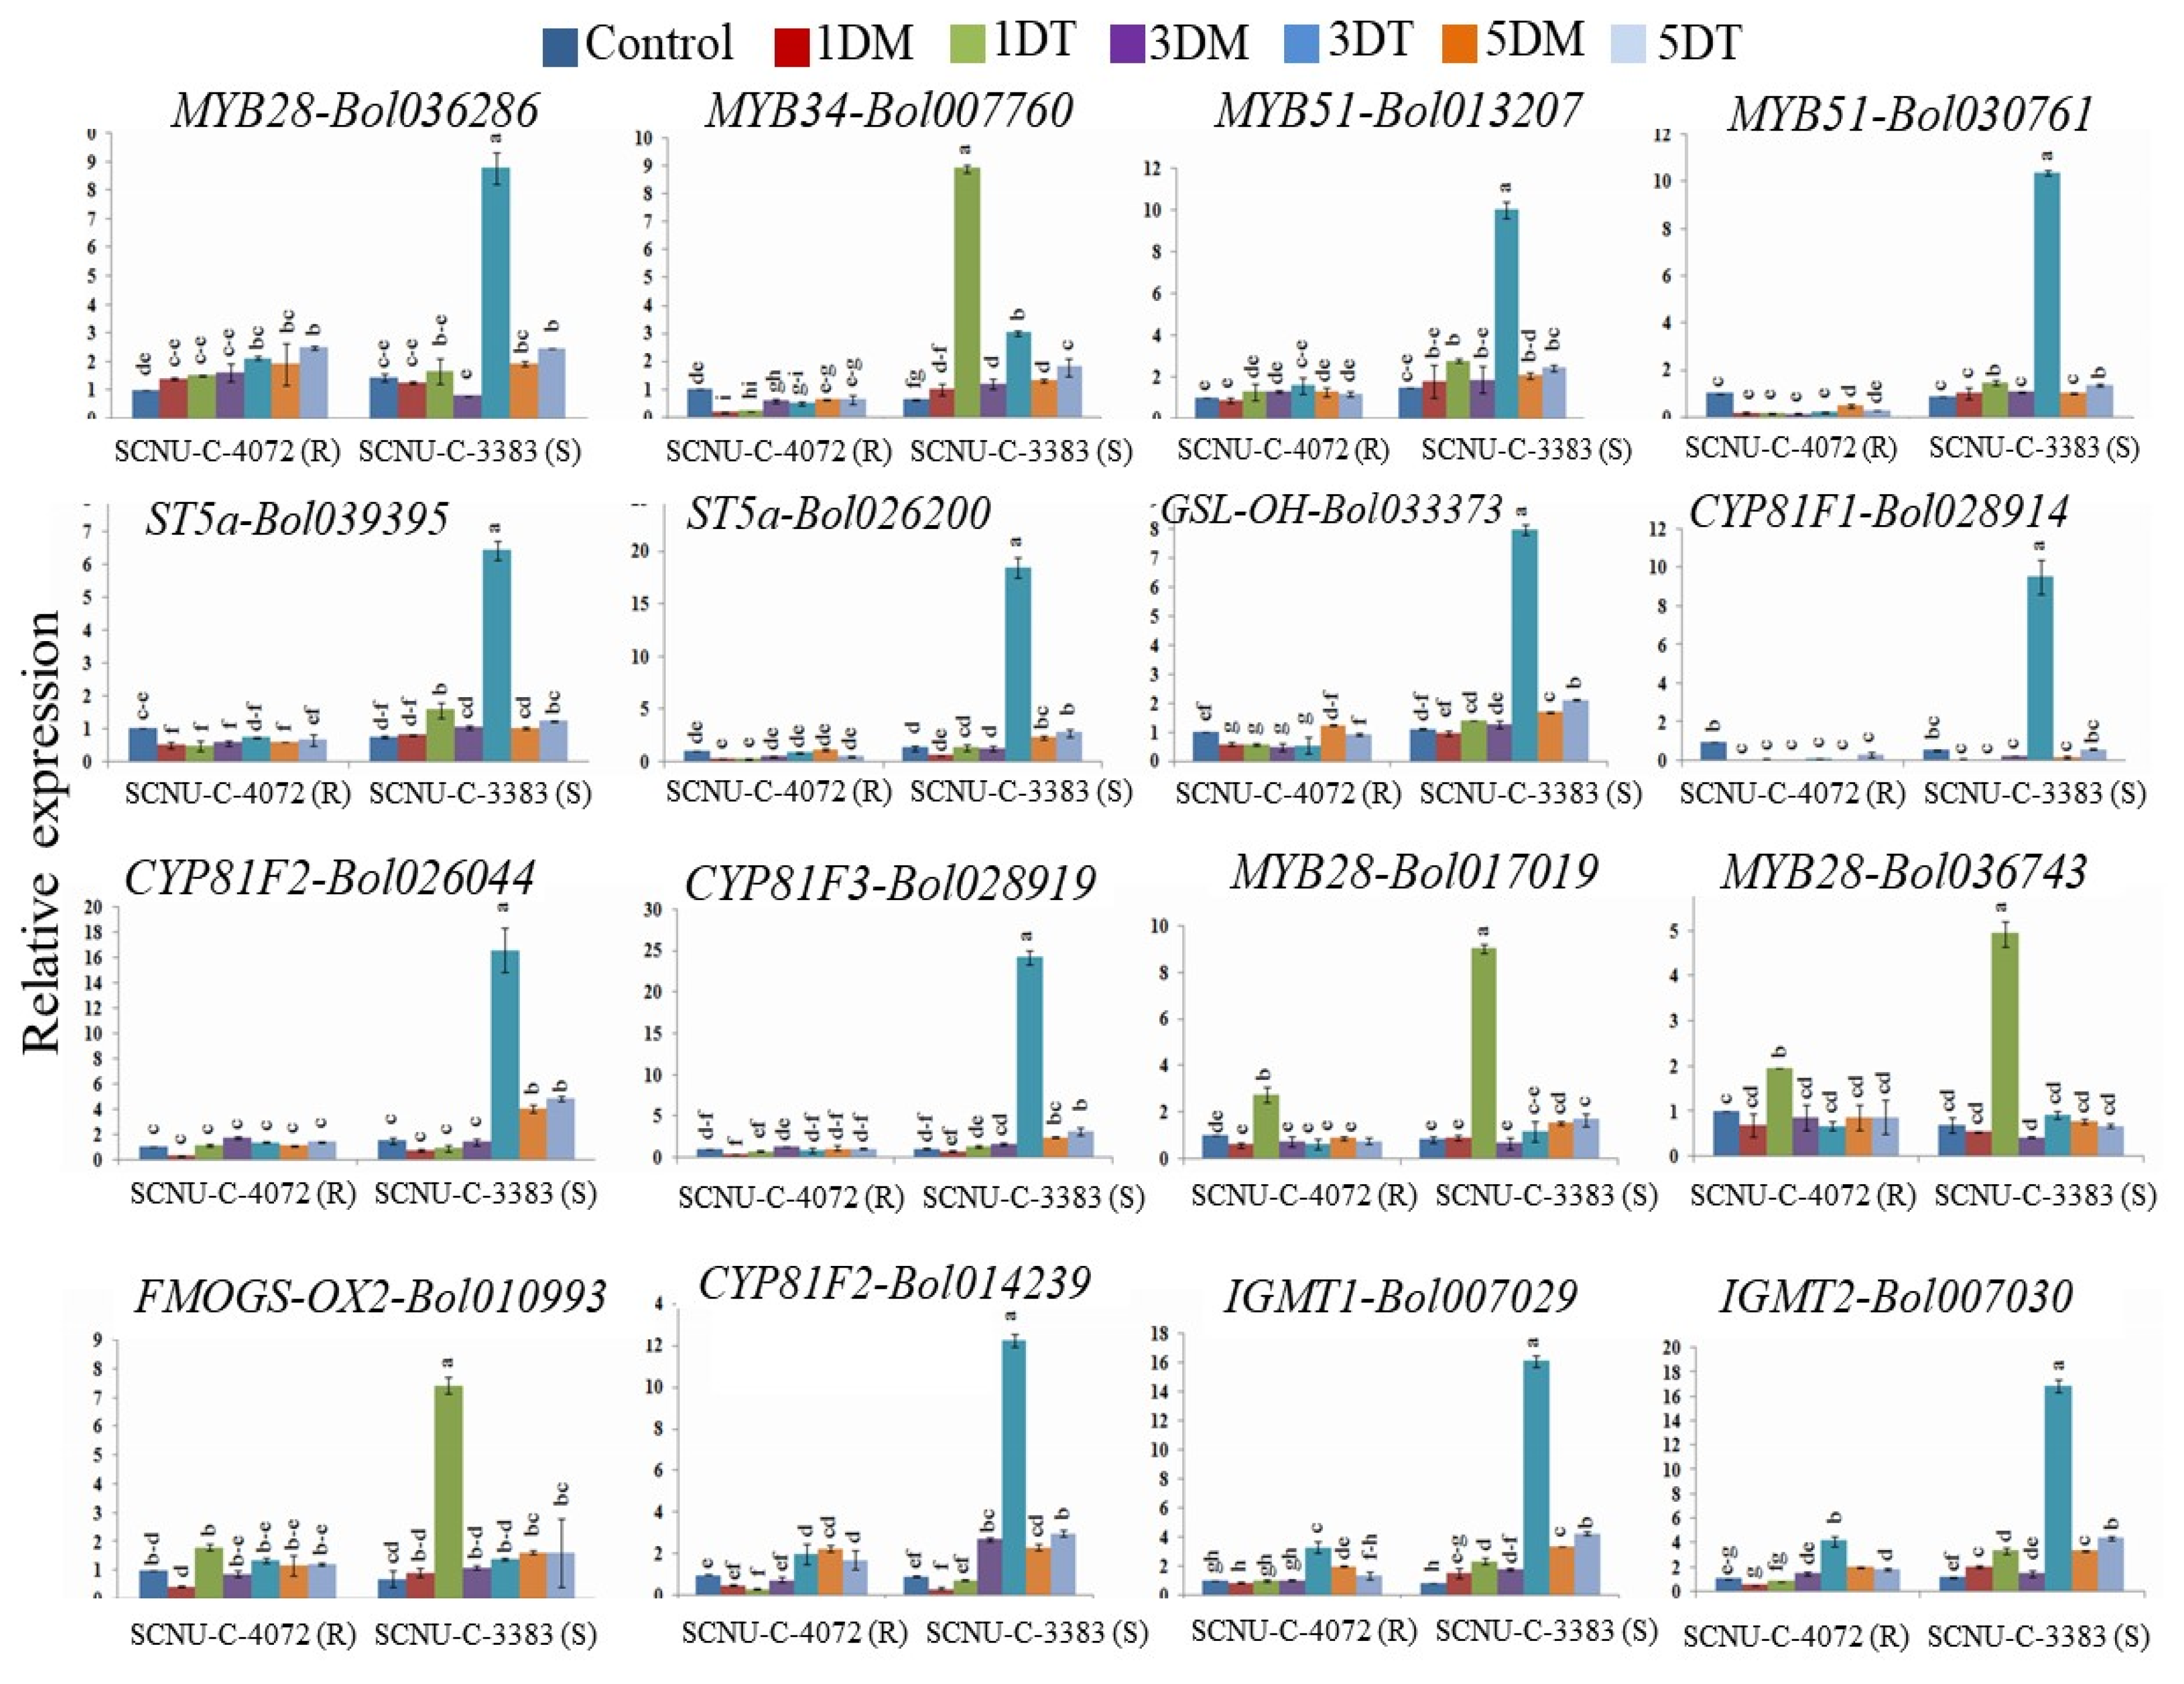
We investigated the expression patterns of selected TF (transcription factor)-related genes of the GSL biosynthesis pathway in the resistant line (SCNU-C-4072) by qPCR. Among them, eight genes showed up-regulation upon Xcc infection at different DAI (Figure 4 and Figure S4). Two genes (MYB122-Bol026204 and MYB34-Bol017062) showed higher relative expression by 49.40- and 36.85-fold up-regulation at 1 DAI and 3 DAI, respectively, compared to mock (Figure 4 and Table S4). Two genes from aliphatic pathway; AOP2-Bo9g006240 and ST5c-Bol030757 showed higher expression by 10.30- and 13.12-fold up-regulation at 1 DAI and 3 DAI, respectively, compared to mock (Figure 4 and Table S7). One indolic biosynthesis gene (CYP81F1-Bol017376) out of four, showed significantly higher expression at 1 DAI by 11.86-fold changed, other three genes, CYP81F2-Bol012237, CYP81F4-Bol032712 and CYP81F4-Bol032714 showed higher expression by 6.40-, 9.69-, and 25.29-fold increased, respectively, at 3 DAI compared to susceptible line and mock (Figure 4 and Table S8).

3.4. Relative Expression of TF-Related and GSL Biosynthesis Genes in Black Rot Susceptible Line

Expression level of 38 GSL biosynthetic genes was measured in the control, mock and infected cabbage plants of the susceptible line (SCNU-C-3383). Three TF-related genes, two from aliphatic GSL biosynthesis (MYB28-Bol017019 and MYB28-Bol036743) and one from indolic biosynthesis (MYB34-Bol007760) were up-regulated by 10.38-, 8.94-, and 8.99-fold, respectively, at 1 DAI compared to mock. In addition, MYB28-Bol036286, MYB51-Bol013207 and MYB51-Bol030761 genes showed higher expression by 11.18-, 5.41- and 9.61-fold changed, respectively, at 3 DAI compared to mock (Figure 5, Figure S2 and Table S6). Two aliphatic GSL biosynthetic genes (FMOGS-OX2-Bol010993 and GSL-OH-Bol033373) showed up-regulation upon Xcc inoculation compared to both control and mock samples by 7.97- and 6.29-fold changed at 1 and 3 DAI, respectively. Eight indolic GSL biosynthetic genes (ST5a-Bol039395, ST5a-Bol026200, CYP81F1-Bol028914, CYP81F2-Bol014239, CYP81F2-Bol026044, CYP81F3-Bol028919, IGMT1-Bol007029 and IGMT2-Bol007030) showed higher expression in the susceptible line at 3 DAI compared to mock by 6.22-, 15.03-, 38.20-, 4.53-, 12.04-, 14.41-, 8.88- and 11.43-fold, respectively (Figure 5 and Table S8). The remaining 14 genes (MYB28-Bol007795, MYB29-Bol008849, MYB34-Bol036262, ST5b-Bol026202, ST5b-Bol026201, FMOGS-OX5-Bol029100, FMOGS-OX5-Bol031350, CYP81F1-Bol028913, CYP81F1-Bol017375, CYP81F3-Bol032711, CYP81F4-Bol028918, IGMT1-Bol020663, AOP2-Bo2g102190, and AOP2-Bo3g052110) were not induced in consistent response upon Xcc infection (Figure S4 and Table S6–S8).

3.5. Relative Expression of GSL Breakdown Related Genes in Cabbage Lines

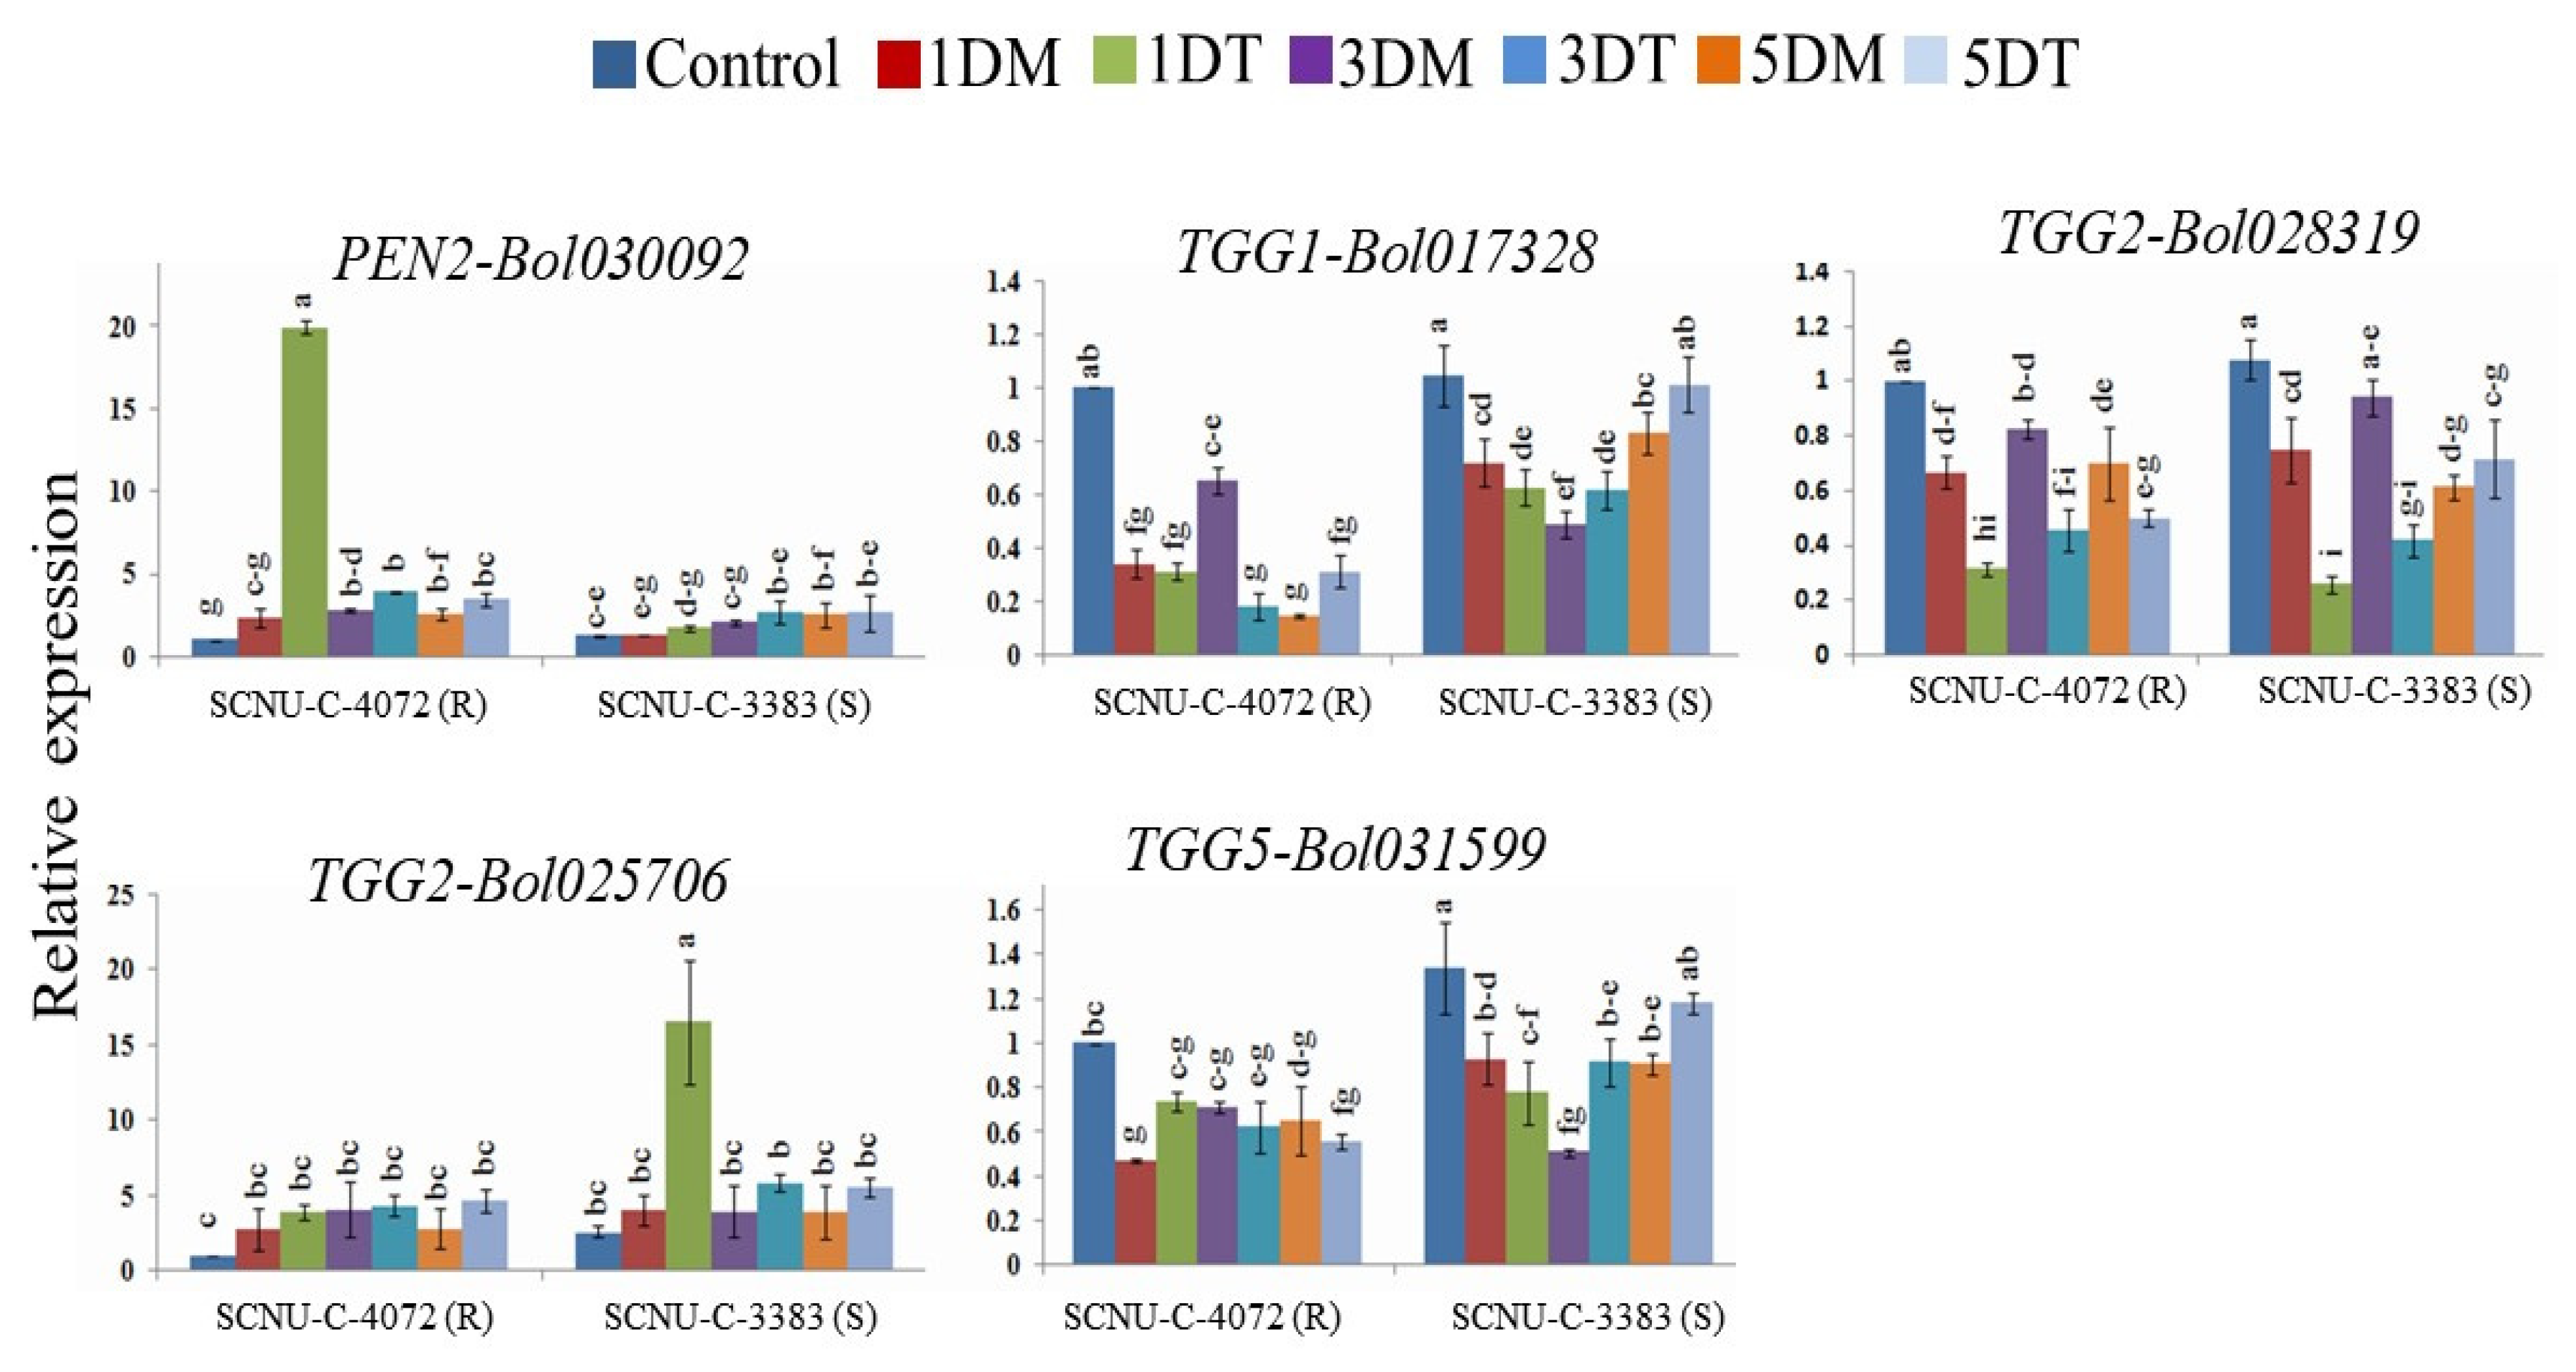
The expression of five GSL breakdown related genes showed significant variations for resistant and susceptible lines at different time courses (Figure 6 and Table S9). Gene PEN2-Bol030092 showed significantly higher expression by 8.47-fold up-regulation at 1 DAI in the resistant line after Xcc infection compared to mock (Figure 6 and Table S9). Whereas, TGG2-Bol025706 gene showed higher expression by 4.14-fold in the susceptible line at 1 DAI compared to mock. The rest of the genes; TGG1-Bol017328, TGG2-Bol028319 and TGG5-Bol031599, did not show any consistent expression in resistant and susceptible lines (Figure 6).

3.6. Correlation between GSL Components and Expression Level of Genes in the Cabbage Lines

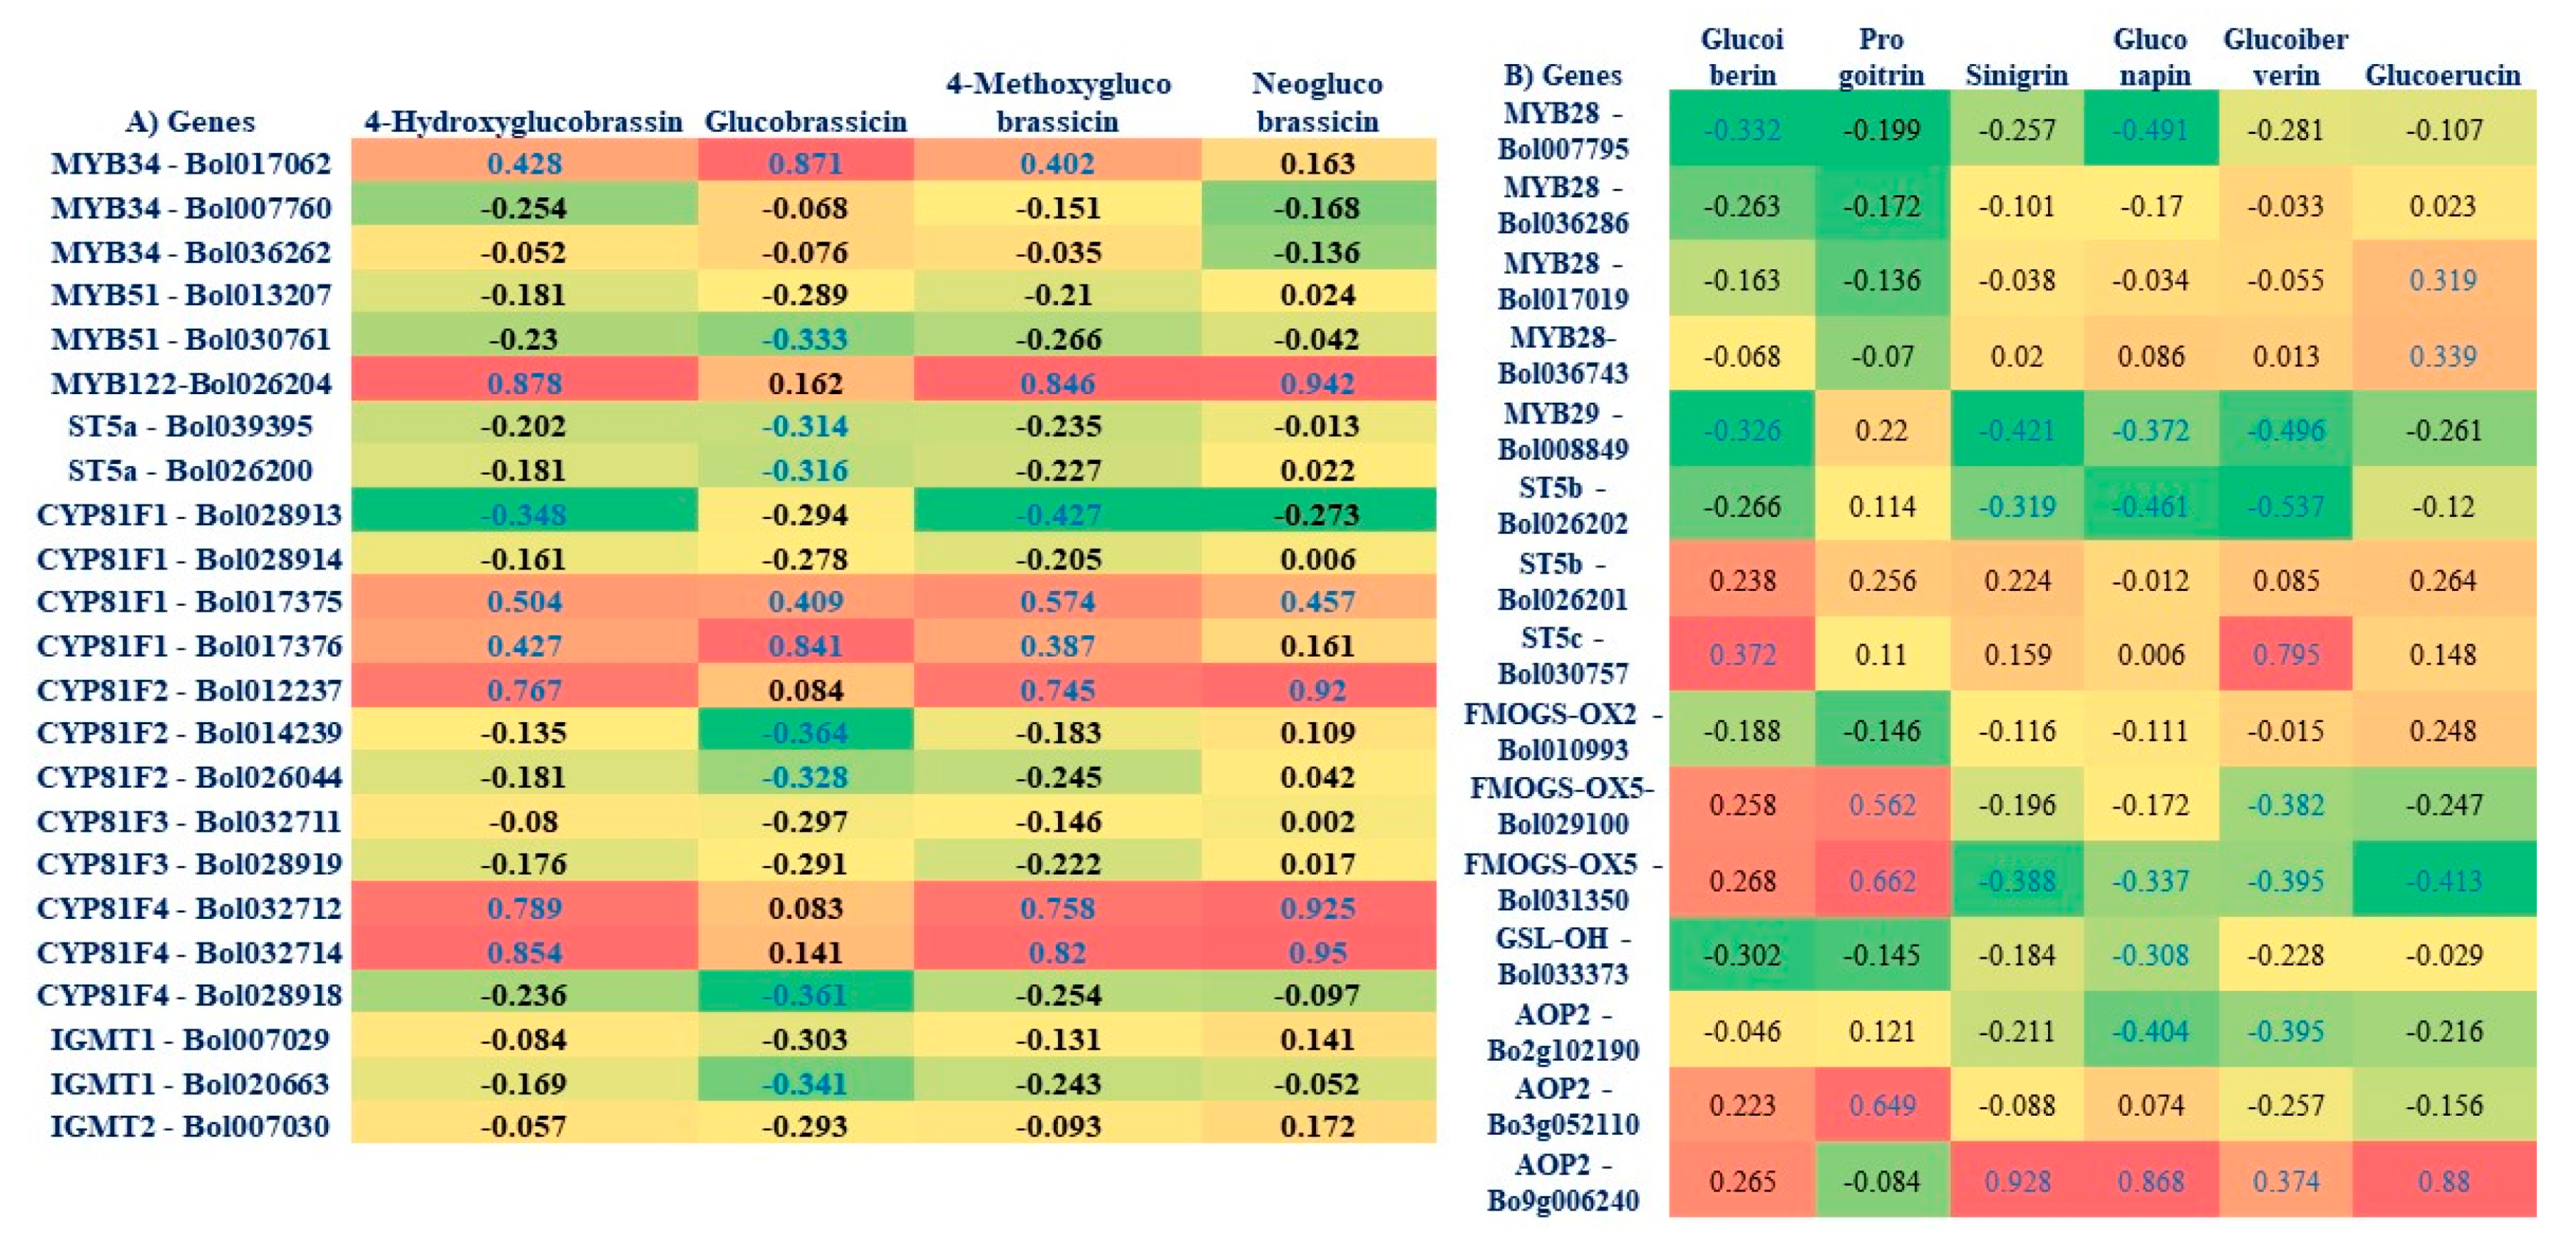
A simple heat map was constructed using expression of TF-related and GSL biosynthesis and breakdown genes and level of individual GSL components after Xcc infection in resistant and susceptible lines (Figure 7A,B). Pearson’s correlation coefficient showed significant positive associations between aliphatic GSL (glucoiberverin and glucoiberin) content and the expression level of ST5c-Bol030757 gene (Figure 7A). Aliphatic GSL compounds (glucoiberverin, sinigrin, gluconapin and glucoerucin) and the expression of AOP2-Bo9g006240 also showed positive association (Figure 7A and Supplementary Data S2). Similarly, aliphatic compound progoitrin and GSL biosynthesis related genes (FMOGS-OX5-Bol029100, FMOGS-OX5-Bol031350 and AOP2-Bo3g052110) showed inconsistent positive association. In addition, a highly significant positive correlation was observed between MYB34-Bol017062 and indolic GSL compounds (hydroxyglucobrassicin, glucobrassicin and mythoxyglucobrassicin). Significant positive associations were found between GSL compounds (hydroxyglucobrassicin, mythoxyglucobrassicin and neoglucobrassicin) and indolic GSL genes (MYB122-Bol026204, CYP81F2-Bol012237, CYP81F4-Bol032712 and CYP81F4-Bol032714) (Figure 7B and Supplementary Data S2).
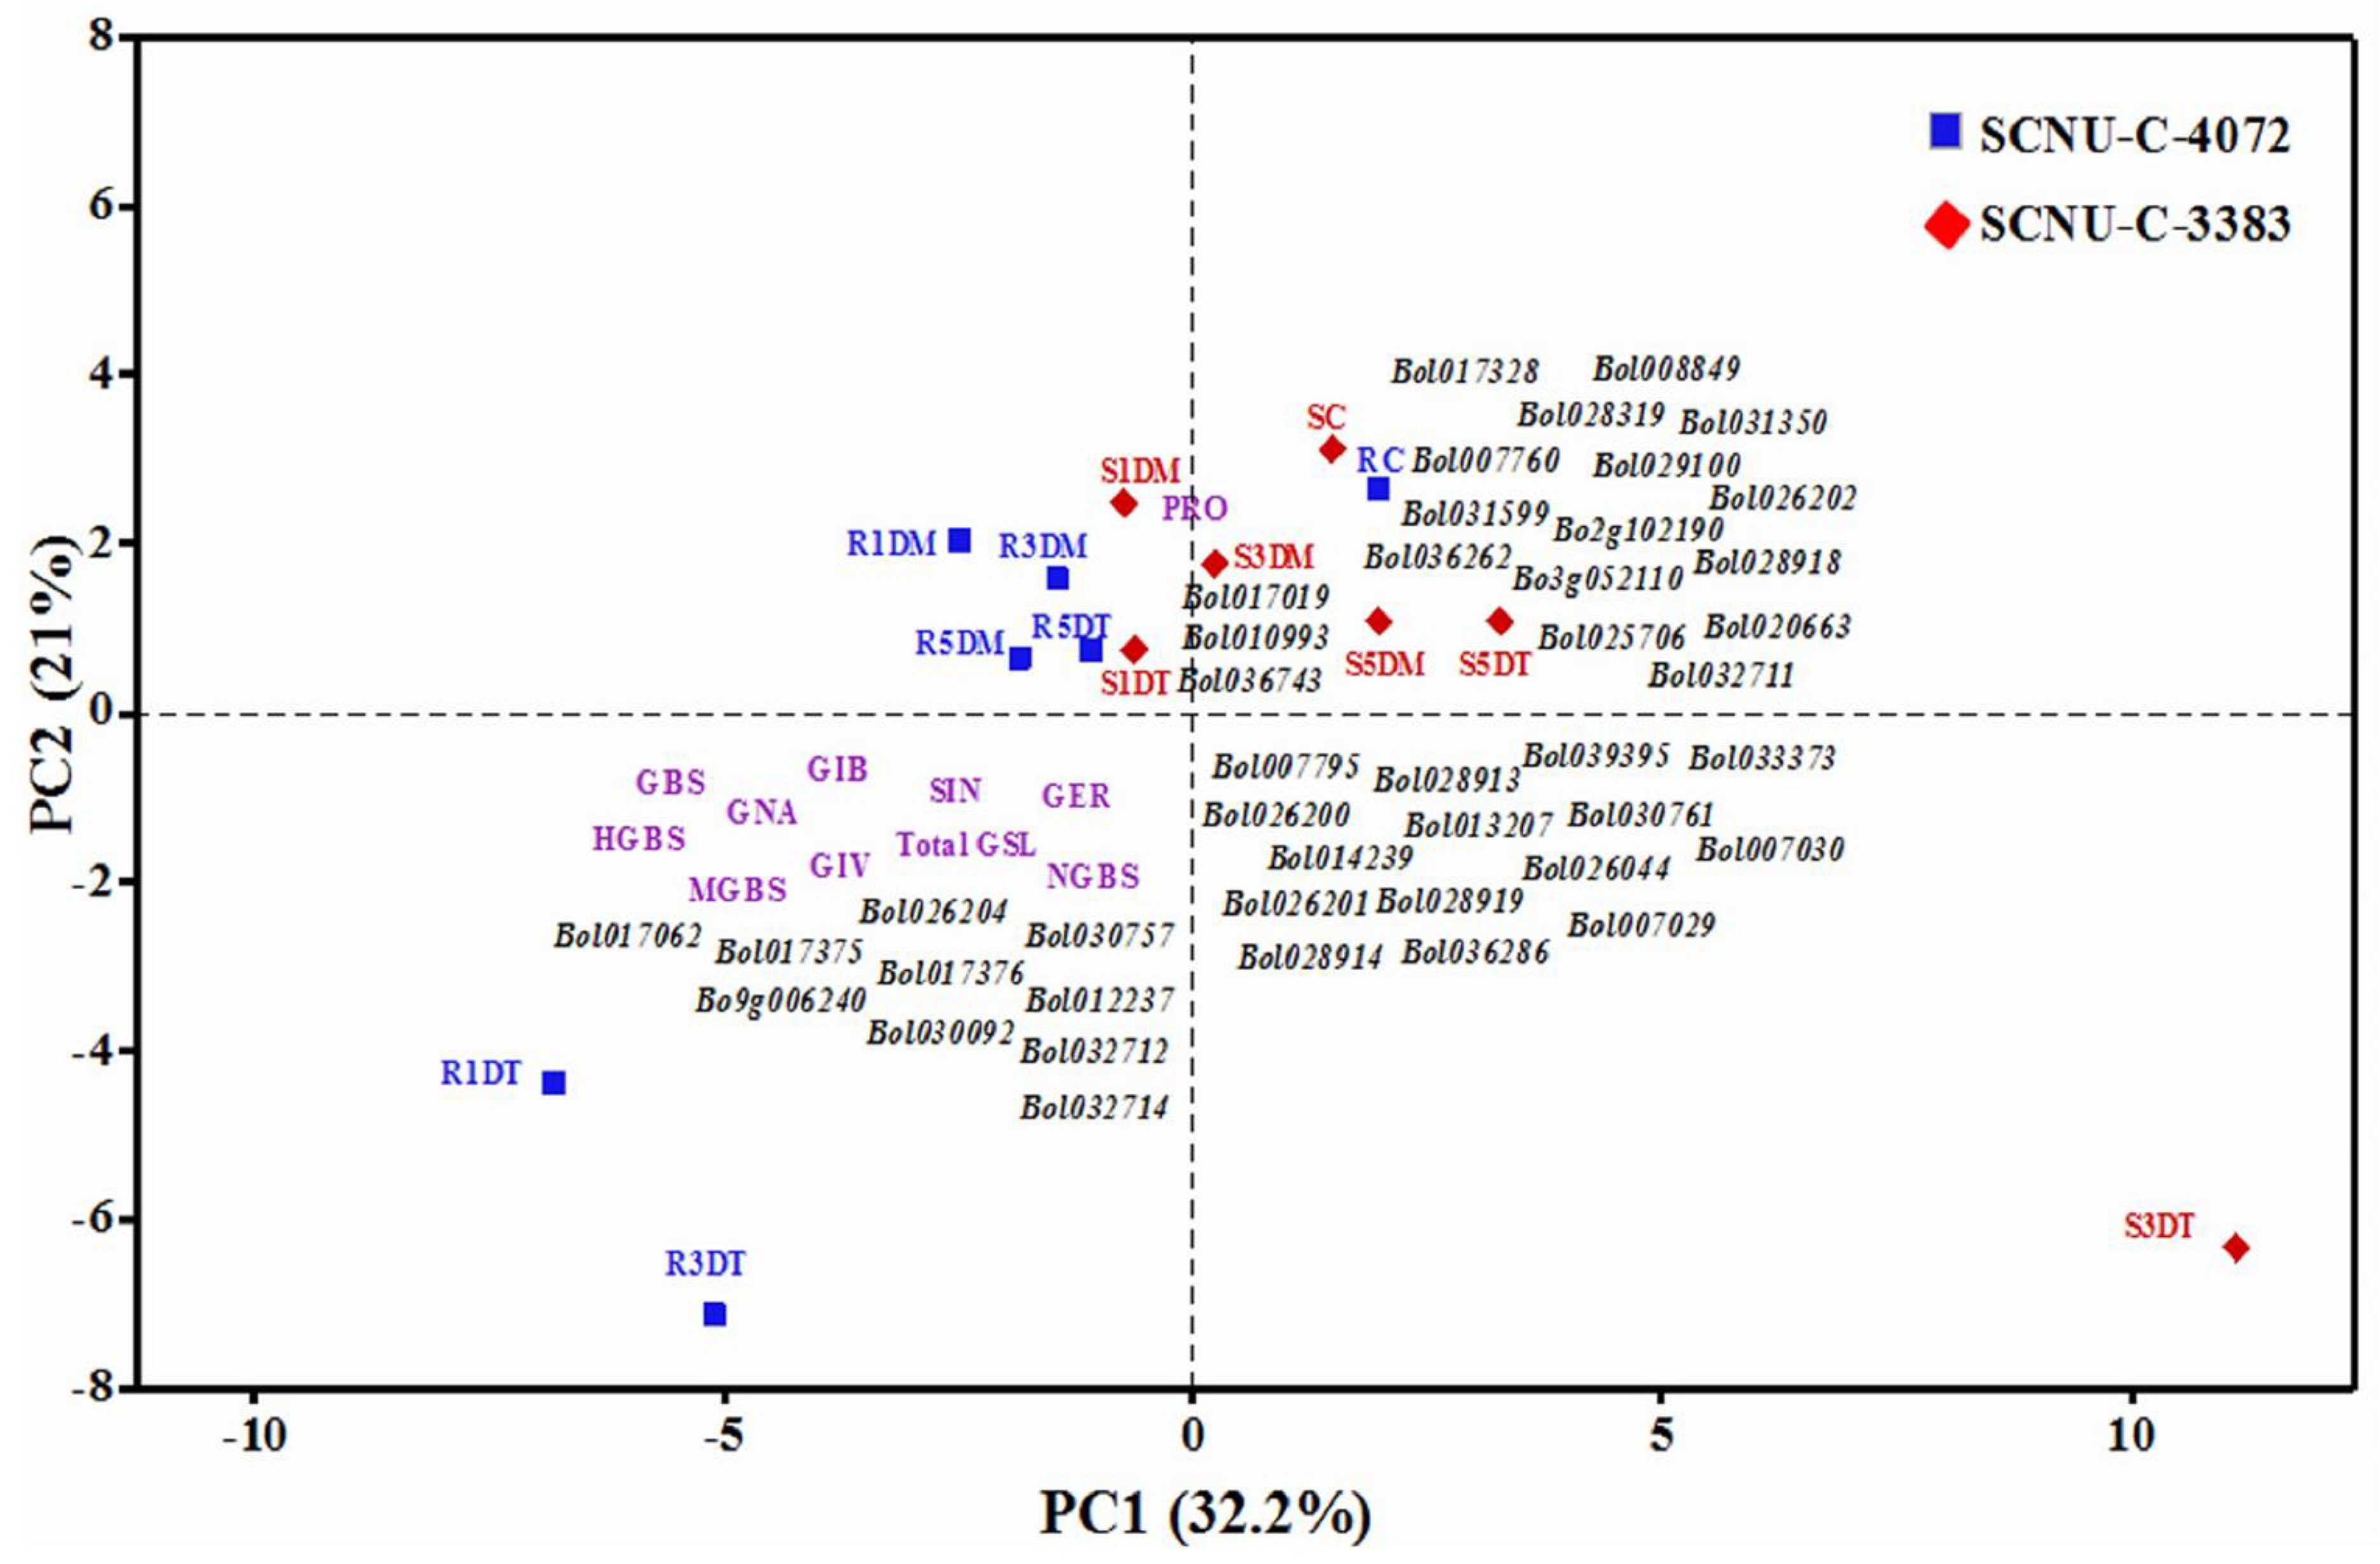
A principal component analysis (PCA) was done by using total GSL, GSL profiles and expression of GSL biosynthesis and breakdown related genes in two contrasting cabbage lines and identified four principal components (PCs) with an eigen value greater than unity. The first four PCs explained 79.2% of the total variance, of which 32.2%, 21.0%, 14.0% and 12.0% of the variances were included from PC1, PC2, PC3 and PC4, respectively (Table S10). The total variation found in PC1 was manifested by the higher positive coefficients of the TF, GSL biosynthesis and breakdown related genes and higher negative coefficients of GSL profiles and total GSL content in resistance and susceptible lines upon Xcc infection (Figure 8 and Table S10). PC1 significantly separated as resistant and susceptible groups, which was also confirmed by Tukey’s test using overall PCA score (Figure 8 and Table S10). The highly expressed GSL biosynthetic and breakdown related genes were plotted with total GSL content and most of the GSL constituents in the resistance line, as shown in the PCA biplot (Figure 8). Results indicate that resistance in cabbage might be attained by synthesizing specific GSL compounds as well as simultaneous actions of breakdown genes.

4. Discussion

4.1. Black Rot Resistant Cabbage Lines Against Xcc

Black rot disease caused by Xcc is the most devastating in cabbage worldwide, causing significant crop losses [42]. Management of this disease is very difficult because of ever changing races and evolving new races of the Xcc pathogen. Therefore, race-specific resistance in Brassica crops like cabbage is important for marker-assisted breeding. We screened 59 cabbage inbred lines against race 4 of Xcc pathogen and the lines SCNU-C-4072 and SCNU-C-3383 were selected as resistance and susceptible, respectively (Figure S1 and Table S1).

4.2. GSL Compounds Varied in the Leaf Tissues of Resistant and Susceptible Cabbage Lines

We found positive association between disease resistance and GSL accumulation in contrasting cabbage lines upon infection of black rot pathogen. In both of the resistant and susceptible lines, total GSL concentration was increased significantly upon Xcc inoculation at different time points; 1 DAI, 3 DAI and 5 DAI (Figure 3), but amount of GSL content and components differed significantly between resistance and susceptible lines. Total GSL level was increased in leaves of B. rapa resistance cultivar upon infection of Leptosphaeria maculans and Fusarium oxysporum; whereas GSL was decreased in the susceptible line [43]. Recently, an increased level of GSL content was reported in resistance cabbage lines against ring spot disease [34]. A similar result was also found in the susceptible B. napus cultivars infected with Alternaria brassicae pathogen [43,44]. In a previous study, a positive association was found between pathogen-induced indolic GSL compounds and infection of Sclerotinia sclerotiorum [45]. In the case of plant pathogenic bacteria, myrosinase enzyme mediated GSL hydrolyzed products to act as tolerant against Xcc [11,17]
Aliphatic GSL (sinigrin, gluconapin, glucoiberverin and glucoerucin) and indolic (glucobrassicin, hydroxyglucobrassicin, mythoxyglucobrassicin and neoglucobrassicin) content was found to increase due to Xcc infection in resistant cabbage line (Figure 3) and represents its involvement in improving resistance against Xcc pathogen in cabbage. Aliphatic GSL (glucoiberverin, indolic; glucobrassicin and mythoxyglucobrassicin) was found to increase in cabbage lines resistant to Mycosphaerella brassicicola [34]. The aliphatic GSL compound, sinigrin showed a potential role in inhibiting the growth of S. sclerotiorum in kale and Arabidopsis [23,46]. It was reported that the aliphatic gluconapin can defend B. rapa plants against Xcc pathogen [17], thereby a higher amount of gluconapin and hydroxyglucobrassicin was found in resistant B. rapa cultivar [43]. In kale, higher hydroxyglucobrassicin exhibited resistant to the Xcc pathogen [46]. A study on kale and Xcc pathogen interactions suggested that the indolic GSLs compound (glucobrassicin) showed as more effective than aliphatic GSLs in disease resistance [23]. Therefore, it could be concluded that increased level of aliphatic and indolic compounds may confer resistance against Xcc pathogen in cabbage.

4.3. Black Rot Pathogen Induced GSL Biosynthesis Genes in Contrasting Cabbage Lines

The qPCR profiles showed differential gene expression in the black rot resistant and susceptible cabbage lines (Figure 2, Figure 4, Figure 5 and Figure 6). Eight genes showed consistent higher relative expression level in the resistant cabbage line (Figure 2 and Figure 4). Among them, two TF, 2 aliphatic GSL and four genes were involved in indolic GSL biosynthesis. Similarly, enhanced expression was found in MYB34-Bol017062, MYB122-Bol026204 and ST5c-Bol030757 genes in the resistant cabbage line, which conferred resistance to ring spot and white mold diseases, respectively [34,36].

4.4. Association of Aliphatic GSL Genes with Individual GSL Compound in Black Rot Resistance

Up-regulation of ST5c-Bol030757 and AOP2-Bo9g006240 genes led to increase aliphatic GSL content in the black rot resistant line upon Xcc infection. Increased expression of aliphatic GSL biosynthesis genes, ST5b and ST5c were found to be involved directly in alteration of desulfoglucosinolates to glucoiberin and glucoiberverin [47]. In this study, increased expression of ST5c-Bol030757 was associated with higher levels of glucoiberverin content in resistant line (Figure 7A and Supplementary data S2) supported by the reports [33,36]. Moreover, AOP2 gene converts methylsulphinylalkyl glucosinolates to sinigrin and gluconapin [47]. In B. rapa, overexpression of AOP2 gene catalyzes conversion of beneficial glucoraphanin to gluconapin [37]. In Arabidopsis, AOP2 gives positive feed-back in regulation of controlling glucosinolate biosynthesis by optimizing the resources in defensive metabolites [48]. AOP2 gene expression showed positive relation between up-regulation of the gene and increased glucoerucin content in cabbage inbred lines [33]. Our results also suggested that Xcc induced up-regulation of genes and increased level of aliphatic compounds may have a link to black rot resistance in cabbage (Figure 7A and Supplementary data S2). However, detailed molecular studies are needed for precision of this association either by gene editing or knock-out mutation of the particular gene.

4.5. Association of Indolic GSL Genes and Individual GSL Compounds in Black rot Resistance

In this study, two TF (MYB122-Bol026204 and MYB34-Bol017062) and four indolic GSL biosynthesis genes (CYP81F1-Bol017376, CYP81F2-Bol012237, CYP81F4-Bol032712 and CYP81F4-Bol032714) were increased significantly in the resistant line upon Xcc infection, which lead to an increase in the indolic compounds (glucobrassicin, hydroxyglucobrassicin, methoxyglucobrassicin and neoglucobrassicin) (Figure 7B and Supplementary data S2). The MYB34 gene regulates indolic GSL biosynthesis directly in Arabidopsis [49] and in B. oleracea [33,35]. MYB34 together with MYB51 and MYB122 regulated resistance in Arabidopsis after Plectosphaerella cucumerina infection and the indolic GSL biosynthesis genes were triggered by GSL breakdown products induced by PEN2 gene [50]. Accumulation of indolic GSL compound tends to up-regulate CYP81F1, CYP81F2, and CYP81F4 genes in the resistant line (Figure 2, Figure 3 and Figure 7B), which is supported by the association between expression of CYP81F1-Bol017376, CYP81F2-Bol012237 genes and glucobrassicin content in B. oleracea [34,50]. Methoxyglucobrassicin level was increased up to 30–47% in response to blackleg pathogen in B. napus after 5–8 days of inoculation [51]. Anti-fungal activity of methoxyglucobrassicin, glucobrassicin and sinigrin was reported in an in vitro analysis [52]. In this study, the indolic GSLs (glucobrassicin, methoxyglucobrassicin, hydroxyglucobrassicin and neoglucobrassicin) were found to increase in resistant line upon Xcc infection (Figure 7B and Supplementary data S2), suggesting their role in conferring resistance against Xcc pathogen in cabbage. Since, CYP81F1-Bol017376, CYP81F2-Bol012237, CYP81F4-Bol032712 and CYP81F4-Bol032714 genes were involved in methoxylation and conversion of glucobrassicin to 4-methoxyglucobrassicin, 4-hydroxyglucobrassicin and neoglucobrassicin, which may boost-up resistance in cabbage. Sixteen GSL biosynthesis genes were highly up-regulated in susceptible line (Figure 2 and Figure 5) and may be involved in the susceptibility to Xcc in cabbage. These results are consistent with low accumulation of individual GSL compound and lower expression of GSL biosynthesis genes in cabbage lines and vice-versa [33].

4.6. Expression of GSL Breakdown Related Genes in Cabbage Lines after Xcc Inoculation

Glucosinolate breakdown related gene (PEN2-Bol030092) showed significant up-regulation in black rot resistant line at 1 DAI (Figure 2 and Figure 6, and Table S7). A previous study reported that PEN2 gene is involved in resistance in Arabidopsis via callose deposition and glucosinolate stimulation [53]. Moreover, accumulation of indolic GSL compound in Arabidopsis after fungal infection is triggered by the myrosinase PEN2 gene [54]. PEN2 plays a key role in triggering the expression of indolic GSL biosynthesis genes in response to necrotrophic fungal pathogen [50]. The GSL hydrolysis products induced by myrosinase were reported to act as tolerance against Xcc [11,17]. The GSL-myrosinase defense system could be altered by the expression of GSL biosynthesis and breakdown related genes and enhance resistance to herbivores [54]. Our PCA results also confirmed the relations of susceptibility and resistance reactions with different GLS compounds and up-regulation of the respective gene at particular time courses.

5. Conclusions

A positive association between expression of GSL biosynthesis and breakdown related genes and individual GSL compound was found in resistant and susceptible cabbage lines upon infection by Xcc race 4. Aliphatic (glucoiberverin, sinigrin, gluconapin and glucoerucin) and indolic (glucobrassicin, hydroxyglucobrassicin, methoxyglucobrassicin and neoglucobrassicin) compounds were associated positively with black rot resistance in cabbage. Individual GSL compounds and their associated genes could be putative candidates for biochemical and genetic stimuli of black rot resistance in cabbage. The predicted candidate genes could be further confirmed by functional characterization to improve black rot resistance breeding in cabbage.

Supplementary Materials

The following are available online at https://www.mdpi.com/2223-7747/9/9/1121/s1, Figure S1: Phenotype screening of selected black rot resistant (SCNU-C-4072) and susceptible (SCNU-C-3383) cabbage lines after inoculation with X. campestris pv. campestris race 4. Photograph was taken at 14 days after inoculation (DAI). Black rot-resistant (R) and -susceptible (S) lines were defined according to the disease scoring scale (0-3), Figure S2: RNA measurement of leaf samples (Black rot) by NanoDrop (ND-1000 Spectrophotometer) (C, control; 1DM, 1 day mock; 1DT, 1 day treated; 3DM, 3 day mock; 3DT, 3 day treated; 5DM, 5 day mock; 5DT, 5 day treated). R: Resistant; S: Susceptible, Figure S3: RT-PCR amplification of black rot cDNA sample of cabbage R (SCNU-C-4072) and S (SCNU-C-3383) lines by three actins (actin 1, 2, and 3) primer of Brassica oleracea. (C, control; 1DM, 1 day mock; 1DT, 1 day treated; 3DM, 3 day mock; 3DT, 3 day treated; 5DM, 5 day mock; 5DT, 5 day treated). R: Resistant; S: Susceptible. M: 100 bp DNA ladder, Figure S4: Inconsistent response of expression of transcription factor related and glucosinolate biosynthesis genes in black rot R (SCNU-C-4072) and S (SCNU-C-3383) lines of cabbage. C, control; 1DM, 1 day mock; 1DT, 1 day treated; 3DM, 3 day mock; 3DT, 3 day treated; 5DM, 5 day mock; 5DT, 5 day treated. The mean of three biological replicates are used. Vertical bars indicate standard deviation. Different letters indicate statistically significant differences between R and S lines and treatment interactions. R: Resistant; S: Susceptible, Table S1: Phenotypic performance of cabbage (Brassica oleracea var. capitata) lines after inoculation with Xcc race 4 to identify the black rot resistance cabbage lines following by the most popular disease scoring scale based on lesion size produced on the leaves (0–3: 0 = R, 1 = MR, 2 = S and 3 = HS) (Vicente et al. 2001). Cabbage leaves rated 0 for resistant (R), 1 for moderately resistant (MR), 2 for susceptible (S) and 3 for highly susceptible (HS). Black bold color resistant and susceptible lines were selected for GSL profiling and GSL biosynthesis including with GSL break-down related gene expressions, Table S2: Primer sequences and efficiency (Abuyusuf et al. 2018; Robin et al. 2016) for the 43 glucosinolate (GSL) biosynthesis and GSL break-down related genes including three actin genes (actin1, actin2 and actin3) used in the relative expression analysis through q-PCR in black rot resistant (SCNU-C-4072) and susceptible (SCNU-C-3383) lines, Table S3: Test statistic F and P-values for glucosinolate component in black rot resistant (R) line SCNU-C-4072 and susceptible (S) line SCNU-C-3383 of cabbage at a significance level of α = 0.05, respectively, Table S4: Test statistic F and P-values for expression of glucosinolate biosynthesis and myrosinase genes in black rot resistant (R) line SCNU-C-4072 and susceptible (S) line SCNU-C-3383 of cabbage at a significance level of P < 0.05, respectively, Table S5: Heat maps comparing black rot resistant (SCNU-C-4072) and susceptible SCNU-C-3383) lines shows fold changes in individual glucosinolate component in X.campestris pv. campestris–inoculated leaf samples compared to respective mock-treated samples.1 Day, T1/M1; 3 Day, T3/M3, 5 Day, T5/M5; M1, 1 day mock; T1, 1 day treated; M3, 3 day mock; T3, 3 day treated; M5, 5 day mock; T5, 5 day treated, Table S6: Heat maps comparing black rot resistant line SCNU-C-4072 and susceptible line SCNU-C-3383 shows fold changes in expression of transcription factor related genes in X. campestris pv. campestris-inoculated leaf samples compared to respective mock-treated samples. 1 Day, T1/M1; 3 Day, T3/M3, 5 Day, T5/M5; M1, 1 day mock; T1, 1 day treated; M3, 3 day mock; T3, 3 day treated; M5, 5 day mock; T5, 5 day treated, Table S7: Heat maps comparing black rot resistant line SCNU-C-4072 and susceptible line SCNU-C-3383 shows fold changes in expression of aliphatic glucosinolate biosynthesis genes in X. campestris pv. campestris-inoculated leaf samples compared to respective mock-treated samples. 1 Day, T1/M1; 3 Day, T3/M3, 5 Day, T5/M5; M1, 1 day mock; T1, 1 day treated; M3, 3 day mock; T3, 3day treated; M5, 5 day mock; T5, 5 day treated, Table S8: Heat maps comparing black rot resistant line SCNU-C-4072 and susceptible line SCNU-C-3383 shows fold changes in expression of indolic glucosinolate biosynthesis genes in X. campestris pv. campestris-inoculated leaf samples compared to respective mock-treated samples. 1 Day, T1/M1; 3 Day, T3/M3, 5 Day, T5/M5; M1, 1 day mock; T1, 1 day treated; M3, 3 day mock; T3, 3 day treated; M5, 5 day mock; T5, 5 day treated, Table S9: Heat maps comparing black rot resistant line SCNU-C-4072 and susceptible line SCNU-C-3383 shows fold changes in expression of glucosinolate break-down related genes in X. campestris pv. campestris-inoculated leaf samples compared to respective mock-treated samples. 1 Day, T1/M1; 3 Day, T3/M3, 5 Day, T5/M5; M1, 1 day mock; T1, 1 day treated; M3, 3 day mock; T3, 3 day treated; M5, 5 day mock; T5, 5 day treated, Table S10: Component loadings of cabbage black rot resistant (R;SCNU-C-4072) and susceptible (S;SCNU-C-3383) lines, glucosinolate compounds and glucosinolate biosynthesis and GSL break-down related gene responses as determined by the principal component analysis (PCA) Tukey test was done based on p < 0.05, Supplementary file 1: Mass spectrometry analysis (HPLC/MS, Agilent 1,200 series, Agilent Technologies) of leaf samples from black rot R line SCNU-C-4072 (1-7) and S line SCNU-C-3383 (8-14) of cabbage under different treatments (C, control; 1DM, 1 day mock; 1DT, 1 day treated; 3DM, 3 day mock; 3DT, 3 day treated; 5DM, 5 day mock; 5DT, 5 day treated) was used to identify individual GSLs. R: Resistant; S: Susceptible, Supplementary file 2: Correlation matrix value for GSL genes and individual GSL content.

Author Contributions

I.S.N., J.I.P., H.T.K. and A.H.K.R. conceived and designed the study. M.H.R. inoculated the plants, collected samples, prepared cDNA, performed qPCR analysis, and prepared the manuscript draft. M.A. analyzed the data. U.K.N. extensively edited and finalized the manuscript. H.J.J. conducted qPCR and analyzed the qPCR data. All authors have read and agreed to the published version of the manuscript.

Funding

This study was supported by the Center for Horticultural Seed Development (project No. 213007-05-4-WT611) of the Ministry of Agriculture, Food and Rural Affairs in the Republic of Korea (MAFRA).

Acknowledgments

We thank Joana G. Vicente, University of Warwick, United Kingdom for providing Xcc race 4 isolate.

Conflicts of Interest

The authors declare no conflict of interest.

References

  1. FAOSTAT. Statistics Division, Food and Agriculture Organization of the United Nations. Rome Italy 2015. Available online: http://ftp.fao.org/ (accessed on 30 June 2020).
  2. Kim, B.S. Testing for detection of Xanthomonas campestris pv. campestris in crucifer seeds and seed disinfection. Korean J. Plant Pathol. 1986, 2, 96–101. [Google Scholar]
  3. Vicente, J.G.; Holub, E.B. Xanthomonas campestris pv. campestris (cause of black rot of crucifers) in the genomic era is still a worldwide threat to brassica crops. Mol. Plant Pathol. 2013, 14, 2–18. [Google Scholar] [CrossRef] [PubMed]
  4. Williams, P.H. Black rot: A continuing threat to world crucifers. Plant Dis. 1980, 64, 736–742. [Google Scholar] [CrossRef]
  5. Kocks, C.; Zadoks, J.; Ruissen, M. Spatio-temporal development of black rot (X. campestris pv. campestris) in cabbage in relation to initial inoculum levels in field plots in The Netherlands. Plant Pathol. 1999, 48, 176–188. [Google Scholar] [CrossRef]
  6. Fargier, E.; Manceau, C. Pathogenicity assays restrict the species Xanthomonas campestris into three pathovars and reveal nine races within X. campestris pv. campestris. Plant Pathol. 2007, 56, 805–818. [Google Scholar] [CrossRef]
  7. Cruz, J.; Tenreiro, R.; Cruz, L. Assesment of diversity of Xanthomonas campestris pathovars affecting cruciferous plants in Portugal and disclosure of two novel X. campestris pv. campestris races. J. Plant Pathol. 2017, 99, 403–414. [Google Scholar]
  8. Jensen, B.D.; Vicente, J.G.; Manandhar, H.K.; Roberts, S.J. Occurrence and diversity of Xanthomonas campestris pv. campestris in vegetable Brassica fields in Nepal. Plant Dis. 2010, 94, 298–305. [Google Scholar] [CrossRef] [Green Version]
  9. Taylor, J.; Conway, J.; Roberts, S.; Astley, D.; Vicente, J.G. Sources and origin of resistance to Xanthomonas campestris pv. campestris in Brassica genomes. Phytopathology 2002, 92, 105–111. [Google Scholar] [CrossRef] [Green Version]
  10. Villeth, G.R.; Reis, F.B., Jr.; Tonietto, A.; Huergo, L.; De Souza, E.M.; Pedrosa, F.O.; Franco, O.L.; Mehta, A. Comparative proteome analysis of Xanthomonas campestris pv. campestris in the interaction with the susceptible and the resistant cultivars of Brassica oleracea. FEMS Microbiol. Lett. 2009, 298, 260–266. [Google Scholar] [CrossRef] [Green Version]
  11. Aires, A.; Dias, C.S.; Carvalho, R.; Oliveira, M.H.; Monteiro, A.A.; Simões, M.V.; Rosa, E.A.; Bennett, R.N.; Saavedra, M.J. Correlations between disease severity, glucosinolate profiles and total phenolics and Xanthomonas campestris pv. campestris inoculation of different Brassicaceae. Sci. Hortic. 2011, 129, 503–510. [Google Scholar] [CrossRef]
  12. Bennett, R.N.; Wallsgrove, R.M. Secondary metabolites in plant defence mechanisms. New Phytol. 1994, 127, 617–633. [Google Scholar] [CrossRef]
  13. Kliebenstein, D. Secondary metabolites and plant/environment interactions: A view through Arabidopsis thaliana tinged glasses. Plant Cell Environ. 2004, 27, 675–684. [Google Scholar] [CrossRef]
  14. Rahmanpour, S.; Backhouse, D.; Nonhebel, H. Induced tolerance of Sclerotinia sclerotiorum to isothiocyanates and toxic volatiles from Brassica species. Plant Pathol. 2009, 58, 479–486. [Google Scholar] [CrossRef]
  15. Fahey, J.W.; Zalcmann, A.T.; Talalay, P. The chemical diversity and distribution of glucosinolates and isothiocyanates among plants. Phytochemistry 2001, 56, 5–51. [Google Scholar] [CrossRef]
  16. Bekaert, M.; Edger, P.P.; Hudson, C.M.; Pires, J.C.; Conant, G.C. Metabolic and evolutionary costs of herbivory defense: Systems biology of glucosinolate synthesis. New Phytol. 2012, 196, 596–605. [Google Scholar] [CrossRef] [PubMed]
  17. Velasco, P.; Lema, M.; Francisco, M.; Soengas, P.; Cartea, M. In vivo and in vitro effects of secondary metabolites against Xanthomonas campestris pv. campestris. Molecules 2013, 18, 11131–11143. [Google Scholar] [CrossRef] [PubMed] [Green Version]
  18. Cartea, M.E.; Velasco, P. Glucosinolates in Brassica foods: Bioavailability in food and significance for human health. Phytochem. Rev. 2008, 7, 213–229. [Google Scholar] [CrossRef]
  19. Van Horn, L.; McCoin, M.; Kris-Etherton, P.M.; Burke, F.; Carson, J.A.S.; Champagne, C.M.; Karmally, W.; Sikand, G. The evidence for dietary prevention and treatment of cardiovascular disease. J. Am. Diet. Assoc. 2008, 108, 287–331. [Google Scholar] [CrossRef]
  20. Rangkadilok, N.; Nicolas, M.E.; Bennett, R.N.; Premier, R.R.; Eagling, D.R.; Taylor, P.W.J. Developmental changes of sinigrin and glucoraphanin in three Brassica species (Brassica nigra, Brassica juncea and Brassica oleracea var. italica). Sci. Hortic. 2002, 96, 11–26. [Google Scholar] [CrossRef]
  21. Li, G.; Riaz, A.; Goyal, S.; Abel, S.; Quiros, C.F. Inheritance of Three Major Genes Involved in the Synthesis of Aliphatic Glucosinolates in Brassica oleracea. J. Am. Soc. Hortic. Sci. 2001, 126, 427. [Google Scholar] [CrossRef] [Green Version]
  22. Hiruma, K.; Fukunaga, S.; Bednarek, P.; Piślewska-Bednarek, M.; Watanabe, S.; Narusaka, Y.; Shirasu, K.; Takano, Y. Glutathione and tryptophan metabolism are required for Arabidopsis immunity during the hypersensitive response to hemibiotrophs. Proc. Nat. Acad. Sci. USA 2013, 110, 9589–9594. [Google Scholar] [CrossRef] [PubMed] [Green Version]
  23. Madloo, P.; Lema, M.; Francisco, M.; Soengas, P. Changes in glucosinolates content in Brassica oleracea modulate disease severity caused by Xanthomonas campestris pv. campestris. In Proceedings of the VII International Symposium on Brassicas 1202, Berlin, Germany, 17–20 September 2017; pp. 75–80. [Google Scholar]
  24. Bednarek, P.; Piślewska-Bednarek, M.; Svatoš, A.; Schneider, B.; Doubský, J.; Mansurova, M.; Humphry, M.; Consonni, C.; Panstruga, R.; Sanchez-Vallet, A.; et al. A Glucosinolate Metabolism Pathway in Living Plant Cells Mediates Broad-Spectrum Antifungal Defense. Science 2009, 323, 101–106. [Google Scholar] [CrossRef] [PubMed]
  25. Brader, G.; Mikkelsen, M.D.; Halkier, B.A.; Tapio Palva, E. Altering glucosinolate profiles modulates disease resistance in plants. Plant J. 2006, 46, 758–767. [Google Scholar] [CrossRef] [PubMed]
  26. Giamoustaris, A.; Mithen, R. The effect of modifying the glucosinolate content of leaves of oilseed rape (Brassica napus ssp. oleifera) on its interaction with specialist and generalist pests. Ann. Appl. Biol. 1995, 126, 347–363. [Google Scholar] [CrossRef]
  27. Lazzeri, L.; Manici, L.M. Allelopathic Effect of Glucosinolate-containing Plant Green Manure on Pythium sp. and Total Fungal Population in Soil. HortScience 2001, 36, 1283. [Google Scholar] [CrossRef]
  28. Motisi, N.; Montfort, F.; Doré, T.; Romillac, N.; Lucas, P. Duration of control of two soilborne pathogens following incorporation of above- and below-ground residues of Brassica juncea into soil. Plant Pathol. 2009, 58, 470–478. [Google Scholar] [CrossRef]
  29. Agrawal, A.A.; Kurashige, N.S. A role for isothiocyanates in plant resistance against the specialist herbivore Pieris rapae. J. Chem. Ecol. 2003, 29, 1403–1415. [Google Scholar] [CrossRef]
  30. Vicente, J.G.; Conway, J.; Roberts, S.; Taylor, J. Identification and origin of Xanthomonas campestris pv. campestris races and related pathovars. Phytopathology 2001, 91, 492–499. [Google Scholar] [CrossRef] [Green Version]
  31. King, E.O.; Ward, M.K.; Raney, D.E. Two simple media for the demonstration of pyocyanin and fluorescin. Transl. Res. 1954, 44, 301–307. [Google Scholar]
  32. Pandey, K.K.; Pandey, P.K.; Singh, B. Artificial screening for black rot resistance based on different disease parameter in early cauliflower. Mycobiology 2003, 31, 173–178. [Google Scholar] [CrossRef]
  33. Robin, A.; Yi, G.-E.; Laila, R.; Yang, K.; Park, J.-I.; Kim, H.; Nou, I.-S. Expression profiling of glucosinolate biosynthetic genes in Brassica oleracea L. var. capitata inbred lines reveals their association with glucosinolate content. Molecules 2016, 21, 787. [Google Scholar] [CrossRef] [PubMed] [Green Version]
  34. Abuyusuf, M.; Robin, A.; Kim, H.-T.; Islam, M.; Park, J.-I.; Nou, I.-S. Altered glucosinolate profiles and expression of glucosinolate biosynthesis genes in ringspot-resistant and susceptible cabbage lines. Int. J. Mol. Sci. 2018, 19, 2833. [Google Scholar] [CrossRef] [Green Version]
  35. Yi, G.-E.; Robin, A.; Yang, K.; Park, J.-I.; Kang, J.-G.; Yang, T.-J.; Nou, I.-S. Identification and expression analysis of glucosinolate biosynthetic genes and estimation of glucosinolate contents in edible organs of Brassica oleracea subspecies. Molecules 2015, 20, 13089–13111. [Google Scholar] [CrossRef] [PubMed]
  36. Abuyusuf, M.; Robin, A.; Lee, J.-H.; Jung, H.-J.; Kim, H.-T.; Park, J.-I.; Nou, I.-S. Glucosinolate Profiling and Expression Analysis of Glucosinolate Biosynthesis Genes Differentiate White Mold Resistant and Susceptible Cabbage Lines. Int. J. Mol. Sci. 2018, 19, 4037. [Google Scholar] [CrossRef] [PubMed] [Green Version]
  37. Zhang, J.; Liu, Z.; Liang, J.; Wu, J.; Cheng, F.; Wang, X. Three genes encoding AOP2, a protein involved in aliphatic glucosinolate biosynthesis, are differentially expressed in Brassica rapa. J. Exp. Bot. 2015, 66, 6205–6218. [Google Scholar] [CrossRef]
  38. Liu, S.; Liu, Y.; Yang, X.; Tong, C.; Edwards, D.; Parkin, I.A.; Zhao, M.; Ma, J.; Yu, J.; Huang, S. The Brassica oleracea genome reveals the asymmetrical evolution of polyploid genomes. Nat. Commun. 2014, 5, 3930. [Google Scholar] [CrossRef]
  39. Zhang, B.; Hu, Z.; Zhang, Y.; Li, Y.; Zhou, S.; Chen, G. A putative functional MYB transcription factor induced by low temperature regulates anthocyanin biosynthesis in purple kale (Brassica Oleracea var. acephala f. tricolor). Plant Cell Rep. 2012, 31, 281–289. [Google Scholar] [CrossRef]
  40. Nawaz, I.; Iqbal, M.; Hakvoort, H.W.; Bliek, M.; de Boer, B.; Schat, H. Expression levels and promoter activities of candidate salt tolerance genes in halophytic and glycophytic Brassicaceae. Environ. Exp. Bot. 2014, 99, 59–66. [Google Scholar] [CrossRef]
  41. Lee, J.; Yang, K.; Lee, M.; Kim, S.; Kim, J.; Lim, S.; Kang, G.-H.; Min, S.R.; Kim, S.-J.; Park, S.U. Differentiated cuticular wax content and expression patterns of cuticular wax biosynthetic genes in bloomed and bloomless broccoli (Brassica oleracea var. italica). Proc. Biochem. 2015, 50, 456–462. [Google Scholar] [CrossRef]
  42. Livak, K.J.; Schmittgen, T.D. Analysis of relative gene expression data using real-time quantitative PCR and the 2-ΔΔCT method. Methods 2001, 25, 402–408. [Google Scholar] [CrossRef]
  43. Saha, P.; Kalia, P.; Sharma, M.; Singh, D. New source of black rot disease resistance in Brassica oleracea and genetic analysis of resistance. Euphytica 2016, 207, 35–48. [Google Scholar] [CrossRef]
  44. Abdel-Farid, I.B.; Jahangir, M.; Mustafa, N.R.; Van Dam, N.M.; Van den Hondel, C.A.; Kim, H.K.; Choi, Y.H.; Verpoorte, R. Glucosinolate profiling of Brassica rapa cultivars after infection by Leptosphaeria maculans and Fusarium oxysporum. Biochem. Syst. Ecol. 2010, 38, 612–620. [Google Scholar] [CrossRef] [Green Version]
  45. Doughty, K.; Porter, A.; Morton, A.; Kiddle, G.; Bock, C.; Wallsgrove, R. Variation in the glucosinolate content of oilseed rape (Brassica napus L.) leaves: II. Response to infection by Alternaria brassicae (Berk.) Sacc. Ann. Appl. Biol. 1991, 118, 469–477. [Google Scholar] [CrossRef]
  46. Li, Y.; Chen, J.; Bennett, R.; Kiddle, G.; Wallsgrove, R.; Huang, Y.; He, Y. Breeding, inheritance, and biochemical studies on Brassica napus cv. Zhougyou 821: Tolerance to Sclerotinia sclerotiorum (stem rot). In Proceedings of Proceedings of the 10th International Rapeseed Congress’, Canberra, Australia, 5–10 July 1999. [Google Scholar]
  47. Madloo, P.; Lema, M.; Francisco, M.; Soengas, P. Role of Major Glucosinolates in the Defense of Kale Against Sclerotinia sclerotiorum and Xanthomonas campestris pv. campestris. Phytopathology 2019, 109, 1246–1256. [Google Scholar] [CrossRef] [PubMed]
  48. Burow, M.; Atwell, S.; Francisco, M.; Kerwin, R.E.; Halkier, B.A.; Kliebenstein, D.J. The glucosinolate biosynthetic gene AOP2 mediates feed-back regulation of jasmonic acid signaling in Arabidopsis. Mol. Plant 2015, 8, 1201–1212. [Google Scholar] [CrossRef] [PubMed] [Green Version]
  49. Sotelo, T.; Lema, M.; Soengas, P.; Cartea, M.; Velasco, P. In vitro activity of glucosinolates and their degradation products against brassica-pathogenic bacteria and fungi. Appl. Environ. Microbiol. 2015, 81, 432–440. [Google Scholar] [CrossRef] [PubMed] [Green Version]
  50. Frerigmann, H.; Piślewska-Bednarek, M.; Sánchez-Vallet, A.; Molina, A.; Glawischnig, E.; Gigolashvili, T.; Bednarek, P. Regulation of pathogen-triggered tryptophan metabolism in Arabidopsis thaliana by MYB transcription factors and indole glucosinolate conversion products. Mol. Plant 2016, 9, 682–695. [Google Scholar] [CrossRef] [Green Version]
  51. Wretblad, S.; Dixelius, C. B-genome derived resistance to Leptosphaeria maculans in near isogenic Brassica napus lines is independent of glucosinolate profile. Physiol. Plant. 2000, 110, 461–468. [Google Scholar] [CrossRef]
  52. Mithen, R.; Lewis, B.; Fenwick, G. In vitro activity of glucosinolates and their products against Leptosphaeria maculans. Trans. Br. Mycol. Soc. 1986, 87, 433–440. [Google Scholar] [CrossRef]
  53. Clay, N.K.; Adio, A.M.; Denoux, C.; Jander, G.; Ausubel, F.M. Glucosinolate metabolites required for an Arabidopsis innate immune response. Science 2009, 323, 95–101. [Google Scholar] [CrossRef] [Green Version]
  54. Schlaeppi, K.; Bodenhausen, N.; Buchala, A.; Mauch, F.; Reymond, P. The glutathione-deficient mutant pad2-1 accumulates lower amounts of glucosinolates and is more susceptible to the insect herbivore Spodoptera littoralis. Plant J. 2008, 55, 774–786. [Google Scholar] [CrossRef] [PubMed] [Green Version]
Figure 1. Black rot disease progress in resistant, R (SCNU-C-4072) and susceptible, S (SCNU-C-3383) cabbage lines. Thirty five (35) days old plants were inoculated with X. campestris pv. campestris race 4 isolate. Infected plants were observed up to 14 DAI (days after inoculation).
Plants 09 01121 g001
Figure 2. The glucosinolate pathway showing the transcription factors, glucosinolate (GSL) biosynthesis and breakdown related genes indicated aliphatic and indolic GSL biosynthesis pathways adopted from previous studies [33,35,37]. A total of 43 genes were selected (15 and 23 genes from aliphatic and indolic GSL biosynthesis pathway and 5 genes from GSL breakdown, respectively). Blue color indicates the genes, which were highly expressed in the resistant line and red color indicates the genes which were highly expressed in susceptible cabbage line after infection with X. campestris pv. campestris race 4. Bold green color number in bracket indicates 1 and 3 days after inoculation.
Plants 09 01121 g002
Figure 3. Glucosinolate contents of cabbage leaf samples from black rot resistant (SCNU-C-4072) and susceptible (SCNU-C-3383) lines under different treatments (C, control; 1DM, 1 day mock; 1DT, 1 day treated; 3DM, 3 day mock; 3DT, 3 day treated; 5DM, 5 day mock; 5DT, 5 day treated). The mean of three biological replicates is shown in the figure. Vertical bars indicate standard deviation. Different letters indicate statistically significant differences (p < 0.01) between genotypes (R and S lines) and treatment interactions following Tukey test. HPLC-mass spectrometry (HPLC-MS) analysis (using an Agilent 1200 series instrument, Agilent Technologies) was conducted following a previous study [34]. R, resistant; S, susceptible.
Plants 09 01121 g003
Figure 4. Relative expression of transcription factor-related genes and GSL biosynthesis genes in the black rot resistant (SCNU-C-4072) line at different days after inoculation (1, 3, and 5 DAI) using Xcc pathogen under different treatment conditions (C, control; 1DM, 1 day mock; 1DT, 1 day treated; 3DM, 3 day mock; 3DT, 3 day treated; 5DM, 5 day mock; 5DT, 5 day treated) compared to mock-treated leaves. The data were normalized using three actins (actin 1, actin 2 and actin 3). Vertical bars indicate the standard deviation. Expression analysis was performed on three biological repeats as three technical replicates. Different letters indicate statistically significant differences (p < 0.01) between genotypes (R: SCNU-C-4072 and S: SCNU-C-3383) and treatment interactions following Tukey test. R, resistant; S, susceptible.
Plants 09 01121 g004
Figure 5. Relative expression of transcription factor-related and GSL biosynthesis genes in the black rot susceptible (SCNU-C-3383) line at different days after inoculation (1, 3, and 5 DAI) using Xcc pathogen under different treatment conditions (C, control; 1DM, 1 day mock; 1DT, 1 day treated; 3DM, 3 day mock; 3DT, 3 day treated; 5DM, 5 day mock; 5DT, 5 day treated) compare to mock-treated samples. Vertical bars indicate the standard deviation. Different letters indicate statistically significant differences (p < 0.01) between genotypes (R: SCNU-C-4072 and S: SCNU-C-3383) lines and treatment interactions following Tukey test. R, resistant; S, susceptible.
Plants 09 01121 g005
Figure 6. Relative expression of GSL breakdown related genes induced by myrosinase enzyme in the black rot resistant (SCNU-C-4072) and susceptible (SCNU-C-3383) cabbage lines at different days after inoculation (1, 3, and 5 DAI) using Xcc pathogen under different treatment conditions (C, control; 1DM, 1 day mock; 1DT, 1 day treated; 3DM, 3 day mock; 3DT, 3 day treated; 5DM, 5 day mock; 5DT, 5 day treated) compare to mock-treated leaves. Vertical bars indicate the standard deviation. Different letters indicate statistically significant differences (p < 0.01) between genotypes (R: SCNU-C-4072 and S: SCNU-C-3383) lines and treatment interactions following Tukey test. R, resistant; S, susceptible.
Plants 09 01121 g006
Figure 7. A simple heat map showing correlation between the levels of aliphatic (A) and indolic (B) glucosinolate components and expression of biosynthesis genes under different treatments (C, control; 1DM, 1 day mock; 1DT, 1 day treated; 3DM, 3 day mock; 3DT, 3 day treated; 5DM, 5 day mock; 5DT, 5 day treated) in the black rot resistant (SCNU-C-4072) and susceptible (SCNU-C-3383) cabbage lines compared to mock-treated samples. Blue colored values represent statistically significant correlations (p < 0.05) for each gene and individual glucosinolate combination, the values indicate the Pearson’s correlation coefficient. Red cells represent positive correlation and green cells represent negative correlation. Yellow cells represent no significant correlation. R, resistant; S, susceptible.
Plants 09 01121 g007
Figure 8. Biplot of black rot R and S cabbage lines, glucosinolate (GSL) compounds (pink color), and responses of GSL biosynthesis and breakdown related genes (black color) as determined by principle component analysis (PCA). Dark blue squares denote the mean PC scores of the R (SCNU-C-4072) line, and red diamond symbol indicate the mean PC scores of the S (SCNU-3383) line. X. campestris pv. campestris treatments denoted by C, control; 1DM, 1 day mock; 1DT, 1 day treated; 3DM, 3 day mock; 3DT, 3 day treated; 5DM, 5 day mock; 5DT, 5 day.
Plants 09 01121 g008