Communication

Digital Absolute Gene Expression Analysis of Essential Starch-Related Genes in a Radiation Developed Amaranthus cruentus L. Variety in Comparison with Real-Time PCR

by
Veronika Lancíková
and
Andrea Hricová
*
Institute of Plant Genetics and Biotechnology, Plant Science and Biodiversity Center, 950 07 Nitra, Slovakia
*
Author to whom correspondence should be addressed.
Plants 2020, 9(8), 966; https://doi.org/10.3390/plants9080966
Submission received: 15 July 2020 / Revised: 23 July 2020 / Accepted: 28 July 2020 / Published: 30 July 2020
(This article belongs to the Special Issue Plant Mutation Breeding)

Abstract

:
We investigated the expression pattern of four major starch genes at different seed developmental stages in the radiation-bred amaranth variety “Pribina” (Amaranthus cruentus L.) and corresponding control genotype “Ficha” (Amaranthus cruentus L.). Two platforms were used and compared for the gene expression analysis of GBSSI, SSSI, SBE, and DBE amaranth genes, including a standard quantitative real-time PCR (qPCR) technique and relatively novel droplet digital PCR (ddPCR) assay. In our conditions, both methods showed great accuracy and revealed higher expression of the investigated genes in the mutant variety than in the control genotype. Here we report for the first time, a ddPCR gene expression assay for the cultivated grain amaranth, as the most important group of the species in the genus Amaranthus.

1. Introduction

Gene expression analysis is among the most commonly used methods in current biology. Gene expression profiling can be done by real-time PCR, next-generation sequencing technology, microarray- or hybridization-based assays. Quantitative real-time PCR (RT-qPCR) has revolutionized the quantitative assessment of mRNA expression and to date represents the method of choice for accurate measurement and quantification of gene expression. In addition to quantification, the RT-qPCR approach can be used for copy number estimation, DNA methylation analysis, and genotyping [1,2]. However, there are potential system errors represented by biological and technical variations that influence the quantitative assessment of qPCR [3,4]. Therefore, reference genes are chosen to remove the technical variation from the final calculations and to normalize the results of qPCR expression experiments. Generally, reference genes represent stable expression levels because they are not influenced by any experimental conditions, like biotic and abiotic stress, and their expression is not specific to any developmental stage, tissue type, or organ. In this sense, the selection of a suitable internal control gene is crucial to the success of a gene expression experiment. Although only one reference gene is common practice, using a group of reference genes is a best practice that allows for more reliable quantification. There are two quantification strategies of target DNA molecules, relative and absolute quantification. Relative quantification is based on the comparison of the amount of a studied gene to the amount of a reference gene. In case of the absolute quantification standard curve must be employed during analysis, and an exact copy of the number of target DNA is compared to the DNA standards.
The recently emerged method of droplet digital PCR (ddPCR) was developed to provide precise absolute quantification of nucleic acid target sequences without the use of standard curves [5,6,7,8]. This high precision method is based on the amplification of single target DNA molecules. The key aspect of this revolutionary quantification technology is sample fragmenting into water–oil based emulsion microdroplets and PCR amplification of the target DNA molecules in each individual droplet. Each PCR sub-reaction contains either a few or no target sequences. Thereby, ddPCR may facilitate the measurement of low abundant targets [6,9,10,11]. This novel method of molecular biology is mainly used in medical research and diagnostic applications but has also been implemented in environmental science [12,13,14], plant pathogen detection and quantification [15,16,17], and food and feed safety control associated with GMO determination [18,19,20,21].
We analyzed the gene expression of four major starch amaranth enzymes during seed development in the radiation-developed variety “Pribina” (Amaranthus cruentus L.) and the corresponding control genotype “Ficha” (Amaranthus cruentus L.). Two expression quantification assays, including standard qPCR and droplet digital PCR platforms, were used.
The aim of this study was to assess the applicability of the digital PCR method for gene expression analysis to the amaranth genome and to assess which method is most suitable for the quantification of gene expression. We compared the performance of both approaches for quantitative gene expression measurement of granule-bound starch synthase (GBSSI) catalyzing amylose synthesis, soluble starch synthase (SSSI), starch branching enzymes (SBE), and starch debranching enzymes (DBE) that catalyze the synthesis of amylopectin [22,23,24,25,26].

2. Results and Discussion

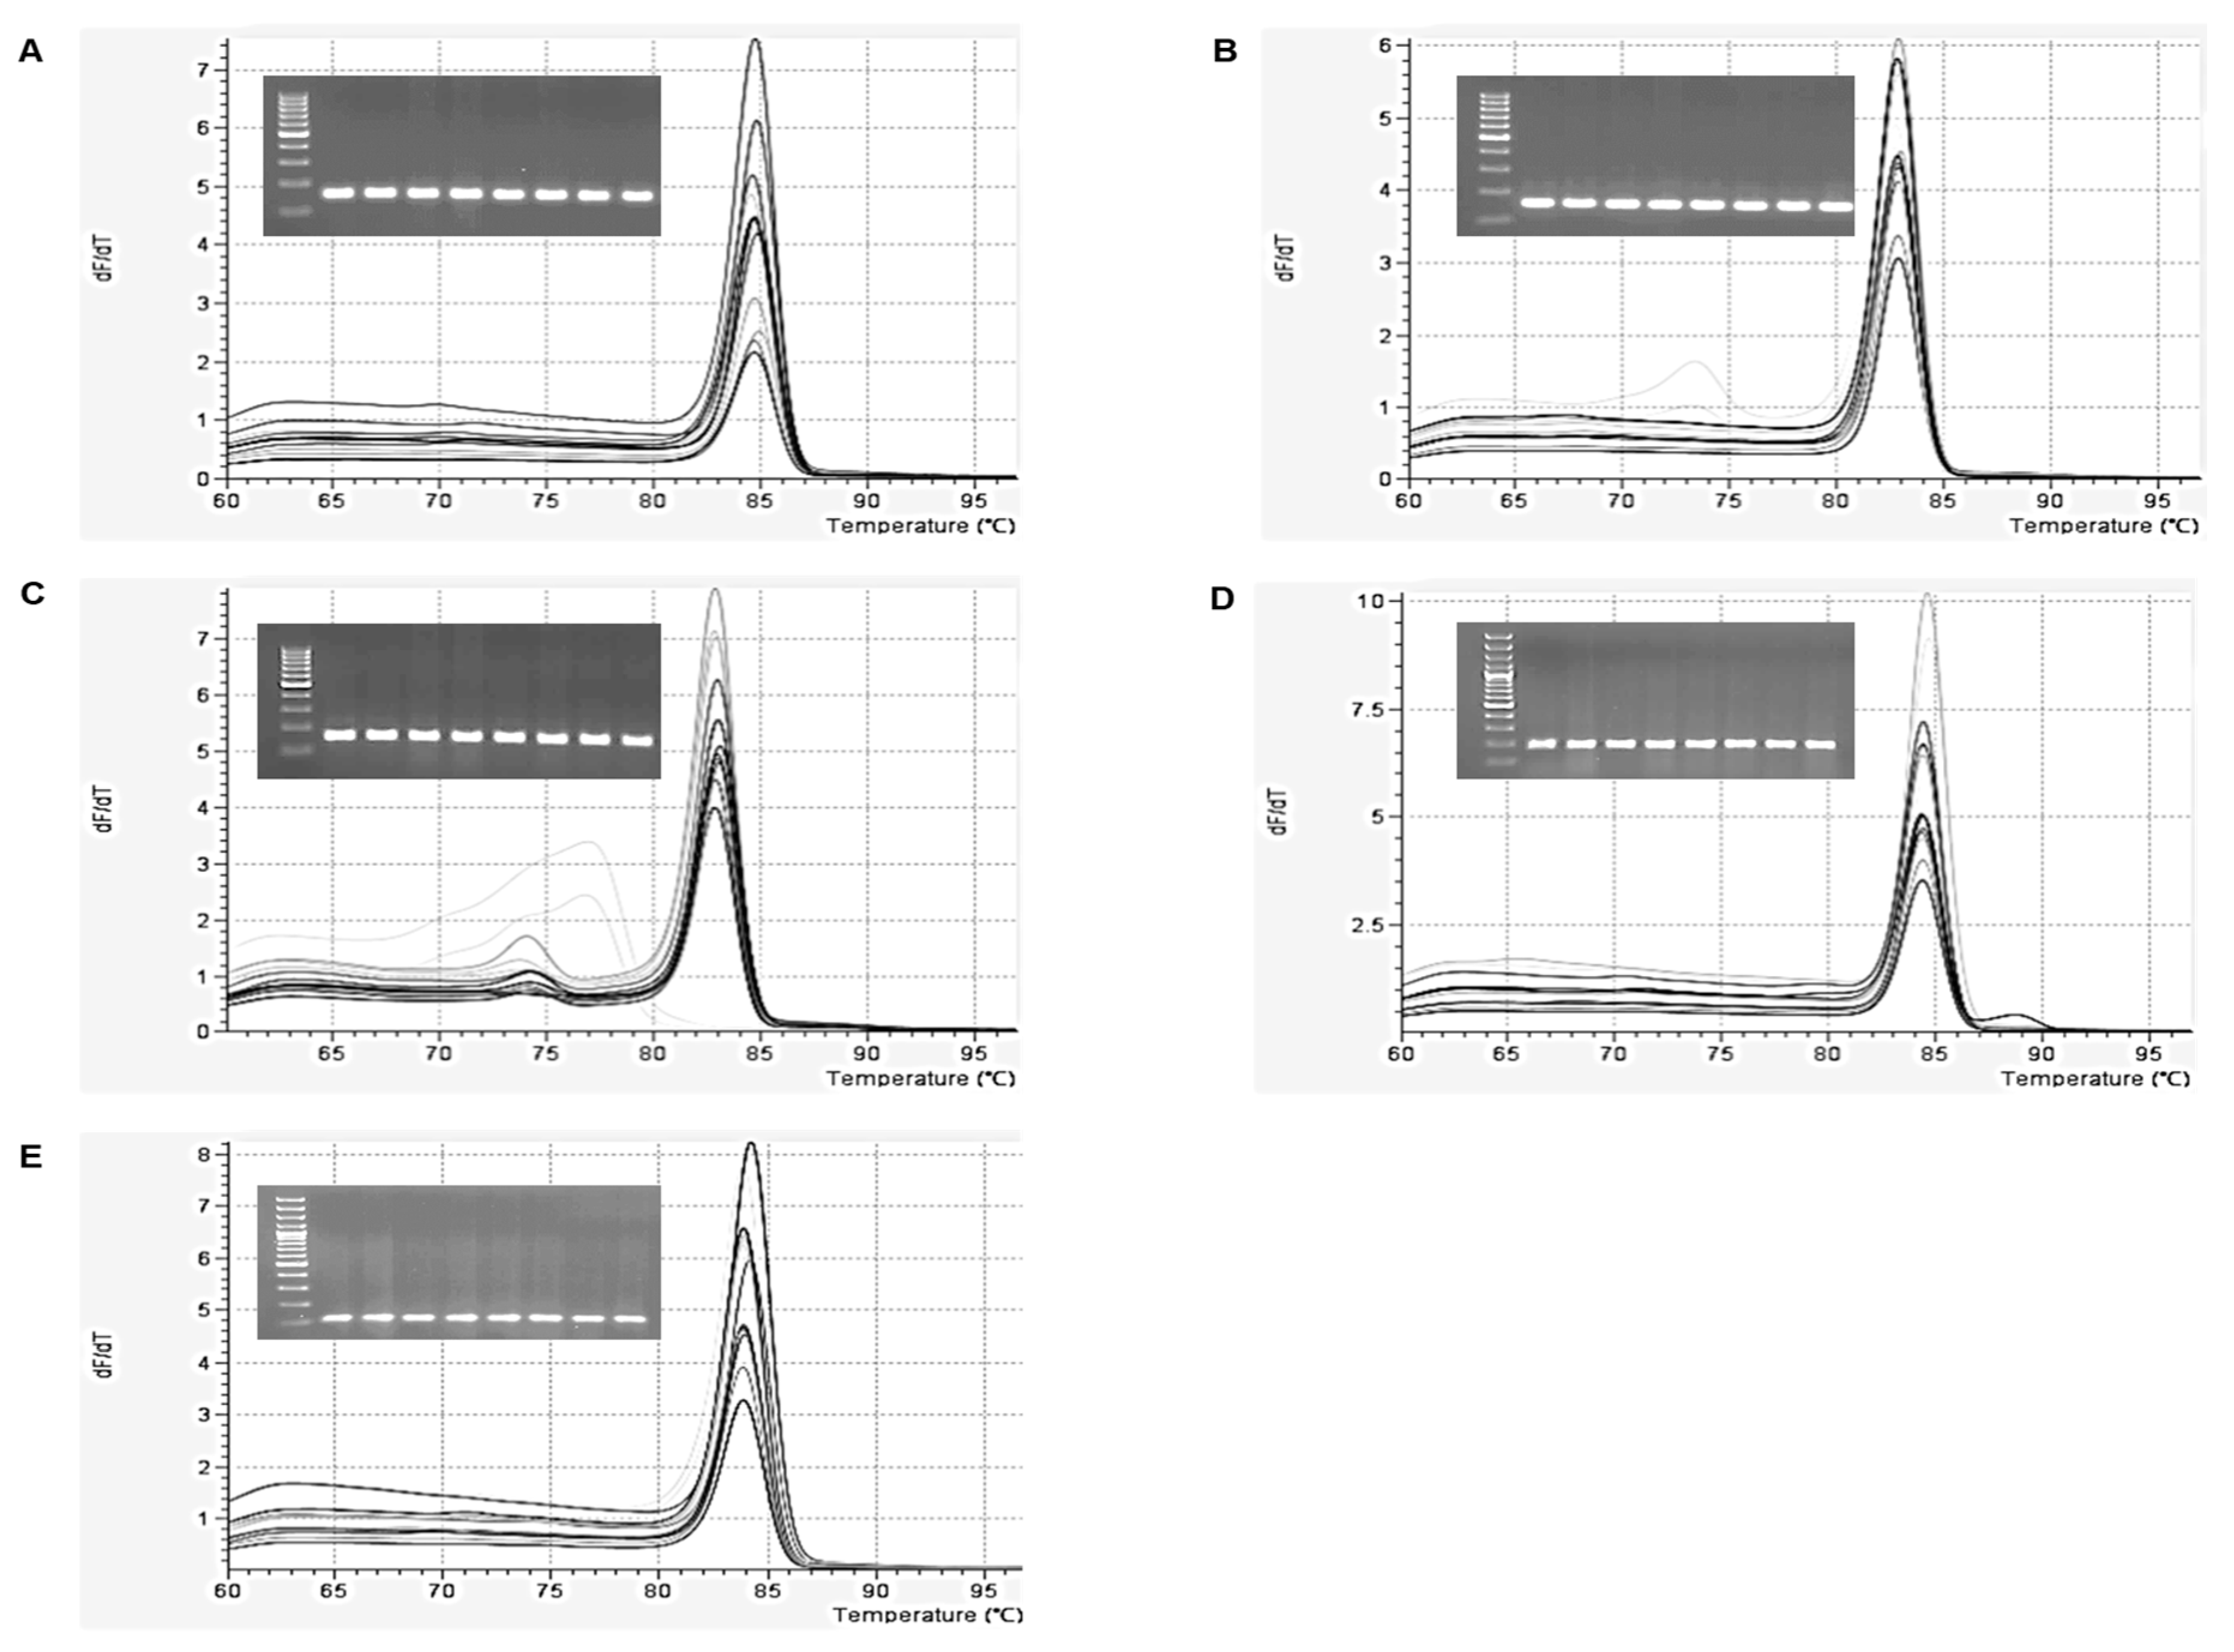
2.1. Optimization of qPCR and ddPCR Assay

The qPCR assay was optimized for amaranth starch synthase genes. Primer specificity of the analyzed targets was evaluated using primer BLAST. Validation of the qPCR assay was performed using a standard curve to assess primer efficiency, linear dynamic range, and reproducibility. The primer efficiency showed good reaction efficiency (between 90–110%) and the melt curve and gel analysis confirmed the presence of desired PCR amplicons as unique and single peaks for all analyzed genes (Figure 1).
Subsequently, the qPCR assay was transferred to the ddPCR format. The same primer concentration was used for the absolute quantification assay; however, the recommended amplification ddPCR Supermix was applied. The same primers and probes were used for digital PCR as for qPCR [27]. An accurate approach, as the nature of the investigated sample and the efficiency of various polymerases in different sample backgrounds are critical [28]. Specifically, recalcitrant starch-rich amaranth seeds may contain inhibitory compounds that might cause loss of sensitivity, accuracy, or reproducibility. For ddPCR, Maheshwari et al. (2017) [29] observed reliable, reproducible results and higher tolerance to PCR inhibitors. The same conclusion was reported by Coudray-Meunier et al. (2015) [30] when analyzing Norovirus and Hepatitis A virus in samples of lettuce using microfluidic digital PCR.
Raw data obtained as droplet counts were evaluated using QuantaSoft software. Threshold values were set up automatically or manually, to discriminate positive droplets containing the target (above selected threshold) and negative droplets (below threshold, Figure 2). For ddPCR, careful analysis of the raw data is essential to obtain meaningful, reproducible results. The discrimination of positive and negative droplets can affect the credibility of results. Droplets can be identified as clearly positive or negative based on fluorescence intensity. Nevertheless, there are droplets called “rain”, exhibiting fluorescence between positive and negative. It is still unclear why rain occurs [18].

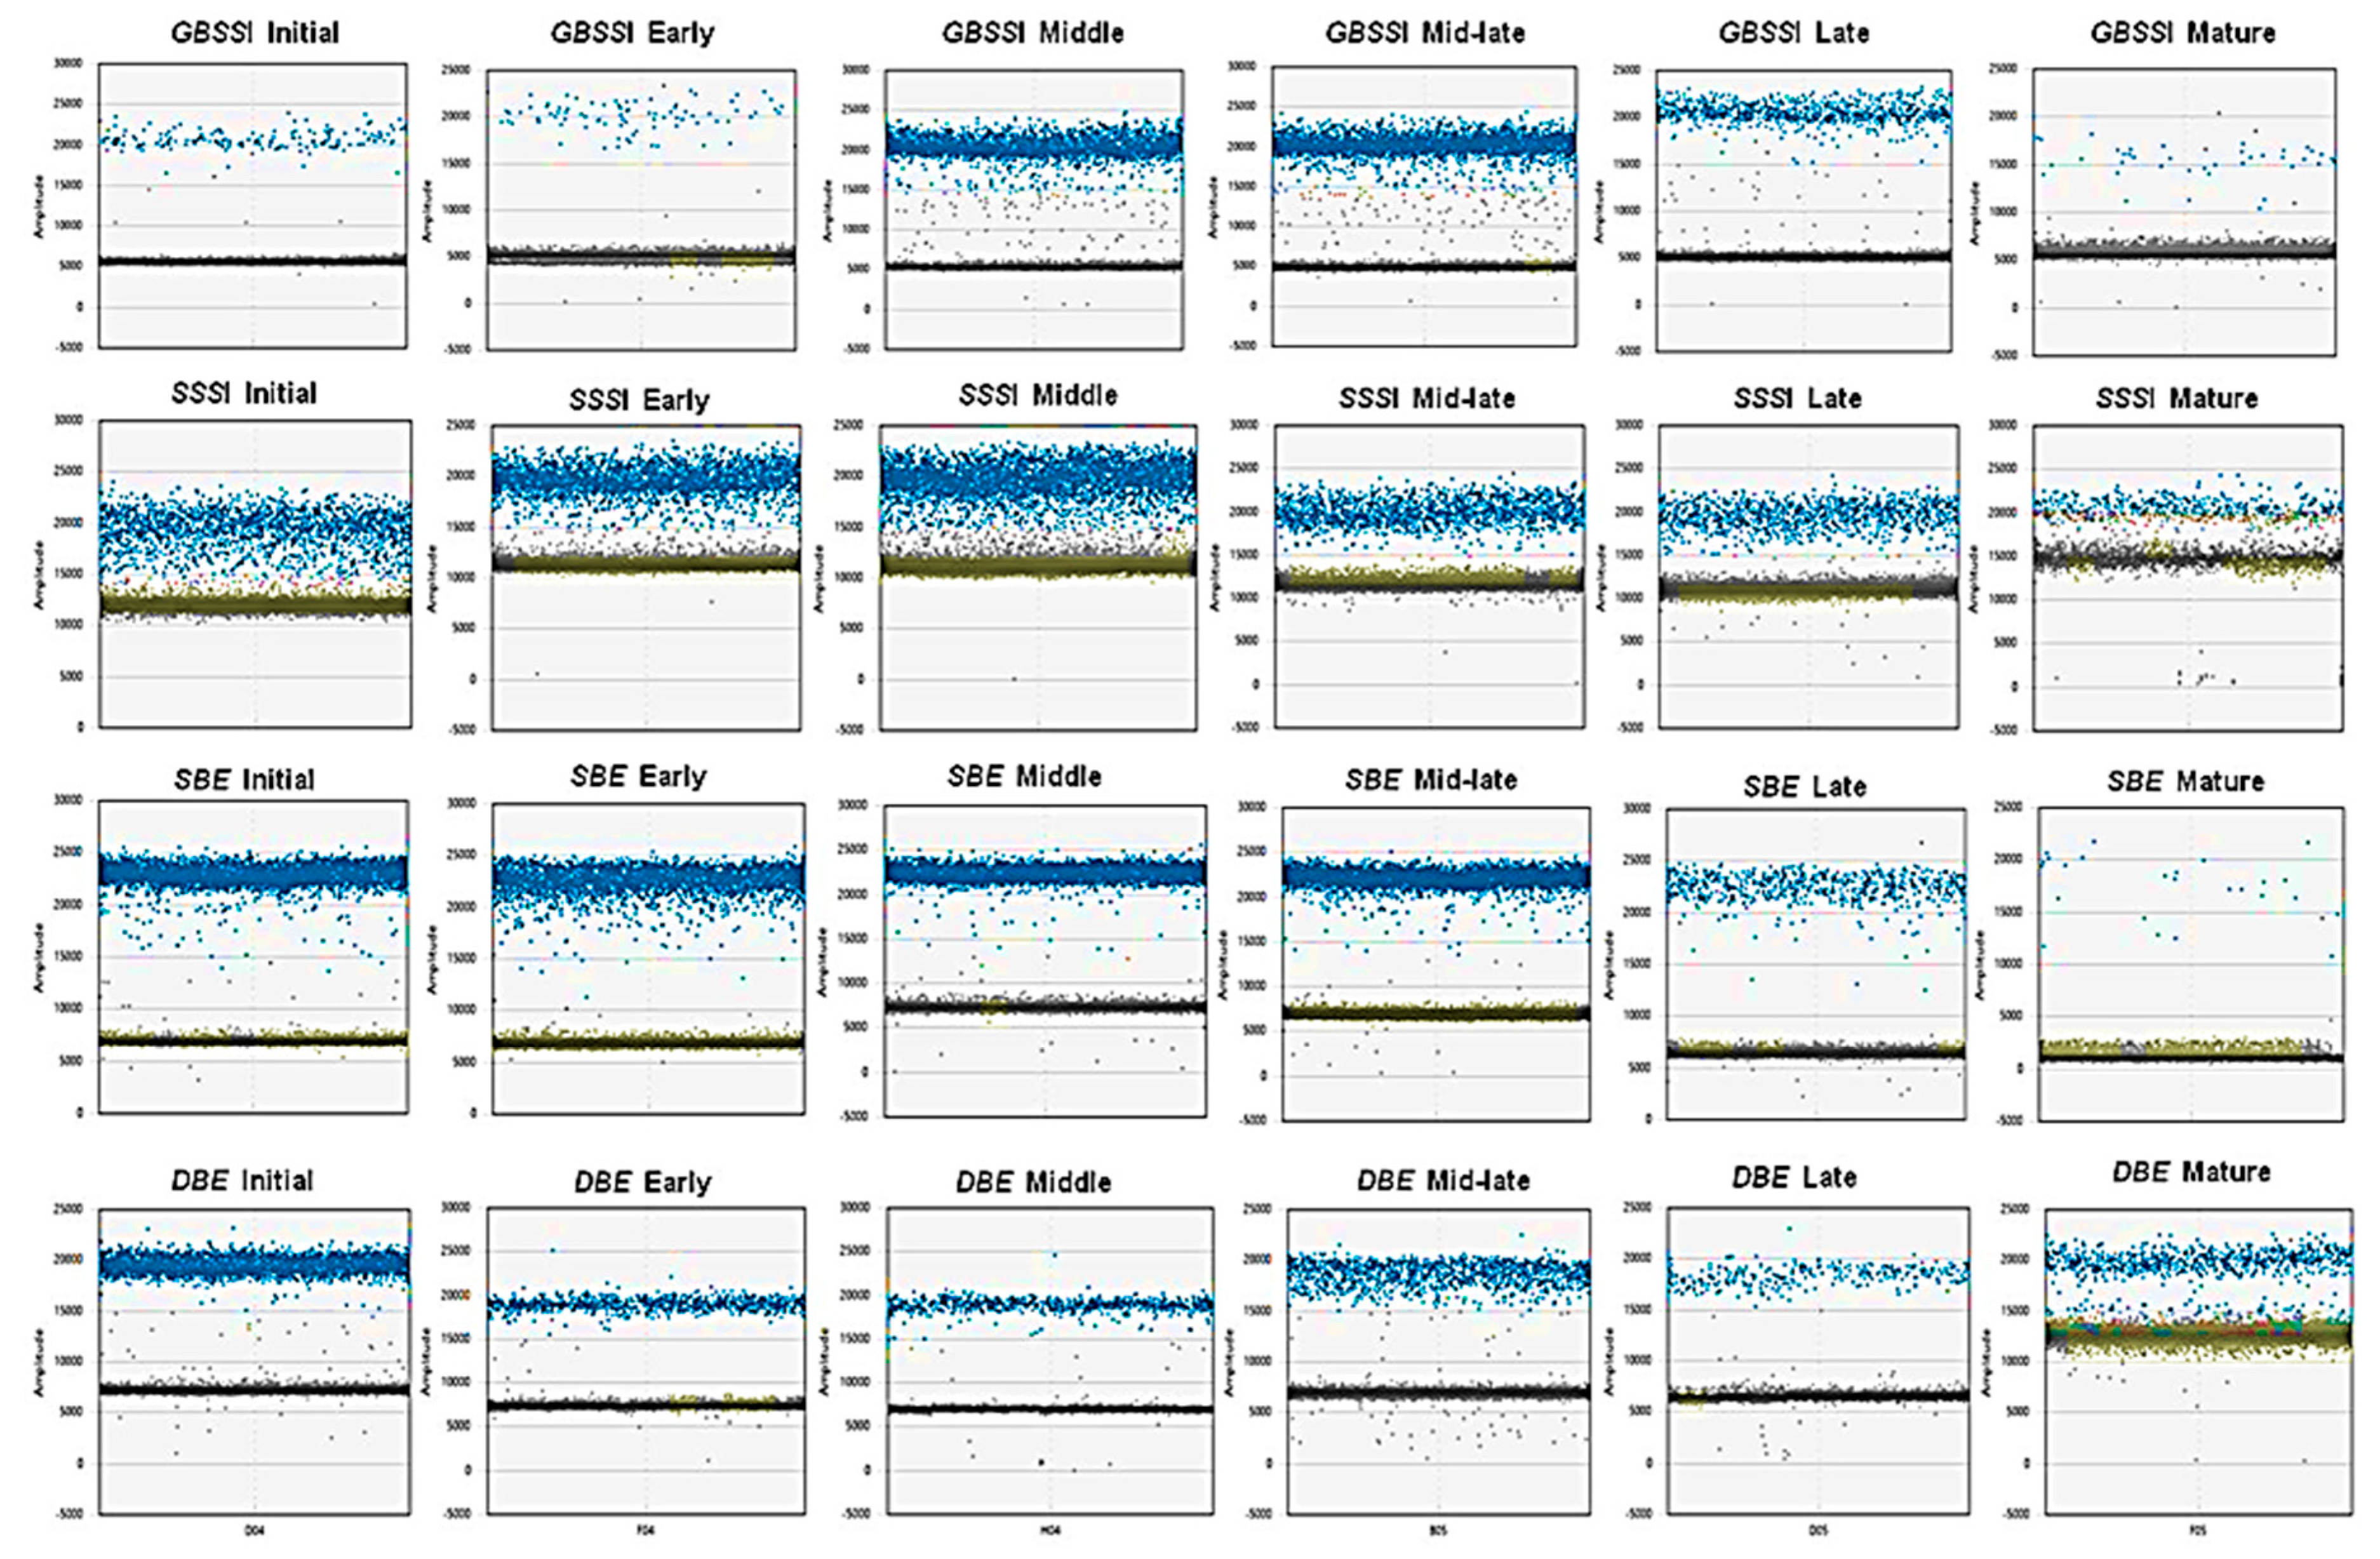
2.2. Absolute Quantification of Essential Amaranth Starch-Related Genes Using ddPCR

The ddPCR approach was employed to determine absolute quantities of four essential starch synthesis amaranth genes GBSSI, SSSI, SBE, and DBE in the γ radiation-bred variety “Pribina” during different stages of seed development (initial, early, middle, mid-late, late stage and mature seeds). The expression data from “Pribina” seeds were compared to the expression estimates obtained for non-irradiated control seeds “Ficha”. The mutant variety “Pribina” was characterized by the genetically fixed increased weight of 1000 seeds as a result of radiation [31,32], which might be associated with upregulation in seed starch synthesis/accumulation since starch is the most abundant component in the amaranth seed. It is reported that seed weight can be positively correlated with the starch-synthase enzyme activity in rice, maize, and wheat [33,34,35].
The transcription pattern of the investigated genes has already been described during amaranth seed development using the standard qPCR approach [22,23,26,36]. Based on the results of these previous reports, all starch synthesis genes are expressed in the storage tissues as well as in the non-storage tissues.
In our experiment, the control genotype “Ficha” was characterized by lower gene expression of all four investigated genes whilst “Pribina” showed, as hypothesized, higher gene expression predominantly in the middle and mid-late seed developmental stages (Figure 3).
The expression peak of GBSSI, known as the waxy gene that catalyzes amylase synthesis, was defined to be at the mid-late developmental stage (Figure 3A). As for GBSSI expression in seeds, our observations were similar to those reported by Park et al. (2011) [22], according to whom the GBSSI was characterized as a “late expresser”, showing the transcription peak at the mid-late developmental stage. Such mRNA distribution and activity were also found in cereal endosperm [37,38]. When comparing GBSSI gene expression in the mutant variety and the control genotype, the mutant variety “Pribina” showed significantly higher upregulation of the GBSSI gene at the middle and mid-late seed developmental stages over the corresponding control “Ficha” (Figure 3A). The GBSSI gene encodes amylose synthesis. James et al. (2003) [39] described the high level of proportionality between enzymatic activity and GBSSI gene expression in cereals, however no correlation between GBSSI gene expression and amylose content was revealed [40,41]. Thus, amylose content may be responsive to some other factors besides GBSSI. Our results of starch (not published herein) suggest a similar statement.
“Ficha” seeds showed the highest gene expression of SSSI at the initial stage, but it slowly decreased through the mid-late stage and remained steady until seed maturation. “Pribina” seeds produced different trends in SSSI expression with the highest activity during the middle stage of seed formation (Figure 3B). Hence, ddPCR demonstrated the most balanced gene expression with threefold upregulation in “Pribina” seeds at the middle and mid-late stage when compared to the control “Ficha”.
The most significant difference between the two investigated amaranths was determined for SBE activity. “Ficha” showed relatively low transcript levels across all seed developmental stages with very limited activity at the middle and mid-late stages. In contrast, “Pribina” was characterized by a rapid increase in SBE activity at the initial developmental stage, which immediately decreased at the middle stage of seed development (Figure 3C).
The herein observed SSSI and SBE transcription patterns were comparable to the results reported by Park and Nishikawa (2012) [23]. These authors found the expression profiles of SSSI and SBE genes to be similar throughout seed formation. Moreover, both genes were active at relatively high levels at the initial stage of seed development with activity graduated at the middle stage and decreasing thereafter. The importance of SBE in amylopectin synthesis has been previously discussed. The starch branching enzyme plays a fundamental part in amylopectin synthesis, catalyzes the formation of α-1, 6-linkages, and decides the branching pattern in amylopectin [42]. Wang et al. (2017) [43] concluded that the suppression of SBE had a crucial impact on obtaining of high-amylose lines of maize and rice.
The pattern of expression profiles of the DBE enzyme showed the highest similarity in the two analyzed amaranths with activity mainly restricted to the initial, followed by middle and mid-late stages of seed formation (Figure 3D). Park et al. (2014) [26] found a rapid increase of the DBE transcript level at the middle stage of seed development, indicating the important role of this enzyme in the accumulation of starch throughout the seed during the middle stage of its development. However, according to the research by Park et al. (2014) [26], this gene showed weak activity during the initial stage of seed formation. Thus, the authors suggested the function of DBE in pericarp amylopectin synthesis at the initial stage of seed development. Similar results were reported for the rice DBEI transcript [44].

2.3. Performance of ddPCR vs. qPCR

The conventional standard curve of qPCR provides the fold change of target genes in experimental samples relative to control samples, while ddPCR determines absolute gene expression without the need for a standard curve, calibrator, or reference gene. Determination of the absolute copy number of targeted genes is essential in many cases, but the success of absolute quantification relies on an accurate standard.
Only a limited number of studies directly compare the performance of the golden standard qPCR vs. third-generation digital PCR. Some studies reported improvement of target DNA detection sensitivity using the ddPCR approach over the qPCR method [15,45,46]. As for other studies, similar or the same limit of detection for both quantification methods was reported [15,47]. However, digital PCR might be beneficial in the detection of low abundant transcripts with small expression differences [29] and offers a relatively simple and straightforward tool for the absolute quantification of transgenes [47].
To compare the standard qPCR technique with the innovative ddPCR quantification method, identical cDNA samples were used to simultaneously set up these experiments.
Both approaches showed upregulation of GBSSI expression in the mutant variety “Pribina” at the middle and mid-late stages of seed development compared to the control genotype “Ficha” (4A). Approximately fourfold GBSSI upregulation was observed by both the quantitative PCR methods at the middle stage of seed formation. The qPCR approach revealed a sixfold increase in GBSSI expression at the mid-late seed developmental stage, whilst up to a tenfold change in expression was observed using ddPCR. The downward trend in gene expression was revealed at the late stage of seed development with a complete decrease of the transcript copy number in mature seeds (Figure 4A). These divergences in the GBSSI gene activity trend obtained by relative qPCR and absolute ddPCR may be caused by a low abundance of the GBSSI transcript. In cases where it is necessary to measure low copy transcripts in a given sample, ddPCR might be a more accurate and sensitive approach. Furthermore, a lack of sufficient details on reference genes in amaranth, predominantly during seed development, might lead to variability in the expression of key enzymes that catalyze amylose synthesis. Recently, Vera Hernandéz et al. (2018) [48] analyzed seven housekeeping genes from Amaranthus hypochondriacus using qPCR in different tissues, developmental stages, and under different stress conditions. AhyMDH, AhyGAPDH, AhyEF-1α, and AhyACT were evaluated as the most stable and suitable genes for data normalization. However, the stability of Actin during seed development was not discussed. Therefore, the variability of Actin as a reference gene in developing seeds cannot be ruled out.
Soluble starch synthase I, encoding amylopectin synthesis, was the only one of the four investigated starch genes where ddPCR and qPCR produced inconsistent results (Figure 4B). The qPCR method showed rapid gene upregulation at the early stages of seed development, an immediate decrease following the seed formation stage, and remained constantly expressed until the end of seed development. Taking into account the relatively low transcript abundance of the SSSI gene and GBSSI gene, ddPCR can be considered a more precise quantification method as it eliminates the effect of reference genes.
Both approaches yielded consistent results for the starch branching enzyme SBE (Figure 4C). The most abundant SBE transcript was observed at the early stage of seed development, where the ddPCR and qPCR platforms showed thirteenfold and nearly seventeenfold upregulation, respectively of SBE in “Pribina”.
The starch debranching enzyme DBE showed the most comparable trend in gene expression across all analyzed seed developmental stages (Figure 4D). A similar level of modest upregulation at the mid-late seed stage was shown by both tested quantification methods.
In this work, four starch-related genes showed a certain level of upregulation in the mutant variety “Pribina” characterized by higher quantitative seed traits (weight, size) over the control “Ficha”. GBSSI, SSSI, and DBE genes were moderately elevated. However, the most significant upregulation was observed in the SBE gene, one of the genes encoding the synthesis of amylopectin. Our results support suggestions that the improvement of quantitative seed attributes may be associated with increased starch-synthase enzyme activity or starch content. Moreover, our results show the applicability of the dPCR approach in the study of gene expression analysis in grain amaranth (Amaranthus cruentus L.).

3. Materials and Methods

3.1. Plant Material and Experimental Field

Gamma irradiation mutagenesis was previously applied to the seeds of genotype “Ficha” (A. cruentus), and several mutant lines with improved quantitative and qualitative seed traits were selected [31,49,50]. Two selected mutants were registered as new varieties [32]. The radiation mutant variety “Pribina” (A. cruentus), characterized by a high weight of 1000 seeds and increased seed size, and its non-irradiated counterpart “Ficha“ (A. cruentus) were used for this study.
Amaranth plants genotype “Ficha“ and variety “Pribina” were cultivated on the experimental field at the locality Nitra, 290 m above sea level, with annual precipitation of 600 mm and mean annual temperature of 9.5 °C. The cultural practices have been reported in our previous work [32].
The seeds were sown at the beginning of May 2018 and collected for gene expression analysis in different developmental stages according to Park et al. 2011 [22] (initial, early, middle, mid-late, late, and mature seeds). Mature seeds were collected for analysis at the end of September 2018. All seed samples used in this study were harvested at each developmental stage in three independent biological replicates.

3.2. Gene-Specific Primer Design

Gene-specific primers of four genes of major importance in amaranth starch biosynthesis were designed based on the nucleotide sequence of Amaranthus cruentus L.
The genes were amplified using the following primer pairs: granule bound starch synthase I (GBSSI, GenBank AB456685) forward 5′-ATGGAAACAGTAACATCTTCTCACT-3′ and reverse 3′-GTACTTTTTGGGTTGTTGCTTAATCT-5; soluble starch synthase I (SSSI, GenBank AB626804) forward 5′-AGTGAGAACCTACAGGGATTACAAGG-3′, and reverse 5′-GTATGGAGGATCAATGAGTGCCCATT-3; starch branching enzyme (SBE, GenBank AB872446.1) forward 5′-AGATCTGGAAACCCCGAGGA-3′, reverse 3′-AGGATTCCTGTGCACCTTGG-5′; starch debranching enzyme (DBE, GenBank AB822998.1) forward 5′-GGTGAGTTAGCACCTGAAGATAG-3′, reverse 3′-CTTTGTGGGAGCTTAAGAGGAA-5′.
Droplet digital PCR and quantitative PCR were performed using the same primer set for each starch gene. For the relative gene expression analysis using standard qPCR, the reference gene Actin from Amaranthus tricolor (ACT, GenBank EF452618) was applied (Park et al. (2012) using the forward 5′-GTATGCAAGTGGTCGTACTACAGG-3′, and reverse 3′-ATCTTCGTAGGGTAATCAGTCAGG-5′ primer pair.

3.3. RNA Extraction and cDNA Synthesis

Seed material was ground into a fine powder using the TissueLyser II (Qiagen, Hilden, Germany). Total RNA was extracted according to the protocol developed for cereal seeds containing a high level of starch [51] from approximately 0.2 g of seed powder. RNA quality and quantity were measured using a Nanodrop spectrophotometer and RNA integrity was verified on a 1.5% agarose gel. The cDNA was synthesized from 300 ng RNA using a Maxima First Strand cDNA Synthesis Kit for RT-qPCR, with dsDNase treatment (ThermoFisher Scientific, Waltham, MA, USA). To minimize variability between ddPCR and qPCR, the same cDNA samples were used for both approaches.

3.4. Relative Gene Expression Analysis Using qRT-PCR

The qRT-PCR method was carried out using a LightCycler® Nano (Roche, Basel, Switzerland). The gene-specific primers were evaluated. The primer pair specificity was evaluated using primer BLAST. The qPCR assay validation was conducted using a standard curve to assess primer efficiency, linear dynamic range, and reproducibility. The reaction mixture consisted of 2× Sso Advanced Universal SYBR® Green supermix (BioRad, Hercules, CA, USA), 400 nM of each forward and reverse primer, 1.5 µL of diluted cDNA, and nuclease-free water added up to the total reaction volume of 10 µL.
The three-step thermal cycling protocol for GBSSI was applied as follows: 95 °C for 30 s, 45 cycles of denaturation at 95 °C for 15 s, annealing at 60 °C for 45 s, and elongation at 72 °C for 30 s. The following two-step thermal cycling protocol was applied for SSSI, SBE and DBE: 95 °C for 30 s, 45 cycles of denaturation at 95 °C for 15 s, and annealing/elongation at 60 °C for 1 min. Melting curves were generated for each analyzed gene after a qPCR run. Target samples were normalized against Actin and data were analyzed using the LightCycler Nano software.

3.5. Absolute Gene Expression Analysis Using ddPCR

The same primer concentration was used for the ddPCR assay as for qRT-PCR. The reaction mixture for the ddPCR assay consisted of 2× QX200TM ddPCRTM EvaGreen Supermix (Bio-Rad, Hercules, CA, USA), 400 nM of each forward and reverse primer, 1.5 µL of diluted cDNA, and molecular grade water added up to total reaction volume of 20 µL.
A disposable eight-channel DG8 cartridge was placed into the cartridge holder, then the total volume of the PCR mixture was transferred into the middle wells of the cartridge and the bottom wells were filled with 70 µL of droplet generation oil (QX200TM Droplet Generation Oil for EvaGreen, Bio-Rad). The cartridge containing the PCR reaction mixture and droplet generation oil was placed into the QX200TM Droplet Generator (Bio-Rad, Hercules, CA, USA). The 40 µL of final emulsion containing droplets were transferred from the DG8 cartridge into the ddPCRTM 96-well PCR plate (Bio-Rad). The PCR plate was heat-sealed at 175 °C for 3 s with pierceable foil using a PX1 PCR plate sealer (Bio-Rad, Hercules, CA, USA). Subsequently, PCR amplification was carried out in a C1000 TouchTM Thermal Cycler with a 96-Deep Well Reaction Module (Bio-Rad) and consisted of initial denaturation at 95 °C for 5 min followed by 45 cycles of denaturation at 95 °C for 30 s and annealing/elongation at 60 °C for 1 min with a ramp of 2 °C/s. Final signal stabilization was performed at 4 °C for 5 min followed by 95 °C for 5 min. Then, the PCR plate containing the droplets was placed in a QX200TM droplet reader (Bio-Rad, Hercules, CA, USA) to count positive and negative droplets. Data were analyzed using QuantaSoftTM Software.

Author Contributions

Conceptualisation, A.H.; Investigation, V.L.; Writing: original draft, V.L.; Writing: review and editing, A.H. All authors have read and agreed to the published version of the manuscript.

Funding

This research was funded by Scientific Grant Agency VEGA, grant number 2/0109/19 and European Community project no. 26220220180: Building Research Centre “AgroBioTech”.

Conflicts of Interest

The authors declare no conflict of interest.

References

  1. Głowacka, K.; Kromdijk, J.; Leonelli, L.; Niyogi, K.K.; Clemente, T.E.; Long, S.P. An evaluation of new and established methods to determine T-DNA copy number and homozygosity in transgenic plants. Plant Cell Environ. 2016, 39, 908–917. [Google Scholar] [CrossRef] [PubMed]
  2. Finke, A.; Rozhon, W.; Pecinka, A. Analysis of DNA methylation content and patterns in plants. Methods Mol. Biol. 2018, 1694, 277–298. [Google Scholar] [PubMed]
  3. Pfaffl, M.W. A new mathematical model for relative quantification in real-time RT–PCR. Nucl. Acids Res. 2001, 29, e45. [Google Scholar] [CrossRef] [PubMed]
  4. Leong, D.T.; Gupta, A.; Bai, H.F.; Wan, G.; Yoong, L.F.; Too, H.P.; Chew, F.T.; Hutmacher, D.W. Absolute quantification of gene expression in biomaterials research using real-time PCR. Biomaterials 2007, 28, 203–210. [Google Scholar] [CrossRef]
  5. Hindson, B.J.; Ness, K.D.; Masquelier, D.A.; Belgrader, P.; Heredia, N.J.; Makarewicz, A.J.; Bright, I.J.; Lucero, M.Y.; Hiddessen, A.L.; Legler, T.C.; et al. High-throughput droplet digital PCR system for absolute quantitation of DNA copy number. Anal. Chem. 2011, 83, 8604–8610. [Google Scholar] [CrossRef]
  6. Hindson, C.M.; Chevillet, J.R.; Briggs, H.A.; Gallichotte, E.N.; Ruf, I.K.; Hindson, B.J.; Vessella, R.L.; Tewari, M. Absolute quantification by droplet digital PCR versus analog real-time PCR. Nat. Methods 2013, 10, 1003–1005. [Google Scholar] [CrossRef]
  7. Rački, N.; Dreo, T.; Gutierrez-Aguirre, I.; Blejec, A.; Ravnikar, M. Reverse transcriptase droplet digital PCR shows high resilience to PCR inhibitors from plant, soil and water samples. Plant Methods 2014, 10, 42. [Google Scholar] [CrossRef]
  8. Quan, P.L.; Sauzade, M.; Brouzes, E. dPCR: A technology review. Sensors 2018, 18, 1271. [Google Scholar] [CrossRef] [Green Version]
  9. Morisset, D.; Stebih, D.; Milavec, M.; Gruden, K.; Zel, J. Quantitative analysis of food and feed samples with droplet digital PCR. PLoS ONE 2013, 8, e62583. [Google Scholar] [CrossRef] [Green Version]
  10. Dreo, T.; Pirc, M.; Ramšak, Ž.; Pavšič, J.; Milavec, M.; Žel, J.; Gruden, K. Optimising droplet digital PCR analysis approaches for detection and quantification of bacteria: A case study of fire blight and potato brown rot. Anal. Bioanal. Chem. 2014, 406, 6513–6528. [Google Scholar] [CrossRef]
  11. Taylor, C.; Laperriere, G.; Germain, H. Droplet Digital PCR versus qPCR for gene expression analysis with low abundant targets: From variable nonsense to publication quality data. Sci. Rep. 2017, 7, 2409. [Google Scholar] [CrossRef] [PubMed] [Green Version]
  12. Nathan, L.M.; Simmons, M.; Wegleitner, B.J.; Jerde, C.L.; Mahon, A.R. Quantifying environmental DNA signals for aquatic invasive species across multiple detection platforms. Environ. Sci. Technol. 2014, 248, 12800–12806. [Google Scholar] [CrossRef] [PubMed]
  13. Doi, H.; Takahara, T.; Minamoto, T.; Matsuhashi, S.; Uchii, K.; Yamanak, H. Droplet digital polymerase chain reaction (PCR) outperforms Real-Time PCR in the detection of environmental DNA from an invasive fish species. Environ. Sci. Technol. 2015, 49, 5601–5608. [Google Scholar] [CrossRef] [PubMed]
  14. Lee, H.G.; Kim, H.M.; Min, J.; Kim, K.; Park, M.G.; Jeong, H.J.; Kim, K.Y. An advanced tool, droplet digital PCR (ddPCR), for absolute quantification of the red-tide dinoflagellate, Cochlodinium polykrikoides Margalef (Dinophyceae). Algae 2017, 32, 189–197. [Google Scholar] [CrossRef] [Green Version]
  15. Dupas, E.; Legendre, B.; Olivier, V.; Poliakoff, F.; Manceau, C.; Cunty, A. Comparison of real-time PCR and droplet digital PCR for the detection of Xylella fastidiosa in plants. J. Microbiol. Methods 2019, 162, 86–95. [Google Scholar] [CrossRef] [PubMed]
  16. Santander, R.D.; Meredith, C.L.; Aćimović, S.G. Development of a viability digital PCR protocol for the selective detection and quantification of live Erwinia amylovora cells in cankers. Sci. Rep. 2019, 9, 11530. [Google Scholar] [CrossRef] [PubMed] [Green Version]
  17. Lu, Y.; Zhang, H.; Zhao, Z.; Wen, C.; Wu, P.; Song, S.; Yu, S.; Luo, L.; Xu, X. Application of droplet digital PCR in detection of seed-transmitted pathogen Acidovorax citrulli. J. Integr. Agric. 2020, 19, 561–569. [Google Scholar] [CrossRef]
  18. Gerdes, L.; Iwobi, A.; Busch, U.; Pecoraco, S. Optimization of digital droplet polymerase chain reaction for quantification of genetically modified organisms. Biomol. Detect. Quantif. 2016, 7, 9–20. [Google Scholar] [CrossRef] [Green Version]
  19. Demeke, T.; Dobnik, D. Critical assessment of digital PCR for the detection and quantification of genetically modified organisms. Anal. Bioanal. Chem. 2018, 410, 4039–4050. [Google Scholar] [CrossRef] [Green Version]
  20. Grelewska-Novotko, K.; Żurawska-Zajfert, E.; Sowa, S. Optimization and verification of droplet Digital PCR even-specific methods for the quantification of GM maize DAS1507 and NK603. Appl. Biochem. Biotechnol. 2018, 185, 207–220. [Google Scholar] [CrossRef]
  21. Giraldo, P.A.; Cogan, N.O.I.; Spangenberg, G.C.; Smith, K.F.; Shinozuka, H. Development and application of droplet digital PCR tools for the detection of transgenes in pastures and pasture-based products. Front. Plant Sci. 2019, 9, 1923. [Google Scholar] [CrossRef]
  22. Park, Y.J.; Nemoto, K.; Nishikawa, T.; Matsushima, K.; Minami, M.; Kawase, M. Genetic diversity and expression analysis of granule bound starch synthase I gene in the new world grain amaranth (Amaranthus cruentus L.). J. Cereal Sci. 2011, 53, 298–305. [Google Scholar] [CrossRef]
  23. Park, Y.J.; Nishikawa, T. Characterization and expression analysis of the starch synthase gene family in grain amaranth (Amaranthus cruentus L.). Genes Genet. Syst. 2012, 87, 281–289. [Google Scholar] [CrossRef] [Green Version]
  24. Park, Y.J.; Nishikawa, T.; Tomooka, N.; Nemoto, K. Molecular cloning and expression analysis of a gene encoding soluble starch synthase I from grain amaranth (Amaranthus cruentus L.). Mol. Breed. 2012, 30, 1065–1107. [Google Scholar] [CrossRef]
  25. Park, Y.J.; Nishikawa, T.; Matsushima, K.; Minami, M.; Tomooka, N.; Nemoto, K. Moleular characterization and genetic diversity of the starch branching enzyme (SBE) gene from Amaranthus. Mol. Breed. 2014, 34, 1975–1985. [Google Scholar] [CrossRef]
  26. Park, Y.J.; Nishikawa, T.; Tomooka, N.; Nemoto, K. Molecular characterization of an isoamylase 1-type starch debranching enzyme (DBEI) in grain amaranth (Amaranthus cruentus L.). Mol. Biol. Rep. 2014, 41, 7857–7864. [Google Scholar] [CrossRef] [PubMed]
  27. Baker, M. Digital PCR hits its stride. Nat. Methods 2012, 9, 541–544. [Google Scholar] [CrossRef]
  28. Sidstedt, M.; Romsos, E.L.; Hedell, R.; Ansell, R.; Steffen, C.R.; Vallone, P.M.; Rådström, P. Accurate digital polymerase chain reaction quantification of challenging samples applying inhibitor-tolerant DNA polymerases. Anal. Chem. 2017, 89, 1642–1649. [Google Scholar] [CrossRef] [PubMed]
  29. Maheshwari, Y.; Selvaraj, V.; Hajeri, S.; Yokomi, R. Application of droplet digital PCR for quantitative detection of Spiroplasma citri in comparison with real time PCR. PLoS ONE 2017, 12, e0184751. [Google Scholar] [CrossRef] [Green Version]
  30. Coudray-Meunier, C.; Fraisse, A.; Martin-latil, S.; Guillier, L.; Dellanoy, S.; Fach, P.; Perelle, S. A comparative study of digital RT-PCR and RT-qPCR for quantification of hepatitis A virus and norovirus in lettuce and water samples. Int. J. Food Microbiol. 2015, 18, 17–26. [Google Scholar] [CrossRef]
  31. Gajdošová, A.; Libiaková, G.; Fejér, J. Improvement of selected Amaranthus cultivars by means of mutation induction and biotechnological approaches. In Breeding of Neglected and Under-Utilized Crops, Spices and Herbs; Science Publishers: Enfield, NH, USA, 2007; pp. 151–169. [Google Scholar]
  32. Hricová, A.; Fejér, J.; Libiaková, G.; Szabóová, M.; Gažo, J.; Gajdošová, A. Characterization of phenotypic and nutritional properties of valuable Amaranthus cruentus L. mutants. Turk. J. Agric. For. 2016, 40, 761–771. [Google Scholar] [CrossRef]
  33. Mohapatra, P.K.; Sarkar, R.K.; Kuanar, S.R. Starch synthesizing enzymes and sink strength of grains of contrasting rice cultivars. Plant Sci. 2009, 176, 256–263. [Google Scholar] [CrossRef]
  34. Xie, G.; Li, Z.; Ran, Q.; Wang, H.; Zhang, J. Over-expression of mutated ZmDA1 or ZmDAR1 gene improves maize kernel yield by enhancing starch synthesis. Plant Biotechnol. J. 2018, 6, 234–244. [Google Scholar] [CrossRef] [PubMed] [Green Version]
  35. Zi, Y.; Ding, J.; Song, J.; Humphreys, G.; Peng, Y.; Li, C.; Zhu, X.; Guo, W. Grain yield, starch content and activities of key enzymes of waxy and non-waxy wheat (Triticum aestivum L.). Sci. Rep. 2018, 8, 4548. [Google Scholar] [CrossRef]
  36. Park, Y.J.; Nishikawa, T.; Matsushima, K.; Nemoto, K. Characterization of a new granule-bound starch synthase gene found in amaranth grains (Amaranthus cruentus L.). Mol. Breed. 2017, 37, 111. [Google Scholar] [CrossRef]
  37. Hirose, T.; Terao, T. A comprehensive expression analysis of the starch synthasegene family in rice (Oryza sativa L.). Planta 2004, 220, 9–16. [Google Scholar] [CrossRef]
  38. Caoa, Y.N.; Hub, W.G.; Wang, C.S. Expression profiles of genes involved in starch synthesis in nonwaxy and waxy wheat. Russ. Plant J. Physl. 2012, 59, 632–639. [Google Scholar] [CrossRef]
  39. James, M.G.; Denyer, K.; Myers, A.M. Starch synthesis in the cereal endosperm. Curr. Opin. Plant Biol. 2003, 6, 215–222. [Google Scholar] [CrossRef]
  40. Tsai, C.Y. The function of the waxy locus in starch synthesis in maize endosperm. Biochem. Genet. 1974, 11, 83–96. [Google Scholar] [CrossRef]
  41. Fujita, N.; Hasegawa, H.; Taira, T. The isolation and characterization of a waxy mutant of diploid wheat (Triticum monococcum L.). Plant Sci. 2001, 160, 595–602. [Google Scholar] [CrossRef]
  42. Chen, L.; Lu, D.; Wang, T.; Li, Z.; Zhao, Y.; Jiang, Y.; Zhang, Q.; Cao, Q.; Fang, K.; Xing, Y.; et al. Identification and expression analysis of starch branching enzymes involved in starch synthesis during the development of chestnut (Castanea mollissima Blume) cotyledons. PLoS ONE 2017, 12, e0177792. [Google Scholar] [CrossRef]
  43. Wang, J.; Hu, P.; Chen, Z.; Liu, Q.; Wei, C. Progress in high-amylose cereal crops through inactivation of starch branching enzymes. Front. Plant Sci. 2017, 8, 469. [Google Scholar] [CrossRef] [PubMed] [Green Version]
  44. Ohdan, T.; Francisco, P.B.; Sawada, T.; Hirose, T.; Terao, T.; Satoh, H.; Nakamura, Y. Expression profiling of genes involved in starch synthesis in sink and source organs of rice. J. Exp. Bot. 2005, 56, 3229–3244. [Google Scholar] [CrossRef] [PubMed] [Green Version]
  45. Zhao, Y.; Xia, Q.; Yin, Y.; Wang, Z. Comparison of droplet digital PCR and quantitative PCR assays for quantitative detection of Xanthomonas citri Subsp. citri. PLoS ONE 2016, 11, e0159004. [Google Scholar] [CrossRef] [Green Version]
  46. Dong, L.; Wang, S.; Fu, B.; Wang, J. Evaluation of droplet digital PCR and next generation sequencing for characterizing DNA reference material fro KRAS mutation detection. Sci. Rep. 2018, 8, 9650. [Google Scholar] [CrossRef] [Green Version]
  47. Wan, J.; Song, L.; Wu, Y.; Brzoska, P.; Keys, D.; Chen, C.; Babu, V.; Shannon, J.G.; Nguyen, H.T. Application of digital PCR in the analysis of transgenic soybean plants. Adv. Biosci. Biotechnol. 2016, 7, 403–417. [Google Scholar] [CrossRef] [Green Version]
  48. Vera Hernández, F.P.; Martínez Núñez, M.; Ruiz Rivas, M.; Vázquez Portillo, R.E.; Bibbins Martínez, M.D.; Luna Suárez, S.; Rosas Cárdenas, F.D.F. Reference genes fro RT-qPCR normalization in different tissues, developmental stages ans tress conditions of amaranth. Plant Biol. 2018, 20, 713–721. [Google Scholar] [CrossRef]
  49. Kečkešová, M.; Gálová, Z.; Hricová, A. Changes of protein profiles in amaranth mutant lines. J. Microbiol. Biotechnol. Food Sci. 2012, 1, 1129–1135. [Google Scholar]
  50. Kečkešová, M.; Palenčárová, E.; Gálová, Z.; Gažo, J.; Hricová, A. Nutritional quality of grain amaranths (Amaranthus L.) compared to putative mutant lines. J. Microbiol. Biotechnol. Food Sci. 2013, 2, 1716–1724. [Google Scholar]
  51. Wang, G.; Wang, G.; Zhang, X.; Wang, F.; Song, R. Isolation of high quality RNA from cereal seeds containing high levels of starch. Phytochem. Anal. 2012, 23, 159–163. [Google Scholar] [CrossRef]
Figure 1. Specificity of primers and efficiency of investigated genes for the qPCR assay. Traces of melt analysis and gel electrophoresis for reference housekeeping gene ACT (A) and amaranth starch synthase genes GBSSI (B), SSSI (C), SBE (D), and DBE (E).
Plants 09 00966 g001
Figure 2. Raw data platform generated by the ddPCR quantification assay. Results of ddPCR showing positive (blue) and negative (grey) droplet counts for analyzed starch genes during the initial, early, middle, mid-late, and late stages of seed development and in mature seeds. Positive droplets with amplification and negative droplets with no amplification were distinguished based on the threshold settings in QuantaSoft.
Plants 09 00966 g002
Figure 3. Absolute quantification pattern of amaranth starch key enzymes GBSSI, SSSI, SBE, and DBE in the mutant variety “Pribina” and control genotype “Ficha” during seed formation. The ddPCR approach was applied to determine the transcript copy number (displayed as copies/µL) of the granule bound starch synthase I (A), soluble starch synthase I (B), starch branching enzyme (C), and starch debranching enzyme (D) at different stages of seed development in the radiation-bred variety “Pribina” and control genotype “Ficha”.
Plants 09 00966 g003
Figure 4. Comparison of ddPCR and qPCR performance. Fold change in gene expression of the granule bound starch synthase I (A), soluble starch synthase I (B), starch branching enzyme (C), and starch debranching enzyme (D) during seed development of investigated amaranths. Fold change for ddPCR was estimated as a ratio of “Pribina” and “Ficha” absolute transcript quantities, the conventional standard qPCR curve was normalized against reference gene ACT.
Plants 09 00966 g004

