Lake Drainage in Permafrost Regions Produces Variable Plant Communities of High Biomass and Productivity


Abstract
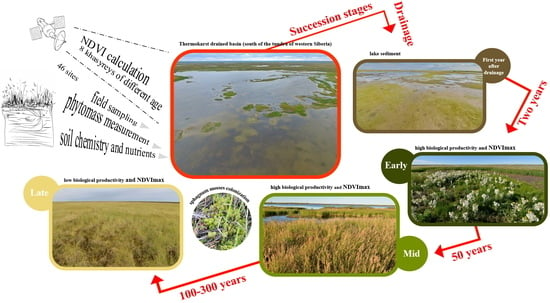
1. Introduction
2. Results
2.1. Microtopography and Soil Setting
2.2. Plant Communities and Successional Stages of Drained Lakes
2.3. Biological Productivity of the Vegetation in Khasyreys
2.4. PCA of Soil Trophicity and Vegetation Productivity
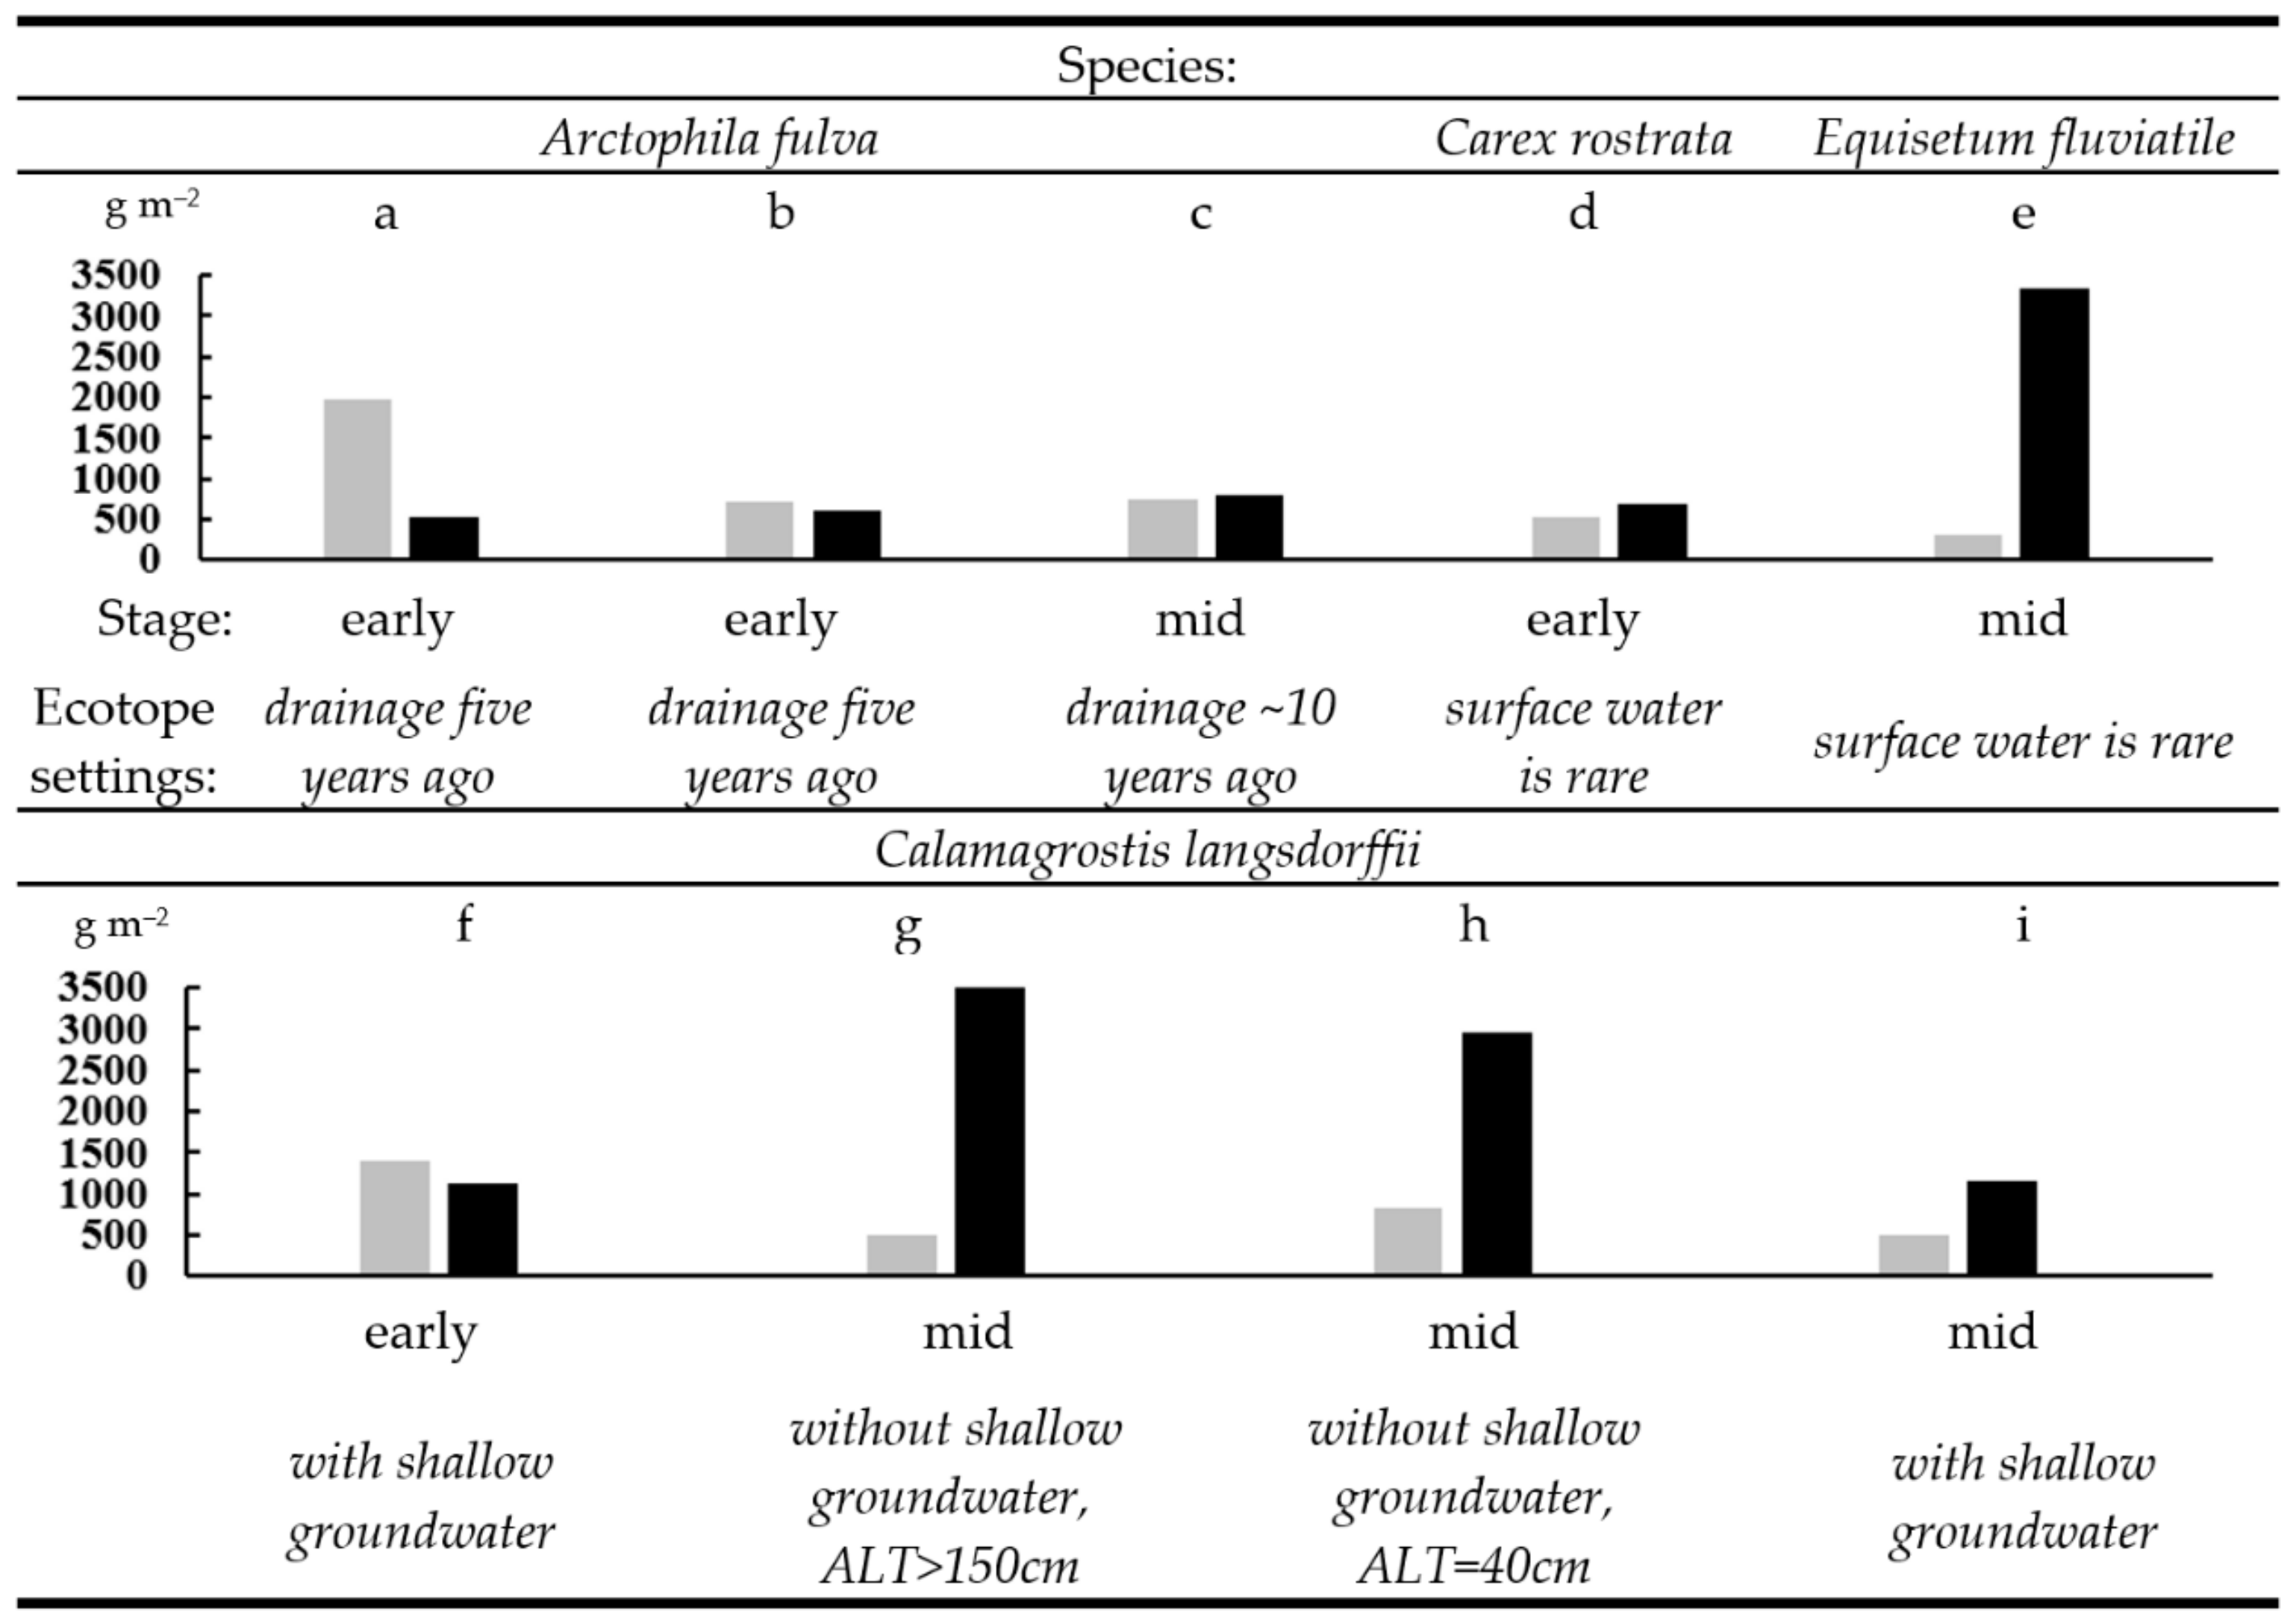
2.5. The Elemental Composition of the Dominant Plant Species of Khasyreys
3. Discussion
3.1. Drivers of Plant Succession in Khasyreys
3.2. Possible Contribution of Khasyreys to the Greening of the Tundra
3.3. Comparison with Other Regions and Ecosystems and Overall Significance of WSL Khasyreys
4. Materials and Methods
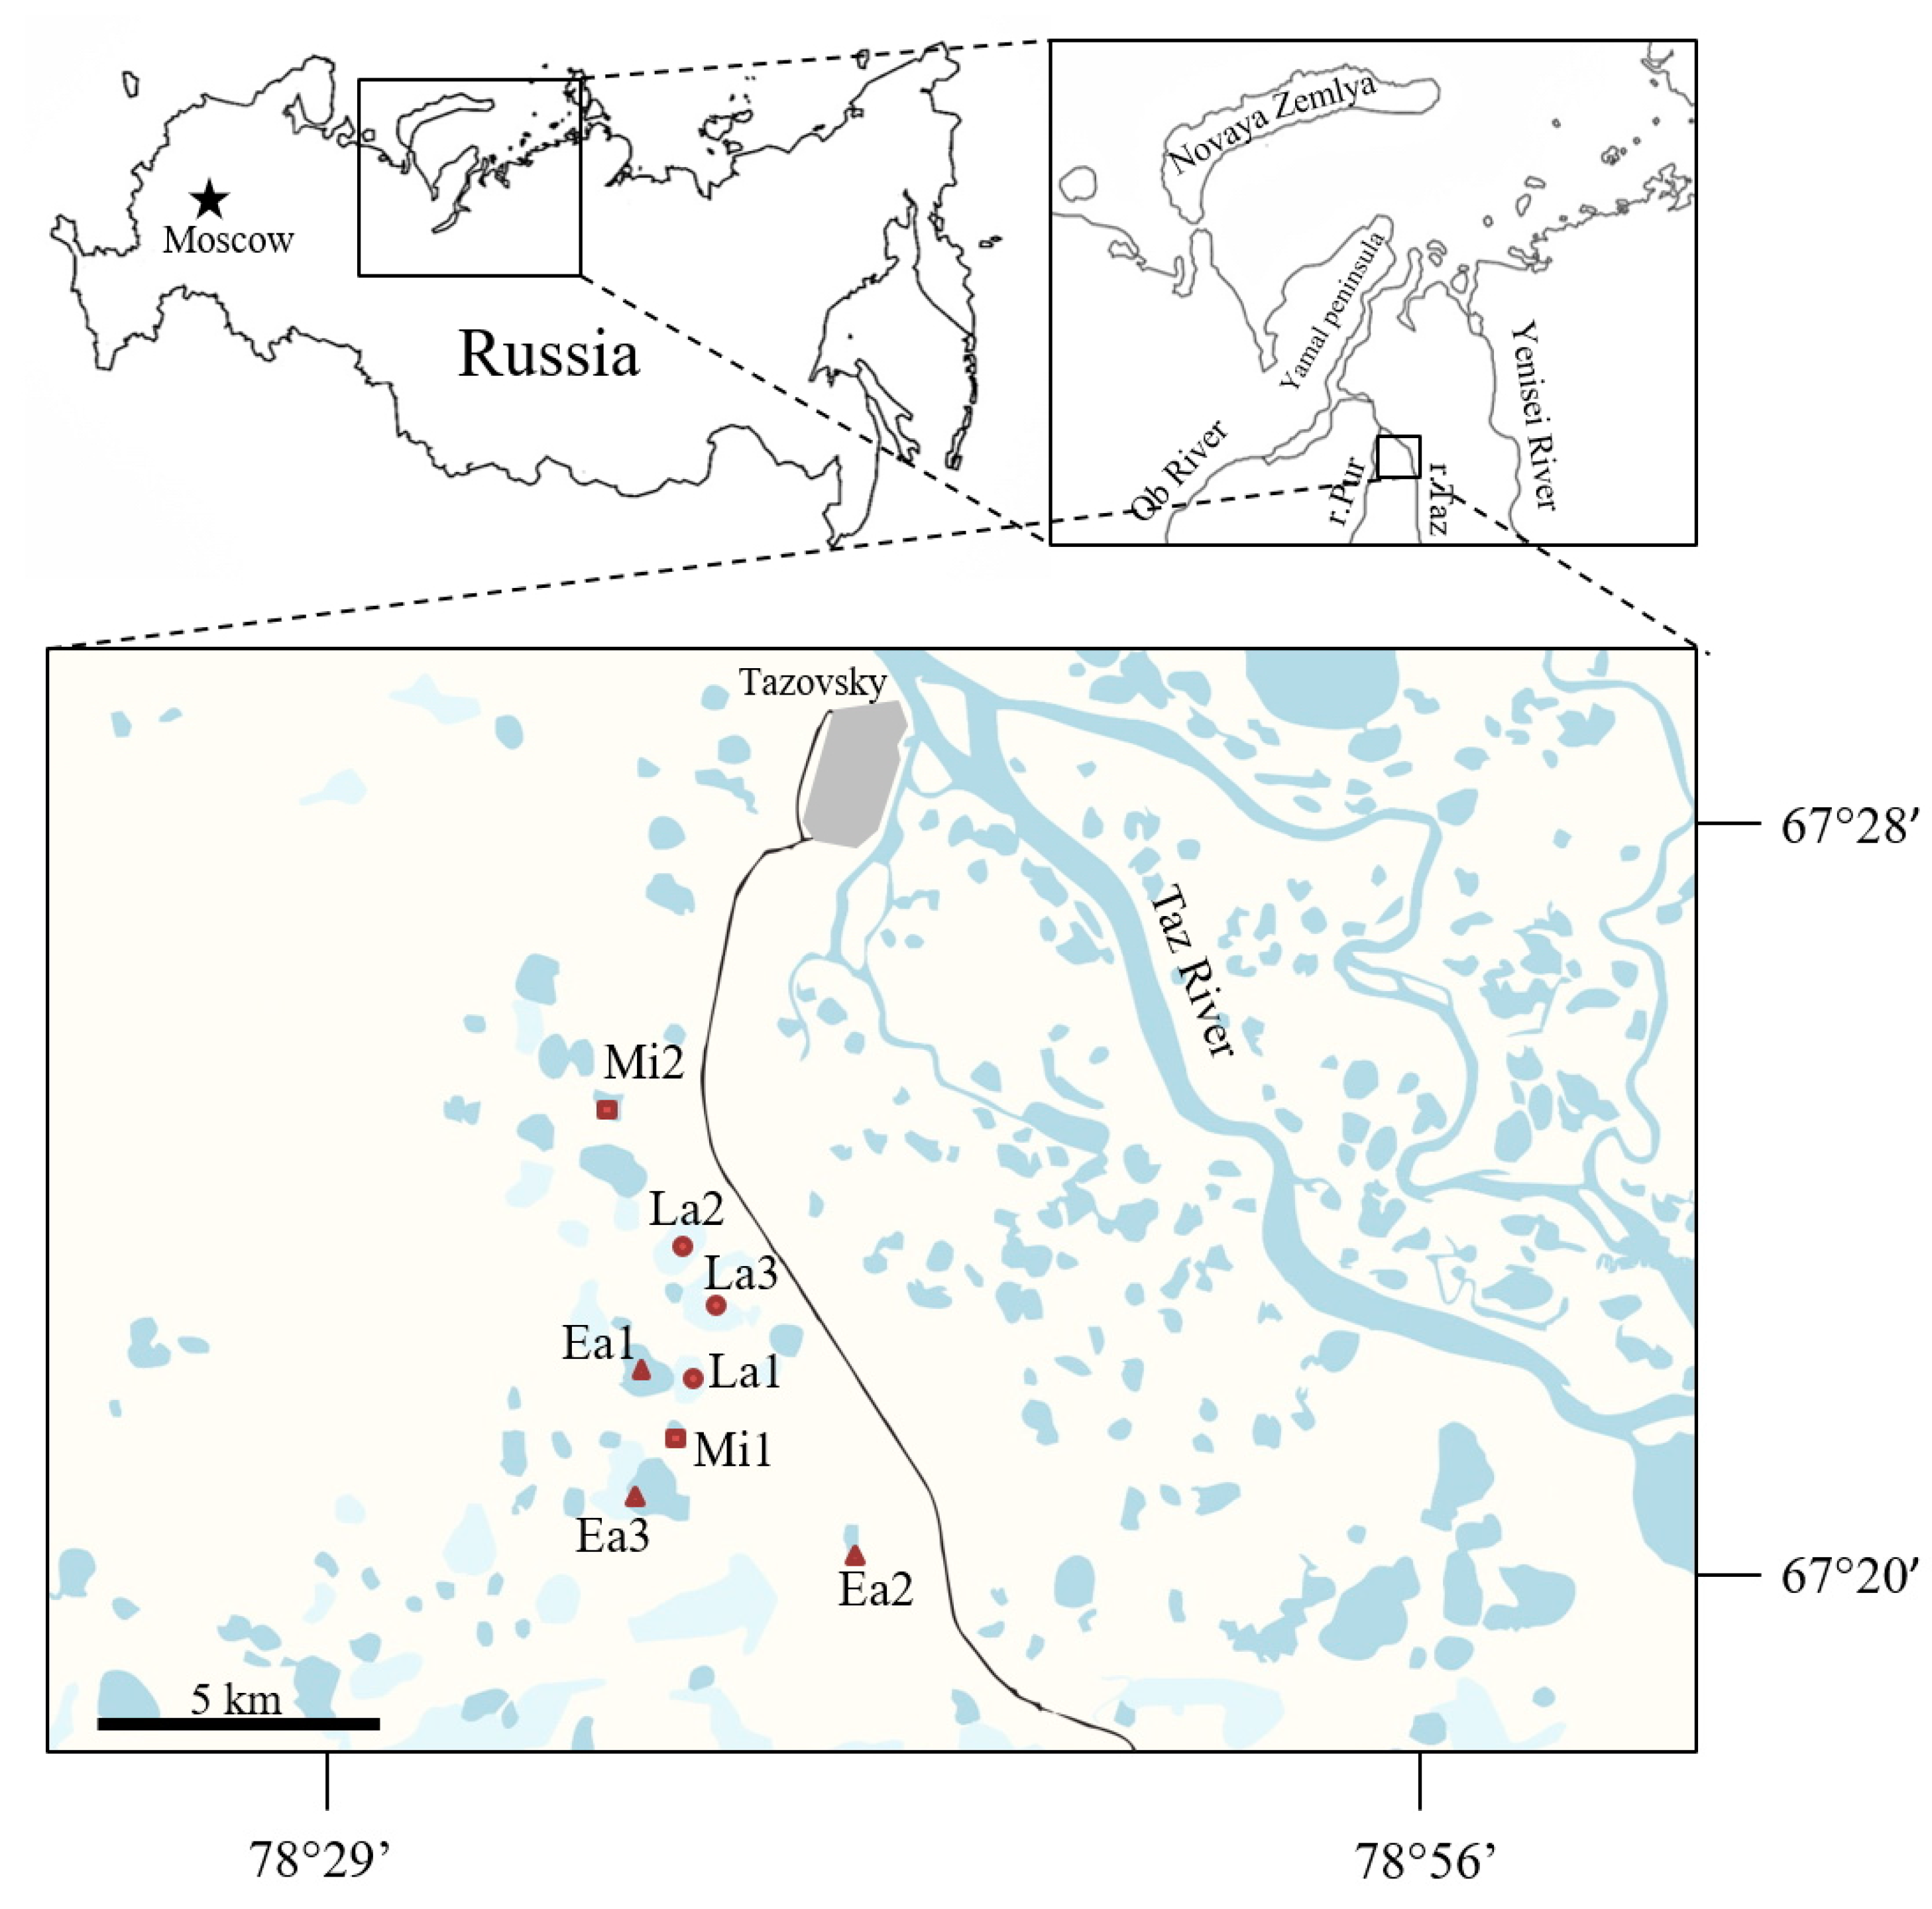
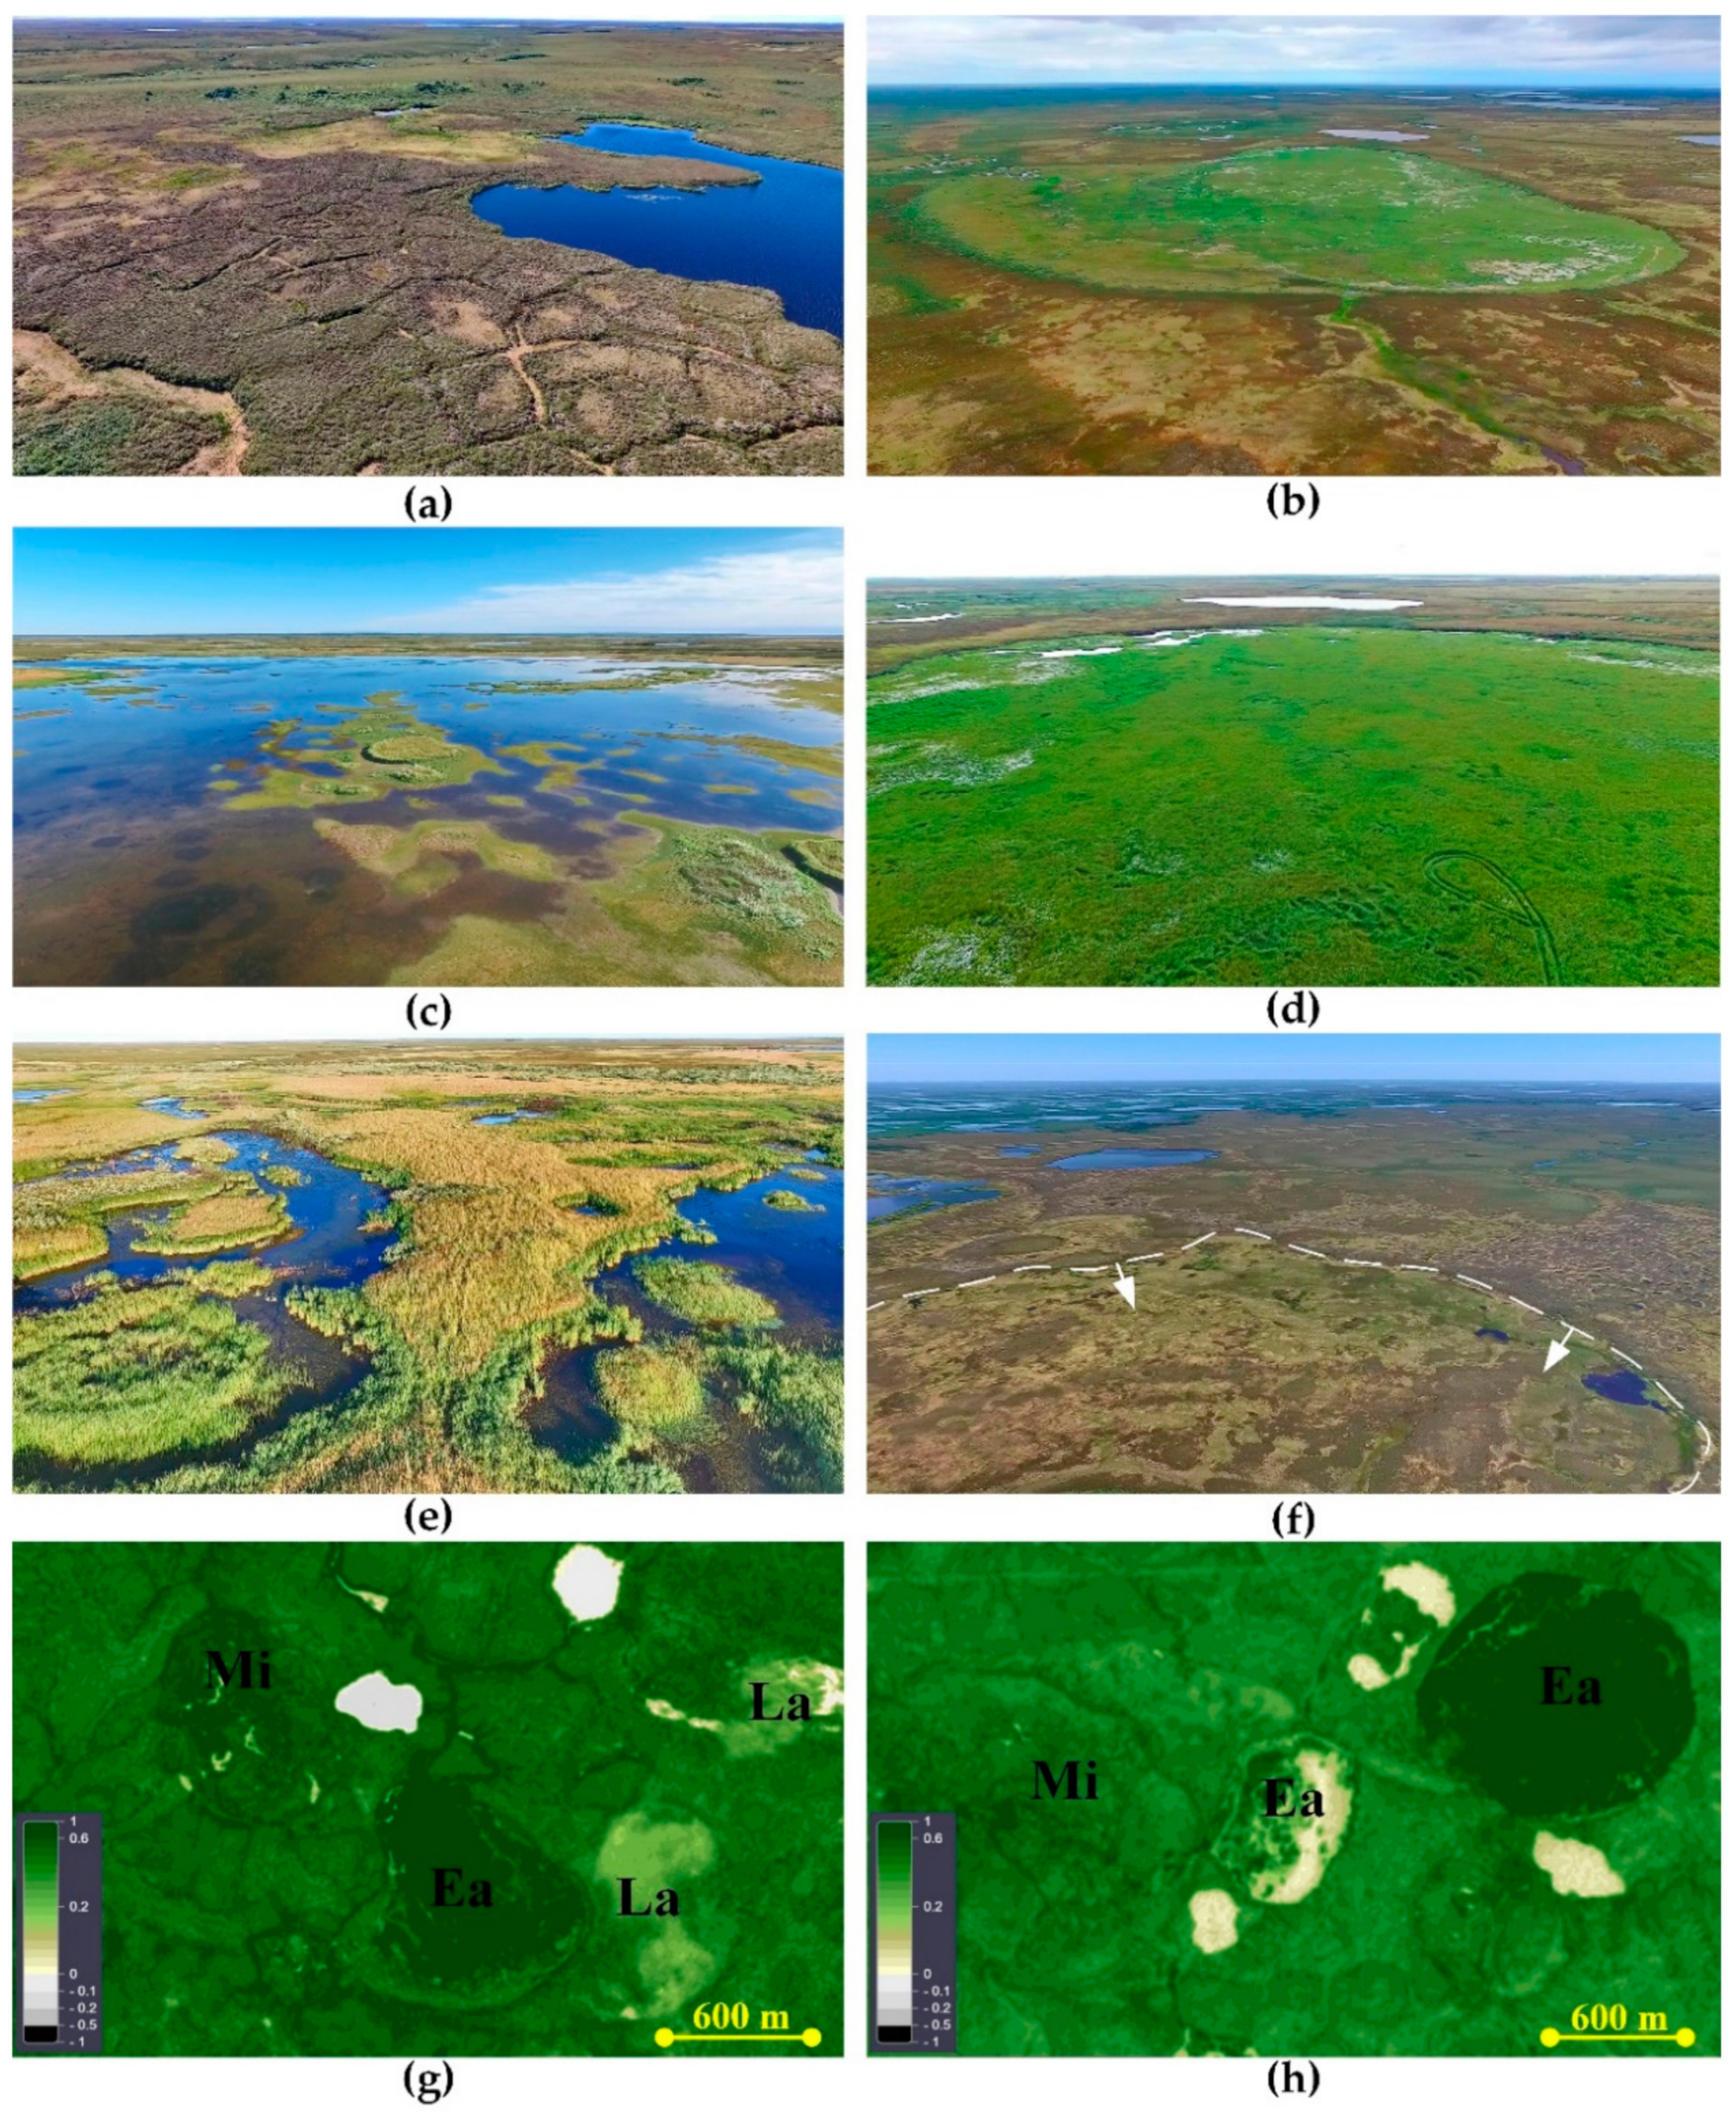
4.1. Study Site
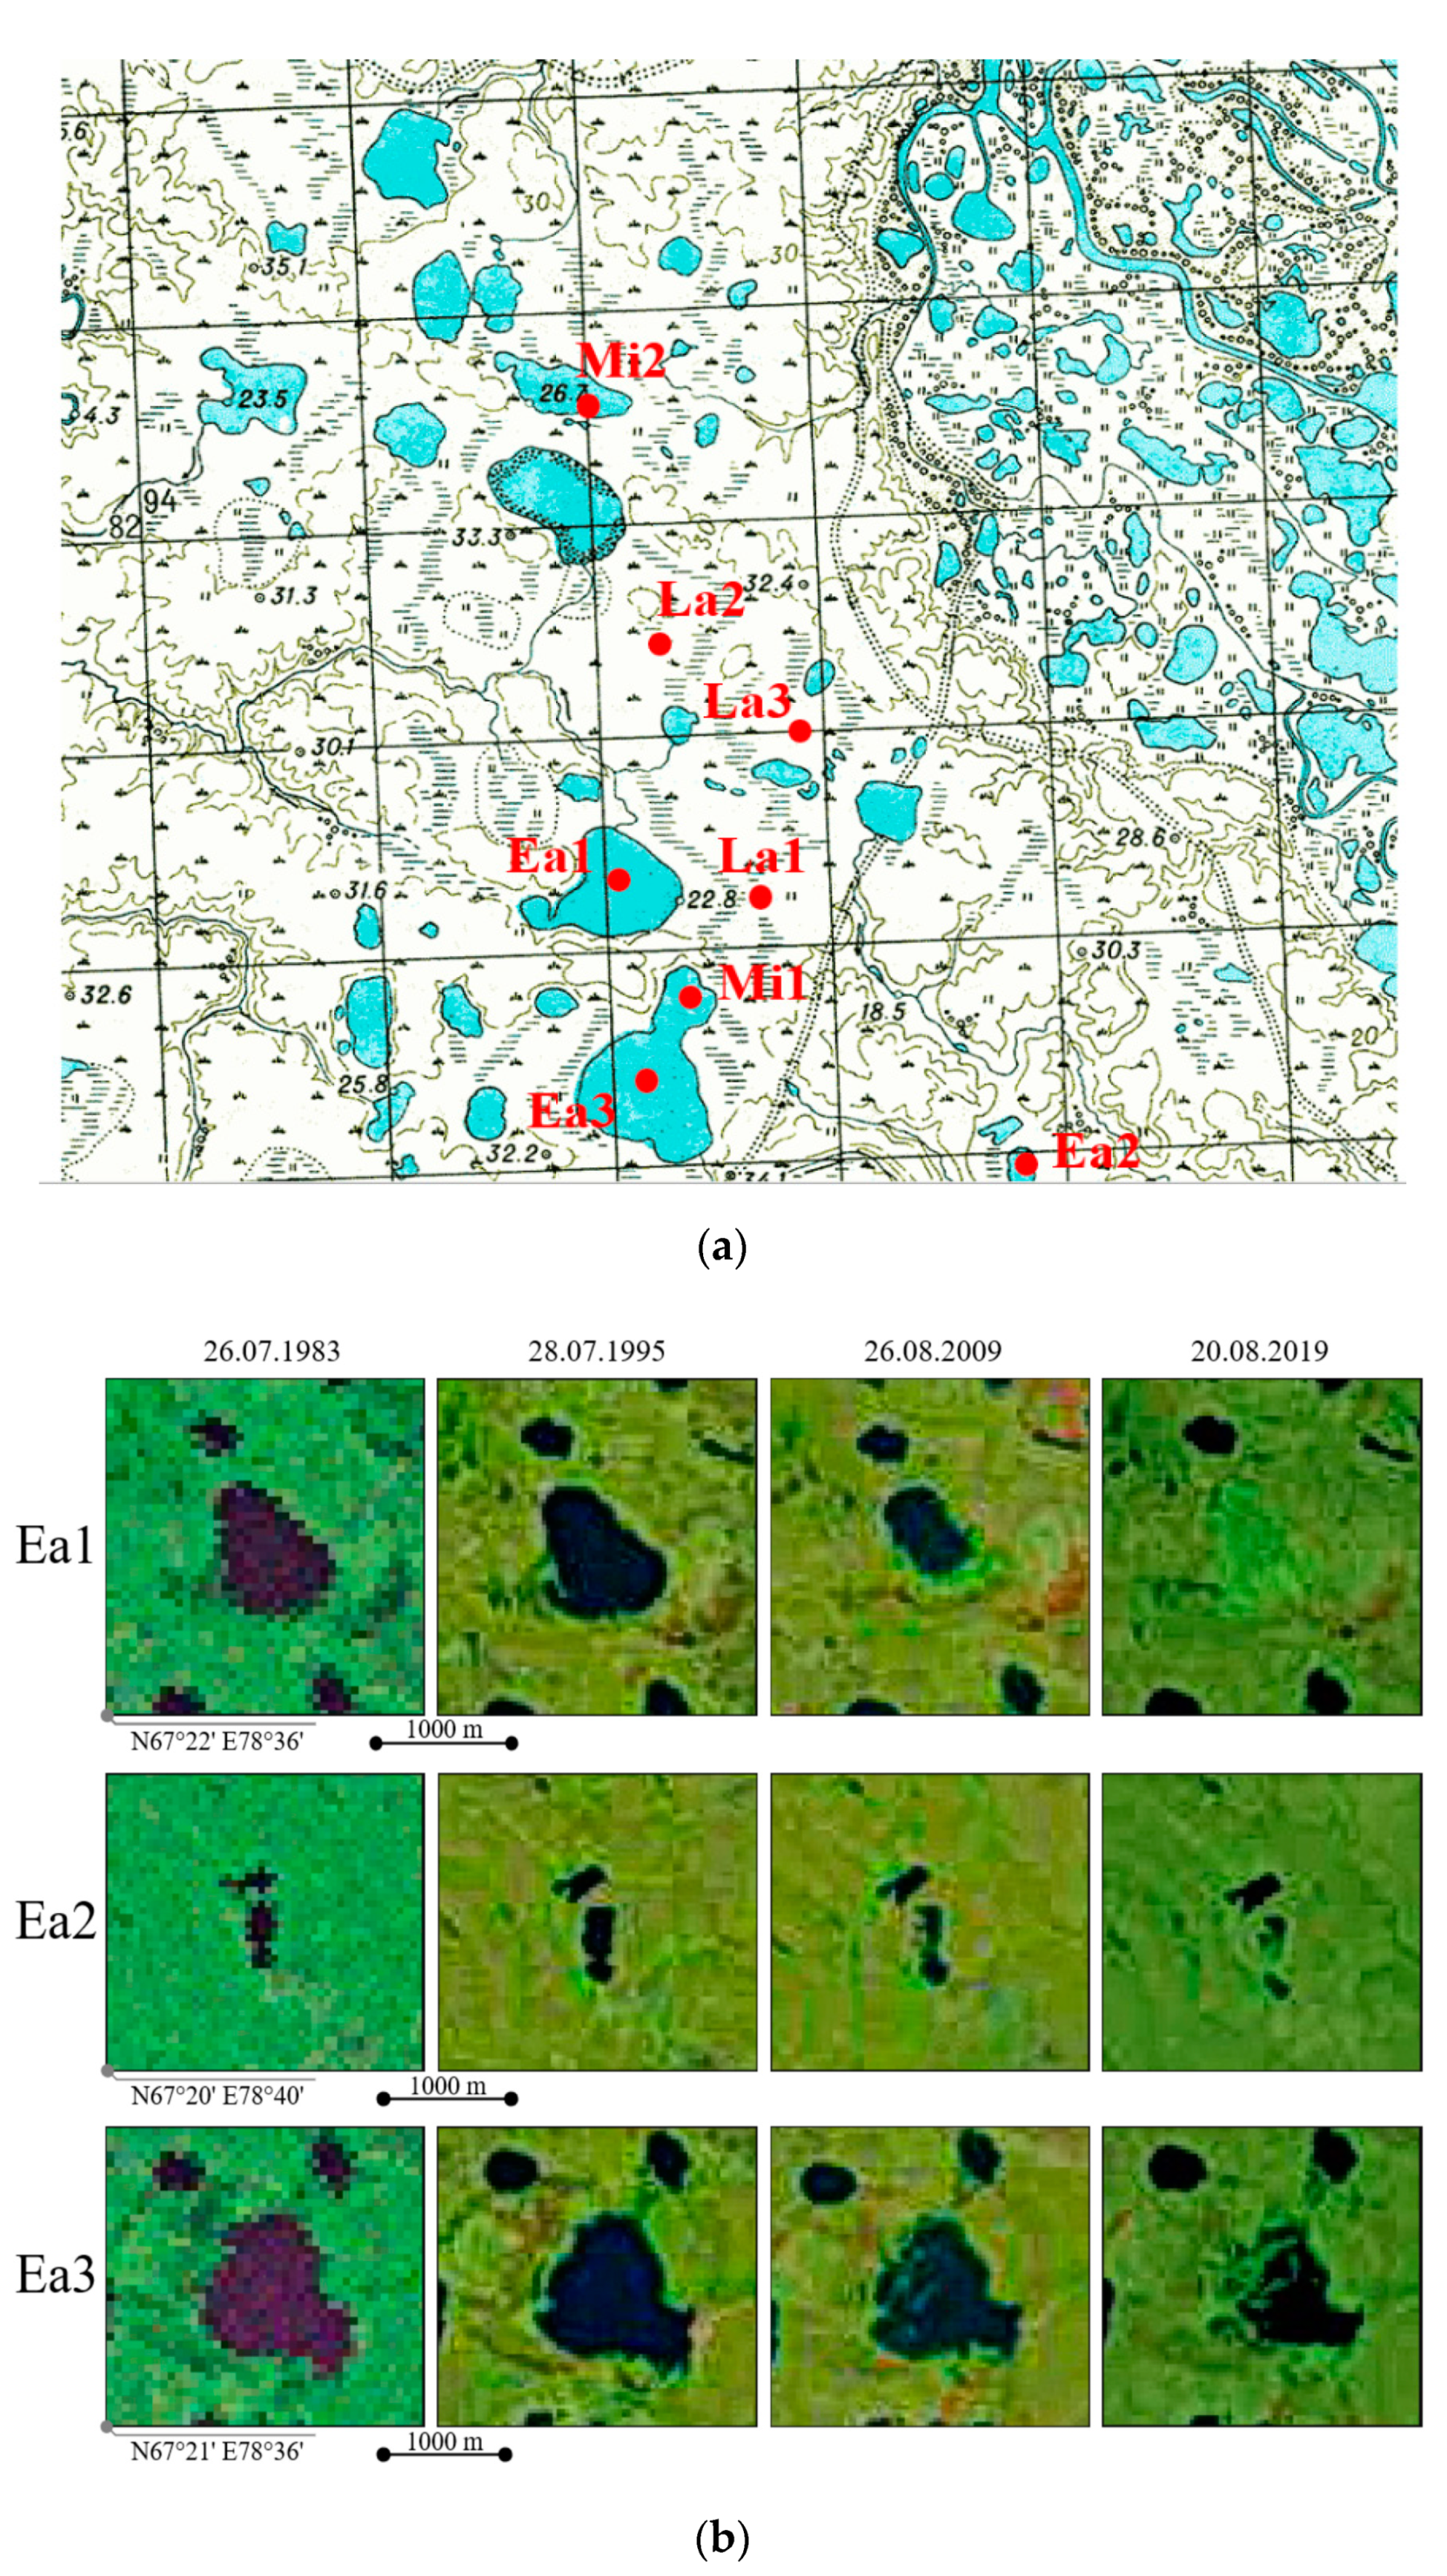
4.2. Dating the Drainage of the Studied Khasyreys
4.3. Vegetation Properties
4.4. Biogeochemical Properties and Microtopography
4.5. Statistical Analyses
5. Conclusions
Author Contributions
Funding
Acknowledgments
Conflicts of Interest
Appendix A


Appendix B

| Species List | Ecological Group | Successional Stages of Khasyreys | |||
|---|---|---|---|---|---|
| Moisture | Trophicity | Early | Mid | Late | |
| 1 | 2 | 3 | 4 | 5 | 6 |
| Salix lapponum L. | HM | M | + | + | |
| Salix lanata L. | M | M | + | ||
| Salix viminalis L. | M | ME | + | + | |
| Salix phylicifolia L. | M | M | + | + | |
| Salix glauca L. | M | M | + | ||
| Salix bebbiana Sarg. | M | ME | + | ||
| Salix myrtilloides L. | HM | M | + | ||
| Arctophila fulva (Trin.) Anderss. | SH | ME | + | + | |
| Carex rostrata Stokes | SH | ME | + | + | + |
| Carex aquatilis Wahlenb. | HM | M | + | + | |
| Carex limosa L. | HM | M | + | ||
| Carex chordorrhiza Ehrh. | HM | MO | + | ||
| Carex rotundata Wahlenb. | HM | M | + | ||
| Carex lapponica O.Lang. | HM | M | + | + | |
| Eriophorum polystachion L. | HM | M | + | + | + |
| Eriophorum scheuchzeri Hoppe | HM | MO | + | + | + |
| Eriophorum russeolum Fries | HM | M | + | ||
| Eriophorum medium Anderss. | HM | M | + | ||
| Eleocharis palustris (L.) Roem.et Schult. | HM | ME | + | ||
| Calamagrostis langsdorffii (Link) Trin. | M | M | + | + | |
| Calamagrostis neglecta (Ehrh.) Gaertn., Mey. et Scherb. | HM | M | + | + | |
| Poa pratensis L. | M | ME | + | ||
| Polemonium acutiflorum Willd.ex Roem. et Schult. | M | M | + | ||
| Ranunculus repens L. | M | ME | + | ||
| Equisetum arvense L. | M | M | + | + | |
| Stellaria longifolia Muehl.ex Willd. | M | ME | + | ||
| Chamaenerion angustifolium (L.) Scop. | M | M | + | ||
| Parnassia palustris L. | HM | M | + | ||
| Pyrola minor L. | M | M | + | ||
| Rubus arcticus L. | M | M | + | + | |
| Betula nana L. | HM | MO | + | + | + |
| Ledum palustre L. | M | M | + | ||
| Luzula wahlenbergii Rupr. | M | M | + | ||
| Andromeda polifolia L. | HM | MO | + | ||
| Chamaedaphne calyculata (L.) Moench | HM | M | + | ||
| Oxycoccus microcarpus Turcz.ex Rupr. | HM | MO | + | ||
| Empetrum nigrum L. | M | MO | + | ||
| Vaccinium uliginosum subsp. microphyllum (Lange) Tolm. | M | M | + | + | |
| Vaccinium vitis-idaea subsp. minus (Lodd.) Hult. | M | M | + | ||
| Rubus chamaemorus L. | HM | M | + | ||
| Ranunculus gmelinii DC. | HM | M | + | + | |
| Ranunculus pallasii Schlecht. | SH | M | + | + | + |
| Menyanthes trifoliata L. | SH | M | + | + | |
| Tephroseris palustris (L.) Reichenb. | M | ME | + | + | |
| Callitriche palustris L. | SH | M | + | + | |
| Epilobium palustre L. | HM | ME | + | + | |
| Rorippa palustris (L.) Bess. | HM | ME | + | + | |
| Hippuris vulgaris L. | SH | ME | + | + | |
| Galium brandegei A.Gray | HM | ME | + | + | |
| Sparganium minimum Wallr. | SH | M | + | ||
| Sparganium angustifolium Michx. | SH | M | + | + | |
| Equisetum fluviatile L. | SH | M | + | + | |
| Comarum palustre L. | HM | M | + | + | + |
| Caltha palustris L. | HM | ME | + | + | |
| Caltha natans Pallas ex Georgi | HM | ME | + | + | |
| Petasites frigidus (L.) Fries | M | M | + | ||
| Calliergon cordifolium (Hedw.) Kindb. | HM | M | + | + | + |
| Calliergon richardsonii (Mitt.) Kindb. | HM | M | + | ||
| Calliergon megalophyllum Mikut. | HM | M | + | ||
| Hamatocaulis lapponicus (Norrl.) Hedenaes | + | ||||
| Hamatocaulis vernicosus (Mitt.) Hedenaes | SH | M | + | ||
| Polytrichum commune Hedw. | M | M | + | + | + |
| Polytrichum swartzii Hartm. | M | M | + | + | + |
| Warnstorfia exannulata (B.S.G.) Loeske | HM | M | + | + | + |
| Warnstorfia fluitans (Hedw.) Loeske | HM | M | + | + | + |
| Aulacomnium palustre (Hedw.) Schwaegr. | HM | M | + | + | |
| Bryum pseudotriquetrum (Hedw.) Gaertn.et al. | M | M | + | + | |
| Brachythecium salebrosum (Web.et Mohr) Schimp. | M | M | + | ||
| Brachythecium reflexum (Starke) Schimp. | M | M | + | ||
| Plagiothecium denticulatum (Hedw.) Schimp. | M | M | + | ||
| Plagiomnium ellipticum (Brid.) T.Kop. | M | M | + | ||
| Sanionia uncinata (Hedw.) Loeske | M | M | + | + | |
| Sphagnum squarrosum Crome | HM | M | + | + | |
| Sphagnum obtusum Warnst. | HM | MO | + | + | |
| Sphagnum balticum (Russ.) Russ.ex C.Jens. | HM | MO | + | ||
| Sphagnum jensenii H.Lindb. | HM | MO | + | ||
| Sphagnum majus (Russ.) C.Jens. | HM | MO | + | ||
| Sphagnum riparium Aongstr. | HM | MO | + | ||
| Sphagnum aongstroemii Hartm. | M | MO | + | ||
| Sphagnum subsecundum Nees ex Sturm. | SH | MO | + | ||
| Sphagnum lindbergii Schimp.ex Lindb. | HM | MO | + | ||
| Sphagnum compactum DC. | M | MO | + | ||
| Aulacomnium turgidum (Wahlenb.) Schwaegr. | M | MO | + | ||
| Calliergon stramineum (Brid.) Kindb. | HM | M | + | ||
| Dicranum elongatum Schleich.ex Schwaegr. | M | MO | + | + | |
| Pleurozium schreberi (Brid.) Mitt. | M | MO | + | ||
| Polytrichum strictum Brid. | M | MO | + | ||
| Barbilophozia binsteadii (Kaal.) Loeske. | M | MO | + | ||
| Ptilidium ciliare (L.) Hampe. | M | MO | + | ||
| Flavocetraria cucullata (Bellardi) Karnefelt & Thell. | M | MO | + | ||
| Cetraria islandica (L.) Ach. | M | MO | + | ||
| Cladina rangiferina (L.) Nyl. | M | MO | + | ||
| Cladonia gracilis (L.) Willd. | M | MO | + | ||
| Cladina arbuscula (Wallr.) Hale & W.L. Culb. | M | MO | + | ||
| Cladina stellaris (Opiz) Brodo. | M | MO | + | ||
| Successional Stages | Microtopography and sediment texture | Soil Settings | Mean ANPP, g·m−2·year−1 | Mean NDVI | Phytoindication assessment of ecotopes in relation to soil moisture (left of slash) and richness in nutrients (right of slash) | Plant community | Ratio of ecological groups in relation to soil moisture (left of slash) and to soil richness in nutrients (right of slash) * | ||||
| Soil names by WRB | ALT, m | Peat/ plant litter thickness, cm | Average pH/sp. cond of soil water | Average pools N mineral/K labile/P-PO4 in a soil layer 0–30 cm (g m–2) | |||||||
| Early | The lowest parts of the lake basins. Loam sediments with thin layers of redeposited peat. | Fluvisols (Siltic, Limnic), Fluvic Gleysols (Siltic, Limnic) | >1.5 1–1.5 (peat layers in the sediment) | no litter | 6.6/259 | 2.7/22/11.7 | 1753 (475–2538) | 0.72 (0.69–0.74) | 84.4/9.4 | Arctophilic community. In herb layer (cover 70–75%) Arctophila fulva dominates with very small participation of another hydrophilic species (Carex aquatilis and others). Moss layer is rarefied (<1%)—Calliergon cordifolium, Warnstorfia exannulata, W. fluitans met. | 1M-27HM-71SH-1H/27M-73ME |
| Lower parts of the lake basins. Mostly loamy with thin layers of sand. There are layers of loam with an admixture of peat. | Fluvic Gleysols (Epiarenic, Siltic, Limnic) Fluvisols (Siltic) | >1.5 | 1–4 | 6.7/500 | 3.1/24.8/13.2 | 1239 (727–1751) | 0.68 (0.65–0.7) | 84.5/9.2 | Sedge community. In herb layer (30–75%) Carex rostrata or C. aquatilis dominates with less participation of Arctophila fulva and others. Moss layer is rarefied (1%)—Calliergon cordifolium, Warnstorfia exannulata, W. fluitans, Bryum pseudotriquetrum met. | 1M-38HM-61SH/3MO-35M-62ME | |
| The shore parts of the lake basins. The top sediments is sand. | Fluvic Folic Gleysols | >1.5 less often 0.5–0.8 (peat layers in the sediment) | 2–5 | 5.9/69.8 | 3.1/21.8/11.6 | 1135 (800–1395) | 0.69 (0.67–0.69) | 79.8/8.6 | Reedgrass-sedge community. In herb layer (50–60%) Carex aquatilis dominates with less participation of Calamagrostis langsdorffii, C. neglecta. Moss layer is rarefied (1%)—Calliergon cordifolium, Polytrichum commune, Bryum pseudotriquetrum met. | 22M-78HM/98M-2ME | |
| Local elongated rise (ripples on the surface of the sediment) in the lake basins with an excess over depressions of 15–30 cm. | Fluvisols (Siltic) Fluvic Gleysols (Siltic) | >1.5 | no litter | 6.2/144 | 0.9/14.3/7.6 | 880 (454–1307) | 0.66 (0.65–0.67) | 78.8/8.7 | Sedge community with willows. Bush layer (15%) consists of Salix viminalis, S. phylicifolia, with less participation of S. lapponum, S. glauca. In the herb layer (65–70%) Carex aquatilis dominates with less participation of Eriophorum scheuchzeri, E. polystachion, Calamagrostis langsdorfii. In the moss layer (<1%) Warnstorfia exannulata met. | 21M-79HM/4MO-87M-9ME | |
| Mid | Frost mounds (excess over depressions of about one meter). Sediments with layers of redeposited peat. | Fluvic Folic Gleysols (Gelic), Eutric Sapric Histosol (Limnic) (near the peat bank) | 0.5–1.5 | 5–8 | 6.2/178.5 | 7.3/35.1/18.6 | 849 (559–1332) | 0.64 (0.61–0.68) | 71.6/8.8 | Reedgrass-horsetail-brown moss (Bryales) community. In herb layer (45–80%) Calamagrostis langsdorffii and Equisetum arvense co-dominate with less participation of Polemonium acutiflorum and others. In moss layer (10%) Brachythecium salebrosum, Calliergon cordifolium, Aulacomnium palustre prevail with less participation of Plagiothecium denticulatum. | 93M-7HM/98M-2ME |
| Folic Reductaquic Cryosols | 0.5–0.6 | 6–11 | 6.0/97 | 7.2/27.3/14.5 | 760 (580–852) | 0.66 (0.64–0.69) | 73.4/6.6 | Birch-brown moss (Bryales) community. In bush layer (30–50%) Betula nana dominates with less participation of Salix bebbiana, S. lanata, S. lapponum, S. phylicifolia. In herb layer (5–15%) Calamagrostis langsdorffii dominates with less participation of Polemonium acutiflorum, Comarum palustre, Petasites frigidus, Parnassia palustris, as well as Vaccinium uliginosum, Pyrola minor, Rubus arcticus. In moss layer (95–100%) Dicranum elongatum prevails with less participation of Aulacomnium palustre, Bryum sp. | 65M-35HM/79MO-21M | ||
| Footslopes and toeslopes of the frost mounds | Fluvic Gleysols | >1.5 | 4–12 | 7.0/258 | 7.3/46.8/24.8 | 542 (223–861) | 0.59 (0.56–0.63) | 76.5/9.0 | Reedgrass-sedge-brown moss (Bryales) community. In herb layer (35–40%) Carex aquatilis or C. rostrata dominates with less participation of Calamagrostis langsdorffii, C. neglecta, Comarum palustre. In moss layer (50–60%) Brachythecium salebrosum, Calliergon cordifolium, Polytrichum swartzii, Aulacomnium palustre co-dominate, Plagiomnium ellipticum, Sphagnum squarrosum met. | 48M-43HM-9SH/89M-11ME | |
| Depression between frost mounds. The shore of thaw ponds. Grassy litter (peat) is very loose. Sediment of loamy texture. | Eutric Fluvic Gleysols | >1.5 | 8–15 | 7.0/249 | 1.6/28.0/14.9 | 744 (487–934) | 0.65 (0.63–0.67) | 84.0/8.6 | Sedge-brown moss (Bryales) community. In herb layer (35–70%) Carex aquatilis or C. rostrata dominates with less participation of Eriophorum scheuchzeri, E. polystachion. In moss layer (40–60%) Calliergon cordifolium, Warnstorfia exannulata, W. fluitans prevail with less participation of C. megalophyllum. Sphagnum squarrosum, S. obtusum met. | 82HM-18SH/1MO-81M-18ME | |
| Histic Gleysols | >1.5 | 13–17 | 5.7/44 | 18.3/37.6/19.9 | 320 (200–400) | 0.62 (0.58–0.64) | 80.5/8.7 | Sedge-brown moss (Bryales) community. In herb layer (15–20%) Carex aquatilis dominates with less participation of Caltha palustris. In moss layer (80–90%) Calliergon cordifolium, Warnstorfia exannulata, W. fluitans prevail. | 100HM/100M | ||
| The shore of the residual ponds and the riparian zone streams. | Eutric Histic Fluvisols (Siltic, Limnic) Eutric Fluvic Gleysols | 1–1.5 and more | 6–8 | 5.2/14 | 3.3/6.1/2.5 | 556 (381–580) | 0.63 (0.61–0.64) | 82.1/8.6 | Arctophilic-brown moss (Bryales) community. In herb layer (10–20%) Arctophila fulva dominates with less participation of Hippuris vulgaris (5–10%). In moss layer (55–65%) Calliergon cordifolium and Calliergon megalophyllum are dominates. | 59HM-33SH-8H/67M-33ME | |
| Nearly level shore slopes of residual ponds. At the top of the sediment is sand. | Dystric Fluvic Gleysols | >1.5 | 3–7 | 6.6/16 | 8.3/39.1/20.7 | 440 (305–574) | 0.65 (0.64–0.66) | 83.4/7.7 | Horsetail-brown moss (Bryales) community. In herb layer (15–17%) Equisetum fluviatile prevails with less participation of another hydrophilic herbs. Im moss layer (80–90%) Calliergon megalophyllum dominates. | 1M-86HM-13SH/99M-1ME | |
| Late | Flowing fen. Wide and elongated depressions with water tracks at the bottom. Bog water at the surface of the soils. In spring, the water level above the soils. | Dystric Histic Gleysols | 0.5–0.6 | 25–35 | 6.0/30 | 3.8/1.5/0.8 | 253 (163–314) | 0.54 (0.45–0.59) | 85.6/6.6 | Sedge-sphagnum community. In dwarf shrub-herb layer (15%) Carex chordorrhiza prevail with less participation of C. limosa, C. rotundata, Eriophorum russeolum and Andromeda polifolia, Chamaedaphne calyculata, Betula nana. In moss layer (100%) Sphagnum obtusum dominates with less participation of Calliergon stramineum. | 2M-97HM-1SH/83MO-17M |
| Standing fen. The flat part of the lake basin. | Dystric Histic Cryosols Dystric Cryic Histosols | 0.4–0.5 | 32–41 | 4.9/25.7 | 6.4/9.1/4.9 | 266 (177–335) | 0.52 (0.46–0.59) | 85.3/6.2 | Sedge-sphagnum community. In dwarf shrub-herb layer (7–12%) Carex chordorrhiza, C. limosa, C. rotundata, Eriophorum russeolum prevail with less participation of Andromeda polifolia, Chamaedaphne calyculata, Betula nana. In moss layer (100%) Sphagnum balticum, S. jensenii or S. majus dominates. | 2M-98HM/88MO-12M | |
| The shores of residual ponds, as well as thawed ponds. | Histic Gleysols | >1.5 | 8–12 | 5.5/20 | 3.1/7.1/3.8 | 377 (351–402) | 0.62 (0.61–0.64) | 88.0/8.5 | Sedge-cotton grass community (lakeside fen). In herb layer (50–60%) Carex rostrata, Eriophorum medium. In moss layer (40%) Sphagnum jensenii dominates with less participation of Sphagnum subsecundum, Warnstorfia exannulata. | 47HM-53SH/38MO-12M-50ME | |
| The smallest depressions (several meters in diameter) with a water thickness of up to 10 cm. | Dystric Histic Cryosols | 0.4–0.6 | 15–25 | 4.5/13 | 3.2/1.1/0.6 | 178 (163–194) | 0.55 (0.53–0.59) | 84.0/6.0 | Sphagnum community. Herb layer is rarefied (4–7%) – Erophorum russeolum, E. medium, E. polystachion. In moss layer (90–100%) Sphagnum obtusum, S. jensenii, or S. balticum dominates with less participation of Warnstorfia exannulata, W. fluitans. | 99HM-1SH/85MO-15M | |
| Frost mounds. Most often rounded, 10–20 m in diameter, exceeding several dozen centimeters above the fens. Less elongated, sizes up to 100–200 m, and exceeding to the fens up to 1 m. | Dystric Folic Cryosols | 0.3–0.4 | 10–20 | 4.4/24 | 6.3/21.7/11.5 | 225 (195–245) | 0.59 (0.56–0.61) | 77.9/6.0 | Dwarf shrub-lichen-sphagnum community. In dwarf shrub-herb layer (25–60%) Ledum palustre and Betula nana dominate with less participation of Chamaedaphne calyculata, Andromeda polifolia, Vaccinium vitis-idaea var. minus, Rubus chamaemorus. In moss-lichen layer (95–100%) among mosses Sphagnum balticum dominates or co-dominates with S. lindbergii, among lichens Cladina rangiferina dominates with less participation of Cetraria islandica, Flavocetraria cucullata. | 44M-56HM/74MO-26M | |
| A. Non-parametric H-criterion Kruskal-Wallis for un-paired data, at p < 0.05. | |||
| Variable | H | p-Level | |
| Cover of mosses | 28.99 | 0 | |
| Cover of grass | 25.4 | 0 | |
| Litter/peat thickness | 20.6 | 0 | |
| NDVImax | 18.6 | 0.0001 | |
| Soil density | 14 | 0.0009 | |
| ANPP | 15 | 0.0005 | |
| pH soil water | 11.1 | 0.004 | |
| Sp. cond. | 11.8 | 0.0027 | |
| P-PO4 | 9.9 | 0.007 | |
| K labile | 13.3 | 0.0013 | |
| N min | 8.1 | 0.0172 | |
| ALT | 6.2 | 0.0442 | |
| B. Pairwise COMPARISON of successional stages of the khasyreys by soil and vegetation parameters. Shown are pairs with statistically significant differences according to the Mann-Whitney U-test (at p < 0.05). | |||
| Compared Successional Stage | Variable | U | p-Level |
| Early-Late | Litter/peat thickness | 0 | 0.0011 |
| NDVImax | 0 | 0.001 | |
| Soil density | 0 | 0.001 | |
| ANPP | 0 | 0.0011 | |
| pH soil water | 4 | 0.004 | |
| Sp. cond. | 0 | 0.001 | |
| P-PO4 | 6 | 0.0077 | |
| N min | 7 | 0.01 | |
| K labile | 10 | 0.024 | |
| ALT | 11 | 0.035 | |
| Cover of herbs | 0 | 0.0003 | |
| Cover of mosses | 0 | 0.0003 | |
| Early-Mid | Litter/peat thickness | 9 | 0.001 |
| NDVImax | 16 | 0.003 | |
| N min | 26 | 0.0255 | |
| K labile | 25 | 0.0215 | |
| Cover of mosses | 0 | 0.001 | |
| Mid-Late | Litter/peat thickness | 2 | 0.003 |
| NDVImax | 2 | 0.002 | |
| Soil density | 0 | 0.001 | |
| ANPP | 3 | 0.004 | |
| pH soil water | 3 | 0.003 | |
| Sp. cond. | 6 | 0.008 | |
| P-PO4 | 4 | 0.004 | |
| K labile | 2 | 0.002 | |
| Cover of herbs | 1 | 0.000018 | |
| Cover of mosses | 1 | 0.000016 | |
| Variable | Soil Trophic Parameters and Vegetation Productivity | |||||||||
|---|---|---|---|---|---|---|---|---|---|---|
| PeatT | NDVImax | ANPP | ALT | SDens | pHw | Nmin | K Labile | P-PO4 | Sp. Cond. | |
| PeatT | 1.00 | −0.88 | −0.52 | −0.52 | −0.77 | −0.65 | 0.38 | −0.27 | −0.27 | −0.34 |
| ANPP | −0.52 | 0.67 | 1.00 | 0.18 | 0.27 | 0.09 | −0.33 | −0.02 | −0.02 | −0.09 |
| ALT | −0.52 | 0.33 | 0.18 | 1.00 | 0.53 | 0.46 | −0.25 | 0.25 | 0.25 | 0.47 |
| SDens | −0.77 | 0.60 | 0.27 | 0.53 | 1.00 | 0.72 | −0.13 | 0.49 | 0.49 | 0.60 |
| pHw | −0.65 | 0.43 | 0.09 | 0.46 | 0.72 | 1.00 | −0.19 | 0.30 | 0.30 | 0.75 |
| Nmin | 0.38 | −0.30 | −0.33 | −0.25 | −0.13 | −0.19 | 1.00 | 0.69 | 0.69 | −0.04 |
| K labile | −0.27 | 0.21 | −0.02 | 0.25 | 0.49 | 0.30 | 0.69 | 1.00 | 1.00 | 0.26 |
| P-PO4 | −0.27 | 0.21 | −0.02 | 0.25 | 0.49 | 0.30 | 0.69 | 1.00 | 1.00 | 0.26 |
| Sp. cond. | −0.34 | 0.13 | −0.09 | 0.47 | 0.60 | 0.75 | −0.04 | 0.26 | 0.26 | 1.00 |
| NDVImax | −0.88 | 1.00 | 0.67 | 0.33 | 0.60 | 0.43 | −0.30 | 0.21 | 0.21 | 0.13 |
| Chem. el-t | Successional Stage of Khasyrey | |||||||
|---|---|---|---|---|---|---|---|---|
| Early | Mid | Late | ||||||
| Arctophila fulva (Lowest Central Partof the Khasyrey) (n = 3) | Calamagrostis langsdorffii (Hight Shore Partof the Khasyrey) (n = 3) | Carex rostrata (Lower Marginal Parts of the Khasyrey) (n = 3) | Calamagrostis langsdorffii (Top of Frozen Mound) (n = 3) | Calamagrostis langsdorffii (Toeslope of Frozen Mound) (n = 3) | Carex aquatilis (Flooded Permafrost Subsidence) (n = 3) | Sphagnum spp. (Standing Fen) (n = 3) | Sphagnum spp. (Flowing Fen) (n = 3) | |
| C | 42.5 ± 2.6 | 45.3 ± 2.7 | 45.3 ± 2.7 | 45.2 ± 2.7 | 45.5 ± 2.7 | 45.0 ± 2.7 | 44.5 ± 2.6 | 42.5 ± 2.6 |
| N | 2.2 ± 0.2 | 2.0 ± 0.2 | 1.6 ± 0.1 | 0.9 ± 0.1 | 0.8 ± 0.1 | 1.2 ± 0.1 | 1.3 ± 0.1 | 1.2 ± 0.1 |
| C/N | 19.3 | 22.7 | 28.3 | 50.2 | 56.9 | 37.5 | 34.2 | 35.4 |
| P | 1279 ± 64 | 1633 ± 82 | 2134 ± 107 | 747 ± 37 | 2183 ± 109 | 587 ± 29 | 1108 ± 55 | 1435 ± 72 |
| N/P | 17.2 | 12.2 | 7.5 | 12.0 | 3.7 | 20.4 | 11.7 | 8.4 |
| Na | 14 ± 0.3 | 14 ± 0.3 | 33 ± 0.7 | 22 ± 0.4 | 66 ± 1.3 | 14 ± 0.3 | 168 ± 3.4 | 60 ± 1.2 |
| Mg | 1346 ± 16 | 1578 ± 19 | 1262 ± 159 | 1940 ± 23 | 2854 ± 34 | 973 ± 12 | 1034 ± 12 | 1516 ± 18 |
| Al | 26 ± 1.4 | 19 ± 1.0 | 14 ± 0.7 | 20 ± 1.1 | 27 ± 1.4 | 16 ± 0.9 | 91 ± 4.8 | 60 ± 3.2 |
| K | 4120 ± 165 | 9183 ± 367 | 8374 ± 335 | 4492 ± 180 | 7014 ± 281 | 2730 ± 109 | 4297 ± 172 | 4292 ± 172 |
| Ca | 2401 ± 154 | 2181 ± 140 | 2746 ± 176 | 4195 ± 269 | 4783 ± 306 | 1476 ± 95 | 1769 ± 113 | 2060 ± 132 |
| Cr | 2.2 ± 0.61 | 1.7 ± 0.47 | 1.5 ± 0.42 | 1.6 ± 0.45 | 2 ± 0.56 | 2 ± 0.56 | 2.3 ± 0.64 | 2.3 ± 0.64 |
| Mn | 422 ± 11 | 392 ± 10 | 245 ± 6 | 496 ± 13 | 455 ± 12 | 610 ± 16 | 172 ± 5 | 189 ± 5 |
| Fe | 72.1 ± 1.7 | 100 ± 2.3 | 83.1 ± 1.9 | 55.1 ± 1.3 | 194 ± 4.5 | 32.3 ± 0.7 | 194 ± 4.5 | 727 ± 1.7 |
| Si | 1981 ± 59 | 1596 ± 48 | 268 ± 8 | 349 ± 11 | 577 ± 17 | 917 ± 28 | 834 ± 25 | 173 ± 5 |
| Co | 0.28 ± 0.02 | 0.36 ± 0.02 | 0.51 ± 0.03 | 0.35 ± 0.02 | 0.88 ± 0.05 | 0.17 ± 0.01 | 0.31 ± 0.02 | 0.75 ± 0.05 |
| Ni | 0.83 ± 0.22 | 1.19 ± 0.31 | 0.37 ± 0.10 | 1.98 ± 0.52 | 0.45 ± 0.12 | 0.64 ± 0.17 | 1.59 ± 0.41 | 0.87 ± 0.23 |
| Cu | 3 ± 0.04 | 3.2 ± 0.03 | 7 ± 0.08 | 3.1 ± 0.04 | 1.4 ± 0.02 | 5.7 ± 0.07 | 1.8 ± 0.02 | 1.5 ± 0.02 |
| Zn | 16 ± 0.4 | 20 ± 0.5 | 40 ± 1.1 | 39 ± 1.2 | 30 ± 0.8 | 48 ± 1.3 | 22 ± 0.6 | 33 ± 0.9 |
| Sr | 17 ± 0.2 | 14 ± 0.1 | 13 ± 0.1 | 19 ± 0.2 | 22 ± 0.2 | 7 ± 0.1 | 15 ± 0.2 | 7 ± 0.1 |
| Mo | 0.17 ± 0.01 | 1.49 ± 0.09 | 1.18 ± 0.07 | 0.14 ± 0.01 | 2.59 ± 0.16 | 0.36 ± 0.02 | 0.6 ± 0.04 | 0.68 ± 0.046 |
| Ba | 25 ± 0.4 | 28 ± 0.5 | 8 ± 0.1 | 40 ± 0.7 | 14 ± 0.2 | 14 ± 0.2 | 20 ± 0.3 | 15 ± 0.1 |
| U | 0.0043 ± 0.00013 | 0.0023 ± 0.00007 | 0.0023 ± 0.00007 | 0.0021 ± 0.00006 | 0.0027 ± 0.00008 | 0.002 ± 0.00006 | 0.0085 ± 0.00026 | 0.0031 ± 0.00009 |
| Ash content, % | 1.9 ± 0.1 | 2.5 ± 0.1 | 2.2 ± 0.1 | 1.8 ± 0.1 | 2.8 ± 0.1 | 1.2 ± 0.04 | 1.5 ± 0.1 | 1.6 ± 0.1 |
References
- Andresen, C.G.; Tweedie, C.E.; Lougheed, V.L. Climate and nutrient effects on Arctic wetland plant phenology observed from phenocams. Remote Sens. Environ. 2018, 205, 46–55. [Google Scholar] [CrossRef]
- Wu, Z.; Dijkstra, P.; Koch, G.W.; Peñuelas, J.; Hungate, B.A. Responses of terrestrial ecosystems to temperature and precipitation change: A meta-analysis of experimental manipulation. Glob. Chang. Biol. 2011, 17, 927–942. [Google Scholar] [CrossRef]
- Huang, M.; Piao, S.; Janssens, I.A.; Zhu, Z.; Wang, T.; Wu, D.; Ciais, P.; Myneni, R.B.; Peaucelle, M.; Peng, S.; et al. Velocity of change in vegetation productivity over northern high latitudes. Nat. Ecol. Evol. 2017, 1, 1649–1654. [Google Scholar] [CrossRef] [PubMed]
- Reichle, L.M.; Epstein, H.E.; Bhatt, U.S.; Raynolds, M.K.; Walker, D.A. Spatial heterogeneity of the temporal dynamics of Arctic Tundra vegetation. Geophys. Res. Lett. 2018, 45, 9206–9215. [Google Scholar] [CrossRef]
- Becker, M.S.; Davies, T.J.; Pollard, W.H. Ground ice melt in the high Arctic leads to greater ecological heterogeneity. J. Ecol. 2016, 104, 114–124. [Google Scholar] [CrossRef]
- Frost, G.V.; Bhatt, U.S.; Epstein, H.E.; Walker, D.A.; Raynolds, M.K.; Berner, L.T.; Bjerke, J.W.; Breen, A.L.; Forbes, B.C.; Goetz, S.J.; et al. Tundra Greenness. In Arctic Report Card: Update for 2019; Arctic Program: Phaffikon, Switzerland, 2019. [Google Scholar]
- Myers-Smith, I.H.; Kerby, J.T.; Phoenix, G.K.; Bjerke, J.W.; Epstein, H.E.; Assmann, J.J.; John, C.; Andreu-Hayles, L.; Angers-Blondin, S.; Beck, P.S.A.; et al. Complexity revealed in the greening of the Arctic. Nat. Clim. Chang. 2020, 10, 106–117. [Google Scholar] [CrossRef]
- Lara, M.J.; Nitze, I.; Grosse, G.; Martin, P.; David McGuire, A. Reduced Arctic tundra productivity linked with landform and climate change interactions. Sci. Rep. 2018, 8, 2345. [Google Scholar] [CrossRef]
- Belonovskaya, E.A.; Tishkov, A.A.; Vaisfeld, M.A.; Glazov, P.M.; Krenke, A.N., Jr.; Morozova, O.V.; Pokrovskaya, I.V.; Tsarevskaya, N.G.; Tertitskii, G.M. Greening of the Russian arctic and the modern trends of transformation of its biota. Izv. Ross. Akad. Nauk Seriya Geogr. 2016, 3, 28–39. [Google Scholar] [CrossRef]
- Miles, V.V.; Esau, I. Spatial heterogeneity of greening and browning between and within bioclimatic zones in northern West Siberia. Environ. Res. Lett. 2016, 11, 115002. [Google Scholar] [CrossRef]
- Miles, M.W.; Miles, V.V.; Esau, I. Varying climate response across the tundra, forest-tundra and boreal forest biomes in northern West Siberia. Environ. Res. Lett. 2019, 14, 075008. [Google Scholar] [CrossRef]
- Pan, N.; Feng, X.; Fu, B.; Wang, S.; Ji, F.; Pan, S. Increasing global vegetation browning hidden in overall vegetation greening: Insights from time-varying trends. Remote Sens. Environ. 2018, 214, 59–72. [Google Scholar] [CrossRef]
- Bedritskii, A.I. (Ed.) Global Climate and Soil Cover of Russia: Assessment of Risks and Ecological and Economic Consequences of Land Degradation. Adaptive Systems and Technologies for Environmental Management (Agriculture and Forestry); National Report; GEOS: Moscow, Russia, 2018; 357p. (In Russian) [Google Scholar]
- Paromov, V.V.; Zemtsov, V.A.; Kopysov, S.G. Climate of West Siberia during the slowing phase of warming (1986–2015) and prediction of hydro-climatic resources for 2021–2030. Bull. Tomsk Polytech. Univ. Geo Assets Eng. 2017, 328, 62–74. [Google Scholar]
- Biskaborn, B.K.; Smith, S.L.; Noetzli, J.; Matthes, H.; Vieira, G.; Streletskiy, D.A.; Schoeneich, P.; Romanovsky, V.E.; Lewkowicz, A.G.; Abramov, A.; et al. Permafrost is warming at a global scale. Nat. Commun. 2019, 10, 264. [Google Scholar] [CrossRef] [PubMed]
- Park, H.; Kim, Y.; Kimball, J.S. Widespread permafrost vulnerability and soil active layer increases over the high northern latitudes inferred from satellite remote sensing and process model assessments. Remote Sens. Environ. 2016, 175, 349–358. [Google Scholar] [CrossRef]
- Romanovsky, V.E.; Smith, S.L.; Christiansen, H.H. Permafrost thermal state in the polar northern hemisphere during the international polar year 2007–2009: A synthesis. Permafr. Periglac. Process. 2010, 21, 106–116. [Google Scholar] [CrossRef]
- Guo, D.; Wang, H. Simulated Historical (1901–2010) Changes in the permafrost extent and active layer thickness in the Northern Hemisphere. J. Geophys. Res. Atmos. 2017, 122, 12285–12295. [Google Scholar] [CrossRef]
- Kaverin, D.A.; Pastukhov, A.V.; Novakovskiy, A.B. Active layer thickness dynamics in the tundra permafrost affected soils: A calm site case study, the European north of Russia. Earth’s Cryosphere 2017, 21, 35–44. [Google Scholar] [CrossRef]
- Perreault, N.; Lévesque, E.; Fortier, D.; Gratton, D.; Lamarque, L.J. Remote sensing evaluation of High Arctic wetland depletion following permafrost disturbance by thermo-erosion gullying processes. Arct. Sci. 2017, 3, 237–253. [Google Scholar] [CrossRef]
- Kirpotin, S.; Polishchuk, Y.; Zakharova, E.; Shirokova, L.; Pokrovsky, O.; Kolmakova, M.; Dupre, B. One of the possible mechanisms of thermokarst lakes drainage in West-Siberian North. Int. J. Environ. Stud. 2008, 65, 631–635. [Google Scholar] [CrossRef]
- Tagunova, L.N. Etapy zarastaniya spushchennyh ozer (hasyreev) v svyazi s merzlotno-geologicheskimi usloviyami (Stages of overgrowing of flat lakes (Khasyrei) in connection with permafrost-geological conditions). Tr. Vsegingeo 1973, 62, 114–123. (In Russian) [Google Scholar]
- Moskovchenko, D.V.; Arefyev, S.P.; Glazunov, V.A.; Tigeev, A.A. Changes in vegetation and geocryological conditions of the Tazovsky peninsula (Eastern part) for the period of 1988–2016. Earth’s Cryosphere 2017, 21, 3–11. [Google Scholar] [CrossRef]
- Polishchuk, Y.M.; Kupriyanov, M.A.; Bryksina, N.A. Remote sensing study into the dynamics of lake areas in the continuous permafrost zone of Siberia. Geogr. Nat. Resour. 2017, 3, 164–170. [Google Scholar]
- Shiklomanov, A.; Lammers, R.; Lettenmaier, D.; Polischuk, Y.; Savichev, O.; Smith, L.; Chernokulsky, A. Hydrological Changes: Historical Analysis, Contemporary Status, and Future Projections; Groisman, P.Y., Ed.; Springer: Dordrecht, The Netherlands; Heidelberg, Germany; New York, NY, USA; London, UK, 2013; pp. 111–154. [Google Scholar] [CrossRef]
- Smith, L.C.; Sheng, Y.; MacDonald, G.M.; Hinzman, L.D. Disappearing Arctic lakes. Science 2005, 308, 1429. [Google Scholar] [CrossRef] [PubMed]
- Kravtsova, V.; Bystrova, A. Changes in thermokarst lake sizes in different regions of Russia for the last 30 years. Kriosf. Zemli. 2009, 13, 16–26. [Google Scholar]
- Kravtsova, V.I.; Rodionova, T.V. Investigation of the dynamics in area and number of thermokarst lakes in various regions of Russian cryolithozone, using satellite images. Earth’s Cryosphere 2016, 20, 81–89. [Google Scholar]
- Carroll, M.L.; Townshend, J.R.G.; Dimiceli, C.M.; Loboda, T.; Sohlberg, R.A. Shrinking lakes of the Arctic: Spatial relationships and trajectory of change. Geophys. Res. Lett. 2011, 38, L20406. [Google Scholar] [CrossRef]
- Lantz, T.C. Vegetation succession and environmental conditions following catastrophic lake drainage in Old Crow Flats, Yukon. Arctic 2017, 70, 177–189. [Google Scholar] [CrossRef]
- Lantz, T.C.; Turner, K.W. Changes in lake area in response to thermokarst processes and climate in Old Crow Flats, Yukon. J. Geophys. Res. Biogeosci. 2015, 120, 513–524. [Google Scholar] [CrossRef]
- Tondu, J.M.E.; Turner, K.W.; Wiklund, J.A.; Wolfe, B.B.; Hall, R.I.; McDonald, I. Limnological evolution of Zelma Lake, a recently drained thermokarst lake in Old Crow Flats (Yukon, Canada). Arct. Sci. 2017, 3, 220–236. [Google Scholar] [CrossRef]
- Jones, B.M.; Grosse, G.; Arp, C.D.; Jones, M.C.; Walter Anthony, K.M.; Romanovsky, V.E. Modern thermokarst lake dynamics in the continuous permafrost zone, northern Seward Peninsula, Alaska. J. Geophys. Res. Biogeosci. 2011, 116, G00M03. [Google Scholar] [CrossRef]
- Jones, B.M.; Arp, C.D. Observing a catastrophic Thermokarst lake drainage in Northern Alaska. Permafr. Periglac. Process. 2015, 26, 119–128. [Google Scholar] [CrossRef]
- Riordan, B.; Verbyla, D.; McGuire, A.D. Shrinking ponds in subarctic Alaska based on 1950–2002 remotely sensed images. J. Geophys. Res. Biogeosci. 2006, 111, G04002. [Google Scholar] [CrossRef]
- Nitze, I.; Cooley, S.; Duguay, C.; Jones, B.M.; Grosse, G. The catastrophic thermokarst lake drainage events of 2018 in northwestern Alaska: Fast-forward into the future. Cryosphere Discuss. 2020. in review. [Google Scholar] [CrossRef]
- Zemtsov, A.A. Lakes of the North of Western Siberia and the origin of their basins. In Questions of the Geography of Siberia; TSU: Tomsk, Russia, 1974; pp. 87–105. (In Russian) [Google Scholar]
- Loyko, S.V.; Kuzmina, D.M.; Klimova, N.V. Landscape characteristics of drained thermokarst lakes in the southern tundra of western Siberia. Nauchnyj Vestn. Yamalo-Neneckogo Avton. Okruga. Arct. Med. Biol. Ecol. Environ. Econ. 2018, 101, 13–17. (In Russian) [Google Scholar]
- Vasilevich, R.S. Major and trace element compositions of Hummocky frozen peatlands in the forest—Tundra of Northeastern European Russia. Geochem. Int. 2018, 56, 1276–1288. [Google Scholar] [CrossRef]
- Reyes, F.R.; Lougheed, V.L. Rapid nutrient release from permafrost thaw in arctic aquatic ecosystems. Arct. Antarct. Alp. Res. 2015, 47, 35–48. [Google Scholar] [CrossRef]
- Keuper, F.; van Bodegom, P.M.; Dorrepaal, E.; Weedon, J.T.; van Hal, J.; van Logtestijn, R.S.P.; Aerts, R. A frozen feast: Thawing permafrost increases plant-available nitrogen in subarctic peatlands. Glob. Chang. Biol. 2012, 18, 1998–2007. [Google Scholar] [CrossRef]
- Lara, M.J.; Lin, D.H.; Andresen, C.; Lougheed, V.L.; Tweedie, C.E. Nutrient release from permafrost thaw enhances CH4 emissions from Arctic tundra wetlands. J. Geophys. Res. Biogeosci. 2019, 124, 1560–1573. [Google Scholar] [CrossRef]
- Harms, T.K.; Cook, C.L.; Wlostowski, A.N.; Gooseff, M.N.; Godsey, S.E. Spiraling down hillslopes: Nutrient uptake from water tracks in a warming Arctic. Ecosystems 2019, 22, 1546–1560. [Google Scholar] [CrossRef]
- Harms, T.K.; Jones, J.B. Thaw depth determines reaction and transport of inorganic nitrogen in valley bottom permafrost soils. Glob. Chang. Biolog. 2012, 18, 2958–2968. [Google Scholar] [CrossRef]
- Aerts, R. The freezer defrosting: Global warming and litter decomposition rates in cold biomes. J. Ecol. 2006, 94, 713–724. [Google Scholar] [CrossRef]
- Ukraintseva, N.; Leibman, M.; Streletskaya, I.; Mikhay-lova, T. Geochemistry of plant-soil-perma-frost system on landslide-affected slopes, Yamal, Russia as an indicator of landslide age. In Landslides in Cold Regions in the Context of Climate Change, Environmental Science and Engineering; Shan, W., Guo, Y., Wang, F., Marui, H., Strom, A., Eds.; Springer International Publishing: Cham, Switzerland, 2014; pp. 107–132. [Google Scholar]
- Khitun, O.; Ermokhina, K.; Czernyadjeva, I.; Leibman, M.; Khomutov, A. Floristic complexes on landslides of different age in Central Yamal, West Siberian Low Arctic, Russia. Fennia 2015, 13952, 31–52. [Google Scholar] [CrossRef]
- Abbott, B.W.; Jones, J.B.; Godsey, S.E.; Larouche, J.R.; Bowden, W.B. Patterns and persistence of hydrologic carbon and nutrient export from collapsing upland permafrost. Biogeoscience 2015, 12, 3725–3740. [Google Scholar] [CrossRef]
- Bowden, W.B.; Gooseff, M.N.; Balser, A.; Green, A.; Peterson, B.J.; Bradford, J. Sediment and nutrient delivery from thermokarst features in the foothills of the North Slope, Alaska: Potential impacts on headwater stream ecosystems. J. Geophys. Res. Biogeosci. 2008, 113, G02026. [Google Scholar] [CrossRef]
- Wang, P.; Limpens, J.; Mommer, L.; van Ruijven, J.; Nauta, A.L.; Berendse, F.; Schaepman-Strub, G.; Blok, D.; Maximov, T.C.; Heijmans, M.M.P.D. Above- and below-ground responses of four tundra plant functional types to deep soil heating and surface soil fertilization. J. Ecol. 2017, 105, 947–957. [Google Scholar] [CrossRef]
- Kaverin, D.A.; Melnichuk, E.B.; Shiklomanov, N.I.; Kakunov, N.B.; Pastukhov, A.V.; Shiklomanov, A.N. Long-term changes in the ground thermal regime of an artificially drained thaw-lake basin in the Russian European north. Permafr. Periglac. Process. 2018, 29, 49–59. [Google Scholar] [CrossRef]
- O’Neill, H.B.; Burn, C.R. Physical and temporal factors controlling the development of near-surface ground ice at Illisarvik, Western Arctic coast, Canada. Can. J. Earth Sci. 2012, 49, 1096–1110. [Google Scholar] [CrossRef]
- Zhang, T. Influence of the seasonal snow cover on the ground thermal regime: An overview. Rev. Geophys. 2005, 43, RG4002. [Google Scholar] [CrossRef]
- Goncharova, O.Y.; Matyshak, G.V.; Epstein, H.E.; Sefilian, A.R.; Bobrik, A.A. Influence of snow cover on soil temperatures: Meso- and micro-scale topographic effects (a case study from the northern West Siberia discontinuous permafrost zone). Catena 2019, 183, 104224. [Google Scholar] [CrossRef]
- Mackay, J.R.; Burn, C.R. The first 20 years (1978–1979 to 1998–1999) of active-layer development, Illisarvik experimental drained lake site, western Arctic coast, Canada. Can. J. Earth Sci. 2002, 39, 1657–1674. [Google Scholar] [CrossRef]
- Regmi, P.; Grosse, G.; Jones, M.C.; Jones, B.M.; Anthony, K.W. Characterizing post-drainage succession in thermokarst lake basins on the Seward Peninsula, Alaska with terraSAR-X backscatter and landsat-based NDVI data. Remote Sens. 2012, 4, 3741–3765. [Google Scholar] [CrossRef]
- Billings, W.D.; Peterson, K.M. Vegetational change and ice-wedge polygons through the thaw-lake cycle in arctic Alaska. Arct. Alp. Res. 1980, 12, 413–432. [Google Scholar] [CrossRef]
- Ovenden, L. Vegetation colonizing the bed of a recently drained thermokarst lake (Illisarvik), Northwest Territories. Can. J. Bot. 1986, 64, 2688–2692. [Google Scholar] [CrossRef]
- Zona, D.; Oechel, W.C.; Peterson, K.M.; Clements, R.J.; Paw, K.T.U.; Ustin, S.L. Characterization of the carbon fluxes of a vegetated drained lake basin chronosequence on the Alaskan Arctic Coastal Plain. Glob. Chang. Biol. 2010, 16, 1870–1882. [Google Scholar] [CrossRef]
- Crate, S.; Ulrich, M.; Habeck, J.O.; Desyatkin, A.R.; Desyatkin, R.V.; Fedorov, A.N.; Hiyama, T.; Iijima, Y.; Ksenofontov, S.; Mészáros, C.; et al. Permafrost livelihoods: A transdisciplinary review and analysis of thermokarst-based systems of indigenous land use. Anthropocene 2017, 18, 89–104. [Google Scholar] [CrossRef]
- Desyatkin, A.; Takakai, F.; Nikolaeva, M. Landscape microzones within thermokarst depressions of central Yakutia under present climatic conditions. Geosciences 2018, 8, 439. [Google Scholar] [CrossRef]
- Revin, Y.V. (Ed.) Alasnye Ekosistemy: Struktura, Funkcionirovanie, Dinamika; Alas Ecosystems: Structure, Functioning, Dynamics; Nauka: Novosibirsk, Russia, 2005; 264p. (In Russian) [Google Scholar]
- Zakharova, E.A.; Kouraev, A.V.; Stephane, G.; Franck, G.; Desyatkin, R.V.; Desyatkin, A.R. Recent dynamics of hydro-ecosystems in thermokarst depressions in Central Siberia from satellite and in situ observations: Importance for agriculture and human life. Sci. Total Environ. 2018, 615, 1290–1304. [Google Scholar] [CrossRef]
- Shishkonakova, E.A.; Abramova, L.I.; Avetov, N.A.; Tolpysheva, T.Y.; Shvedchikova, N.K. Bolota kotloviny hasyreya Aj-Nadymtyjlor (prirodnyj park Numto, Hanty-Mansijskij avtonomnyj okrug—Yugra) (Bogs of the Khasyrei Ai-Nadymtylor Basin (Numto Natural Park, Khanty-Mansi Autonomous Okrug—Ugra)). Byulleten’ Mosk. Obs. Ispyt. Prir. Otd. Biol. 2013, 118, 48–56. (In Russian) [Google Scholar]
- Magomedova, M.A.; Morozova, L.M.; Ektova, S.N.; Rebristaya, O.V.; Chernyadieva, I.V.; Potemkin, A.D.; Knyazev, M.S. Yamal Peninsula: Vegetation; City Press: Tyumen, Russia, 2006; 360p. (In Russian) [Google Scholar]
- Loiko, S.V.; Pokrovsky, O.S.; Raudina, T.V.; Lim, A.; Kolesnichenko, L.G.; Shirokova, L.S.; Vorobyev, S.N.; Kirpotin, S.N. Abrupt permafrost collapse enhances organic carbon, CO2, nutrient and metal release into surface waters. Chem. Geol. 2017, 471, 153–165. [Google Scholar] [CrossRef]
- Bazilevich, N.I. Productivity of Northern Eurasia Ecosystems; Nauka: Moscow, Russia, 1993; 293p. (In Russian) [Google Scholar]
- Basillevich, N.I.; Titlyanova, A.A. Biotic Turnover on Five Continents: Element Exchange Processes in Terrestrial Natural Ecosystems; Nauka: Novosibirsk, Russia, 2008. (In Russian) [Google Scholar]
- Manasypov, R.M.; Pokrovsky, O.S.; Shirokova, L.S.; Kirpotin, S.N.; Zinner, N.S. Elemental composition of macrophytes of thermokarst lakes in Western Siberia. Bull. Tomsk Polytech. Univ. Geo Assets Eng. 2018, 329, 50–65. [Google Scholar]
- Eisner, W.R.; Peterson, K.M. Pollen, fungi and algae as age indicators of drained lake basins near Barrow, Alaska. In Proceedings of the 7th International Conference on Permafrost, Yellowknife, NT, Canada, 23–27 June 1998; Centre de Etudes Nordiques de l’Universite Laval, Collection Nordicana: Laval, QC, Canada, 1998; pp. 245–250. [Google Scholar]
- Loiko, S.; Raudina, T.; Lim, A.; Kuzmina, D.; Kulizhskiy, S.; Pokrovsky, O. Microtopography controls of carbon and related elements distribution in the west siberian frozen bogs. Geosciences 2019, 9, 291. [Google Scholar] [CrossRef]
- Wassen, M.J.; Venterink, H.O.; Lapshina, E.D.; Tanneberger, F. Endangered plants persist under phosphorus limitation. Nature 2005, 437, 547–550. [Google Scholar] [CrossRef] [PubMed]
- Jones, M.C.; Grosse, G.; Jones, B.M.; Walter Anthony, K. A lake basins in continuous, ice-rich permafrost, northern Seward Peninsula, Alaska. J. Geophys. Res. Biogeosci. 2012, 117, G00M07. [Google Scholar] [CrossRef]
- Walker, D.A.; Leibman, M.O.; Epstein, H.E.; Forbes, B.C.; Bhatt, U.S.; Raynolds, M.K.; Comiso, J.C.; Gubarkov, A.A.; Khomutov, A.V.; Jia, G.J.; et al. Spatial and temporal patterns of greenness on the Yamal Peninsula, Russia: Interactions of ecological and social factors affecting the Arctic normalized difference vegetation index. Environ. Res. Lett. 2009, 4, 045004. [Google Scholar] [CrossRef]
- Golubyatnikov, L.L.; Zarov, E.A.; Kazantsev, V.S.; Filippov, I.V.; Gavrilov, G.O. Analysis of landscape structure in the Tundra Zone for Western Siberia based on satellite data. Izv. Atmos. Ocean. Phys. 2015, 3, 969–978. [Google Scholar] [CrossRef]
- Fedorov, A.N.; Gavriliev, P.P.; Konstantinov, P.Y.; Hiyama, T.; Iijima, Y.; Iwahana, G. Estimating the water balance of a thermokarst lake in the middle of the Lena River basin, eastern Siberia. Ecohydrology 2014, 7, 188–196. [Google Scholar] [CrossRef]
- Nikolaeva, M.C.; Desyatkin, R.V. Dynamics of diversity and productivity of alas wet meadows in Central Yakutia. Rastit. Resur. 2015, 51, 70–80. [Google Scholar]
- Bysyina, M.F. Ecocoenotic elements of flora of alases (Central Yakutia). Plant Life Asian Russ. 2009, 1, 68–72. (In Russian) [Google Scholar]
- Kaverin, D.A.; Pastukhov, A.V.; Kakunov, N.B.; Kalmykov, A.V. Features of soil genesis in the basin of drained lake Opytnoe (European Northeast of Russia). Izv. Ras. Samsc. 2014, 16, 43–50. (In Russian) [Google Scholar]
- Wilson, M.A. Vegetation Succession and Environmental Relations at the Illisarvik Drained Lake Experiment, Western Arctic Coast, Canada. Master’s Thesis, Carleton University, Ottawa, ON, Canada, 2018. [Google Scholar] [CrossRef]
- Ilyina, I.S.; Lapshina, E.I.; Lavrenko, N.N.; Mel’tser, L.I.; Romanova, E.A.; Bogoyavlenskiy, B.A.; Makhno, V.D. Rastitel’nyj Pokrov Zapadno-Sibirskoj Ravniny (Vegetation Cover on West. Siberian Plain); Nauka: Novosibirsk, Russia, 1985; 250p. (In Russian) [Google Scholar]
- Serikova, S.; Pokrovsky, O.S.; Laudon, H.; Krickov, I.V.; Lim, A.G.; Manasypov, R.M.; Karlsson, J. High carbon emissions from thermokarst lakes of Western Siberia. Nat. Commun. 2019, 10, 1552. [Google Scholar] [CrossRef] [PubMed]
- IUSS Working Group WRB. World Reference Base for Soil Resources 2014. In International Soil Classification System for Naming Soils and Creating Legends for Soil Maps; World Soil Resources Reports No. 106; FAO: Rome, Italy, 2014. [Google Scholar]
- Raudina, T.V.; Loiko, S.V.; Lim, A.; Manasypov, R.M.; Shirokova, L.S.; Istigechev, G.I.; Kuzmina, D.M.; Kulizhsky, S.P.; Vorobyev, S.N.; Pokrovsky, O.S. Permafrost thaw and climate warming may decrease the CO2, carbon, and metal concentration in peat soil waters of the Western Siberia Lowland. Sci. Total Environ. 2018, 634, 1004–1023. [Google Scholar] [CrossRef] [PubMed]
- Raudina, T.V.; Loiko, S.V.; Lim, A.G.; Krickov, I.V.; Shirokova, L.S.; Istigechev, G.I.; Kuzmina, D.M.; Kulizhsky, S.P.; Vorobyev, S.N.; Pokrovsky, O.S. Dissolved organic carbon and major and trace elements in peat porewater of sporadic, discontinuous, and continuous permafrost zones of western Siberia. Biogeosciences 2017, 14, 3561–3584. [Google Scholar] [CrossRef]
- Audry, S.; Pokrovsky, O.S.; Shirokova, L.S.; Kirpotin, S.N.; Dupŕ, B. Organic matter mineralization and trace element post-depositional redistribution in Western Siberia thermokarst lake sediments. Biogeosciences 2011, 8, 3341–3358. [Google Scholar] [CrossRef]
- Hinkel, K.M.; Eisner, W.R.; Bockheim, J.G.; Nelson, F.E.; Peterson, K.M.; Dai, X. Spatial extent, age, and carbon stocks in drained thaw lake basins on the Barrow Peninsula, Alaska. Arct. Antarct. Alp. Res. 2003, 35, 291–300. [Google Scholar] [CrossRef]
- Tsatsenkin, I.A.; Savchenko, I.V.; Dmitrieva, S.I. Metodicheskie Ukazaniya po Ekologicheskoi Otsenke Kormovykh Ugodii Tundrovoi i Lesnoi Zon Sibiri i Dal’Nego Vostoka po Rastitel’Nomu Pokrovu; Vsesoyuznyy Nauchno-Issledovatel’skiy Institut Kormov: Moscow, Russia, 1978. (In Russian) [Google Scholar]
- Axmanová, I.; Chytrý, M.; Danihelka, J.; Lustyk, P.; Kočí, M.; Kubešová, S.; Horsák, M.; Cherosov, M.M.; Gogoleva, P.A. Plant species richness—Productivity relationships in a low-productive boreal region. Plant Ecol. 2013, 214, 207–219. [Google Scholar] [CrossRef]
- Peregon, A.; Maksyutov, S.; Kosykh, N.P.; Mironycheva-Tokareva, N.P. Map-based inventory of wetland biomass and net primary production in western Siberia. J. Geophys. Res. Biogeosci. 2008, 113, G01007. [Google Scholar] [CrossRef]
- Goetz, S.J.; Bunn, A.G.; Fiske, G.J.; Houghton, R.A. Satellite-observed photosynthetic trends across boreal North America associated with climate and fire disturbance. Proc. Natl. Acad. Sci. USA 2005, 102, 13521–13525. [Google Scholar] [CrossRef]
- Wang, L.; Fensholt, R. Temporal changes in coupled vegetation phenology and productivity are biome-specific in the Northern Hemisphere. Remote Sens. 2017, 9, 1277. [Google Scholar] [CrossRef]
- Jahn, R.; Blume, H.P.; Asio, V.B.; Spaargaren, O.; Schad, P. Guidelines for Soil Description; FAO: Rome, Italy, 2006. [Google Scholar]
- Vorobyova, L.A. Chemical Analysis of Soils; Publishing House Moscow State University: Moscow, Russia, 1998. (In Russian) [Google Scholar]
- Stepanova, V.A.; Pokrovsky, O.S.; Viers, J.; Mironycheva-Tokareva, N.P.; Kosykh, N.P.; Vishnyakova, E.K. Elemental composition of peat profiles in western Siberia: Effect of the micro-landscape, latitude position and permafrost coverage. Appl. Geochem. 2015, 53, 53–70. [Google Scholar] [CrossRef]
- Viers, J.; Prokushkin, A.S.; Pokrovsky, O.S.; Kirdyanov, A.V.; Zouiten, C.; Chmeleff, J.; Meheut, M.; Chabaux, F.; Oliva, P.; Dupré, B. Zn isotope fractionation in a pristine larch forest on permafrost-dominated soils in Central Siberia. Geochem. Trans. 2015, 16, 3. [Google Scholar] [CrossRef]
- De la Cruz, O.; Holmes, S. The duality diagram in data analysis: Examples of modern applications. Ann. Appl. Stat. 2011, 5, 2266–2277. [Google Scholar] [CrossRef] [PubMed]


| Successional Stages | Early | Mid | Late |
|---|---|---|---|
| NDVImax | 0.68 ± 0.03 | 0.64 ± 0.02 | 0.54 ± 0.07 |
| ANPP, g·m−2·y−1 | 1134 ± 645 | 660 ± 292 | 261 ± 77 |
| Litter/peat thickness, cm | 1.3 ± 1.7 | 6.2 ± 4.3 | 28.5 ± 10.7 |
| ALT, m | 1.53 ± 0.58 | 1.14 ± 0.71 | 0.69 ± 0.65 |
| Soil density, g·cm−3 (0–30 cm) | 1.0 ± 0.3 | 1.0 ± 0.3 | 0.1 ± 0.02 |
| pH soil water | 6.3 ± 0.7 | 6.5 ± 0.7 | 5.1 ± 0.7 |
| Sp. cond. of soil water, µS·cm−1 | 208 ± 205 | 171 ± 170 | 25 ± 5 |
| P-PO4, g·m−2 (0–30 cm) | 13.8 ± 8.4 | 13.3 ± 6.2 | 4.0 ± 2.2 |
| K labile, g·m−2 (0–30 cm) | 20.8 ± 10.1 | 35.8 ± 18.2 | 9.6 ± 7.2 |
| N min (0–30 cm) | 2.5 ± 1.8 | 7.4 ± 5.5 | 5.4 ± 1.6 |
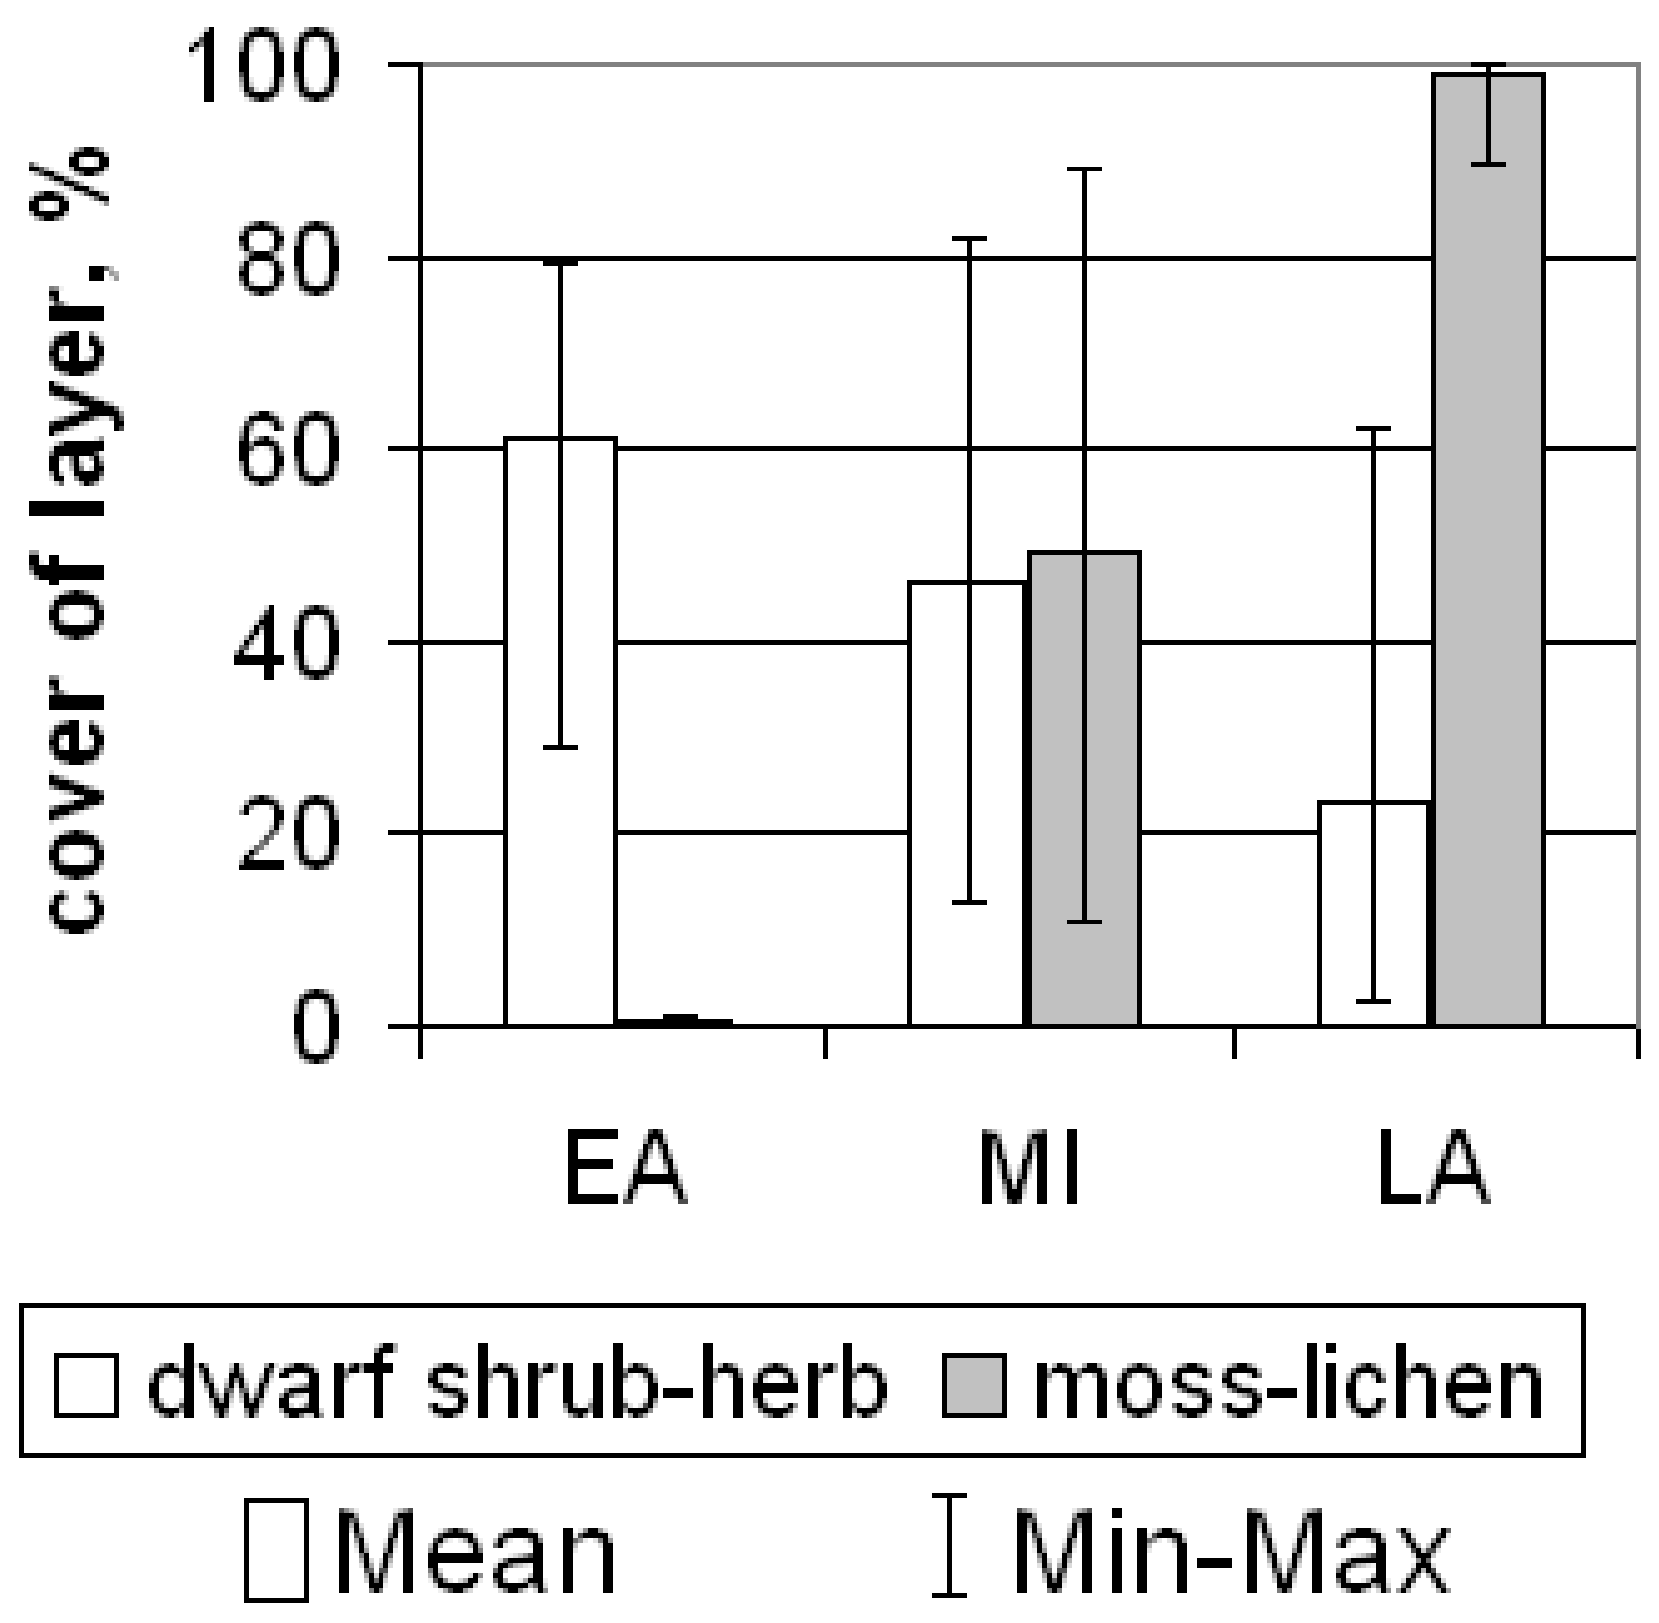
| Cover of herbs, % | 61.1 ± 18.0 | 46.2 ± 22.4 | 5.0 ± 5.0 |
| Cover of mosses, % | 0.7 ± 0.6 | 50.8 ± 26.0 | 99.0 ± 2.3 |
© 2020 by the authors. Licensee MDPI, Basel, Switzerland. This article is an open access article distributed under the terms and conditions of the Creative Commons Attribution (CC BY) license (http://creativecommons.org/licenses/by/4.0/).
Share and Cite
Loiko, S.; Klimova, N.; Kuzmina, D.; Pokrovsky, O. Lake Drainage in Permafrost Regions Produces Variable Plant Communities of High Biomass and Productivity. Plants 2020, 9, 867. https://doi.org/10.3390/plants9070867
Loiko S, Klimova N, Kuzmina D, Pokrovsky O. Lake Drainage in Permafrost Regions Produces Variable Plant Communities of High Biomass and Productivity. Plants. 2020; 9(7):867. https://doi.org/10.3390/plants9070867
Chicago/Turabian StyleLoiko, Sergey, Nina Klimova, Darya Kuzmina, and Oleg Pokrovsky. 2020. "Lake Drainage in Permafrost Regions Produces Variable Plant Communities of High Biomass and Productivity" Plants 9, no. 7: 867. https://doi.org/10.3390/plants9070867
APA StyleLoiko, S., Klimova, N., Kuzmina, D., & Pokrovsky, O. (2020). Lake Drainage in Permafrost Regions Produces Variable Plant Communities of High Biomass and Productivity. Plants, 9(7), 867. https://doi.org/10.3390/plants9070867