Article

Genome-Wide Identification, Expression Analysis and Functional Study of CCT Gene Family in Medicago truncatula

1
Institute of Animal Science, Chinese Academy of Agricultural Sciences, Beijing 100193, China
2
Key Laboratory of Plant Resources and Beijing Botanical Garden, Institute of Botany, the Chinese Academy of Sciences, Beijing 100093, China
3
Department of Grassland Science, China Agriculture University, Beijing 100193, China
*
Author to whom correspondence should be addressed.
These authors contributed equally to this work.
Plants 2020, 9(4), 513; https://doi.org/10.3390/plants9040513
Submission received: 12 March 2020 / Revised: 23 March 2020 / Accepted: 24 March 2020 / Published: 16 April 2020

Abstract

:
The control of flowering time has an important impact on biomass and the environmental adaption of legumes. The CCT (CO, COL and TOC1) gene family was elucidated to participate in the molecular regulation of flowering in plants. We identified 36 CCT genes in the M. truncatula genome and they were classified into three distinct subfamilies, PRR (7), COL (11) and CMF (18). Synteny and phylogenetic analyses revealed that CCT genes occurred before the differentiation of monocot and dicot, and CCT orthologous genes might have diversified among plants. The diverse spatial-temporal expression profiles indicated that MtCCT genes could be key regulators in flowering time, as well as in the development of seeds and nodules in M. truncatula. Notably, 22 MtCCT genes with typical circadian rhythmic variations suggested their different responses to light. The response to various hormones of MtCCT genes demonstrated that they participate in plant growth and development via varied hormones dependent pathways. Moreover, six MtCCT genes were dramatically induced by salinity and dehydration treatments, illustrating their vital roles in the prevention of abiotic injury. Collectively, our study provides valuable information for the in-depth investigation of the molecular mechanism of flowering time in M. truncatula, and it also provides candidate genes for alfalfa molecular breeding with ideal flowering time.

1. Introduction

Flowering time is a crucial trait that determines plant regional adaptability to diverse environmental conditions, as well as the grain yield of cereal crops [1,2]. In legume forage crops, flowering time also serves as an indicator for harvesting, as famers often cut legumes at the early bloom stage. It is important to elucidate flowering time-related genes and their regulation mechanism in alfalfa and other legumes. Flowering time is affected by numerous environmental and endogenous signals, via intricate molecular pathways [3]. The molecular mechanism underlying flowering time has been extensively studied in model plants, and genes regulate the transition from vegetative to reproductive growth, mainly through photoperiod, vernalization, autonomous and gibberellin pathways [1]. Among them, CCT family members widely participate in the regulation of flowering time through photoperiod and vernalization pathways, and they also play vital roles in plant growth and development [4,5,6].
The CCT genes contain a CCT domain that originally corresponded to a 43-amino-acid sequence in the carboxy-terminus of three proteins in Arabidopsis thaliana, namely CO (CONSTANS), COL (CO-LIKE), and TOC1 (TIMING OF CAB1) [7,8,9]. The CCT gene family can be classified into three sub-families, COL (CONSTANS-Like), CMF (CCT Motif Family) and PRR (Pseudo Response Regulator), according to their conserved domains [10]. COL proteins contain one or two BBOX domains and a CCT domain. CMF proteins contain only one CCT domain. PRR proteins share a response regulator (REC) domain, along with a CCT domain [11]. A phylogenetic analysis of CMF, COL and PRR proteins in Poaceae suggests that they evolved prior to the monocot/dicot divergence approximately 200 mya, and continuous COL genes’ evolution led to BBOX domains degradation, in which BBOX domains are reduced from two to one, and then to none [10].
Nowadays, CCT genes of the three sub-families are extensively studied in various plant species, including Arabidopsis, rice (Oryza sativa), maize (Zea mays) and wheat (Triticum aestivum) [7,11,12,13]. CO (CONSTANS), a COL sub-family gene, was the first cloned CCT gene controlling flowering time in Arabidopsis [7]. Under the long-day (LD) condition, GI (GIGANTEA) regulates circadian rhythms and CO expression; CO protein directly binds to the promoter of FT (Flower Time) to up-regulate its transcription. The latter moves from leaves to apical meristem, and induces a switch from vegetative to reproductive growth [9,14]. Hd1, the homolog of CO in rice, has a dual function in regulating flowering, as it activates Hd3a (Heading date 3a) expression, to promote heading under short day (SD) condition, but inhibits heading under the LD condition [15,16]. Another COL gene in rice, DTH2, promotes heading by inducing Hd3a and RTF1 (Rice Flowering Locus T1) under LD condition [17]. Vernalization is indispensable for winter wheat. A COL gene in wheat, VRN2 (VERNALIZATION 1) suppresses the expression of VRN3 before vernalization, which activates the transcription of VRN1, the positive regulator of heading. Meanwhile, VRN2 is suppressed by VRN1 during vernalization, indicating that VRN2 is a key switch for inflorescence development and heading [13,18]. Except for flowering time, the COL genes showed diverse functions in different plants. For instance, COL4 is involved in salt stress response through the abscisic acid-dependent signaling pathway in Arabidopsis [19]. OsGhd2 not only controls grain number, heading date and plant height, but also confers drought tolerance, by accelerating drought-induced premature senescence [20].
The second CMF sub-family genes exhibited multiplex bio-functions, which is similar to COLs. In maize, ZmCCT is correlated with photoperiod sensitivity and its allele from teosinte and tropical maize is consistently expressed at a higher level in temperate maize and confers later flowering under the LD condition [21]. Moreover, ZmCCT was reported to have influence on maize stalk rot resistance and tassel architecture, including tassel length, branch length and branch number [22,23]. Ghd7 (Grain number, plant height, and heading date 7), a CMF gene in rice, represses Edh1 (Early heading date 1) and Hd3a expression, thus delays heading under LD condition, but not SD condition [24]. Furthermore, Ghd7 controls shoot branching by regulating OsTB1 (Teosinte Branched 1) and OsPHYB (PHYTOCHROME B), and it also participates in multiple processes, including hormone metabolism and abiotic stress tolerance [25].
Differing from COL and CMF genes, the PRR sub-family genes are functionally conserved, in regulating photoperiodic flowering response through clock function. AtPRR1, also called TOC1, together with CCA1 (CIRCADIAN CLOCK ASSOCIATED 1) and LHY (LATE ELONGATED HYPOCOTYL), comprise a feedback loop of circadian clock. In this feedback loop, CCA1 and LHY proteins inhibit PRR1 expression around dawn, and PRR1 activate CCA1 and LHY expression at night [26,27]. OsPRR37 (also known as DTH7 or Ghd7.1) suppresses the expression of downstream genes Ehd1 and Hd3a, resulting in delayed flowering under the LD condition [28]. The deletions in the promoter of TaPpd-H1 results in up-regulated expression, and alleles with these deletions are associated with photoperiod insensitivity and early heading [29,30].
Alfalfa (Medicago sativa L.) is regarded as the most important legume forage crop, which plays a vital role in livestock production [31]. An estimated 32 million ha of alfalfa were grown annually worldwide, and the global hay market in 2017 was 8.3 million metric tons (NAFA, 2016 and ITC, 2018). Floral transition is a key developmental switch that determines the production of dry matter in alfalfa; delayed flowering is a desirable trait to minimize damages from abiotic stresses and to enhance biomass yield via lengthening vegetative growth. On the other hand, genotypes with early flowering in spring are valuable to fill the seasonal forage gap, that exists due to winter dormancy [32,33]. Therefore, controlling flowering time is crucial for the reproductive success of alfalfa, and it has great impacts on regional adaptation, as well as biomass production. However, a systematic analysis on identification, classification, function and manipulation of genes controlling flowering time is still lacking in alfalfa.
Compared with alfalfa that is an autotetraploid, allogamous and heterozygous species, Medicago truncatula, with the small and known genome information, is closely related to alfalfa. Genes from M. truncatula share high sequence identity to their counterparts from alfalfa [34,35]. Thus, it makes M. truncatula a model forage species for genetic studies. In the present study, we systematically analyzed the CCT gene family in M. truncatula, including their chromosomal distribution, gene structure, temporal and spatial expression profiles, response to rhythm, hormones and abiotic stresses. The results presented here would provide valuable information for the construction of a flowering regulatory network, as well as utilization of the CCT gene family, in both M. truncatula and alfalfa.

2. Results

2.1. Identification of CCT Genes in M. truncatula Genome

We used the HMM file corresponding to the CCT domain (PF06203) as a query to search the M. truncatula protein database, and retrieved a total of 51 putative CCT protein sequences with default parameters. The existence of the conserved CCT domain was confirmed by SMART, and redundant sequences were removed. Finally, 36 MtCCT protein sequences were identified and the corresponding genes were designated as MtCCT1 to MtCCT36, based on their chromosome locations retrieved from the Ensemble Plants Database (Table 1). Sequence analyses revealed that these MtCCT proteins varied greatly in length, from 121 to 796 aa. The protein molecular weight of these MtCCT proteins ranged from 13.59 KD (MtCCT17) to 87.25 KD (MtCCT18), and the values of their isoelectric points ranged from 4.47 (MtCCT5 and MtCCT14) to 9.86 (MtCCT17) (Table 1).

2.2. Analyses of Gene Structure, Conserved Domain and Phylogenetic Relationship of MtCCT Genes

The corresponding CDS and genomic sequences of 36 MtCCT genes were analyzed by using the GSDA software. The exon and intron structures of the 36 MtCCT genes were shown in Figure 1, illustrating that MtCCT genes varied considerably in sequence length and structure. Concretely, MtCCT17 gene has the shortest sequence with a length of 1019 bp, and MtCCT1 gene has the longest sequence, with a length of 10,019 bp. In particular, seven genes (MtCCT2, MtCCT6, MtCCT16, MtCCT23, MtCCT24, MtCCT29 and MtCCT36) showed a similar and relatively simple gene structure with only one intron, while MtCCT21 has 10 introns. The remaining MtCCT genes contain 2 to 9 introns (Figure 1).
Multiple sequence alignment showed that all of the 36 MtCCT proteins contain a conserved CCT domain, 11 MtCCT proteins contain a conserved BBOX domain, and 7 MtCCT proteins contain a conserved REC domain (Figure 1 and Figure S1). The motifs of these three conserved domains were identified by using MEME software. It also demonstrated that CCT domain was more conserved than BBOX domain and REC domain in M. truncatula (Figure S2).
Based on the multiple sequence alignment of MtCCT proteins, we further preformed the phylogenetic analysis of MtCCT genes. The results showed that MtCCT genes could be grouped into three distinct sub-clusters. The first sub-cluster included 7 MtCCT genes, which belong to the PRR subfamily, and they all contain both CCT and REC domains. The second sub-cluster included 11 MtCCT genes, which belong to the COL subfamily, and they contain both CCT and BBOX domains. The third sub-cluster included 18 MtCCT genes, which belong to the CMF subfamily, and they contain only the CCT domain (Figure 1). It was obvious that the phylogenetic clustering of the MtCCT gene is consistent with the distribution of their conserved domain.

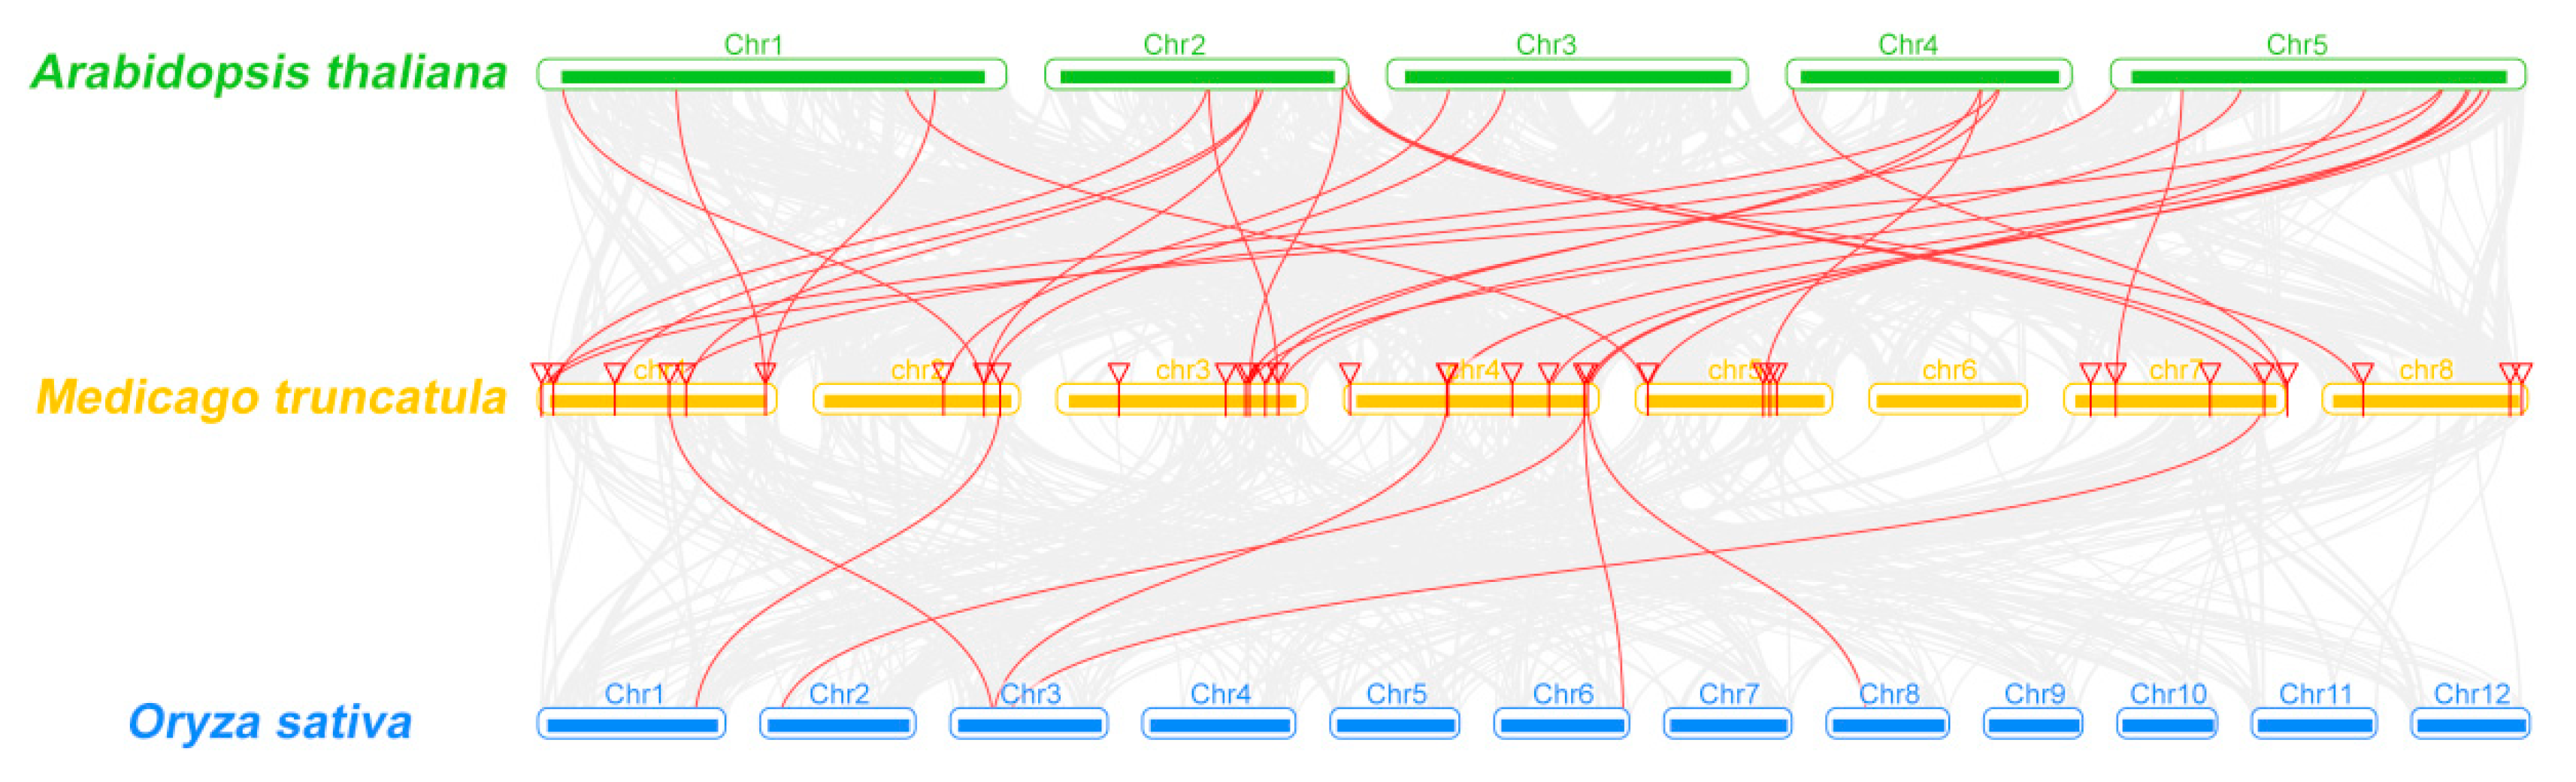
2.3. Analyses of Chromosomal Distribution and Synteny of MtCCT Genes

A map of the chromosomal distributions of MtCCT genes constructed based on their physical position information illustrated that they were unevenly distributed on seven chromosomes (Chr1, 2, 3, 4, 5, 7 and 8) (Figure S3). Among them, eight MtCCT genes localize on Chr 4 (22.2%), seven on Chr 3 (19.4%), six on Chr 1 (16.7%), five on Chr 7 (13.8%), four on Chr 5 (11.1%), three on Chr 2 (8.3%), and three on Chr 8 (8.3%). Additionally, the analysis on the duplication events of the MtCCT genes showed that one MtCCT gene pair (MtCCT19/20) located on Chr 4 could be identified as tandem duplication. Interestingly, the sequences of MtCCT19 and MtCCT20 were completely identical.
Moreover, we carried out comparative syntenic analysis on MtCCT genes with another two representative species, A. thaliana (dicot) and O. sativa (monocot) (Figure 2). A total of 22 MtCCT genes showed syntenic relationship with those in Arabidopsis, and 28 corresponding orthologs were identified in A. thaliana. Meanwhile, only seven MtCCT genes showed syntenic relationships with those in O. sativa, and seven corresponding orthologs were identified in O. sativa (Table S1). Among these orthologous pairs, six MtCCT genes (MtCCT5, MtCCT19/20, MtCCT23, MtCCT24 and MtCCT32) had their corresponding orthologs both in A. thaliana and O. sativa, suggesting their potentially critical roles in plant growth and development.

2.4. Phylogenetic Analysis of CCT Proteins in Plants

To evaluate the evolutionary relationship of the CCT proteins from representative plant species, we conducted a phylogenetic three based on 101 full-length CCT protein sequences, including 36 from M. truncatula, 25 from Arabidopsis, and 40 from rice (Figure 3). The results showed that 101 CCT proteins were clustered into three sub-clusters with 15 groups (from A to O). Among them, group A contained 17 CCT proteins from all three species, and it belonged to the PRR sub-family. Another 10 groups (F, G, H, I, J, K, L, M, N and O) contained 40 CCT proteins from all three species, and they belonged to the CMF subfamily. Three groups (C, D and E) containing 32 CCT proteins from three species belonged to the COL subfamily, except one AtCCT (AT5G48250) and three OsCCTs (Os02g0110100, Os02g0610500 and Os04g0497700). Interestingly, group B, consisting of 12 CCT proteins from three species, belonged to the COL and CMF subfamilies, respectively. The former contained five CCT proteins from M. truncatula and rice, and the latter included seven CCT proteins from all three species (Figure 3). These results indicated that CCT proteins occurred before the divergence of monocot/dicot, and that orthologous proteins might have diversified afterwards among plant species. Moreover, group B, C and E, containing both COL and CMF subfamily members, suggested that CMF subfamily members might be evolved from the COL subfamily, due to the degradation of one or two BBOX domains.

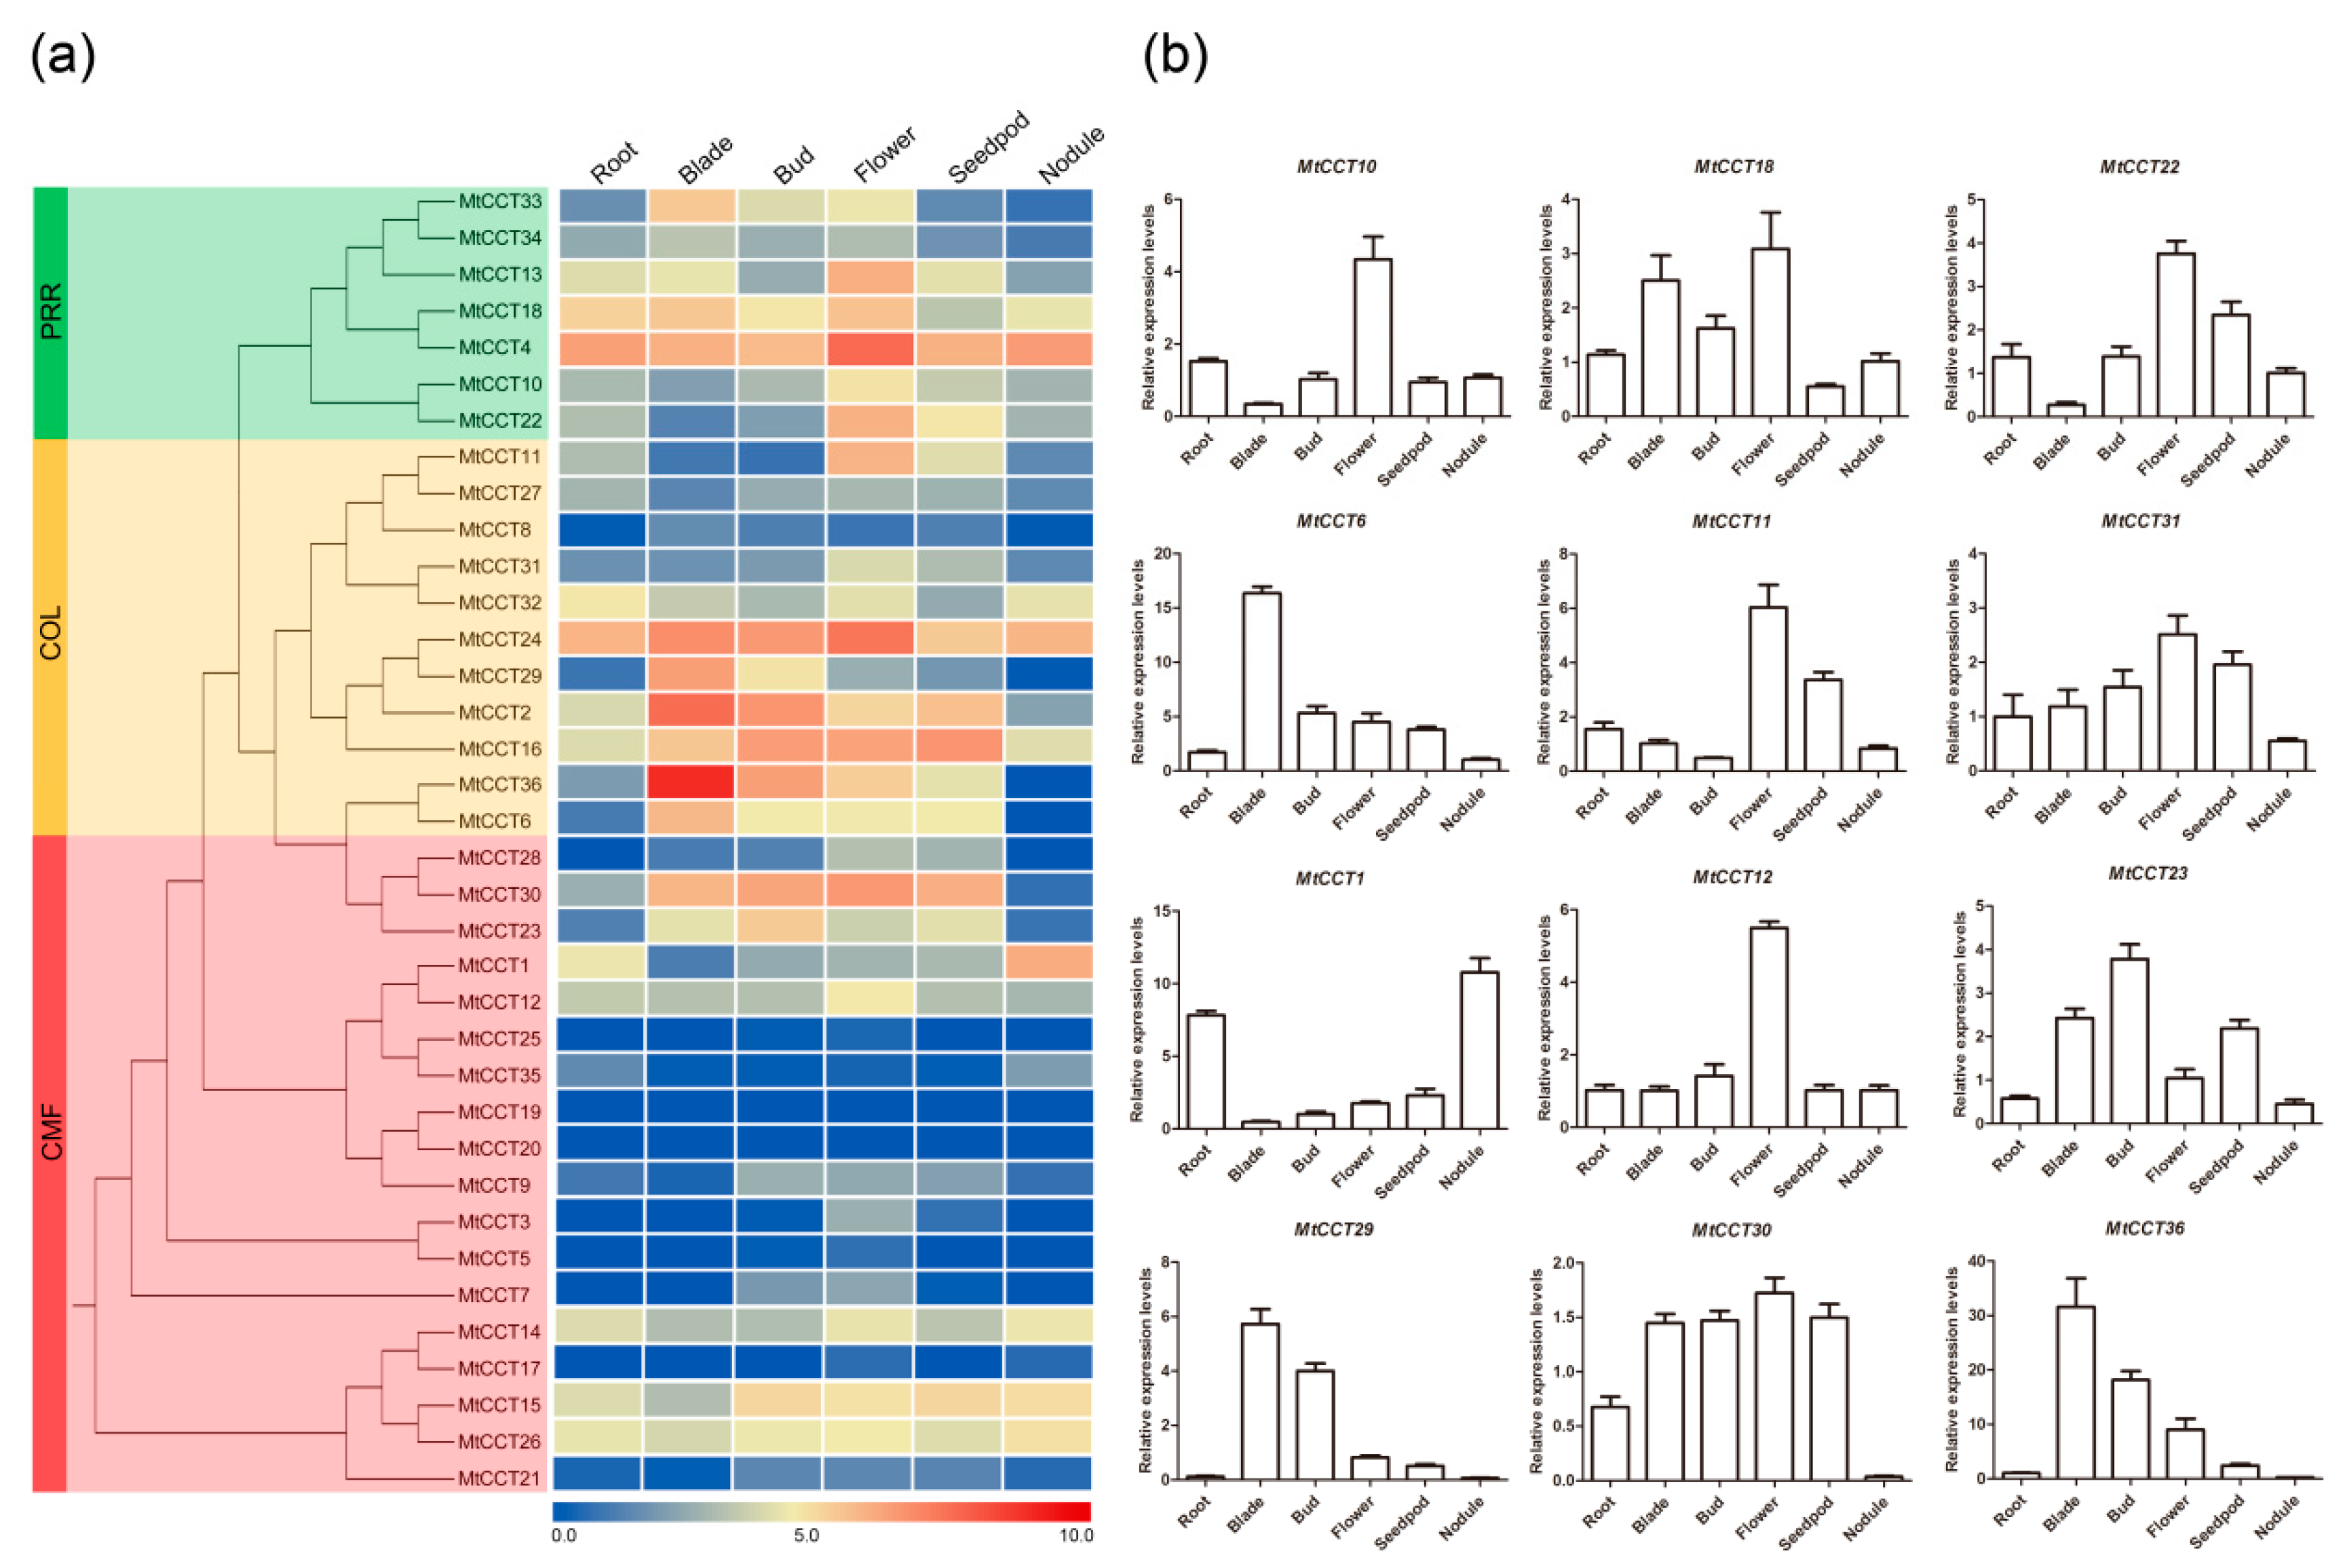
2.5. Temporal and Spatial Expression Profiling of MtCCT Genes

Gene expression patterns provide important clues on gene function. To illustrate the role of MtCCT genes during M. truncatula growth and development, the electronic expression data in six tissues (i.e., root, blade, bud, flower, seedpod and nodule) were retrieved from a public available RNA-sequencing database (Table S2). Amazing HeatMap software was used to generate the heatmap. The results showed that the MtCCT genes had various transcript levels in six tissues. Among them, MtCCT4, MtCCT14, MtCCT15, MtCCT24 and MtCCT26 were highly and consistently expressed in six tissues; whereas, MtCCT5, MtCCT8, MtCCT17, MtCCT21, MtCCT25 and MtCCT35 were expressed at relatively low level in six tissues (Figure 4a). On the other hand, several genes were highly expressed in specific tissues, for instance, MtCCT1 in root and nodule, MtCCT10, MtCCT11, MtCCT12, and MtCCT31 in flower, MtCCT29 in blade and bud, and MtCCT22 in flower and seedpod. In addition, other genes were expressed at low level in specific tissues, for instance, MtCCT6, MtCCT23, MtCCT30 and MtCCT36 in root and nodule, and MtCCT18 in seedpod (Figure 4a).
The expression levels of the above-mentioned twelve MtCCT genes were further confirmed through qRT-PCR in the same tissues (Figure 4b). It showed that the expression level of these twelve MtCCT genes were consistent with those in Figure 4a,b. These data together indicated that these twelve MtCCT genes participate in the growth and development in specific tissues in M. truncatula, functioning alone or in combination.
Additionally, we also analyzed the expression levels of 16 MtCCT genes with available microarray data, during seed and nodule development in M. truncatula (Table S2). The expression levels of MtCCT6, MtCCT12 and MtCCT36 gradually decreased with seed maturity, suggesting that these genes played critical roles in cell division or proliferation in seed development. Meanwhile, the expression levels of MtCCT32, MtCCT33 and MtCCT11 gradually increased with seed maturity, suggesting they may be involved in the accumulation of dry matter during seed development (Figure S4). During nodule formation, the expression levels of three MtCCT genes (MtCCT26, MtCCT1 and MtCCT15) were up-regulated, whereas one (MtCCT16) was down-regulated. It also showed that the expression levels of five genes (MtCCT11, MtCCT13, MtCCT22, MtCCT32 and MtCCT33) increased at the early nodulation stage, and then decreased sharply during the later nodulation stage (Figure S4). These results together indicated that they might be involved in nitrogen fixation during the nodule development in M. truncatula.

2.6. Expression Patterns of MtCCT Genes under Light Circle

It has become clear that plants are richly rhythmic, and many aspects of plant biology, including photoperiodic flower induction, petal movement, floral fragrance emission and resistance to abiotic stress, exhibit circadian rhythmicity [36]. We thus investigated the expression patterns of MtCCT genes under light circle. It showed that 22 out of 36 MtCCT genes (i.e., MtCCT1, MtCCT2, MtCCT3, MtCCT4, MtCCT5, MtCCT6, MtCCT10, MtCCT11, MtCCT12, MtCCT13, MtCCT18, MtCCT19/20, MtCCT22, MtCCT24, MtCCT27, MtCCT28, MtCCT29, MtCCT31, MtCCT32, MtCCT33, and MtCCT34) displayed an obvious circadian rhythm over 24 h, suggesting that these genes could respond to light changes, during their regulation on plant growth and development (Figure 5). Consistent with their circadian expression pattern, 18 of these genes contained 1-4 light responsive cis-element (YTCANTYY) in their promoter regions, except MtCCT24, MtCCT27 and MtCCT29 (Figure S5).
Among the 22 MtCCT genes’ response to circadian rhythm, 10 of them (MtCCT2, MtCCT3, MtCCT5, MtCCT6, MtCCT19/20, MtCCT24, MtCCT29, MtCCT33, and MtCCT34) were mainly expressed during daytime and inhibited in dark, and their expression levels peaked at midday (Figure 5). Meanwhile, seven of them (MtCCT1, MtCCT10, MtCCT11, MtCCT22, MtCCT27, MtCCT28 and MtCCT31) were mainly expressed in dark and inhibited by light, and their expression levels peaked at midnight (Figure 5). Moreover, MtCCT4, MtCCT13 and MtCCT32 expressed according to the light and peaked around evening, while MtCCT12 and MtCCT18 expressed according to the dark and peaked around dawn. These results demonstrated that these MtCCT genes with various circadian rhythm patterns participate in multiple bio-functions through different pathways in M. truncatula.

2.7. Expression Patterns of MtCCT Genes in Response to Hormones

Previous studies have demonstrated that CCT genes are key regulators of flowering time in cereals (Li and Xu, 2017). Temporal and spatial expression profiles suggested that MtCCT genes function in plant growth and development, including seed and nodule development (Figure 4 and Figure S4). We therefore inferred that MtCCT genes regulate these bio-processes through plant hormones. Meanwhile, several cis-elements related to phytohormones were identified within the promoter regions of MtCCT genes, including ABA response element (ABRE) motif, auxin response element (AuxRE) motif, auxin response factors (ARF) motif, ethylene response element (ERE) motif, gibberellin acid response element (GARE and TATC) motifs (Figure S5).
We further investigated the expression profiles of MtCCT genes in response to different hormone treatments by using qRT-PCR (Table S2). It showed that 15, 14, 10 and 9 MtCCT genes were not responsive to IAA, GA, SA or ABA treatment, but the expression levels of other genes distinctly responded to these hormones, with two fold as threshold (Figure 6). In total, 16 and 5 MtCCT genes were respectively up-regulated and down-regulated under IAA treatment (Figure 6a), 16 and 6 under GA treatment (Figure 6b), 19 and 7 under SA treatment (Figure 6c), and 19 and 8 under ABA treatment (Figure 6d). It was obvious that MtCCT genes responded differently to specific hormones.
Additionally, the up-regulated and down-regulated MtCCT genes’ response to hormones showed distinct expression patterns, and the typical MtCCT genes were selected for further illustration (Figure 6). For instance, the expression levels of MtCCT24, MtCCT22 and MtCCT8 were persistently increased under the treatment of IAA, GA and ABA, respectively. Meanwhile, the expression levels of MtCCT24 and MtCCT30 were persistently decreased in response to GA and ABA. The peak expression levels of MtCCT genes were different in response to four hormones; MtCCT13, MtCCT34 and MtCCT18 peaked at 3 h in response to IAA, GA and SA; MtCCT31 and MtCCT1 peaked at 24 h in response to IAA and SA; MtCCT4, MtCCT13 and MtCCT22 showed oscillating expression patterns in response to IAA, GA and SA, as well as MtCCT 13 in response to ABA (Figure 6).
Notably, several genes were dramatically up-regulated under different hormone treatments (Figure 6). The expression level of MtCCT24 increased more than 1000 times under the treatment of IAA; the expression level of MtCCT25 was induced by 30 times in response to GA; likewise, the expression levels of MtCCT13 and MtCCT31 increased more than 30 times under the treatment of ABA (Table S2). Our results provided a clear guide for the functional characterization of these MtCCT genes.

2.8. Expression of MtCCT Genes Which Responded to Abiotic Stresses

Abiotic stress always induces gene expression to protect plant cell from injury. To decipher the roles of MtCCT genes in response to abiotic stress, we analyzed the expression profiles of 36 MtCCT genes upon NaCl and PEG treatment, to simulate salinity and acute dehydration condition. The results showed that 23 and 22 MtCCT genes were up-regulated by NaCl or PEG treatment, respectively, and, 4 and 5 MtCCT genes were down-regulated (Figure 7, Table S2). The up-regulated and down-regulated MtCCT genes responded to abiotic stress with distinct expression patterns, suggesting their variable sensitivity to NaCl and PEG treatment (Figure 7). In brief, MtCCT11 and MtCCT22 expression continually increased in response to NaCl and PEG, respectively. The expression of MtCCT18 peaked at 3 h simultaneously under the treatment of NaCl and PEG; whereas, MtCCT13 and MtCCT22 peaked at 24 h. MtCCT30 and MtCCT11 showed an oscillating expression pattern in response to NaCl and PEG (Figure 7a,b). Additionally, the expression levels of MtCCT25, MtCCT31 and MtCCT33 dramatically increased by more than 25 times under NaCl treatment (Figure 7a), and the expression levels of MtCCT11 and MtCCT22 were induced 30 times under PEG treatment (Figure 7b).
Abscisic acid (ABA) plays critical roles in plant abiotic stress tolerance; the expression of MtCCT genes induced by salinity or dehydration could also be induced by ABA. Therefore, we also investigated the expression levels of salt and dehydration-responsive genes under ABA treatment. It showed that 10 genes (MtCCT11, MtCCT13, MtCCT14, MtCCT17, MtCCT18, MtCCT22, MtCCT25, MtCCT31, MtCCT33 and MtCCT34) were simultaneously up-regulated under NaCl, PEG and ABA treatments, while three genes (MtCCT19/20 and MtCCT36) were simultaneously down-regulated under three treatments (Figure 8). Moreover, six (MtCCT1, MtCCT6, MtCCT16, MtCCT28, MtCCT32 and MtCCT35), four (MtCCT15, MtCCT16, MtCCT26 and MtCCT27) and three (MtCCT8, MtCCT21 and MtCCT29) genes could be induced by the combinations of NaCl/ABA, NaCl/PEG, PEG/ABA, respectively (Figure 8a), whereas, two (MtCCT23 and MtCCT30) and one (MtCCT9) genes were down-regulated by the combinations of NaCl/ABA, PEG/ABA, respectively (Figure 8b). Among the genes that were up-regulated, three (MtCCT5, MtCCT9 and MtCCT12) and five (MtCCT2, MtCCT3, MtCCT23, MtCCT24 and MtCCT30) genes were only induced by NaCl and PEG, respectively; while two (MtCCT5 and MtCCT9) and two (MtCCT15 and MtCCT26) genes were only down-regulated by PEG and ABA (Figure 8, Table S2). This result suggests that these MtCCT genes might play vital roles in the protection of plants from abiotic injury, and they may participate in the regulation of abiotic stresses in the ABA-dependent or ABA-independent manner in M. truncatula.

3. Discussion

Flowering time is one of the most important agronomic traits for crops. Optimal flowering time is indispensable to maximize crop yield and adaptation in production. Early flowering may be a desirable trait for cereal crops whose seeds are the harvested product, but late flowering could be advantageous when total biomass is the objective production, as is the case for forage crops. It is important to elucidate flowering time related genes and their regulation mechanism in alfalfa and other legumes. The CCT domain-containing genes (CCT genes) are the major genetic determinants that regulate the flowering time in plants [5]. The completion of the M. truncatula genome sequencing made it possible to investigate CCT genes and their potential functions involved in flowering time, which could be applied in alfalfa molecular breeding.
In the present study, a total of 36 MtCCT genes distributed across seven chromosomes were identified in M. truncatula (Table 1). An analysis on their conserved motifs revealed that they could be classified into three subfamilies, with seven MtCCT genes belonging to the PRR subfamily, and 11 MtCCT genes to the COL subfamily (Figure 1). An analysis on gene structure suggested that MtCCT genes varied considerably in sequence length and structure (Figure 1). A phylogenetic analysis of all CCT proteins from M. truncatula, Arabidopsis and rice showed that they were clustered into three subfamilies or 15 distinct groups (Figure 3), indicating CCT genes occurred before the differentiation of monocot and dicot. Additionally, members of the CMF subfamily were not as conserved as members of the PRR or COL subfamilies, suggesting that members of the CMF subfamily might function in a species-specific manner. Nevertheless, members of the PRR and COL subfamily might have similar biological functions in plants. For instance, CO (AT5G15840) and Hd1 (Os6g0275000) in group C, belonging to the COL subfamily, are involved in the regulation of flowering time in Arabidopsis and rice, respectively [7,15]. Thus, their corresponding homologs MtCCT29 may have a similar function and be associated with flowering time in M. truncatula. However, CO promoted flowering under LD condition in Arabidopsis, whereas Hd1 has a dual function in regulating flowering, which promotes flowering under SD condition, but inhibiting the heading under LD condition [7,15]. The regulation mechanism in flowering time differed greatly between Hd1 in rice and CO in Arabidopsis, suggesting that the specific function of different members in the same group varied greatly among plant species. Therefore, apart from referencing the orthologous genes, the identification and characterization of the individual MtCCT gene are also essential for the in-depth investigation of plant functional genomics.
In this study, we found that chromosome 4 contained the most MtCCT genes, with eight members on this chromosome. Interestingly, the sequences of MtCCT19 and MtCCT20 were completely identical, and MtCCT18 was present at 200 kbp upstream MtCCT19 and MtCCT20 on chromosome 4 (Figure S3). These three genes formed a gene cluster, and this cluster may be involved in regulating the flowering time in M. truncatula. In many plant species, a gene cluster was often found in modulating an important trait. For an example, a gene cluster of three genes encoding lectin receptor kinases confers brown planthopper resistance in rice [37]. In another study, five genes AtGRXS3/4/5/7/8 were arranged in a tandem array, as a gene cluster on Arabidopsis chromosome 4, and these five genes shared virtually identical regulatory patterns, collectively acting to modulate primary root growth in response to soil nitrate [38]. Therefore, the gene cluster of MtCCT18, MtCCT19 and MtCCT20 are potential key players in the flowering time in M. truncatula, which is worth further investigation.
Genes specifically expressed in certain organs are critical for corresponding organogenesis in M. truncatula. For instance, MtSWEET11, a nodule-specific sucrose transporter isolated from the M. truncatula root nodule, has been reported to be involved in sucrose distribution within the nodule [39]. A demethylase gene, DEMETER (DME), is spatially regulated within the nodule of M. truncatula. Another previous report showed that DME in M. truncatula is essential for nodule development and it regulates the expression of 1425 genes, thereby leading to the transcriptional activation of nodule differentiation genes [40]. In this study, we identified genes that displayed highly transcript levels in specific tissues, e.g., MtCCT1 in root and nodule, MtCCT10, MtCCT11, MtCCT12, and MtCCT31 in flower, MtCCT29 in blade and bud, and MtCCT22 in flower and seedpod. Meanwhile, some genes were expressed at low level in specific tissues, e.g., MtCCT6, MtCCT23, MtCCT30 and MtCCT36 in root and nodule, and MtCCT18 in seedpod (Figure 4). These expression profiles will contribute to the functional clarification of the above MtCCT genes.
It was reported that CCT genes regulate flowering in two main pathways: circadian clock-controlled flowering and photoperiod-regulated flowering [5,12]. Studies on the gene expression of CCT genes in the circadian clock pathway in Arabidopsis are relatively more advanced. The PRR5, PRR7 and PRR9 of the CCT genes in Arabidopsis are expressed at different time points of the day and they are collectively essential to proper timekeeping [41]. Furthermore, the expressions of several CCT genes in Aegilops tauschii showed obvious circadian rhythmic expression patterns within 24 h [42]. Additionally, ZmCOL3 is a CCT gene that represses flowering in maize by interfering with the circadian clock and activating the expression of another CCT genes ZmCCT [12]. In our study, we found that the expression of 22 MtCCT genes is responsive to circadian rhythm, and most of these genes contained 1-4 light responsive cis-elements in their promoter regions (Figure 5 and Figure S5). However, the circadian rhythm patterns of these MtCCT genes varied, and the detailed regulatory mechanism of each MtCCT gene in flowering and other bio-functions should be further studied.
The growth and development processes of plants are closely associated with phytohormones. The phytohormone GA is known to play an important role in regulating the timing of floral transition. GA induces early flowering under short-day light conditions by regulating the floral meristem-identity gene LEAFY and the flowering-time gene SUPPRESSOR OF OVEREXPRESSION OF CO 1 (SOC1) [43,44]. IAA may be involved in the regulating of flowering time under SD conditions in a GA-dependent manner, but the exact mechanism remains unclear [45]. Furthermore, ABA affects flowering through two independent regulatory networks: the activation of GI and CO functions upstream of the florigen and the down-regulation of SOC1 signaling [46]. The expression profiling of MtCCT genes in response to hormones demonstrated that most MtCCT genes were regulated by multiple hormones with distinct sensitivity (Figure 6). Notably, several genes (MtCCT24, MtCCT25, MtCCT13 and MtCCT31) were dramatically up-regulated under hormone treatment. These results suggest that the function of MtCCT genes have considerably differentiated and the hormone regulatory pathways involved have diversified. It will be worth further investigation on how MtCCT genes are regulated by different hormones in plant growth and development.
Recent studies have shown that CCT genes have multiple functions in plant abiotic stress tolerance. OsGhd2 (Os02g0731700) confers drought tolerance by accelerating drought-induced premature senescence, and controls grain number, heading date and plant height [20]. Its homologs in M. truncatula, MtCCT6 and MtCCT36 showed a significantly low expression level under PEG treatment (Table S2). Moreover, the expression levels of several genes (MtCCT25, MtCCT11, MtCCT22, MtCCT31 and MtCCT33) were dramatically regulated by salinity and dehydration stresses, suggesting their critical roles in the abiotic stress tolerance in M. truncatula (Figure 7). Development and stress tolerance are dynamically balanced during plant growth, and ABA plays a key role in the crosstalk between abiotic stress and growth [22]. COL4 (AT5G57660) is involved in the salt stress response, through the ABA-dependent signaling pathway in Arabidopsis [19]. However, its homolog, MtCCT24, was dramatically induced by PEG, but not by NaCl (Figure 8). On the other hand, 10 and 3 MtCCT genes were up-regulated and down-regulated simultaneously by NaCl, PEG and ABA, respectively, suggesting that they might participate in abiotic stresses’ regulatory network in a ABA-dependent manner. The strong response of MtCCT genes to abiotic stresses demonstrated that a set of MtCCT genes play critical roles in the prevention of plant against abiotic injury in M. truncatula.
Collectively, our study suggested that MtCCT genes play critical roles, not only in regulating flowering time, but also in plant growth and development, as well as in abiotic stress tolerance. Considering that the detailed regulatory mechanisms underlining CCT genes are still not clear in M. truncatula, it will be of great interest to elucidate individual MtCCT genes in the neat further. For instance, further characterization of MtCCT29 would provide a great advantage for alfalfa breeding with ideal flowering time; MtCCT13 could be a key player in nodule development in M. truncatula; and MtCCT25, MtCCT11, MtCCT22, MtCCT31 and MtCCT33 might contribute to abiotic stress tolerance in M. truncatula. Nevertheless, our current systematic studies provided a gene expression atlas for CCT genes in M. truncatula, which could be a valuable reference in its close relative alfalfa in functional genomics studies, as well as in molecular breeding.

4. Materials and Methods

4.1. Plant Materials

M. truncatula (cv. Jemalong A17) seeds were sterilized in 75% ethanol for 5 min, rinsed with sterile water 5 times, and then placed on moistened filter paper in dishes. They were subsequently cultured in a growth chamber at 25 °C. Seven-day-old seedlings were then subjected to different experiments. For each experiment, all samples were immediately frozen in liquid nitrogen and stored at −80 °C for RNA extraction.
For the temporal and spatial expression analyses of CCT genes, the seedlings were transferred into pots (20 cm in diameter) with nutritional soil and grown in a greenhouse under 16/8 h light/dark regime at 25 °C. Roots, blades, buds, flowerings, seedpods and nodules were collected at flowering stage from three individual plants with similar growth conditions.
For the expression analyses of CCT genes’ response to light, the seedlings were transferred into 10 × 10 cm pots filled with nutritional soil and grown in an artificial climate room under a 16/8 h light/dark regime at 25 °C. The latest expanded blades were collected every 3 h for a continuous 48h from three individual plants at squaring stage.
For the expression analyses of CCT genes’ response to different treatments, the 7-day-old seedlings were transferred into flask with 1/2 MS liquid medium and grown in a controlled growth cabinet under 16/8 h light/dark regime at 25 °C. Ten days later, the plants with the fourth leaf expanded were watered with 1 mmol·L−1 IAA, 1 mmol·L−1 GA4, 1 mmol·L−1 SA, 1 mmol·L−1 ABA, 15% PEG6000 and 300 mmol·L−1 NaCl, respectively. For each treatment, the whole plant was collected at 0 h, 2 h, 24 h and 72 h with a triplicate.

4.2. Identification of CCT Genes in M. truncatula

The genome and protein sequences of M. truncatula were downloaded from the EnsemblePlants Database (http://plants.ensembl.org/index.html). The hidden Markov model (HMM) file of the CCT family (PF06203) was retrieved from the Pfam Database (https://pfam.sanger.ac.uk/). The CCT protein sequences of M. truncatula were aligned using the HMM model of the HMMER3.0 (http://hmmer.org/), with an E-value of 0.001 and the removal of redundant sequences. The non-redundant sequences were submitted to the SMART database (http://smart.embl-heidelberg.de/) to verify the existence of the conserved CCT domain. The tools from the ExPASy website (https://web.expasy.org/protparam/) were used to analyze the sequence length, molecular weight and isoelectric point of the identified MtCCT proteins. The corresponding MtCCT genes were obtained from the genome database of M. truncatula.

4.3. Analyses of Gene Structure and Conserved Motif

The exon-intron structures of MtCCT genes were drawn with the online Gene Structure Display Server (GSDS 2.0; http://gsds.cbi.pku.edu.cn), based on the CDS and corresponding full-length sequence. The conserved motifs in MtCCT proteins were identified using the MEME software (http://meme-suite.org/tools/meme). The parameters were set as follows: width of each motif was 10-100 amino acid residues, maximum number of motifs was 3, and other parameters of default values.

4.4. Analyses of Chromosomal Distribution, Synteny and Cis-Elements of MtCCT Genes

Based on the location data of the MtCCT genes and chromosomal lengths of M. truncatula, we drew the schematic diagram of chromosomal distributions of MtCCT genes by using MG2C software (http://mg2c.iask.in/mg2c_v2.0/). The syntenic relationship between MtCCT genes and CCT genes from Arabidopsis and rice was determined by using Dual Synteny Plotter software (http://chibba.pgml.uga.edu/mcscan2/).
The 1500-bp promoter sequences upstream to the start code (ATG) of MtCCT genes were extracted from M. truncatula genome sequences, and the regulatory cis-elements in the promoter of MtCCT genes were predicted by the PlantCARE Database (http://bioinformatics.psb.ugent.be/webtools/plantcare/html/).

4.5. Phylogenetic Analysis of CCT Proteins in Representative Plants

A total of 101 CCT proteins, including 36 from M. truncatula, 25 from Arabidopsis, and 40 from rice, that were downloaded from the UniProt database (https://www.uniprot.org), were used for the phylogenetic analysis of CCT proteins in plants. The 101 CCT protein sequences were aligned with ClustalX software (https://clustalx.software.informer.com/2.1/) with default parameters, and the phylogenetic tree was then constructed with MEGA7.0 software (https://mega.software.informer.com/7.2/), using the Maximum Likelihood (parameter setting: Bootstrap method (1000 replicates), Poisson model, pairwise deletion). The phylogenetic tree was constructed based on the multiple sequence alignment in MegAlign (https://www.dnastar.com/software/lasergene/), by using the Clustal W method.

4.6. RNA Extraction and Real-Time Quantitative PCR

Total RNAs were extracted with EastepTM Super Total RNA Extraction Kit (Promega, LS1040, Beijing, China) following the manufacturer’s instructions, and then reverse-transcribed using TransScript One-Step gDNA Removal and cDNA Synthesis SuperMix (TransGen, AT311, Beijing, China). The cDNA was diluted 10 times with sterilized distilled water. Quantitative RT-PCR (qRT-PCR) was conducted, according to the instructions of TB Green Premix Ex Taq II (Tli RNaseH Plus) (Takara, RR820A, Dalian, China), on a ABI QuantStuio 7 Flex RT-PCR instrument (Applied Biosystems, Foster City, CA, USA). Gene-specific primers for qRT-PCR were shown in Table S3. The relative expression levels of the target CCT genes were presented as fold-change, calculated using the comparative method.

Supplementary Materials

The following are available online at https://www.mdpi.com/2223-7747/9/4/513/s1, Table S1: The orthologous CCT gene pairs between M. truncatula and Arabidopsis thaliana /Oryza sativa., Table S2: Detailed expression levels of MtCCT genes in six tissues, developing seed/nodule and treatments in response to different abiotic stresses and hormones., Table S3: Premier sequences used for qRT-PCR in this study., Figure S1: Alignment of multiple MtCCT protein sequences., Figure S2: Sequence information of CCT, BBOX and REC domains in MtCCT proteins., Figure S3: Chromosomal location of MtCCT genes in M. truncatula genome., Figure S4: The expression heatmaps of 16 MtCCT genes during the development of seeds (a) and nodules (b)., Figure S5: Distribution of the cis-elements responsive to light and phytohormones in the promoter regions of MtCCT genes.

Author Contributions

Data curation, L.M., J.Y. and X.L.; Funding acquisition, L.M., D.Y. and Y.P.; Investigation, L.M. and D.Y.; Software, L.M., J.Y. and X.L.; Writing—original draft, L.M. and D.Y.; Writing—review and editing, Y.P. All authors have read and agree to the published version of the manuscript.

Funding

This research was funded by National Nature Science Foundation of China (31802118, 31901386 and U1906201) and the earmarked fund for China Agriculture Research System (CARS34).

Conflicts of Interest

The authors declare no conflict of interest.

References

  1. Blumel, M.; Dally, N.; Jung, C. Flowering time regulation in crops—What did we learn from Arabidopsis? Curr. Opin. Biotechnol. 2015, 32, 121–129. [Google Scholar] [CrossRef]
  2. Putterill, J.; Laurie, R.; Macknight, R. It’s time to flower: The genetic control of flowering time. Bioessays 2004, 26, 363–373. [Google Scholar] [CrossRef]
  3. Srikanth, A.; Schmid, M. Regulation of flowering time: All roads lead to Rome. Cell Mol. Life Sci. 2011, 68, 2013–2037. [Google Scholar] [CrossRef]
  4. Yan, W.; Liu, H.; Zhou, X.; Li, Q.; Zhang, J.; Lu, L.; Liu, T.; Liu, H.; Zhang, C.; Zhang, Z.; et al. Natural variation in Ghd7.1 plays an important role in grain yield and adaptation in rice. Cell Res. 2013, 23, 969–971. [Google Scholar] [CrossRef]
  5. Li, Y.P.; Xu, M.L. CCT family genes in cereal crops: A current overview. Crop J. 2017, 5, 449–458. [Google Scholar] [CrossRef]
  6. Liu, C.; Qu, X.; Zhou, Y.; Song, G.; Abiri, N.; Xiao, Y.; Liang, F.; Jiang, D.; Hu, Z.; Yang, D. OsPRR37 confers an expanded regulation of the diurnal rhythms of the transcriptome and photoperiodic flowering pathways in rice. Plant Cell Environ. 2018, 41, 630–645. [Google Scholar] [CrossRef]
  7. Putterill, J.; Robson, F.; Lee, K.; Simon, R.; Coupland, G. The Constans gene of Arabidopsis promotes flowering and encodes a protein showing similarities to zinc-finger transcription tactors. Cell 1995, 80, 847–857. [Google Scholar] [CrossRef] [Green Version]
  8. Robson, F.; Costa, M.M.R.; Hepworth, S.R.; Vizir, I.; Pineiro, M.; Reeves, P.H.; Putterill, J.; Coupland, G. Functional importance of conserved domains in the flowering-time gene CONSTANS demonstrated by analysis of mutant alleles and transgenic plants. Plant J. 2001, 28, 619–631. [Google Scholar] [CrossRef]
  9. Wenkel, S.; Turck, F.; Singer, K.; Gissot, L.; Le Gourrierec, J.; Samach, A.; Coupland, G. CONSTANS and the CCAAT box binding complex share a functionally important domain and interact to regulate flowering of Arabidopsis. Plant Cell 2006, 18, 2971–2984. [Google Scholar] [CrossRef] [Green Version]
  10. Cockram, J.; Thiel, T.; Steuernagel, B.; Stein, N.; Taudien, S.; Bailey, P.C.; O’Sullivan, D.M. Genome dynamics explain the evolution of flowering time CCT domain gene families in the Poaceae. PLoS ONE 2012, 7, e45307. [Google Scholar] [CrossRef] [Green Version]
  11. Zhang, L.; Li, Q.; Dong, H.; He, Q.; Liang, L.; Tan, C.; Han, Z.; Yao, W.; Li, G.; Zhao, H.; et al. Three CCT domain-containing genes were identified to regulate heading date by candidate gene-based association mapping and transformation in rice. Sci. Rep. 2015, 5, 7663. [Google Scholar] [CrossRef] [Green Version]
  12. Jin, M.L.; Liu, X.G.; Jia, W.; Liu, H.J.; Li, W.Q.; Peng, Y.; Du, Y.F.; Wang, Y.B.; Yin, Y.J.; Zhang, X.; et al. ZmCOL3, a CCT gene represses flowering in maize by interfering with the circadian clock and activating expression of ZmCCT. J. Integr. Plant Biol. 2018, 60, 465–480. [Google Scholar] [CrossRef]
  13. Yan, L.L.; Loukoianov, A.; Blechl, A.; Tranquilli, G.; Ramakrishna, W.; SanMiguel, P.; Bennetzen, J.L.; Echenique, V.; Dubcovsky, J. The wheat VRN2 gene is a flowering repressor down-regulated by vernalization. Science 2004, 303, 1640–1644. [Google Scholar] [CrossRef] [Green Version]
  14. Corbesier, L.; Vincent, C.; Jang, S.; Fornara, F.; Fan, Q.; Searle, I.; Giakountis, A.; Farrona, S.; Gissot, L.; Turnbull, C.; et al. FT protein movement contributes to long-distance signaling in floral induction of Arabidopsis. Science 2007, 316, 1030–1033. [Google Scholar] [CrossRef] [Green Version]
  15. Yano, M.; Katayose, Y.; Ashikari, M.; Yamanouchi, U.; Monna, L.; Fuse, T.; Baba, T.; Yamamoto, K.; Umehara, Y.; Nagamura, Y.; et al. Hd1, a major photoperiod sensitivity quantitative trait locus in rice, is closely related to the Arabidopsis flowering time gene CONSTANS. Plant Cell 2000, 12, 2473–2483. [Google Scholar] [CrossRef] [Green Version]
  16. Hayama, R.; Yokoi, S.; Tamaki, S.; Yano, M.; Shimamoto, K. Adaptation of photoperiodic control pathways produces short-day flowering in rice. Nature 2003, 422, 719–722. [Google Scholar] [CrossRef]
  17. Wu, W.; Zheng, X.M.; Lu, G.; Zhong, Z.; Gao, H.; Chen, L.; Wu, C.; Wang, H.J.; Wang, Q.; Zhou, K.; et al. Association of functional nucleotide polymorphisms at DTH2 with the northward expansion of rice cultivation in Asia. Proc. Natl. Acad. Sci. USA 2013, 110, 2775–2780. [Google Scholar] [CrossRef] [Green Version]
  18. Yan, L.L.; Loukoianov, A.; Tranquilli, G.; Helguera, M.; Fahima, T.; Dubcovsky, J. Positional cloning of the wheat vernalization gene VRN1. Proc. Natl. Acad. Sci. USA 2003, 100, 6263–6268. [Google Scholar] [CrossRef] [Green Version]
  19. Min, J.H.; Chung, J.S.; Lee, K.H.; Kim, C.S. The CONSTANS-like 4 transcription factor, AtCOL4, positively regulates abiotic stress tolerance through an abscisic acid-dependent manner in Arabidopsis. J. Integr. Plant Biol. 2015, 57, 313–324. [Google Scholar] [CrossRef]
  20. Liu, J.; Shen, J.; Xu, Y.; Li, X.; Xiao, J.; Xiong, L. Ghd2, a CONSTANS-like gene, confers drought sensitivity through regulation of senescence in rice. J. Exp. Bot. 2016, 67, 5785–5798. [Google Scholar] [CrossRef] [Green Version]
  21. Hung, H.Y.; Shannon, L.M.; Tian, F.; Bradbury, P.J.; Chen, C.; Flint-Garcia, S.A.; McMullen, M.D.; Ware, D.; Buckler, E.S.; Doebley, J.F.; et al. ZmCCT and the genetic basis of day-length adaptation underlying the post domestication spread of maize. Proc. Natl. Acad. Sci. USA 2012, 109, 1913–1921. [Google Scholar] [CrossRef] [Green Version]
  22. Wang, C.; Yang, Q.; Wang, W.; Li, Y.; Guo, Y.; Zhang, D.; Ma, X.; Song, W.; Zhao, J.; Xu, M. A transposon-directed epigenetic change in ZmCCT underlies quantitative resistance to Gibberella stalk rot in maize. New Phytol. 2017, 215, 1503–1515. [Google Scholar] [CrossRef] [Green Version]
  23. Xu, G.; Wang, X.; Huang, C.; Xu, D.; Li, D.; Tian, J.; Chen, Q.; Wang, C.; Liang, Y.; Wu, Y.; et al. Complex genetic architecture underlies maize tassel domestication. New Phytol. 2017, 214, 852–864. [Google Scholar] [CrossRef] [Green Version]
  24. Xue, W.Y.; Xing, Y.Z.; Weng, X.Y.; Zhao, Y.; Tang, W.J.; Wang, L.; Zhou, H.J.; Yu, S.B.; Xu, C.G.; Li, X.H.; et al. Natural variation in Ghd7 is an important regulator of heading date and yield potential in rice. Nat. Genet. 2008, 40, 761–767. [Google Scholar] [CrossRef]
  25. Weng, X.; Wang, L.; Wang, J.; Hu, Y.; Du, H.; Xu, C.; Xing, Y.; Li, X.; Xiao, J.; Zhang, Q. Grain number, plant height, and heading date7 is a central regulator of growth, development, and stress response. Plant Physiol. 2014, 164, 735–747. [Google Scholar] [CrossRef] [Green Version]
  26. Strayer, C.; Oyama, T.; Schultz, T.F.; Raman, R.; Somers, D.E.; Mas, P.; Panda, S.; Kreps, J.A.; Kay, S.A. Cloning of the Arabidopsis clock cone TOC1, an auto regulatory response regulator homolog. Science 2000, 289, 768–771. [Google Scholar] [CrossRef] [Green Version]
  27. Alabadi, D.; Oyama, T.; Yanovsky, M.J.; Harmon, F.G.; Mas, P.; Kay, S.A. Reciprocal regulation between TOC1 and LHY/CCA1 within the Arabidopsis circadian clock. Science 2001, 293, 880–883. [Google Scholar] [CrossRef]
  28. Gao, H.; Jin, M.; Zheng, X.M.; Chen, J.; Yuan, D.; Xin, Y.; Wang, M.; Huang, D.; Zhang, Z.; Zhou, K.; et al. Days to heading 7, a major quantitative locus determining photoperiod sensitivity and regional adaptation in rice. Proc. Natl. Acad. Sci. USA 2014, 111, 16337–16342. [Google Scholar] [CrossRef] [Green Version]
  29. Nishida, H.; Yoshida, T.; Kawakami, K.; Fujita, M.; Long, B.; Akashi, Y.; Laurie, D.A.; Kato, K. Structural variation in the 5’ upstream region of photoperiod-insensitive alleles Ppd-A1a and Ppd-B1a identified in hexaploid wheat (Triticum aestivum L.), and their effect on heading time. Mol. Breed. 2013, 31, 27–37. [Google Scholar] [CrossRef]
  30. Sun, H.; Guo, Z.; Gao, L.; Zhao, G.; Zhang, W.; Zhou, R.; Wu, Y.; Wang, H.; An, H.; Jia, J. DNA methylation pattern of photoperiod-B1 is associated with photoperiod insensitivity in wheat (Triticum aestivum). New Phytol. 2014, 204, 682–692. [Google Scholar] [CrossRef]
  31. Wang, Z.; Wang, X.M.; Zhang, H.; Ma, L.; Zhao, H.M.; Jones, C.S.; Chen, J.; Liu, G.B. A genome-wide association study approach to the identification of candidate genes underlying agronomic traits in alfalfa (Medicago sativa L.). Plant Biotechnol. J. 2019, 18, 611–613. [Google Scholar] [CrossRef] [PubMed]
  32. Lorenzo, C.D.; Garcia-Gagliardi, P.; Antonietti, M.S.; Sanchez-Lamas, M.; Mancini, E.; Dezar, C.A.; Vazquez, M.; Watson, G.; Yanovsky, M.J.; Cerdan, P.D. Improvement of alfalfa forage quality and management through the down-regulation of MsFTa1. Plant Biotechnol. J. 2019. [Google Scholar] [CrossRef] [Green Version]
  33. Adhikari, L.; Makaju, S.O.; Missaoui, A.M. QTL mapping of flowering time and biomass yield in tetraploid alfalfa (Medicago sativa L.). BMC Plant Biol. 2019, 19, 359. [Google Scholar] [CrossRef]
  34. Zhou, C.E.; Han, L.; Pislariu, C.; Nakashima, J.; Fu, C.X.; Jiang, Q.Z.; Quan, L.; Blancaflor, E.B.; Tang, Y.H.; Bouton, J.H.; et al. From model to crop: Functional analysis of a STAY-GREEN gene in the model legume Medicago truncatula and effective use of the gene for alfalfa improvement. Plant Physiol. 2011, 157, 1483–1496. [Google Scholar] [CrossRef] [Green Version]
  35. Gou, J.Q.; Debnath, S.; Sun, L.; Flanagan, A.; Tang, Y.H.; Jiang, Q.Z.; Wen, J.Q.; Wang, Z.Y. From model to crop: Functional characterization of SPL8 in M. truncatula led to genetic improvement of biomass yield and abiotic stress tolerance in alfalfa. Plant Biotechnol. J. 2018, 16, 951–962. [Google Scholar] [CrossRef] [Green Version]
  36. Bendix, C.; Marshall, C.M.; Harmon, F.G. Circadian clock genes universally control key agricultural traits. Mol. Plant 2015, 8, 1135–1152. [Google Scholar] [CrossRef] [Green Version]
  37. Liu, Y.Q.; Wu, H.; Chen, H.; Liu, Y.L.; He, J.; Kang, H.Y.; Sun, Z.G.; Pan, G.; Wang, Q.; Hu, J.L.; et al. A gene cluster encoding lectin receptor kinases confers broad-spectrum and durable insect resistance in rice. Nat. Biotechnol. 2015, 33, 301–306. [Google Scholar] [CrossRef]
  38. Walters, L.A.; Escobar, M.A. The AtGRXS3/4/5/7/8 glutaredoxin gene cluster on Arabidopsis thaliana chromosome 4 is coordinately regulated by nitrate and appears to control primary root growth. Plant Signal Behav. 2016, 11, e1171450. [Google Scholar] [CrossRef] [Green Version]
  39. Kryvoruchko, I.S.; Sinharoy, S.; Torres-Jerez, I.; Sosso, D.; Pislariu, C.I.; Guan, D.; Murray, J.; Benedito, V.A.; Frommer, W.B.; Udvardi, M.K. MtSWEET11, a nodule-specific sucrose transporter of Medicago truncatula. Plant Physiol. 2016, 171, 554–565. [Google Scholar] [CrossRef] [Green Version]
  40. Satge, C.; Moreau, S.; Sallet, E.; Lefort, G.; Auriac, M.C.; Rembliere, C.; Cottret, L.; Gallardo, K.; Noirot, C.; Jardinaud, M.F.; et al. Reprogramming of DNA methylation is critical for nodule development in Medicago truncatula. Nat. Plants 2016, 2, 16166. [Google Scholar] [CrossRef]
  41. Nakamichi, N.; Kiba, T.; Henriques, R.; Mizuno, T.; Chua, N.H.; Sakakibara, H. PSEUDO-RESPONSE REGULATORS 9, 7, and 5 are transcriptional repressors in the Arabidopsis circadian clock. Plant Cell 2010, 22, 594–605. [Google Scholar] [CrossRef] [PubMed] [Green Version]
  42. Zheng, X.; Li, X.; Ge, C.; Chang, J.; Shi, M.; Chen, J.; Qiao, L.; Chang, Z.; Zheng, J.; Zhang, J. Characterization of the CCT family and analysis of gene expression in Aegilops tauschii. PLoS ONE 2017, 12, e0189333. [Google Scholar] [CrossRef] [PubMed] [Green Version]
  43. Corbesier, L.; Coupland, G. The quest for florigen: A review of recent progress. J. Exp. Bot. 2006, 57, 3395–3403. [Google Scholar] [CrossRef] [Green Version]
  44. Moon, J.; Suh, S.S.; Lee, H.; Choi, K.R.; Hong, C.B.; Paek, N.C.; Kim, S.G.; Lee, I. The SOC1 MADS-box gene integrates vernalization and gibberellin signals for flowering in Arabidopsis. Plant J. 2003, 35, 613–623. [Google Scholar] [CrossRef]
  45. Mai, Y.X.; Wang, L.; Yang, H.Q. A gain-of-function mutation in IAA7/AXR2 confers late flowering under short-day light in Arabidopsis. J. Integr. Plant Biol. 2011, 53, 480–492. [Google Scholar] [CrossRef]
  46. Riboni, M.; Test, A.R.; Galbiati, M.; Tonelli, C.; Conti, L. ABA-dependent control of GIGANTEA signalling enables drought escape via up-regulation of FLOWERING LOCUS T in Arabidopsis thaliana. J. Exp. Bot. 2016, 67, 6309–6322. [Google Scholar] [CrossRef] [Green Version]
Figure 1. Phylogenetic relationship, gene structure and architecture of conserved domains of MtCCT genes. (a) Phylogenetic tree of MtCCT genes (36 in total) was constructed based on the full-length sequences of proteins using MegAlign. Different subfamilies are highlighted in different colors: PRR in green, COL in yellow, and CMF in red. (b) Exon-intron structure and conserved domains of MtCCT genes. Blue boxes indicate exons; black lines indicate introns; red, yellow and green boxes indicate CCT (CO, COL and TOC1), BBOX (B-box-type zinc finger) and REC (cheY-homologous receiver) domains, respectively.
Plants 09 00513 g001
Figure 2. Synteny analyses of MtCCT genes between M. truncatula and A. thaliana/O. sativa. Gray lines in the background indicate the collinear blocks within M. truncatula, and A. thaliana/O. sativa, and the red lines highlight the syntenic MtCCT gene pairs.
Plants 09 00513 g002
Figure 3. Phylogenetic relationships among CCT genes in M. truncatula, Arabidopsis and rice. The phylogenetic tree was constructed using MEGA (Molecular Evolutionary Genetics Analysis) 7 based on (ML, Maximum Likelihood) method; bootstrap was 1000 replicates. The different colored circles indicate proteins of different subfamilies.
Plants 09 00513 g003
Figure 4. Expression files of MtCCT genes in six representative tissues (Root, Blade, Bud, Flower and Seedpod). (a) The expression heatmap of MtCCT genes constructed by electronic expression data; (b) The expression patterns of 12 MtCCT genes in six tissues were examined by qPCR(quantitative PCR). Expression levels are normalized to MtACTIN and error bars indicate standard deviation among three biological replicates.
Plants 09 00513 g004
Figure 5. Diurnal expression patterns of MtCCT genes’ response to light circle. The white and black bars represent the light and dark periods, respectively. Expression levels are normalized to MtACTIN and error bars indicate standard deviation among three biological replicates.
Plants 09 00513 g005
Figure 6. Expression of MtCCT genes in response to different hormones. Plants with fourth blade were treated with 1 mM IAA (a), 1 mM GA4 (b), 1 mM SA (c) and 1 mM ABA (d). Expression levels are normalized to MtACTIN and error bars indicate standard deviation among three biological replicates. The relative expressions levels are -log2 transformed and visualized for heat map. The colors vary from blue to red, and circles from small to large represent the scale of the relative expression levels.
Plants 09 00513 g006
Figure 7. Expression of MtCCT genes in response to abiotic stress. Plants with fourth blade were watered with 0.3 M NaCl (a) and 17% PEG (polyethylene glycol) (b). Expression levels are normalized to MtACTIN and error bars indicate standard deviation among three biological replicates. The relative expressions levels are -log2 transformed and visualized for heat map. The colors vary from blue to red, and circles from small to large represent the scale of the relative expression levels.
Plants 09 00513 g007
Figure 8. The detailed numbers of simultaneously up-regulated (a) and down-regulated (b) MtCCT genes by ABA (abscisic acid), NaCl and PEG.
Plants 09 00513 g008
Table 1. Properties and locations of the predicted CCT (CO, COL and TOC1) proteins in M. truncatula.
GeneChromosomeCDS
(Coding Sequence)
Protein (aa)Molecular Weight (D)Theoretical PiSubfamily
MtCCT1Chr1Medtr1g008220.1282319274.94CMF
MtCCT2Chr1Medtr1g013450.1316354966.31COL
MtCCT3Chr1Medtr1g044785.1230253605.6CMF
MtCCT4Chr1Medtr1g067110.1748816107.27PRR
MtCCT5Chr1Medtr1g073350.1414457194.47CMF
MtCCT6Chr1Medtr1g110870.1436487935.45COL
MtCCT7Chr2Medtr2g068730.1266308165.21CMF
MtCCT8Chr2Medtr2g088900.1521575715.85COL
MtCCT9Chr2Medtr2g096080.1251286576.17CMF
MtCCT10Chr3Medtr3g037390.1575646216.05PRR
MtCCT11Chr3Medtr3g082630.2411452774.89COL
MtCCT12Chr3Medtr3g091340.1281319165.23CMF
MtCCT13Chr3Medtr3g092780.1685758516.11PRR
MtCCT14Chr3Medtr3g100040.1359388474.47CMF
MtCCT15Chr3Medtr3g100050.1309342065.62CMF
MtCCT16Chr3Medtr3g105710.1290318697.11COL
MtCCT17Chr4Medtr4g008090.1121135899.86CMF
MtCCT18Chr4Medtr4g061360.1796872466.72PRR
MtCCT19Chr4Medtr4g061823.1242275805.93CMF
MtCCT20Chr4Medtr4g061910.1242275805.93CMF
MtCCT21Chr4Medtr4g093730.1334375635.04CMF
MtCCT22Chr4Medtr4g108880.1585687815.80PRR
MtCCT23Chr4Medtr4g127420.1379420069.00CMF
MtCCT24Chr4Medtr4g128930.1375411195.86COL
MtCCT25Chr5Medtr5g010120.1251291955.83CMF
MtCCT26Chr5Medtr5g066510.1286314245.53CMF
MtCCT27Chr5Medtr5g069480.1410450275.70COL
MtCCT28Chr5Medtr5g072780.1217258975.07CMF
MtCCT29Chr7Medtr7g018170.1396437575.10COL
MtCCT30Chr7Medtr7g032240.1352404339.53CMF
MtCCT31Chr7Medtr7g083540.1390443116.28COL
MtCCT32Chr7Medtr7g108150.1372425816.21COL
MtCCT33Chr7Medtr7g118260.1596666546.54PRR
MtCCT34Chr8Medtr8g024260.1640730016.74PRR
MtCCT35Chr8Medtr8g098725.1324373265.34CMF
MtCCT36Chr8Medtr8g104190.1416470415.10COL

