Abstract
Heterosis or hybrid vigour is a phenomenon in which hybrid progeny exhibit superior yield and biomass to parental lines and has been used to breed F1 hybrid cultivars in many crops. A similar level of heterosis in all F1 individuals is expected as they are genetically identical. However, we found variation in rosette size in individual F1 plants from a cross between C24 and Columbia-0 accessions of Arabidopsis thaliana. Big-sized F1 plants had 26.1% larger leaf area in the first and second leaves than medium-sized F1 plants at 14 days after sowing in spite of the identical genetic background. We identified differentially expressed genes between big- and medium-sized F1 plants by microarray; genes involved in the category of stress response were overrepresented. We made transgenic plants overexpressing 21 genes, which were differentially expressed between the two size classes, and some lines had increased plant size at 14 or 21 days after sowing but not at all time points during development. Change of expression levels in stress-responsive genes among individual F1 plants could generate the variation in plant size of individual F1 plants in A. thaliana.
1. Introduction
Heterosis or hybrid vigour is the superior performance of F1 (heterozygous) plants relative to their inbred (homozygous) parental lines. In the process of plant breeding, the phenomenon of heterosis has been exploited in various crops and vegetables because of its effect on yield or stress tolerance [1]. Hybrid breeding has been remarkably successful starting with maize [2,3], but the molecular mechanism of heterosis remains unknown. Several genetic models have been hypothesized for the explanation of heterosis [1,4,5,6]. The dominance model explains that heterosis is due to the complementation of deleterious recessive alleles by favourable dominant alleles at multiple loci. The overdominance model argues that the heterozygous state leads to superior performance of hybrids to either homozygous condition. The epistasis model is that interaction of favourable alleles at different loci results in heterosis. Epigenetic modifications are considered to also contribute to heterosis; interactions between parental epigenetic states in the two sets of chromosomes in hybrids play a role in heterosis [5,7,8]. Mutations in the chromatin remodeler Decreased in DNA methylation 1 (DDM1) lead to lower levels of heterosis, supporting a role for epigenetic contributions to heterosis [8].
The concept that the superior performance of hybrid is caused by establishment of more favourable gene expression levels relative to the parental lines has been considered [9]. The transcriptome profile has been compared between hybrids and parental lines in a number of heterotic hybrids of maize, rice, and Arabidopsis thaliana [10,11,12,13,14,15,16,17,18]. Though the majority of genes show an additive gene expression pattern, differentially expressed genes between hybrids and the mid-parent value (MPV), termed non-additively expressed genes, are detected [1]. In some studies, non-additively expressed genes involved in specific functional categories have been suggested to play a role in the heterosis phenotype, while there are reports showing that the majority of non-additively expressed genes are not associated with any specific categories [10,11,12,13,14,15,16,17,18,19].
In addition to crops and vegetables, A. thaliana also shows substantial heterosis in vegetative biomass in particular parental combinations [20,21,22,23,24,25], and several approaches such as quantitative trait locus (QTL) analysis, transcriptome, metabolome, small RNAome, and epigenome analysis have been used to identify genes and mechanisms that may be important for heterosis [1,8]. In the hybrid between C24 and Columbia-0 (Col) accessions of A. thaliana, heterosis is obvious at early developmental stages in increased cotyledon area at a few days after sowing. Larger cotyledon size generates an increase in photosynthetic capacity, suggesting that this increased photosynthetic capacity in hybrids may cause the maintenance and/or magnification of heterosis at later developmental stages [14]. A similar phenotype at early developmental stages has been observed in other parental combinations of A. thaliana [26].
In this study, we found variation in size among individual plants, which were hybrid between the C24 and Col accessions. To identify the genes regulating the altered plant size in individuals with the same genetic background, we compared the transcriptome profile between big- and medium-sized F1 plants using microarrays. A number of genes showed a higher expression level in the big-sized F1 plants than in the medium-sized F1 plants; we examined their effect on plant size by overexpression, focusing on genes categorized into ‘transcription factor’. A number of transgenic plants were larger at 14 or 21 days after sowing, suggesting that these genes play a part in the control of plant size.
2. Results
2.1. Variation of Shoot Size in the F1 between C24 and Col
The F1 between C24 and Col had a heterosis phenotype in shoots [14,15]. From our previous data [14], we found that the variation of rosette diameter of F1 hybrid between C24 and Col was larger than that of parental lines (Figure S1). This study confirmed this phenomenon; among 80 F1 plants, shoot size evaluated by rosette diameter at 14 days after sowing (DAS) varied, and the biggest rosette diameter was 2.7 times larger than smallest (Figure 1A). The size of dry seed evaluated by seed area also showed variation within the seventy-two F1 seeds, and the seed area of the biggest seed was 1.5 times larger than the smallest (Figure 1B).
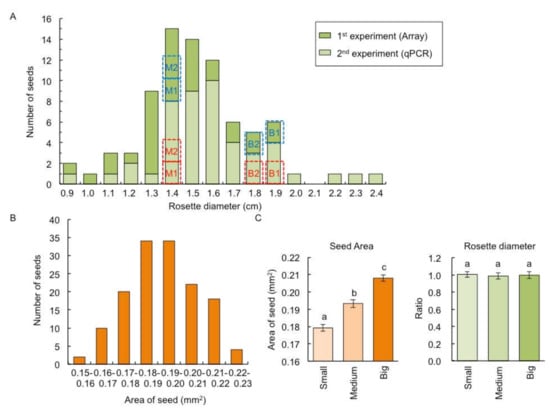
Figure 1.
Variation of rosette diameter and seed size among individual F1 plants between C24 and Columbia-0 (Col). (A) Distribution of rosette diameter among individual F1 plants (n = 80) at 14 days after sowing (DAS). Dark and light green bars represent plant materials used for microarray analysis and quantitative RT-PCR (qPCR), respectively. Blue and red dotted lines represent the plant size used for microarray and qPCR, respectively. (B) Distribution of seed area in F1 (n = 72). (C) The seed area (left panel) and rosette diameter at 14 DAS (right panel) derived from small, medium, and big seed fractions. The ratio of the rosette diameter compared with plants derived from big seed fractions are shown. Data presented are the average and standard error (s.e.) (n = 9). Letters above the bars indicate significant differences at p < 0.05 (Tukey–Kramer test).
To examine whether the larger shoot size in F1 plants is due to larger seed size, we examined the relationship between shoot and seed sizes. There was no difference in rosette diameter at 14 DAS of nine F1 plants derived from nine seeds from each of the small, medium, and big seed fractions (Figure 1C), indicating that the difference in seed size is independent of shoot size in the F1 population.
Using twenty-two plants of each of the big-(14.1% larger) and medium-size fractions in rosette diameter at 10 DAS from 103 F1 plants (Figure 2A), the rosette diameter, leaf area, and the size of the first layer of palisade mesophyll cell in the first and second leaves were examined at 14 DAS. At 14 DAS, F1 plants that were big at 10 DAS retained the larger rosette diameter (15.2%) relative to the medium-sized F1 plants (Figure 2B), and the big-sized F1 plants had 26.1% larger leaf area in the first and second leaves relative to the medium-sized F1 plants (Figure 2C). The big-sized F1 plants had a 21.6% reduction in the number of the first layer of palisade mesophyll cells per unit area relative to the medium-sized F1 plants at 14 DAS (Figure 2D), indicating that the larger leaf area of the big-sized F1 plant is due to the increased cell size.
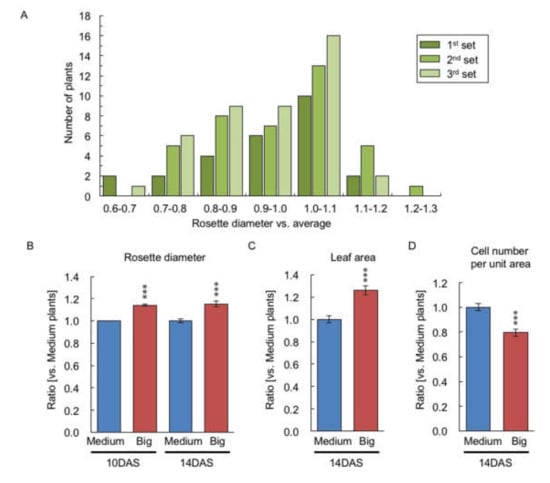
Figure 2.
Comparison of the rosette diameter and true leaf area and its cell number per unit area between medium- and big-sized F1 plants. (A) Distribution of ratio of rosette diameter compared with average of rosette diameter in F1 plants (n = 103) at 10 DAS. Three replicates were performed represented as first, second, and third sets. (B) Ratio of rosette diameter compared with medium-sized F1 plants in big-sized F1 plants at 10 and 14 DAS. (C) Ratio of leaf area of first and second leaves compared with medium-sized F1 plants in big-sized F1 plants at 14 DAS. (D) Ratio of cell number per unit area in the first layer of palisade mesophyll cell compared with medium-sized F1 plants in big-sized F1 plants at 14 DAS. Data presented are the average and standard error (s.e.) (each, n = 22). *** p < 0.001 (Student’s t-test).
2.2. The Transcriptome Divergence between Big- and Medium-Sized F1 Plants
We examined the whole genome transcriptome of big- and medium-sized F1 plants at 14 DAS using the Affymetrix, Arabidopsis ATH1 Genome Array using total RNAs from shoots of the biggest (B1, two 1.9 cm rosette diameter plants), the second biggest (B2, two 1.8 cm rosette diameter plants), and two medium-size fractions (M1 and M2, two 1.4 cm rosette diameter plants) of plants (Figure 1A). We did not use small F1 plants, as there is a risk that the decrease in plant size is due to disease or failure to thrive. The 441 probe sets showed 1.5-fold difference with 5% false discovery rate (FDR) in expression between B1&B2 and M1&M2 (Table S1). Among differentially expressed genes, 361 (81.9%) probe sets were expressed at a higher level in B1&B2 than in M1&M2 (B1&B2 > M1&M2 expression), and 80 probe-sets showed B1&B2 < M1&M2 expression (Table S1).
We compared the lists of non-additively expressed genes in aerial tissues between three F1 hybrids (C24/Col, C24/Landsberg erecta (Ler), Col/Ler) and their mid-parent values (MPV) at 15 DAS [17] with our lists of differentially expressed genes (Table 1). About 30% of genes showing B1&B2 > M1&M2 expression overlapped with upregulated genes in C24/Col or C24/Ler hybrids (Table 1), and these ratios were higher than the expected ratio (chi-square goodness of fit test, p < 10−10). The 61 genes (16.9%) overlapped with upregulated genes in both C24/Col and C24/Ler hybrids (Table S2), while 5.8% of genes overlapped with upregulated genes in Col/Ler hybrids (Table 1). Of genes showing B1&B2 < M1&M2 expression, more genes overlapped with downregulated genes in C24/Col hybrids (31.3%) followed by C24/Ler (22.5%) and Col/Ler (13.8%) hybrids (Table 1). The ratios overlapping B1&B2 < M1&M2 expression and downregulated genes in C24/Col and C24/Ler were also higher than the expected ratio (chi-square goodness of fit test, p < 10−10).

Table 1.
Number of genes overlapping with previous transcriptome data.
We also compared our data with lists of differentially expressed genes between C24xCol and ddm1C24xddm1Col hybrids or between ColxC24 and ddm1Colxddm1C24 hybrids (Table 1), which showed different plant size with the same genetic background [27]. As our material is C24xCol hybrids, we focused on genes differentially expressed in C24xCol and ddm1C24xddm1Col hybrids; twenty-five genes showing B1&B2 > M1&M2 expression overlapped with downregulated genes in C24xCol hybrids compared with ddm1C24xddm1Col hybrids (Table 1), including Ethylene responsive element binding factor 5 (ERF5), ERF6, ERF105, WRKY40, DRE BINDING PROTEIN 1B (DREB1B), Salt-inducible zinc finger 1 (SZF1), and SZF2 (Figure S2).
2.3. Confirmation of Differential Gene Expression by Quantitative RT-PCR
We confirmed the expression patterns of 24 differentially expressed genes (13 genes, B1&B2 > M1&M2 expression; 11 genes, B1&B2 < M1&M2 expression) using quantitative RT-PCR analysis (qPCR) using another set of big- (B1, two 1.9 cm rosette diameter plants; B2, two 1.8 cm rosette diameter plants) and medium-sized (M1 and M2, two 1.4 cm rosette diameter plants) F1 plants (Figure 1A). The relative expression levels between B1&B2 and M1&M2 seen in microarray data were highly correlated with those in qPCR (r = 0.94, p < 1.00 × 10⁻¹⁰) (Figure 3, Table S3).
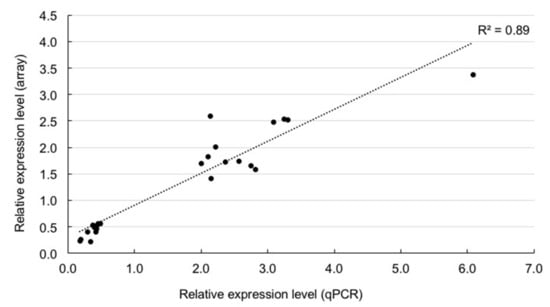
Figure 3.
Verification of microarray data by qPCR. Relationship of relative expression levels between qPCR and microarray in 24 differentially expressed genes between big- and medium-sized F1 plants.
2.4. Comparison of Gene Expression between Big- and Medium-Sized F2 Plants
Rosette diameter at 14 DAS varied in F2 plants derived from medium- (first) and big- (first) sized F1 hybrid between C24 and Col (Figure 4A). Mean size of rosette diameter and distribution of plant size were similar between two F2 populations (Figure 4A), suggesting that plant size differences in F1 were not inherited in the next generation. We examined whether the same genes showed differential gene expression between big (BF2, two 1.5 cm and one 1.4 cm rosette diameter plants) and medium (MF2, three 1.1 cm rosette diameter plants) fractions of F2 plants as in F1 (Figure 4A). The 14 and 11 genes showing larger differences in B1&B2 > M1&M2 and B1&B2 < M1&M2 expression, respectively, were used. In the first F2 big fraction, six and four genes showed BF2 > MF2 and BF2 < MF2 expression, respectively (Figure 4B, Table S4). In the second F2 fraction, nine and four genes showed BF2 > MF2 and BF2 < MF2 expression, respectively (Figure 4B, Table S4). Five and two genes showed BF2 > MF2 and BF2 < MF2 expression, respectively, in both sets (Figure 4B, Table S4). About 35% (5/14 genes) and 18% (2/11 genes), as in the F1, showed a higher or lower expression level in the big-sized F2 plants than in the medium-sized F2 plants, respectively.
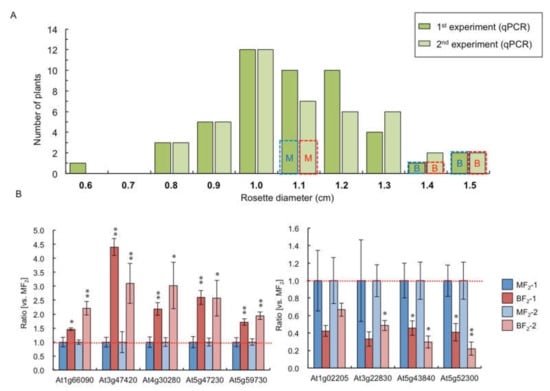
Figure 4.
Comparison of the gene expression level between big- and medium-sized F2 plants. (A) Distribution of rosette diameter at 14 DAS of F2 plants. Blue and red dotted lines represent the plant size used for qPCR. (B) qPCR using genes that showed B1&B2 > M1&M2 (left panel) and B1&B2 < M1&M2 expression (right panel). The ratio of the expression levels compared with medium-sized F2 plants in big-sized F2 plants is shown. Data presented are the average and standard error (s.e.) from three biological and experimental replicates. * p < 0.05, ** p < 0.01 (Student’s t-test).
2.5. Classification of the Differentially Expressed Genes between Big- and Medium-Sized F1 Plants
We categorized the differentially expressed genes between B1&B2 and M1&M2 into gene ontology (GO) cellular component, GO molecular function, and GO biological process (Tables S5 and S6). The categories of ‘Response to abscisic acid stimulus’, ‘Defense response’, and ‘Response to jasmonic acid stimulus’ in GO biological process were overrepresented in genes showing B1&B2 > M1&M2 and B1&B2 < M1&M2 expression (Figure 5 and Figure 6, Tables S5 and S6). In the genes showing B1&B2 > M1&M2 expression, genes categorized into ‘Response to chitin’, ‘Response to ethylene stimulus’, ‘Response to wounding’, and ‘Response to salicylic acid stimulus’ in GO biological process were overrepresented (Figure 5 and Figure 6, Table S5). In the genes showing B1&B2 < M1&M2 expression, genes categorized into ‘Leaf senescence’, ‘Response to salt stress’, ‘Response to abiotic stimulus’, and ‘Response to cold’ in GO biological process were overrepresented (Figure 5 and Figure 6, Table S6). In the 61 genes, which showed B1&B2 > M1&M2 expression and upregulated genes in both C24xCol and C24xLer hybrids (Table S2), similar categories to B1&B2 > M1&M2 expressed genes were overrepresented (Figure 5, Table S7).
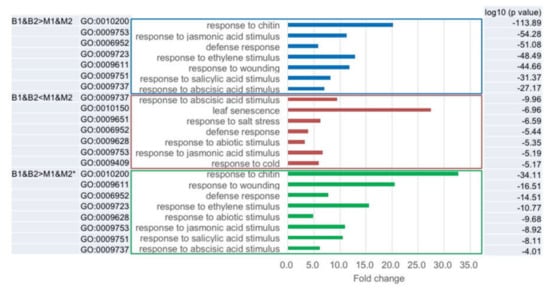
Figure 5.
Gene ontology (GO) classification in B1&B2 > M1&M2 and B1&B2 < M1&M2 expressed genes. * represents overrepresented GO categories in B1&B2 > M1&M2 expressed genes and differentially expressed genes in C24/Col and C24/Ler hybrids compared with MPV.
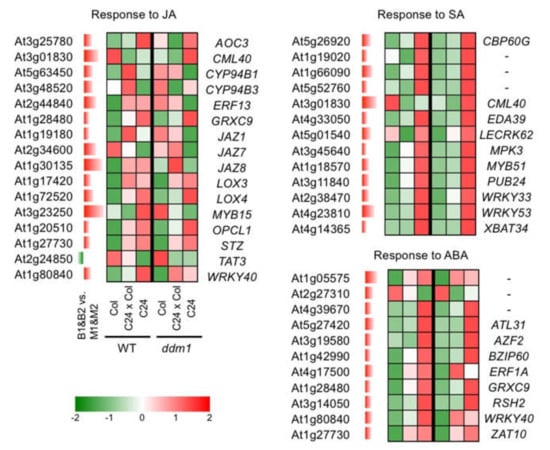
Figure 6.
Expression pattern of genes showing B1&B2 > M1&M2 expression. GO terms related to plant hormone response are shown. Expression levels in Col, C24, C24xCol, ddm1Col, ddm1C24, and ddm1C24xddm1Col are derived from [27]. Different red/green colours indicate the fold change (up/down) from the MPV. ABA, abscisic acid; JA, jasmonic acid; SA, salicylic acid.
2.6. Overexpression Resulted in Plant Size Difference
We focused on the B1&B2 > M1&M2 expressed genes, especially transcription factors as they control many biological processes by regulating gene expression. cDNAs from the first methionine to the stop codon of 21 genes were placed under the control of a 35S promoter, and binary vectors were transformed into the wild-type Col accession of A. thaliana (Table 2). We obtained more than three independent T1 transgenic plants for each gene. Bulked T2 seeds were sown on MS medium, and we compared the rosette diameter at 14 and 21 DAS of T2 plants with and without transgenes. Twelve of 21 lines showed no difference between transgenic plants and non-transgenic controls at either 14 or 21 DAS (Figure 7, Table 2). In two lines, #18 and #20, the rosette diameter of transgenic plants was larger than that of non-transgenic plants at 14 DAS (Figure 7, Table 2). Three lines, #1, #6, and #14, had larger rosette diameter than non-transgenic plants at 14 DAS, but the rosette diameter was smaller at 21 DAS (Figure 7, Table 2). In three lines, #4, #5, and #13, the rosette diameter in transgenic plants was larger than non-transgenic plants only at 21 DAS (Figure 7, Table 2). A transgenic line, #9, showed a smaller rosette diameter than non-transgenic plants at both 14 and 21 DAS, and plants had pleiotropic seedling size (Figure S3). Although there was no rosette size difference in #19 compared with non-transgenic controls, all plants with transgenes showed narrow and light green leaves (Figure S3). We confirmed the overexpression in some genes compared with control plants (Figure S4).
Table 2.
List of genes for producing overexpressed transgenic plants.
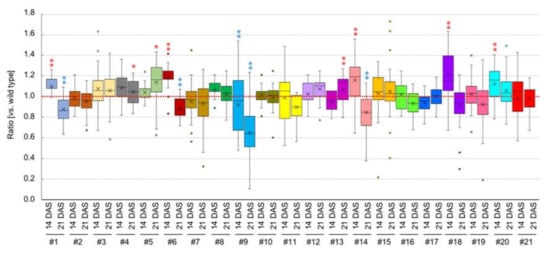
Figure 7.
Rosette diameter of overexpressed plants. y-axis shows the ratio of rosette diameter in transgenic plants compared with non-transgenic plants. *p < 0.05, ** p < 0.01 (Student’s t-test). Blue and red asterisks represent decrease and increase plant size, respectively.
3. Discussion
One of the advantages of F1 hybrid cultivars in crops and vegetables is their uniform phenotype, which makes management of cultivation easier [28]. This uniformity of F1 hybrid cultivars is considered to be due to the high rate of homozygosity of the parental lines. As A. thaliana has a high rate of inbreeding [29], the genetic background in the C24xCol hybrid should be identical in individual plants, and C24xCol hybrids should show a similar level of heterosis in each plant. However, our results showed variation in plant size among individual F1 plants; the biggest rosette diameter is more than two times larger than the smallest. This increased leaf area in big-sized F1 plants is due to increased cell size. These results suggest the possibility that heterosis level and/or plant size are affected by epigenetic changes because of their identical genetic background. One possibility is that there is epigenetic variation within individual F1 plants. Non-additive DNA methylation occurs in the F1 by the allelic interaction of different DNA methylation states in parental lines [30,31], and the DNA methylation state might not be uniform in individual F1 plants. The epigenetic inbred (epiRIL) lines, which have a difference of DNA methylation level with the same genetic background, show higher divergence of flowering time and plant height compared to wild-type Col [32]. This phenomenon could explain plant size variation in individual F1 plants. The other possibility is that epigenetic variation was generated by environmental effects. One candidate is differences of light intensity as in this hybrid, there is increased heterosis under increased light intensity [21]. In our experiments, plants were grown under well-controlled conditions and differences of light intensity between plants were small (150–180 μmol·m−2·s−1), but this small difference might result in sizes of F1 plants varying.
We identified differentially expressed genes between big- and medium-sized F1 plants, and approximately 30% of genes showing B1&B2 > M1&M2 expression overlapped with genes upregulated in heterotic F1 plants (C24/Col and C24/Ler) compared with MPV. These genes were categorized into response to wounding, defense response, and response to plant hormones such as ethylene (ET), abscisic acid (ABA), salicylic acid (SA), and jasmonic acid (JA). Transcriptome analysis comparing heterotic F1 and MPV suggested several possibilities to explain the heterosis. (1) Decreased expression levels of defence-responsive genes may play an important role in heterosis by reducing energy cost for defence and releasing resource allocation to plant growth [17,24,33]. (2) A reduction in SA concentration with lower expression levels of SA responsive genes is associated with increased biomass [17]. (3) Negative effects of ET on heterosis have been suggested [34]. (4) Delayed senescence could be involved in heterosis at later developmental stages [35]. In our transcriptome data, similar categories were overrepresented in differentially expressed genes between big- and medium-sized F1 plants. However, sometimes the direction of change of expression levels does not match between big- vs. medium-sized F1 plants and the heterotic F1 vs. MPV; i.e., in big-sized F1 plants, more defence-responsive genes were upregulated, and higher expression levels in genes involved in response to ET or SA stimulus were found. These results suggest that these genes are involved in determining the plant size, and any further increase in plant size of heterotic F1 plants may result from a different expression pattern to non-additive expression.
Loss of DDM1 function showed a decreased heterosis level compared with wild-type F1 [27,36]. The 25 genes showing B1&B2 > M1&M2 expression overlapped with downregulated genes in wild-type F1 compared with ddm1 F1, i.e., an opposite expression pattern. The relationship between increased/decreased expression level and plant size does not necessarily match in the big-size F1 plants and the decreased plant size in ddm1 F1, and changing expression levels of these genes might be involved in the change of plant size.
Heterosis has been suggested to affect ET biosynthesis or signal transduction, and overexpression of the ET biosynthesis gene, 1-aminocyclopropane-1- carboxylate synthase 6 (ACS6), eliminated heterosis [34]. In this study, we made transgenic plants overexpressing eight genes encoding ET response factors, but overexpressing these genes did not lead to any change of plant size, except for plants overexpressing ETHYLENE RESPONSIVE ELEMENT BINDING FACTOR22 (ERF22), which showed an increased plant size at 21 DAS. Expansin (EXP) and Xyloglucan endotransglucosylases/hydrolase (XTH) are known to be involved in loosening cell wall architecture and cell enlargement [37]. Upregulation of XTH genes has been observed in heterotic hybrids and hybrid mimic lines [17,38]. In this study, overexpression of β-expansin 1 (EXPB1) induced increased plant size at 14 DAS, while overexpression of EXPB3 did not change the plant size. Overexpressing XTH19 showed variation of plant size, and the average plant size was decreased. XTH19 showed tissue-specific expression, specifically in roots [39]. Constitutive XTH19 expression in vegetative tissues may be negative for vegetative development. A growth–defence tradeoffs model has been proposed for heterosis or hybrid necrosis phenomena [1,40,41]. Overexpressing CARBON/NITROGEN INSENSITIVE 1 (CNI1) or Plant defensin 1.2b (PDF1.2b) led to increased plant size at 21 DAS. CNI1 is important for the carbon/nitrogen response during the early post-germinative growth, and overexpression of CNI1 causes less sensitivity to change in C/N conditions [42]. CNI1 expression was induced by Pseudomonas syringae pv. tomato DC3000 (Pst. DC3000) infection, and overexpression of CNI1 increased resistance to Pst. DC3000 [43]. In addition, overexpression of CNI1 suppressed the senescence phenotype [44]. PDF1.2b encodes plant defensin and is involved in non-host pre-invasive defence response [45]. Most transcriptome analyses comparing heterotic inter- or intra-hybrids and their parents have shown the downregulation of defence-responsive genes in F1 plants [14,17,33,46,47]. However, upregulation of some defence-response genes occurred in non-additively expressed genes, suggesting that upregulation of these genes might have a positive effect on plant growth. Overexpression of some genes, which were upregulated in big-sized F1 plants, showed an increased plant size at 14 or 21 DAS and a large variation of plant size within the lines. However, increased plant size was not observed at all time points. As plant size or heterosis is regulated by tissue- and stage-dependent transcriptional networks, a possible reason is that overexpression of a single gene is not enough to generate the phenotype, and overexpression of multiple genes may be required. Alternatively, changes in gene expression at particular time points may be important for increased plant size.
We found a variation in size in F1 plants of A. thaliana and identified genes that were differentially expressed between big- and medium-sized F1 plants. These differentially expressed genes tended to overlap with non-additively expressed genes in heterotic F1; however, increases and decreases in expression levels in big-sized plants/heterotic F1 did not always match. Non-additively expressed genes showed tissue and stage specificity [1]; e.g., upregulation of chloroplast-targeted genes was limited to a few days [14,18,19]. We suggest that changes in the expression of these genes, not the constitutively increased or decreased expression levels, may be important for increased plant size. Having variability in plant size in the F1 generation is not a suitable phenotype for F1 hybrid cultivars of crops, but this phenomenon may allow exploration of the factors necessary for maximizing the potential plant size or for stability of heterosis regardless of environmental effects.
4. Materials and Methods
4.1. Plant Materials and Growth Condition
F1 between C24 and Col accessions and its F2 population were used for analysis of plant size, microarray, and qPCR. Plants were grown in a controlled environment (22 °C) under fluorescent lights (150–180 μmol·m−2·s−1) and a 16-h/8-h (day/night) photoperiod. Plants were grown in plastic dishes containing Murashige and Skoog (MS) agar medium supplemented with 1.0% sucrose (pH 5.7) and were transferred to soil at 14 DAS.
We prepared 15 individual C24 (female) and Col (male) plants and crossed one combination each. We used the C24 line as female, and multiple flowers were used for making the F1 [14]. Using 13 of 15 F1 lines, we found a higher variation of rosette diameter at 14 DAS in C24xCol hybrids compared with parental lines (Figure S1). Furthermore, in this study, two F1 lines were selected for examination of variation of rosette diameter at 14 DAS, and one population was used for microarray analysis and the other population for qPCR. The other three F1 lines were used for examination of rosette diameter at 10 and 14 DAS and leaf area and cell size at 14 DAS.
F2 seeds were harvested from individual big- and medium-sized F1 plants.
4.2. Measuring Seed Size, Rosette Diameter, Leaf Area, and Cell Size
Dry mature seed was photographed under a stereoscopic microscope, and sizes were determined with Image-J software (http://rsb.info.nih.gov/ij/). Rosette diameter was measured for evaluation of plant size and equals the maximum diameter of the rosette as measured between the two largest leaves. Rosette diameter depends on leaf blade and petiole length. The first and second leaves at 14 DAS were fixed in a formalin/acetic acid/alcohol solution (ethanol/acetic acid/ formalin = 16:1:1). The leaf was photographed under a stereoscopic microscope, and sizes were determined with Image-J software. After examination of leaf area, they were cleared in a chloral hydrate/glycerol/water solution (chloral hydrate/H2O/glycerol = 8:2:1), and the samples were photographed under Nomarski optics. The palisade cell number per fixed unit area in the subepidermal layer of the centre of the leaf blade between the midvein and the leaf margin was counted. Three independent experiments were performed for examination of seed size, leaf area, and cell size. Statistical comparisons of seed size, leaf area, and cell size were performed using Student’s t-test (p < 0.05).
4.3. Expression Analysis
Total RNA was isolated from aerial tissues at 14 DAS in F1 or F2 plants using the SV Total RNA Isolation System (Promega). From 500 ng total RNA, first-strand cDNA was synthesized using random primers by SuperScript III Reverse Transcriptase (Invitrogen). Prior to qPCR, the specificity of the primer set for each gene was first tested by electrophoresis of PCR-amplified products using EmeraldAmp MAX PCR Master Mix (Takara bio) on 2.0% agarose gel in which single products were observed. Absence of genomic DNA contamination was confirmed by the PCR of no RT control. RT-PCR conditions were 95 °C for 3 min followed by 30 cycles of 95 °C for 30 s, 55 °C for 30 s, and 72 °C for 30 s. qPCR was performed using a Rotor-Gene 3000 Real-Time Cycler (Qiagen). The cDNA was amplified using Platinum Taq DNA polymerase (Invitrogen). PCR conditions were 95 °C for 2 min followed by 40 cycles of 95 °C for 30 s, 55 °C for 30 s, and 72 °C for 30 s. Expression levels of genes were calculated relative to Isopentenyl pyrophosphate-dimethylallyl pyrophosphate isomerase 2 (IPP2) genes using the comparative quantification analysis method with Rotor-Gene 6 (Qiagen). Data presented are the average and standard error (s.e.) from two or three biological and three experimental replications. Primer sequences are shown in Table S8.
4.4. Microarray Analysis
Arabidopsis ATH1 Genome Array (Affymetrix) was used for transcriptome analysis. Total RNA (100 ng) from aerial tissues at 14 DAS from big- and medium-sized F1 plants was used for probe synthesis. Biotinylated cRNAs were synthesized using the IVT Labeling Kit (Affymetrix). Hybridization and scanning were performed according to the manufacturer’s instructions. Two independent biological replicates were performed. Data were analyzed following [14].
4.5. Gene Ontology Analysis
Analysis for enrichment of gene functional ontology terms was completed using the gene ontology (GO) tool agriGO [48]. The background reference for microarray analysis was the list of genes that displayed expression above-background in either the parental or F1 samples from each platform [14]. Statistical tests for enrichment of functional terms used the hypergeometric test and false discovery rate (FDR) correction for multiple testing to a level of 5% FDR.
4.6. Constructs and Plant Transformation
The complete coding sequence (CDS) were amplified by RT-PCR using gene-specific primers designed to add Xba I and Sac I or Bam HI and Sac I restriction sites to the 5′- and 3′-ends, and PCR products were cloned into pGEM T-easy vector (Promega). The DNA fragment was then inserted into Xba I and Sac I or Bam HI and Sac I restriction sites of the plant expression vector pBI121 under the control of CaMV35S promoter. The constructs were transformed into Agrobacterium tumefaciens strain EHA105, and transformation of Col accession was carried out by the floral dip procedure [49]. Positive transformants were selected in kanamycin (30 μg/mL) plates and confirmed by PCR. Primers used for constructing the vector are listed in Table S8.
We selected T2 lines with a single transgene by segregation analysis using T2 plants with chi-square test. T2 plants were grown in plastic dishes containing MS agar medium supplemented with 1.0% sucrose (pH 5.7). At 14 DAS, they were transferred to soil and grown under long-day conditions (16 h light) at 22 °C. The presence or absence of transgene was examined by PCR using neomycin phosphotransferase II (NPTII) primer set (Table S8).
Supplementary Materials
The following are available online at https://www.mdpi.com/2223-7747/9/4/414/s1, Figure S1: Distribution of rosette diameter at 14 DAS in parental lines and their reciprocal hybrids. Figure S2: Expression pattern of genes upregulated in big-sized F1 plants compared with medium-sized F1 plants and downregulated in ddm1 F1 compared with wild-type F1. Figure S3: Plant phenotypes of transgenic plant lines of #9 and #19 at 21 DAS. Figure S4: Confirmation of transgene expression levels by RT-PCR. Table S1: Differentially expressed genes between big- and medium-sized F1 plants. Table S2: Genes showing differential expression between big- and medium-sized F1 plants and upregulation in C24/Col and C24/Ler hybrids. Table S3: Validation of microarray expression data by quantitative RT-PCR. Table S4: Comparison of gene expression levels between big- and medium-sized F2 plants. Table S5: GO function term overrepresented in genes showing B1&B2 > M1&M2 expression. Table S6: GO function term overrepresented in genes showing B1&B2 < M1&M2 expression. Table S7: GO function term overrepresented in genes showing B1&B2 > M1&M2 expression and upregulation in both C24/Col and C24/Ler hybrids. Table S8: Sequences of primers used in this study.
Author Contributions
Conceptualization, T.K., R.F., and E.S.D.; methodology, validation, and formal analysis, H.M., T.K., M.S., N.M., A.A., and R.F.; writing—original draft preparation, H.M., T.K., E.S.D., and R.F.; writing—review and editing, H.M., T.K., E.S.D., and R.F.; funding acquisition, R.F. All authors have read and agreed to the published version of the manuscript.
Funding
This research was funded by Grant-in-Aid Young Scientists (A) (15H05614), Fund for the Promotion of Joint Research (16KK0171), and Grant-in-Aid for Scientific Research (B) (19H02947) by Japan Society for the Promotion of Science (JSPS).
Acknowledgments
We thank Chika Ide for her technical assistance. We also thank Kenji Osabe and Daniel J. Shea for their helpful comments and manuscript editing.
Conflicts of Interest
The authors declare no conflict of interest.
References
- Fujimoto, R.; Uezono, K.; Ishikura, S.; Osabe, K.; Peacock, W.J.; Dennis, E.S. Recent research on the mechanism of heterosis is important for crop and vegetable breeding systems. Breed. Sci. 2018, 68, 145–158. [Google Scholar] [CrossRef] [PubMed]
- Crow, J.F. 90 years ago: The beginning of hybrid maize. Genetics 1998, 148, 923–928. [Google Scholar]
- Lippman, Z.B.; Zamir, D. Heterosis: Revisiting the magic. Trends Genet. 2007, 23, 60–66. [Google Scholar] [CrossRef]
- Birchler, J.A.; Yao, H.; Chudalayandi, S.; Vaiman, D.; Veitia, R.A. Heterosis. Plant Cell 2010, 22, 2105–2112. [Google Scholar] [CrossRef]
- Chen, Z.J. Genomic and epigenetic insights into the molecular bases of heterosis. Nat. Rev. Genet. 2013, 14, 471–482. [Google Scholar] [CrossRef] [PubMed]
- Schnable, P.S.; Springer, N.M. Progress toward understanding heterosis in crop plants. Annu. Rev. Plant Biol. 2013, 64, 71–88. [Google Scholar] [CrossRef] [PubMed]
- Groszmann, M.; Greaves, I.K.; Fujimoto, R.; Peacock, W.J.; Dennis, E.S. The role of epigenetics in hybrid vigour. Trends Genet. 2013, 29, 684–690. [Google Scholar] [CrossRef]
- Miyaji, N.; Fujimoto, R. Hybrid vigor: Importance of epigenetic processes and consequences for breeding. Adv. Bot. Res. 2018, 88, 247–275. [Google Scholar]
- Birchler, J.A.; Auger, D.L.; Riddle, N.C. In Search of the molecular basis of heterosis. Plant Cell 2003, 15, 2236–2239. [Google Scholar] [CrossRef]
- Swanson-Wagner, R.A.; Jia, Y.; DeCook, R.; Borsuk, L.A.; Nettleton, D.; Schnable, P.S. All possible modes of gene action are observed in a global comparison of gene expression in a maize F1 hybrid and its inbred parents. Proc. Natl. Acad. Sci. USA 2006, 103, 6805–6810. [Google Scholar] [CrossRef]
- Wei, G.; Tao, Y.; Liu, G.; Chen, C.; Luo, R.; Xia, H.; Gan, Q.; Zeng, H.; Lu, Z.; Han, Y.; et al. A transcriptomic analysis of superhybrid rice LYP9 and its parents. Proc. Natl. Acad. Sci. USA 2009, 106, 7695–7701. [Google Scholar] [CrossRef] [PubMed]
- He, G.; Zhu, X.; Elling, A.A.; Chen, L.; Wang, X.; Guo, L.; Liang, M.; He, H.; Zhang, H.; Chen, F.; et al. Global epigenetic and transcriptional trends among two rice subspecies and their reciprocal hybrids. Plant Cell 2010, 22, 17–33. [Google Scholar] [CrossRef] [PubMed]
- Song, G.S.; Zhai, H.L.; Peng, Y.G.; Zhang, L.; Wei, G.; Chen, X.Y.; Xiao, Y.G.; Wang, L.; Chen, Y.J.; Wu, B.; et al. Comparative transcriptional profiling and preliminary study on heterosis mechanism of super-hybrid rice. Mol. Plant. 2010, 3, 1012–1025. [Google Scholar] [CrossRef] [PubMed]
- Fujimoto, R.; Taylor, J.M.; Shirasawa, S.; Peacock, W.J.; Dennis, E.S. Heterosis of Arabidopsis hybrids between C24 and Col is associated with increased photosynthesis capacity. Proc. Natl. Acad. Sci. USA 2012, 109, 7109–7114. [Google Scholar] [CrossRef]
- Meyer, R.C.; Witucka-Wall, H.; Becher, M.; Blacha, A.; Boudichevskaia, A.; Dörmann, P.; Fiehn, O.; Friedel, S.; von Korff, M.; Lisec, J.; et al. Heterosis manifestation during early Arabidopsis seedling development is characterized by intermediate gene expression and enhanced metabolic activity in the hybrids. Plant J. 2012, 71, 669–683. [Google Scholar] [CrossRef]
- Shen, H.; He, H.; Li, J.; Chen, W.; Wang, X.; Guo, L.; Peng, Z.; He, G.; Zhong, S.; Qi, Y.; et al. Genome-wide analysis of DNA methylation and gene expression changes in two Arabidopsis ecotypes and their reciprocal hybrids. Plant Cell 2012, 24, 875–892. [Google Scholar] [CrossRef]
- Groszmann, M.; Gonzalez-Bayon, R.; Lyons, R.L.; Greaves, I.K.; Kazan, K.; Peacock, W.J.; Dennis, E.S. Hormone-regulated defense and stress response networks contribute to heterosis in Arabidopsis F1 hybrids. Proc. Natl. Acad. Sci. USA 2015, 112, E6397–E6406. [Google Scholar] [CrossRef]
- Zhu, A.; Greaves, I.K.; Liu, P.C.; Wu, L.; Dennis, E.S.; Peacock, W.J. Early changes of gene activity in developing seedlings of Arabidopsis hybrids relative to parents may contribute to hybrid vigour. Plant J. 2016, 88, 597–607. [Google Scholar] [CrossRef]
- Saeki, N.; Kawanabe, T.; Ying, H.; Shimizu, M.; Kojima, M.; Abe, H.; Okazaki, K.; Kaji, M.; Taylor, J.M.; Sakakibara, H.; et al. Molecular and cellular characteristics of hybrid vigour in a commercial hybrid of Chinese cabbage. BMC Plant. Biol. 2016, 16, 45. [Google Scholar] [CrossRef]
- Barth, S.; Busimi, A.K.; Utz, H.F.; Melchinger, A.E. Heterosis for biomass yield and related traits in five hybrids of Arabidopsis thaliana L. Heynh. Heredity 2003, 91, 36–42. [Google Scholar] [CrossRef]
- Meyer, R.C.; Törjék, O.; Becher, M.; Altmann, T. Heterosis of biomass production in Arabidopsis: Establishment during early development. Plant Physiol. 2004, 134, 1813–1823. [Google Scholar] [CrossRef] [PubMed]
- Moore, S.; Lukens, L. An evaluation of Arabidopsis thaliana hybrid traits and their genetic control. G3 2011, 1, 571–579. [Google Scholar] [CrossRef] [PubMed]
- Seymour, D.K.; Chae, E.; Grimm, D.G.; Pizarro, C.M.; Habring-Müller, A.; Vasseur, F.; Rakitsch, B.; Borgwardt, K.M.; Koenig, D.; Weigel, D. Genetic architecture of nonadditive inheritance in Arabidopsis thaliana hybrids. Proc. Natl. Acad. Sci. USA 2016, 113, E7317–E7326. [Google Scholar] [CrossRef] [PubMed]
- Yang, M.; Wang, X.; Ren, D.; Huang, H.; Xu, M.; He, G.; Deng, X.W. Genomic architecture of biomass heterosis in Arabidopsis. Proc. Natl. Acad. Sci. USA 2017, 114, 8101–8106. [Google Scholar] [CrossRef]
- Vasseur, F.; Fouqueau, L.; de Vienne, D.; Nidelet, T.; Violle, C.; Weigel, D. Nonlinear phenotypic variation uncovers the emergence of heterosis in Arabidopsis thaliana. PLoS Biol. 2019, 17, e3000214. [Google Scholar] [CrossRef]
- Groszmann, M.; Gonzalez-Bayon, R.; Greaves, I.K.; Wang, L.; Huen, A.K.; Peacock, W.J.; Dennis, E.S. Intraspecific Arabidopsis hybrids show different patterns of heterosis despite the close relatedness of the parental genomes. Plant Physiol. 2014, 166, 265–280. [Google Scholar] [CrossRef]
- Zhang, Q.; Li, Y.; Xu, T.; Srivastava, A.K.; Wang, D.; Zeng, L.; Yang, L.; He, L.; Zhang, H.; Zheng, Z.; et al. The chromatin remodeler DDM1 promotes hybrid vigor by regulating salicylic acid metabolism. Cell Discov. 2016, 2, 16027. [Google Scholar] [CrossRef]
- Berlan, J.P. Hybrid corn and the unsettled question of heterosis. J. Genet. 2018, 97, 1075–1082. [Google Scholar] [CrossRef]
- Bomblies, K.; Yant, L.; Laitinen, R.A.; Kim, S.T.; Hollister, J.D.; Warthmann, N.; Fitz, J.; Weigel, D. Local-scale patterns of genetic variability, outcrossing, and spatial structure in natural stands of Arabidopsis thaliana. PLoS Genet. 2010, 6, e1000890. [Google Scholar] [CrossRef]
- Greaves, I.K.; Groszmann, M.; Ying, H.; Taylor, J.M.; Peacock, W.J.; Dennis, E.S. Trans chromosomal methylation in Arabidopsis hybrids. Proc. Natl. Acad. Sci. USA 2012, 109, 3570–3575. [Google Scholar] [CrossRef]
- Greaves, I.K.; Groszmann, M.; Dennis, E.S.; Peacock, W.J. Trans-chromosomal methylation. Epigenetics 2012, 7, 800–805. [Google Scholar] [CrossRef] [PubMed]
- Hu, Y.; Morota, G.; Rosa, G.J.M.; Gianola, D. Prediction of plant height in Arabidopsis thaliana using DNA methylation data. Genetics 2015, 201, 779–793. [Google Scholar] [CrossRef] [PubMed]
- Miller, M.; Song, Q.; Shi, X.; Juenger, E.T.; Chen, Z.J. Natural variation in timing of stress-responsive gene expression predicts heterosis in intraspecific hybrids of Arabidopsis. Nat. Commun. 2015, 6, 7453. [Google Scholar] [CrossRef] [PubMed]
- Song, Q.; Ando, A.; Xu, D.; Fang, L.; Zhang, T.; Huq, E.; Qiao, H.; Deng, X.W.; Chen, Z.J. Diurnal down-regulation of ethylene biosynthesis mediates biomass heterosis. Proc. Natl. Acad. Sci. USA 2018, 115, 5606–5611. [Google Scholar] [CrossRef]
- Gonzalez-Bayon, R.; Shen, Y.; Groszmann, M.; Zhu, A.; Wang, A.; Allu, A.D.; Dennis, E.S.; Peacock, W.J.; Greaves, I.K. Senescence and defense pathways contribute to heterosis. Plant Physiol. 2019, 180, 240–252. [Google Scholar] [CrossRef] [PubMed]
- Kawanabe, T.; Ishikura, S.; Miyaji, N.; Sasaki, T.; Wu, L.M.; Itabashi, E.; Takada, S.; Shimizu, M.; Takasaki-Yasuda, T.; Osabe, K.; et al. Role of DNA methylation in hybrid vigor in Arabidopsis thaliana. Proc. Natl. Acad. Sci. USA 2016, 113, E6704–E6711. [Google Scholar] [CrossRef]
- Majda, M.; Robert, S. The role of auxin in cell wall expansion. Int. J. Mol. Sci. 2018, 19, 951. [Google Scholar] [CrossRef]
- Wang, L.; Wu, L.M.; Greaves, I.K.; Dennis, E.S.; William James Peacock, W.J. In Arabidopsis hybrids and Hybrid Mimics, up-regulation of cell wall biogenesis is associated with the increased plant size. Plant Direct 2019, 3, 1–15. [Google Scholar] [CrossRef]
- Pitaksaringkarn, W.; Matsuoka, K.; Asahina, M.; Miura, K.; Sage-Ono, K.; Ono, M.; Yokoyama, R.; Nishitani, K.; Ishii, T.; Iwai, H.; et al. XTH20 and XTH19 regulated by ANAC071 under auxin flow are involved in cell proliferation in incised Arabidopsis inflorescence stems. Plant J. 2014, 80, 604–614. [Google Scholar] [CrossRef]
- Huot, B.; Yao, J.; Montgomery, B.L.; He, S.Y. Growth-defense tradeoffs in plants: A balancing act to optimize fitness. Mol. Plant 2014, 7, 1267–1287. [Google Scholar] [CrossRef]
- Tonosaki, K.; Osabe, K.; Kawanabe, T.; Fujimoto, R. The importance of reproductive barriers and the effect of allopolyploidization on crop breeding. Breed. Sci. 2016, 66, 333–349. [Google Scholar] [CrossRef] [PubMed]
- Sato, T.; Maekawa, S.; Yasuda, S.; Sonoda, Y.; Katoh, E.; Ichikawa, T.; Nakazawa, M.; Seki, M.; Shinozaki, K.; Matsui, M.; et al. CNI1/ATL31, a RING-type ubiquitin ligase that functions in the carbon/nitrogen response for growth phase transition in Arabidopsis seedlings. Plant J. 2009, 60, 852–864. [Google Scholar] [CrossRef] [PubMed]
- Maekawa, S.; Sato, T.; Asada, Y.; Yasuda, S.; Yoshida, M.; Chiba, Y.; Yamaguchi, J. The Arabidopsis ubiquitin ligases ATL31 and ATL6 control the defense response as well as the carbon/nitrogen response. Plant Mol. Biol. 2012, 79, 217–227. [Google Scholar] [CrossRef] [PubMed]
- Aoyama, S.; Reyes, T.H.; Guglielminetti, L.; Lu, Y.; Morita, Y.; Sato, T.; Yamaguchi, J. Ubiquitin ligase ATL31 functions in leaf senescence in response to the balance between atmospheric CO2 and nitrogen availability in Arabidopsis. Plant Cell Physiol. 2014, 55, 293–305. [Google Scholar] [CrossRef]
- Hiruma, K.; Nishiuchi, T.; Kato, T.; Bednarek, P.; Okuno, T.; Schulze-Lefert, S.; Takano, Y. Arabidopsis ENHANCED DISEASE RESISTANCE 1 is required for pathogen-induced expression of plant defensins in nonhost resistance, and acts through interference of MYC2-mediated repressor function. Plant J. 2011, 67, 980–992. [Google Scholar] [CrossRef]
- Wang, J.; Tian, L.; Lee, H.S.; Wei, N.E.; Jiang, H.; Watson, B.; Madlung, A.; Osborn, T.C.; Doerge, R.W.; Comai, L.; et al. Genomewide nonadditive gene regulation in Arabidopsis allotetraploids. Genetics 2006, 172, 507–517. [Google Scholar] [CrossRef]
- Fujimoto, R.; Taylor, J.M.; Sasaki, T.; Kawanabe, T.; Dennis, E.S. Genome wide gene expression in artificially synthesized amphidiploids of Arabidopsis. Plant Mol. Biol. 2011, 77, 419–431. [Google Scholar] [CrossRef]
- Du, Z.; Zhou, X.; Ling, Y.; Zhang, Z.; Su, Z. agriGO: A GO analysis toolkit for the agricultural community. Nucleic Acids Res. 2010, 38, W64–W70. [Google Scholar] [CrossRef]
- Clough, S.J.; Bent, A.F. Floral dip: A simplified method for Agrobacterium-mediated transformation of Arabidopsis thaliana. Plant J. 1998, 16, 735–743. [Google Scholar] [CrossRef]
© 2020 by the authors. Licensee MDPI, Basel, Switzerland. This article is an open access article distributed under the terms and conditions of the Creative Commons Attribution (CC BY) license (http://creativecommons.org/licenses/by/4.0/).