Alternative Polyadenylation and Salicylic Acid Modulate Root Responses to Low Nitrogen Availability

 , and
, and 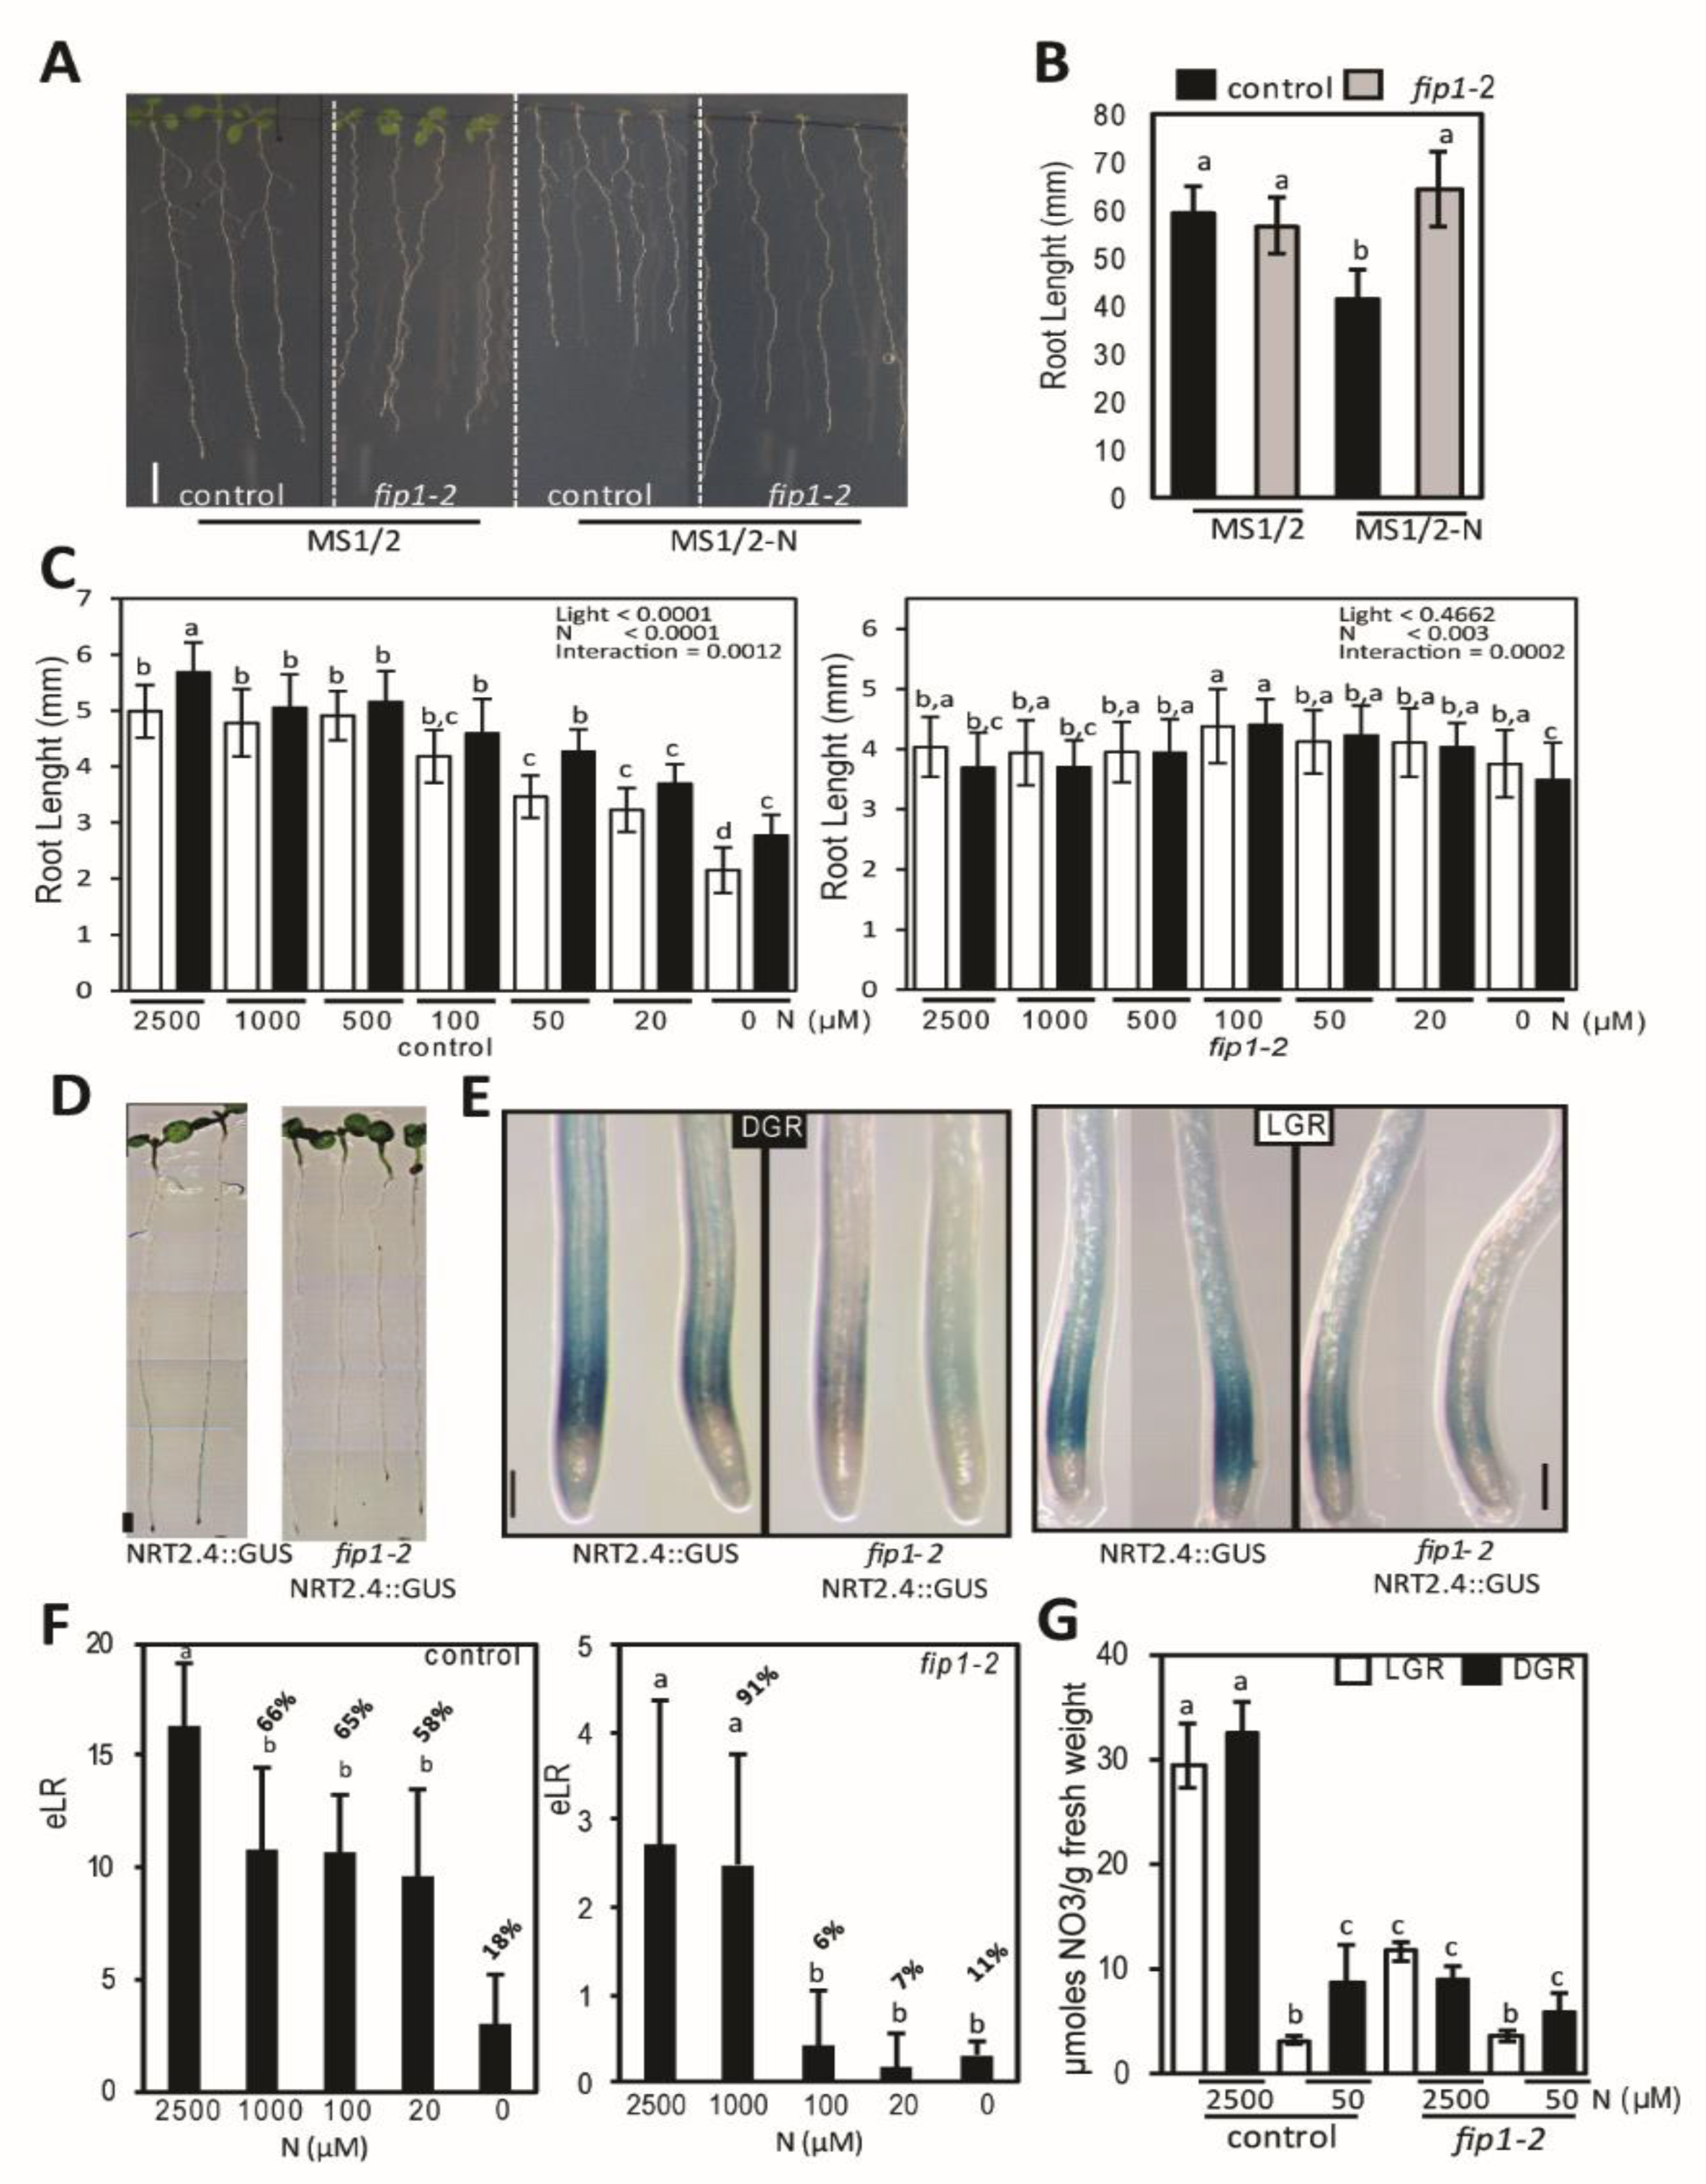
Abstract
1. Introduction
2. Results
2.1. fip1-2 Mutant has an Altered N Starvation Response in Roots
2.2. FIP1 Regulates Alternative Polyadenylation in Response to Low Nitrogen
2.3. Hormonal Effect on Nitrogen-Starved Dark Grown Roots Seedlings
3. Discussion
4. Conclusions
5. Material and Methods
5.1. Plant Material
5.2. Root Growth Assays, GUS Staining and Microscopic Analysis
5.3. Poly(A) Tag Library Preparation, Sequencing and Analysis
5.4. Hormone and Ionome Quantification
5.5. Nitrate Quantification
5.6. Statistical Analyses
Supplementary Materials
Author Contributions
Funding
Acknowledgments
Conflicts of Interest
References
- Marschner, H. 7—Nitrogen Fixation. In Mineral Nutrition of Higher Plants, 2nd ed.; Marschner, H., Ed.; Academic Press: London, UK, 1995; pp. 201–228. [Google Scholar] [CrossRef]
- Gruber, B.D.; Giehl, R.F.; Friedel, S.; von Wiren, N. Plasticity of the Arabidopsis root system under nutrient deficiencies. Plant Physiol. 2013, 163, 161–179. [Google Scholar] [CrossRef] [PubMed]
- Perianez-Rodriguez, J.; Manzano, C.; Moreno-Risueno, M.A. Post-embryonic organogenesis and plant regeneration from tissues: Two sides of the same coin? Front. Plant Sci. 2014, 5, 219. [Google Scholar] [CrossRef]
- Dubrovsky, J.G.; Gambetta, G.A.; Hernandez-Barrera, A.; Shishkova, S.; Gonzalez, I. Lateral root initiation in Arabidopsis: Developmental window, spatial patterning, density and predictability. Ann. Bot. (Lond.) 2006, 97, 903–915. [Google Scholar] [CrossRef] [PubMed]
- Dubrovsky, J.G.; Sauer, M.; Napsucialy-Mendivil, S.; Ivanchenko, M.G.; Friml, J.; Shishkova, S.; Celenza, J.; Benkova, E. Auxin acts as a local morphogenetic trigger to specify lateral root founder cells. Proc. Natl. Acad. Sci. USA 2008, 105, 8790–8794. [Google Scholar] [CrossRef] [PubMed]
- Forde, B.G. Nitrate transporters in plants: Structure, function and regulation. Biochim. et Biophys. Acta (BBA) Biomembr. 2000, 1465, 219–235. [Google Scholar] [CrossRef]
- Kiba, T.; Feria-Bourrellier, A.B.; Lafouge, F.; Lezhneva, L.; Boutet-Mercey, S.; Orsel, M.; Brehaut, V.; Miller, A.; Daniel-Vedele, F.; Sakakibara, H.; et al. The Arabidopsis nitrate transporter NRT2.4 plays a double role in roots and shoots of nitrogen-starved plants. Plant Cell 2012, 24, 245–258. [Google Scholar] [CrossRef]
- Di Giammartino, D.C.; Nishida, K.; Manley, J.L. Mechanisms and consequences of alternative polyadenylation. Mol. Cell 2011, 43, 853–866. [Google Scholar] [CrossRef]
- Chen, M.; Manley, J.L. Mechanisms of alternative splicing regulation: Insights from molecular and genomics approaches. Nat. Rev. Mol. Cell Biol. 2009, 10, 741–754. [Google Scholar] [CrossRef]
- Lutz, C.S.; Moreira, A. Alternative mRNA polyadenylation in eukaryotes: An effective regulator of gene expression. Wiley Interdiscip. Rev. RNA 2011, 2, 23–31. [Google Scholar] [CrossRef]
- Akman, H.B.; Erson-Bensan, A.E. Alternative polyadenylation and its impact on cellular processes. Microrna 2014, 3, 2–9. [Google Scholar] [CrossRef]
- Tellez-Robledo, B.; Manzano, C.; Saez, A.; Navarro-Neila, S.; Silva-Navas, J.; de Lorenzo, L.; Gonzalez-Garcia, M.P.; Toribio, R.; Hunt, A.G.; Baigorri, R.; et al. The polyadenylation factor FIP1 is important for plant development and root responses to abiotic stresses. Plant J. 2019, 99, 1203–1219. [Google Scholar] [CrossRef] [PubMed]
- Cao, J.; Ye, C.; Hao, G.; Dabney-Smith, C.; Hunt, A.G.; Li, Q.Q. Root Hair Single Cell Type Specific Profiles of Gene Expression and Alternative Polyadenylation Under Cadmium Stress. Front. Plant Sci. 2019, 10, 589. [Google Scholar] [CrossRef] [PubMed]
- De Lorenzo, L.; Sorenson, R.; Bailey-Serres, J.; Hunt, A.G. Noncanonical Alternative Polyadenylation Contributes to Gene Regulation in Response to Hypoxia. Plant Cell 2017, 29, 1262–1277. [Google Scholar] [CrossRef] [PubMed]
- Hong, L.; Ye, C.; Lin, J.; Fu, H.; Wu, X.; Li, Q.Q. Alternative polyadenylation is involved in auxin-based plant growth and development. Plant J. 2018, 93, 246–258. [Google Scholar] [CrossRef]
- Wang, C.; Zhang, W.; Li, Z.; Li, Z.; Bi, Y.; Crawford, N.M.; Wang, Y. FIP1 Plays an Important Role in Nitrate Signaling and Regulates CIPK8 and CIPK23 Expression in Arabidopsis. Front. Plant Sci. 2018, 9, 593. [Google Scholar] [CrossRef]
- Li, Z.; Wang, R.; Gao, Y.; Wang, C.; Zhao, L.; Xu, N.; Chen, K.E.; Qi, S.; Zhang, M.; Tsay, Y.F.; et al. The Arabidopsis CPSF30-L gene plays an essential role in nitrate signaling and regulates the nitrate transceptor gene NRT1.1. New Phytol. 2017, 216, 1205–1222. [Google Scholar] [CrossRef]
- Silva-Navas, J.; Moreno-Risueno, M.A.; Manzano, C.; Téllez-Robledo, B.; Navarro-Neila, S.; Carrasco, V.; Pollmann, S.; Gallego, F.J.; del Pozo, J.C. Flavonols mediate root phototropism and growth through regulation of Proliferation to-Differentiation Transition. Plant Cell 2016, 28, 1372–1387. [Google Scholar] [CrossRef]
- Silva-Navas, J.; Moreno-Risueno, M.A.; Manzano, C.; Pallero-Baena, M.; Navarro-Neila, S.; Téllez-Robledo, B.; Garcia-Mina, J.M.; Baigorri, R.; Javier Gallego, F.; del Pozo, J.C. D-Root: A system to cultivate plants with the root in darkness or under different light conditions. Plant J. 2015, 84, 244–255. [Google Scholar] [CrossRef]
- Silva-Navas, J.; Conesa, C.M.; Saez, A.; Navarro-Neila, S.; Garcia-Mina, J.M.; Zamarreño, A.M.; Baigorri, R.; Swarup, R.; del Pozo, J.C. Role of cis-zeatin in root responses to phosphate starvation. New Phytol. 2019, 224, 242–257. [Google Scholar] [CrossRef]
- Vidal, E.A.; Araus, V.; Lu, C.; Parry, G.; Green, P.J.; Coruzzi, G.M.; Gutierrez, R.A. Nitrate-responsive miR393/AFB3 regulatory module controls root system architecture in Arabidopsis thaliana. Proc. Natl. Acad. Sci. USA 2010, 107, 4477–4482. [Google Scholar] [CrossRef]
- Manzano, C.; Ramirez-Parra, E.; Casimiro, I.; Otero, S.; Desvoyes, B.; De Rybel, B.; Beeckman, T.; Casero, P.; Gutierrez, C.; Del Pozo, J.C. Auxin and epigenetic regulation of SKP2B, an F-box that represses lateral root formation. Plant Physiol. 2012, 160, 749–762. [Google Scholar] [CrossRef] [PubMed]
- Anders, S.; Reyes, A.; Huber, W. Detecting differential usage of exons from RNA-seq data. Genome Res. 2012, 22, 2008–2017. [Google Scholar] [CrossRef] [PubMed]
- Maeda, Y.; Konishi, M.; Kiba, T. A NIGT1-centred transcriptional cascade regulates nitrate signalling and incorporates phosphorus starvation signals in Arabidopsis. Nat. Commun. 2018, 9, 1376. [Google Scholar] [CrossRef] [PubMed]
- Kiba, T.; Kudo, T.; Kojima, M.; Sakakibara, H. Hormonal control of nitrogen acquisition: Roles of auxin, abscisic acid, and cytokinin. J. Exp. Bot. 2011, 62, 1399–1409. [Google Scholar] [CrossRef] [PubMed]
- Krouk, G.; Ruffel, S.; Gutierrez, R.A.; Gojon, A.; Crawford, N.M.; Coruzzi, G.M.; Lacombe, B. A framework integrating plant growth with hormones and nutrients. Trends Plant Sci. 2011, 16, 178–182. [Google Scholar] [CrossRef]
- Landrein, B.; Formosa-Jordan, P.; Malivert, A.; Schuster, C.; Melnyk, C.W.; Yang, W.; Turnbull, C.; Meyerowitz, E.M.; Locke, J.C.W.; Jönsson, H. Nitrate modulates stem cell dynamics in Arabidopsis shoot meristems through cytokinins. Proc. Natl. Acad. Sci. USA 2018, 115, 1382–1387. [Google Scholar] [CrossRef]
- Ding, Y.; Sun, T.; Ao, K.; Peng, Y.; Zhang, Y.; Li, X.; Zhang, Y. Opposite Roles of Salicylic Acid Receptors NPR1 and NPR3/NPR4 in Transcriptional Regulation of Plant Immunity. Cell 2018, 173, 1454–1467.e15. [Google Scholar] [CrossRef]
- Delaney, T.P.; Uknes, S.; Vernooij, B.; Friedrich, L.; Weymann, K.; Negrotto, D.; Gaffney, T.; Gut-Rella, M.; Kessmann, H.; Ward, E.; et al. A central role of salicylic Acid in plant disease resistance. Science 1994, 266, 1247–1250. [Google Scholar] [CrossRef]
- Wildermuth, M.C.; Dewdney, J.; Wu, G.; Ausubel, F.M. Isochorismate synthase is required to synthesize salicylic acid for plant defence. Nature 2001, 414, 562–565. [Google Scholar] [CrossRef]
- Jirage, D.; Tootle, T.L.; Reuber, T.L.; Frost, L.N.; Feys, B.J.; Parker, J.E.; Ausubel, F.M.; Glazebrook, J. Arabidopsis thaliana PAD4 encodes a lipase-like gene that is important for salicylic acid signaling. Proc. Natl. Acad. Sci. USA 1999, 96, 13583–13588. [Google Scholar] [CrossRef]
- Armengot, L.; Marquès-Bueno, M.M.; Soria-Garcia, A.; Müller, M.; Munné-Bosch, S.; Martínez, M.C. Functional interplay between protein kinase CK2 and salicylic acid sustains PIN transcriptional expression and root development. Plant J. 2014, 78, 411–423. [Google Scholar] [CrossRef] [PubMed]
- Seyfferth, C.; Tsuda, K. Salicylic acid signal transduction: The initiation of biosynthesis, perception and transcriptional reprogramming. Front. Plant Sci. 2014, 5, 697. [Google Scholar] [CrossRef] [PubMed]
- Chen, X.; Yao, Q.; Gao, X.; Jiang, C.; Harberd, N.P.; Fu, X. Shoot-to-Root Mobile Transcription Factor HY5 Coordinates Plant Carbon and Nitrogen Acquisition. Curr. Biol. 2016, 26, 640–646. [Google Scholar] [CrossRef] [PubMed]
- Chai, T.; Zhou, J.; Liu, J.; Xing, D. LSD1 and HY5 antagonistically regulate red light induced-programmed cell death in Arabidopsis. Front. Plant Sci. 2015, 6, 292. [Google Scholar] [CrossRef] [PubMed]
- Chakrabarti, M.; Hunt, A.G. CPSF30 at the Interface of Alternative Polyadenylation and Cellular Signaling in Plants. Biomolecules 2015, 5, 1151–1168. [Google Scholar] [CrossRef] [PubMed]
- De Smet, I.; Signora, L.; Beeckman, T.; Inze, D.; Foyer, C.H.; Zhang, H. An abscisic acid-sensitive checkpoint in lateral root development of Arabidopsis. Plant J. 2003, 33, 543–555. [Google Scholar] [CrossRef]
- An, C.; Mou, Z. Salicylic Acid and its Function in Plant ImmunityF. J. Integr. Plant Biol. 2011, 53, 412–428. [Google Scholar] [CrossRef]
- Rivas-San Vicente, M.; Plasencia, J. Salicylic acid beyond defence: Its role in plant growth and development. J. Exp. Bot. 2011, 62, 3321–3338. [Google Scholar] [CrossRef]
- Shen, C.; Yang, Y.; Liu, K.; Zhang, L.; Guo, H.; Sun, T.; Wang, H. Involvement of endogenous salicylic acid in iron-deficiency responses in Arabidopsis. J. Exp. Bot. 2016, 67, 4179–4193. [Google Scholar] [CrossRef]
- Per, T.S.; Fatma, M.; Asgher, M.; Javied, S.; Khan, N.A. Salicylic Acid and Nutrients Interplay in Abiotic Stress Tolerance. In Salicylic Acid: A Multifaceted Hormone; Nazar, R., Iqbal, N., Khan, N.A., Eds.; Springer: Singapore, 2017; pp. 221–237. [Google Scholar] [CrossRef]
- Deus, A.C.F.; de Mello Prado, R.; de Cássia Félix Alvarez, R.; de Oliveira, R.L.L.; Felisberto, G. Role of Silicon and Salicylic Acid in the Mitigation of Nitrogen Deficiency Stress in Rice Plants. Silicon 2019. [Google Scholar] [CrossRef]
- Abreu, M.E.; Munné-Bosch, S. Salicylic acid deficiency in NahG transgenic lines and sid2 mutants increases seed yield in the annual plant Arabidopsis thaliana. J. Exp. Bot. 2009, 60, 1261–1271. [Google Scholar] [CrossRef] [PubMed]
- Glazebrook, J.; Rogers, E.E.; Ausubel, F.M. Isolation of Arabidopsis mutants with enhanced disease susceptibility by direct screening. Genetics 1996, 143, 973–982. [Google Scholar] [PubMed]
- Nakagawa, T.; Kurose, T.; Hino, T.; Tanaka, K.; Kawamukai, M.; Niwa, Y.; Toyooka, K.; Matsuoka, K.; Jinbo, T.; Kimura, T. Development of series of gateway binary vectors, pGWBs, for realizing efficient construction of fusion genes for plant transformation. J. Biosci. Bioeng 2007, 104, 34–41. [Google Scholar] [CrossRef] [PubMed]
- Clough, S.J.; Bent, A.F. Floral dip: A simplified method for Agrobacterium-mediated transformation of Arabidopsis thaliana. Plant J. 1998, 16, 735–743. [Google Scholar] [CrossRef]
- Lucas, M.; Swarup, R.; Paponov, I.A.; Swarup, K.; Casimiro, I.; Lake, D.; Peret, B.; Zappala, S.; Mairhofer, S.; Whitworth, M.; et al. Short-Root regulates primary, lateral, and adventitious root development in Arabidopsis. Plant Physiol. 2011, 155, 384–398. [Google Scholar] [CrossRef]
- Hachiya, T.; Okamoto, Y. Simple Spectroscopic Determination of Nitrate, Nitrite, and Ammonium in Arabidopsis thaliana. Bio-Protocol 2017, 7, e2280. [Google Scholar] [CrossRef]


© 2020 by the authors. Licensee MDPI, Basel, Switzerland. This article is an open access article distributed under the terms and conditions of the Creative Commons Attribution (CC BY) license (http://creativecommons.org/licenses/by/4.0/).
Share and Cite
Conesa, C.M.; Saez, A.; Navarro-Neila, S.; de Lorenzo, L.; Hunt, A.G.; Sepúlveda, E.B.; Baigorri, R.; Garcia-Mina, J.M.; Zamarreño, A.M.; Sacristán, S.; et al. Alternative Polyadenylation and Salicylic Acid Modulate Root Responses to Low Nitrogen Availability. Plants 2020, 9, 251. https://doi.org/10.3390/plants9020251
Conesa CM, Saez A, Navarro-Neila S, de Lorenzo L, Hunt AG, Sepúlveda EB, Baigorri R, Garcia-Mina JM, Zamarreño AM, Sacristán S, et al. Alternative Polyadenylation and Salicylic Acid Modulate Root Responses to Low Nitrogen Availability. Plants. 2020; 9(2):251. https://doi.org/10.3390/plants9020251
Chicago/Turabian StyleConesa, Carlos M., Angela Saez, Sara Navarro-Neila, Laura de Lorenzo, Arthur G. Hunt, Edgar B. Sepúlveda, Roberto Baigorri, Jose M. Garcia-Mina, Angel M. Zamarreño, Soledad Sacristán, and et al. 2020. "Alternative Polyadenylation and Salicylic Acid Modulate Root Responses to Low Nitrogen Availability" Plants 9, no. 2: 251. https://doi.org/10.3390/plants9020251
APA StyleConesa, C. M., Saez, A., Navarro-Neila, S., de Lorenzo, L., Hunt, A. G., Sepúlveda, E. B., Baigorri, R., Garcia-Mina, J. M., Zamarreño, A. M., Sacristán, S., & del Pozo, J. C. (2020). Alternative Polyadenylation and Salicylic Acid Modulate Root Responses to Low Nitrogen Availability. Plants, 9(2), 251. https://doi.org/10.3390/plants9020251