Variation in Root and Shoot Growth in Response to Reduced Nitrogen


Abstract
1. Introduction
2. Materials and Methods
2.1. Plant Materials
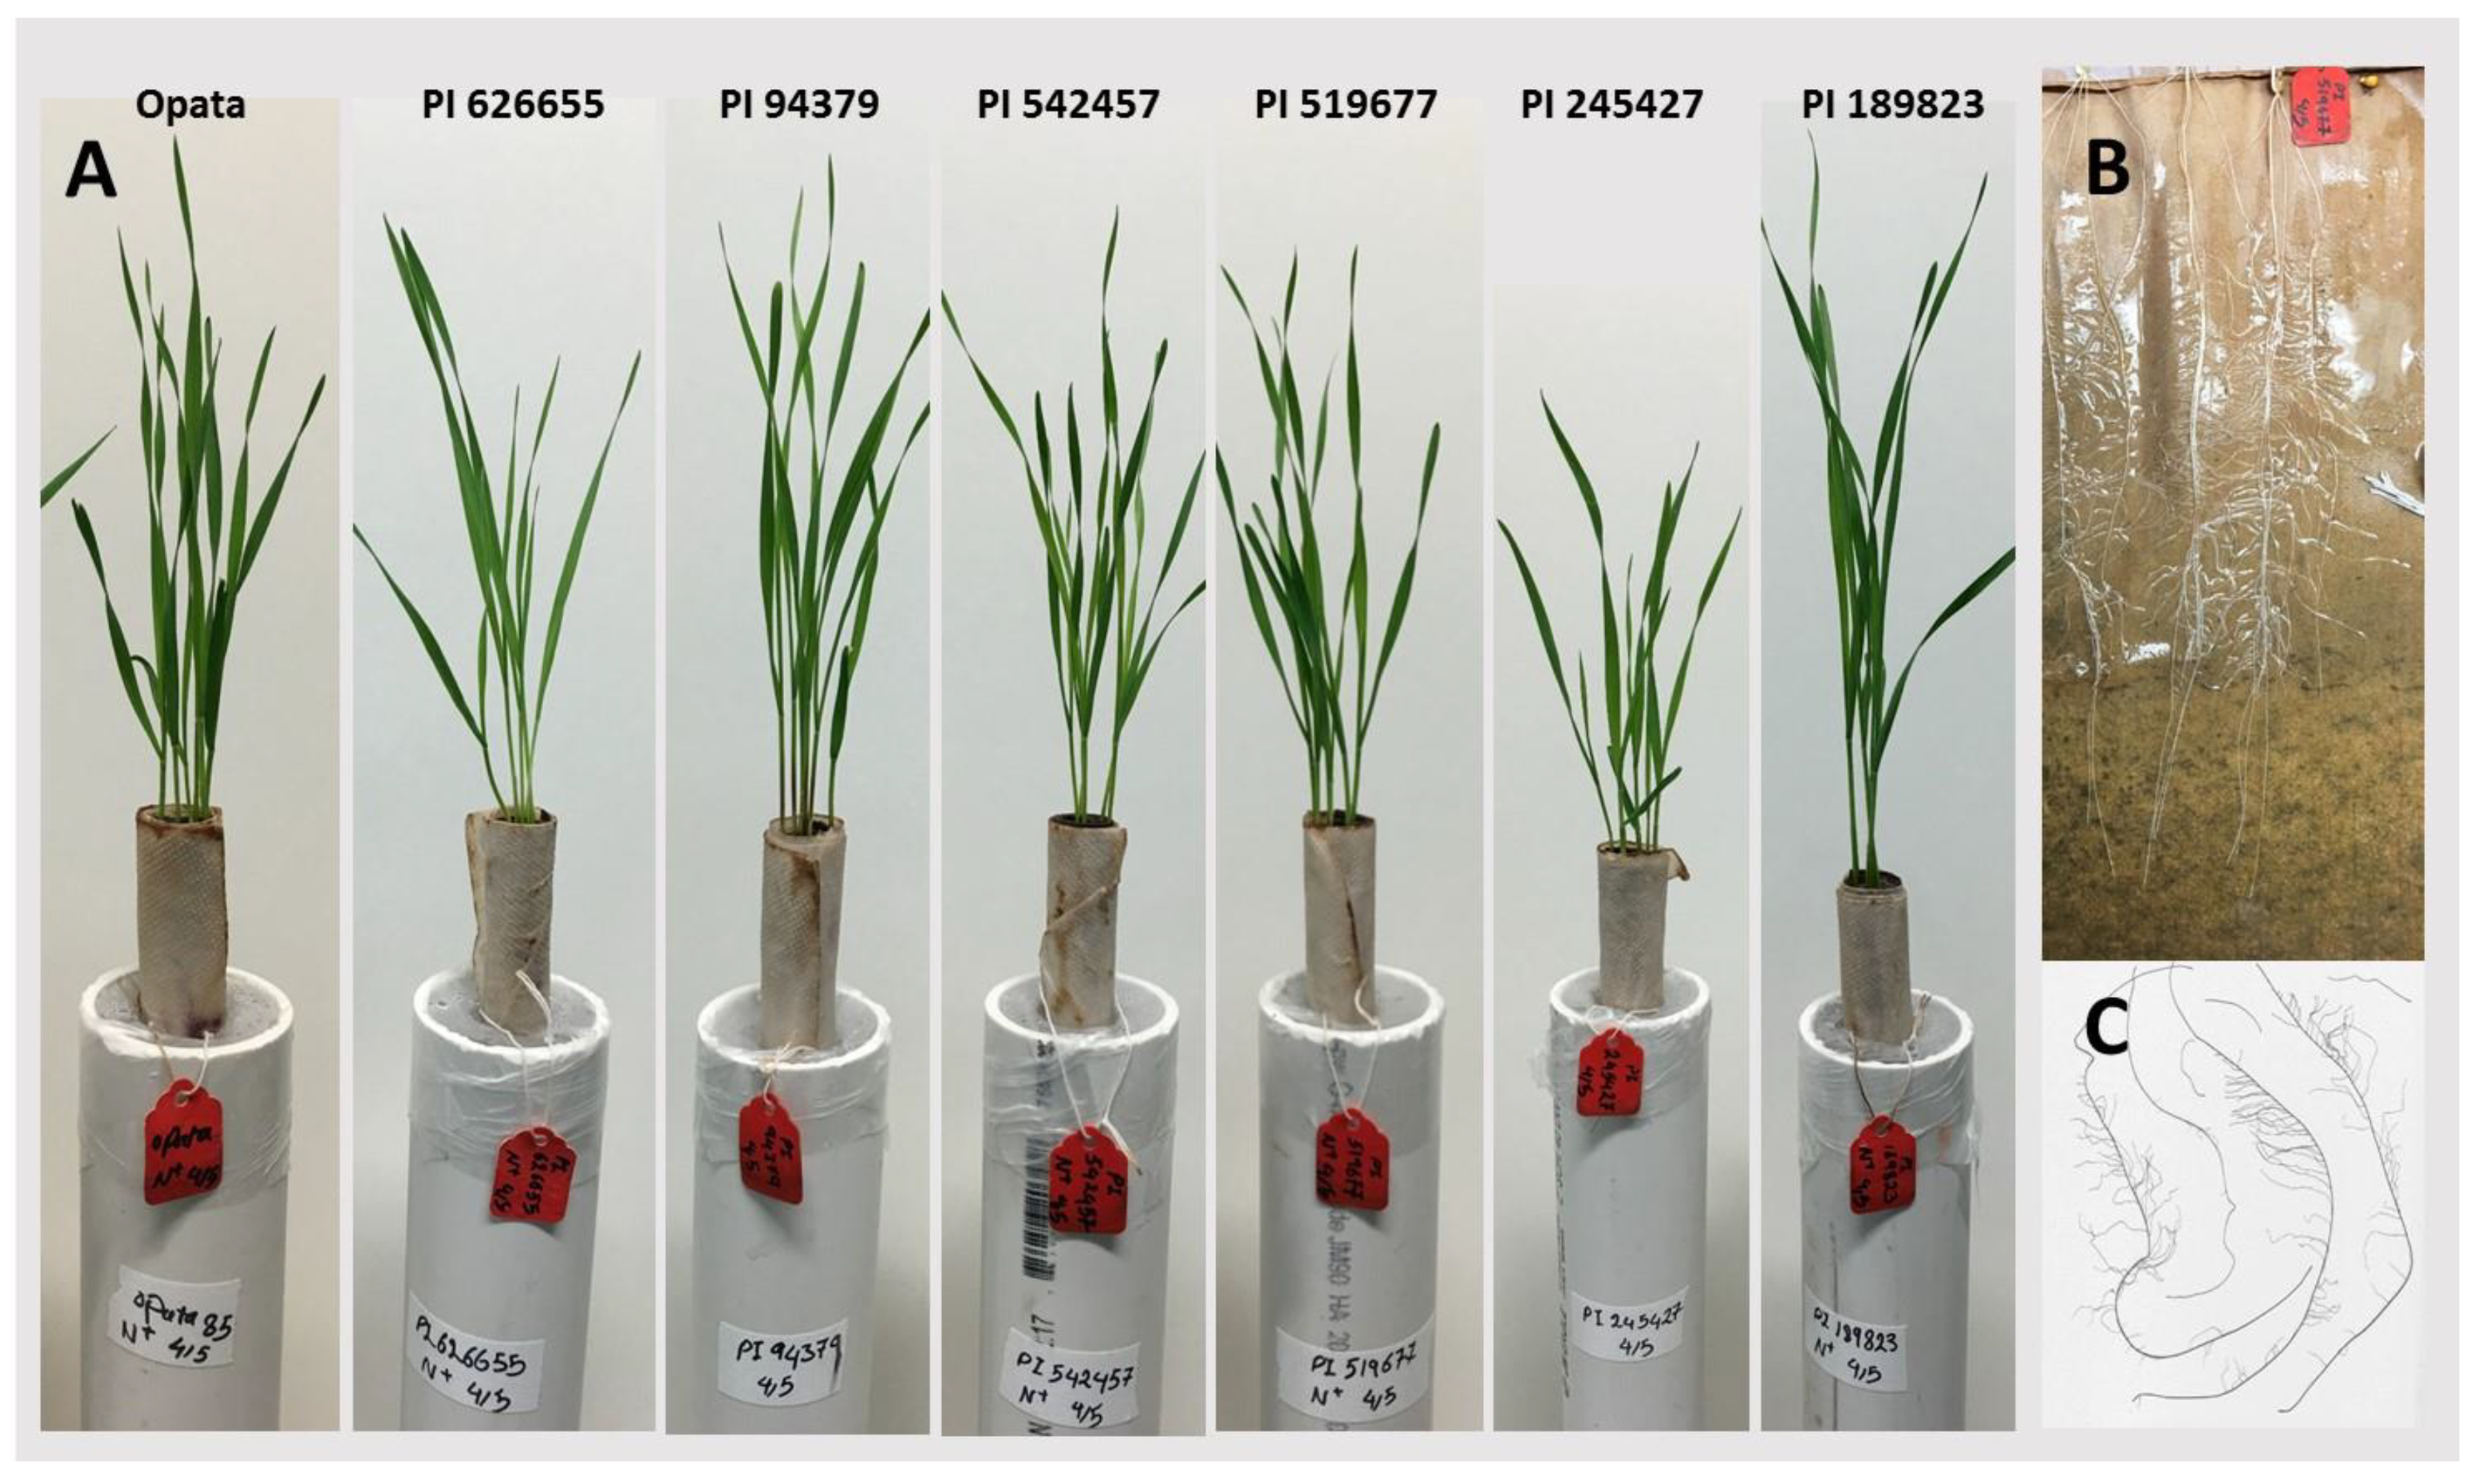
2.2. Seedling Assay
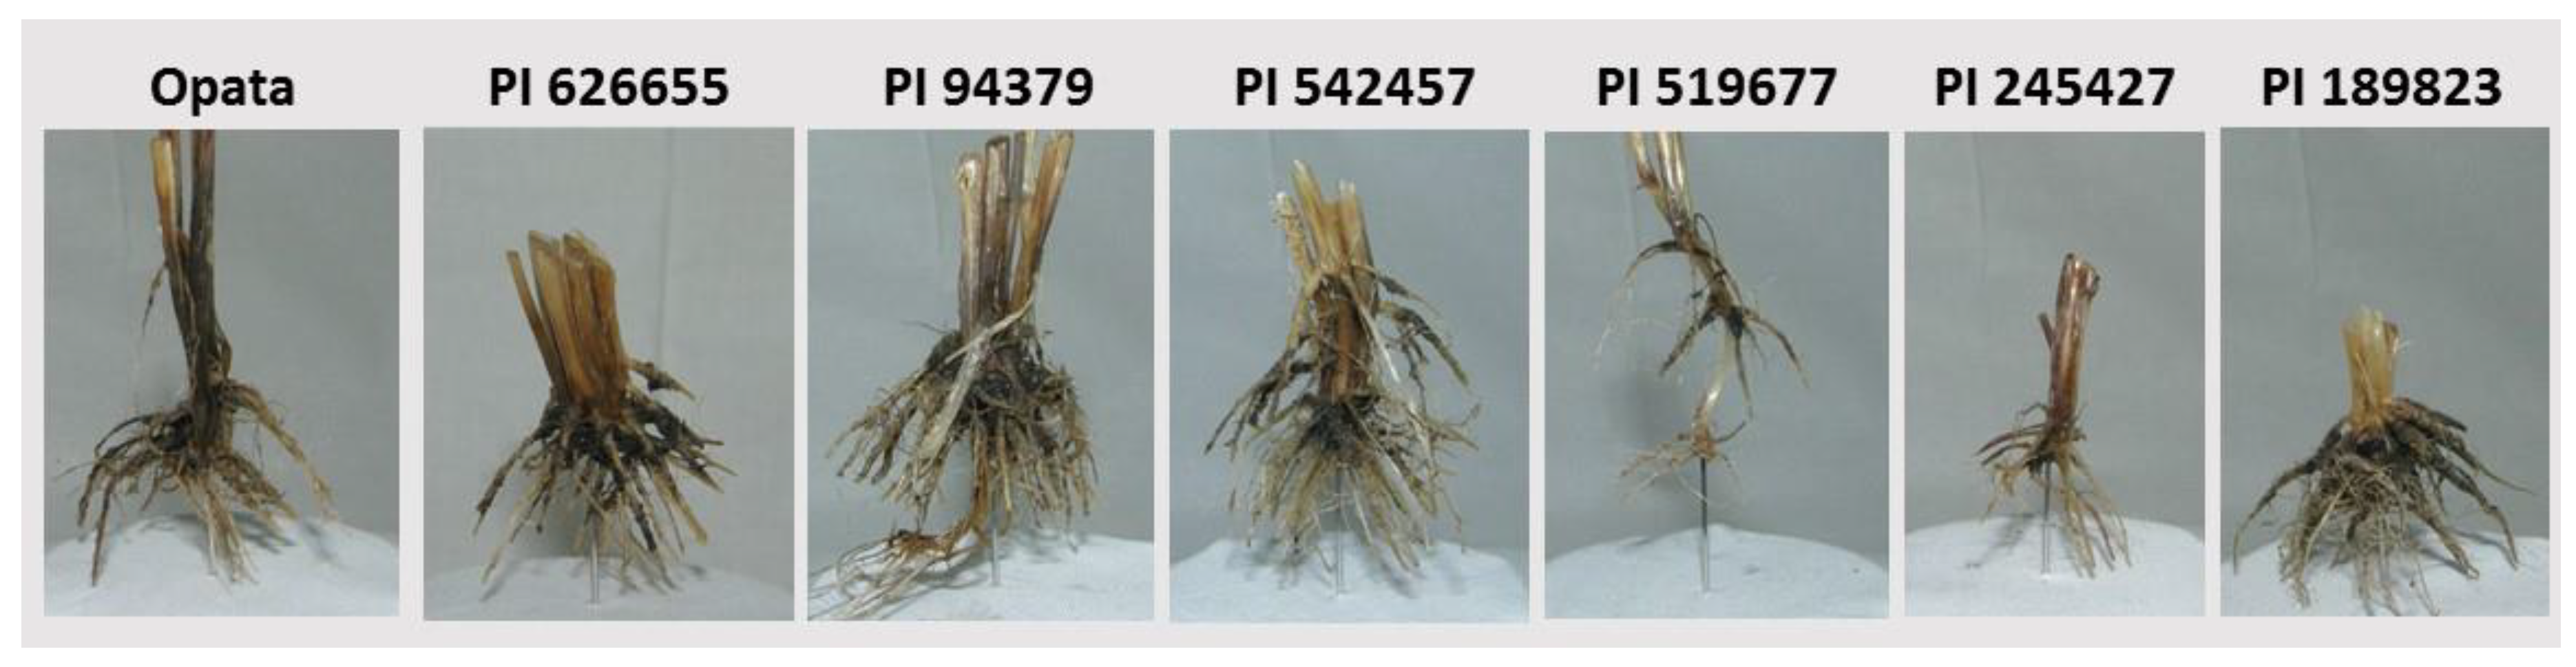
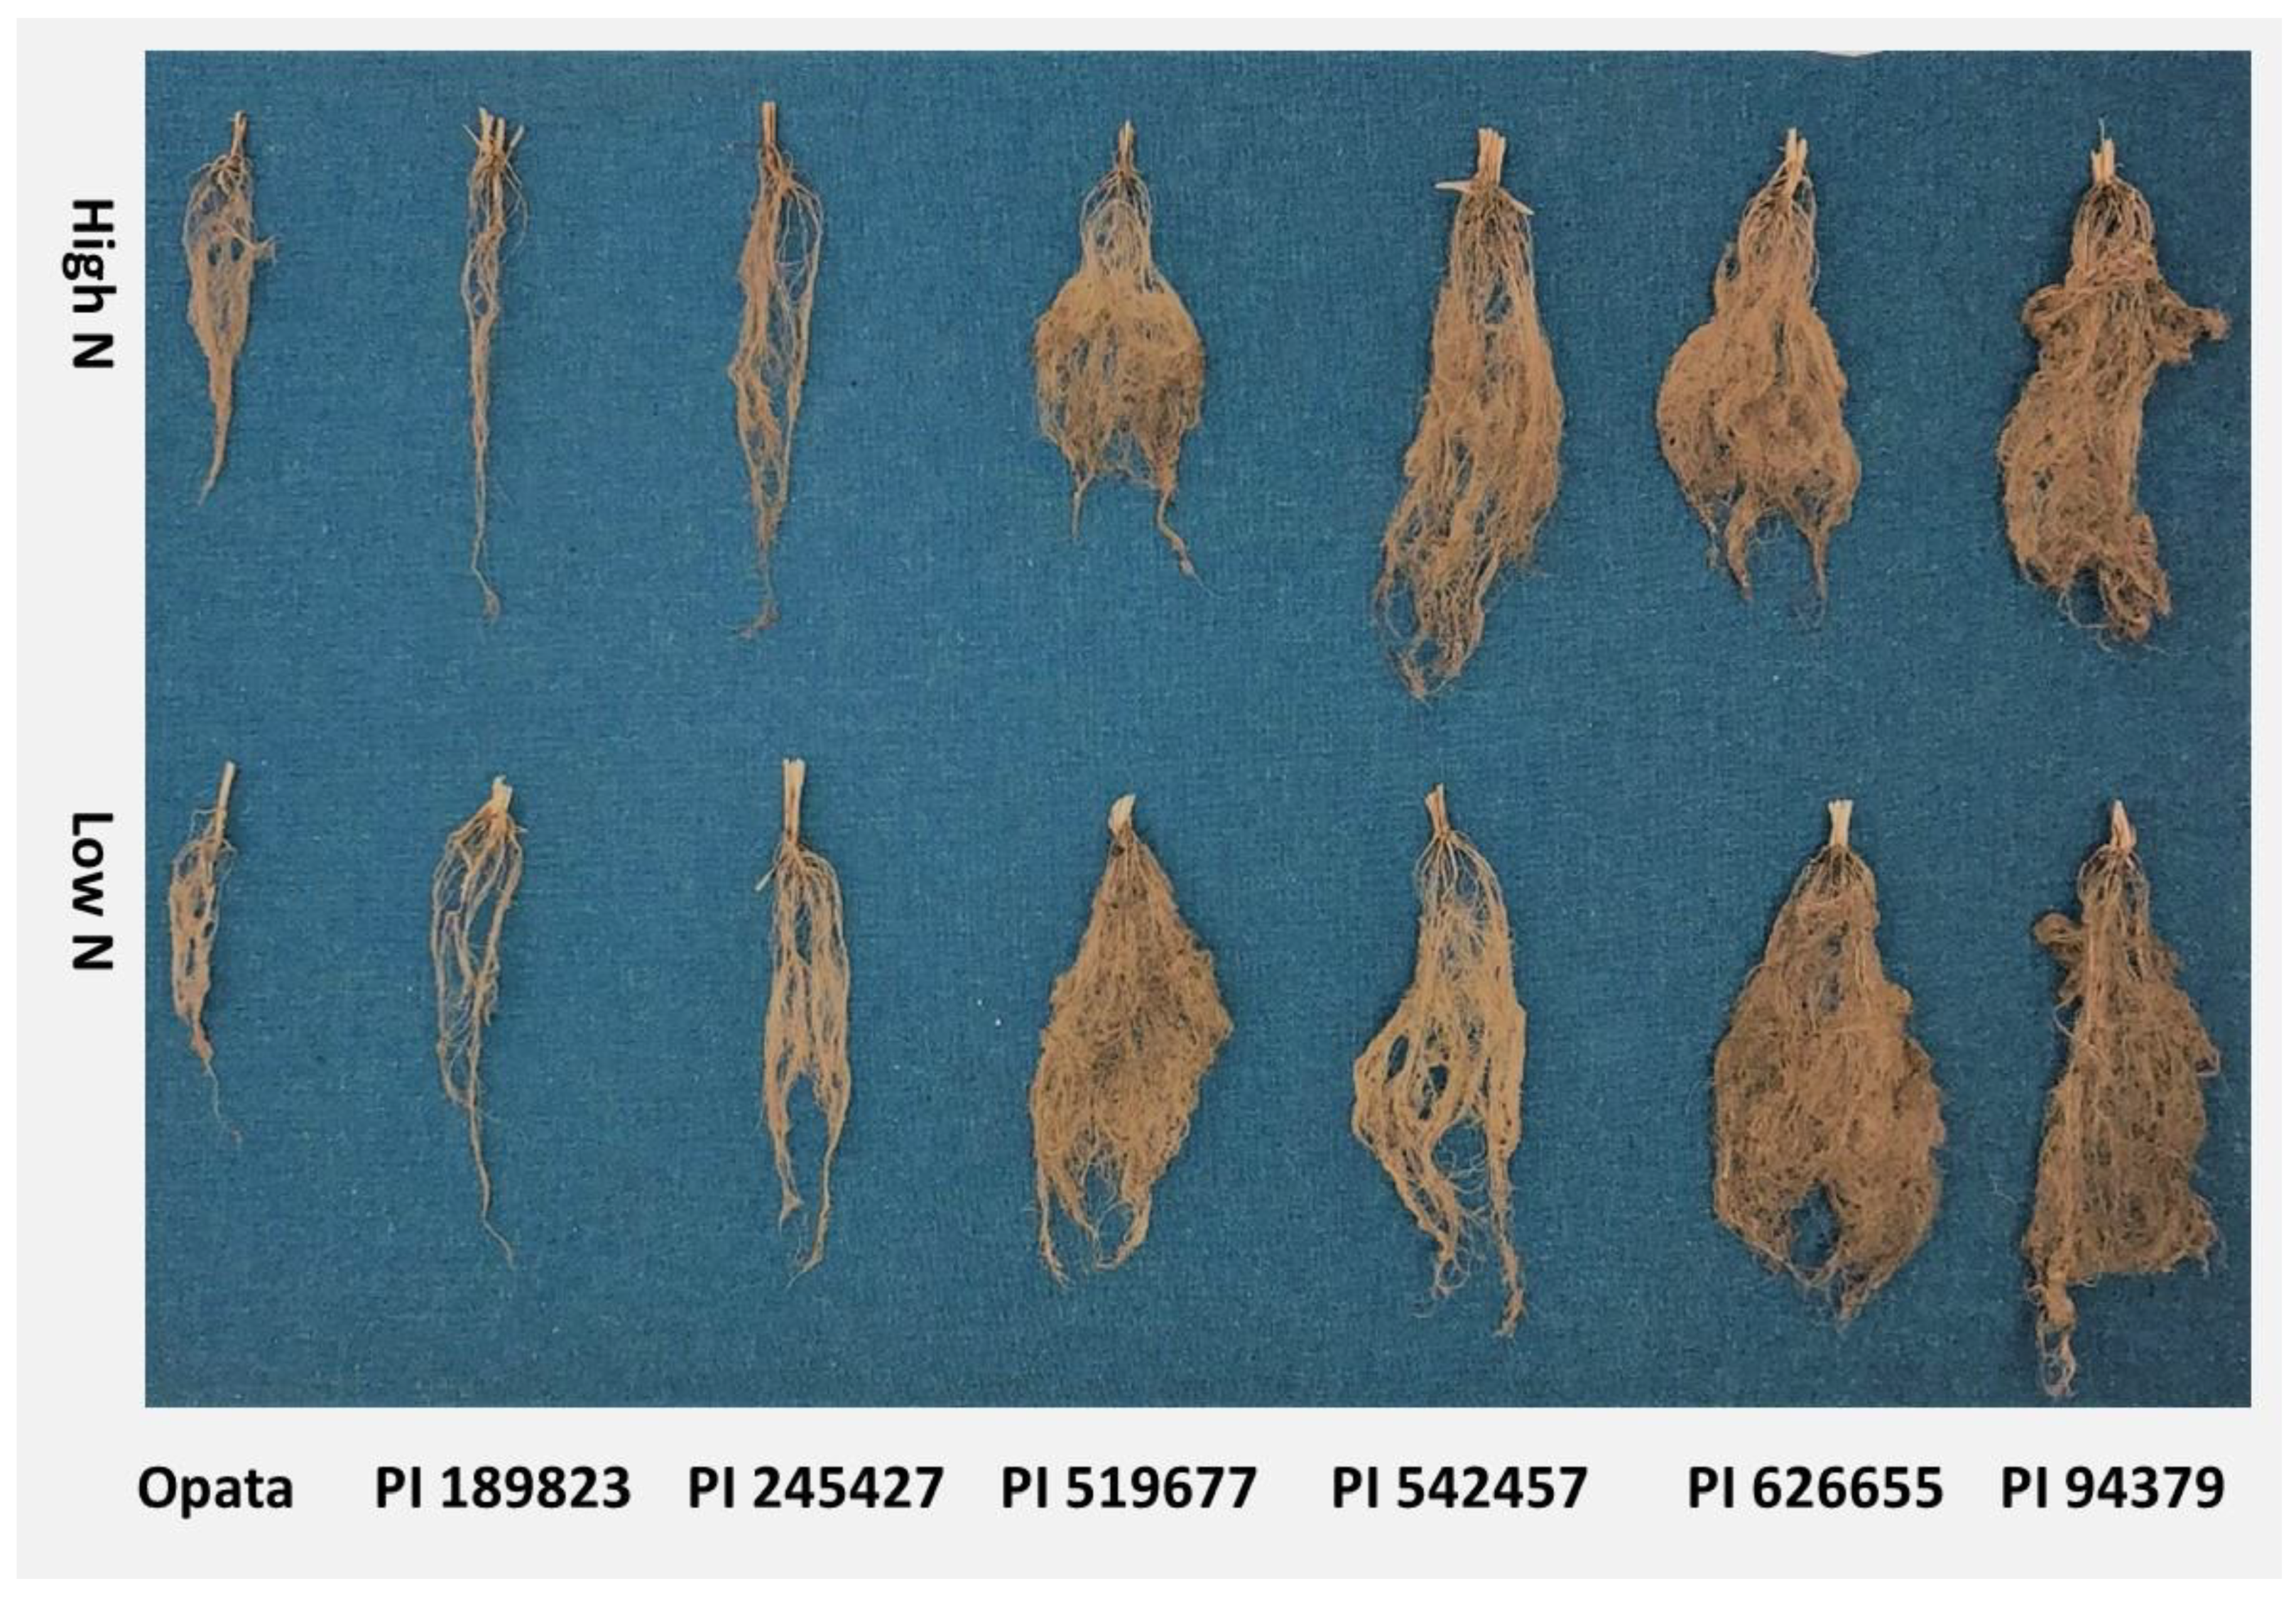
2.3. Maturity Assay
2.4. Temporal Assay
3. Results
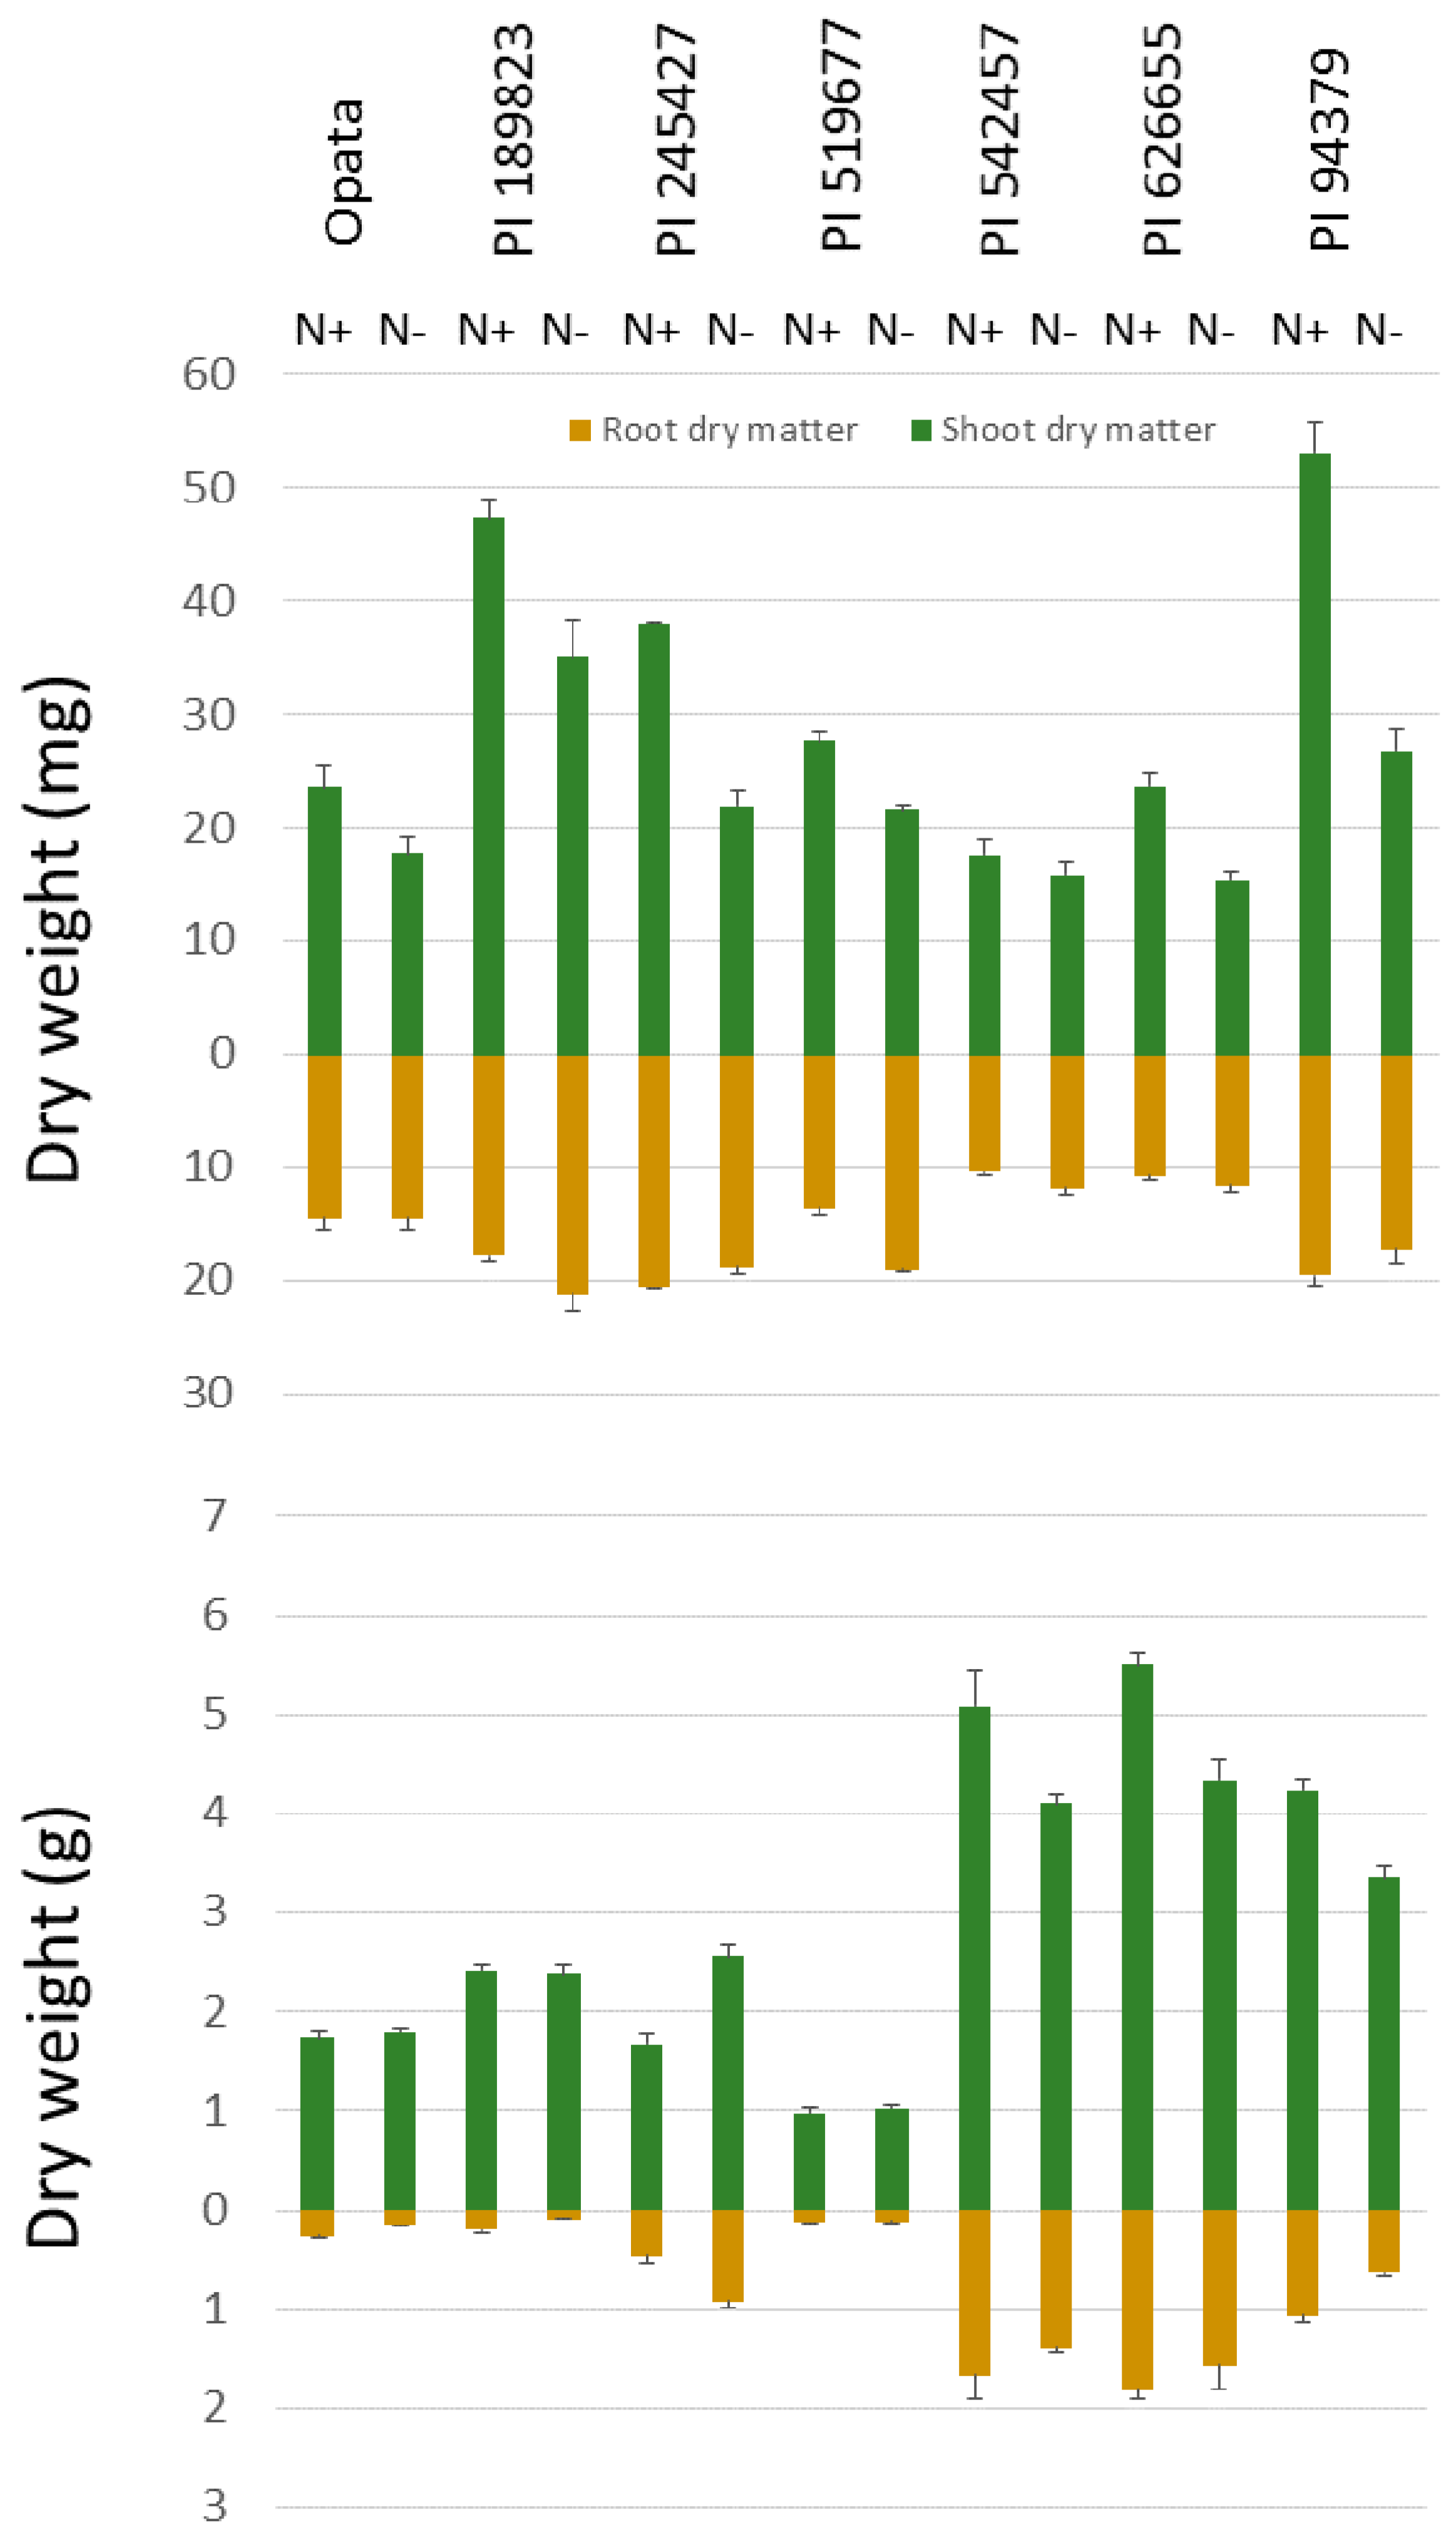
3.1. Considerable Decrease in Shoot Dry Matter but Variable Root Responses to Low-N Treatment in the Seedling Stage
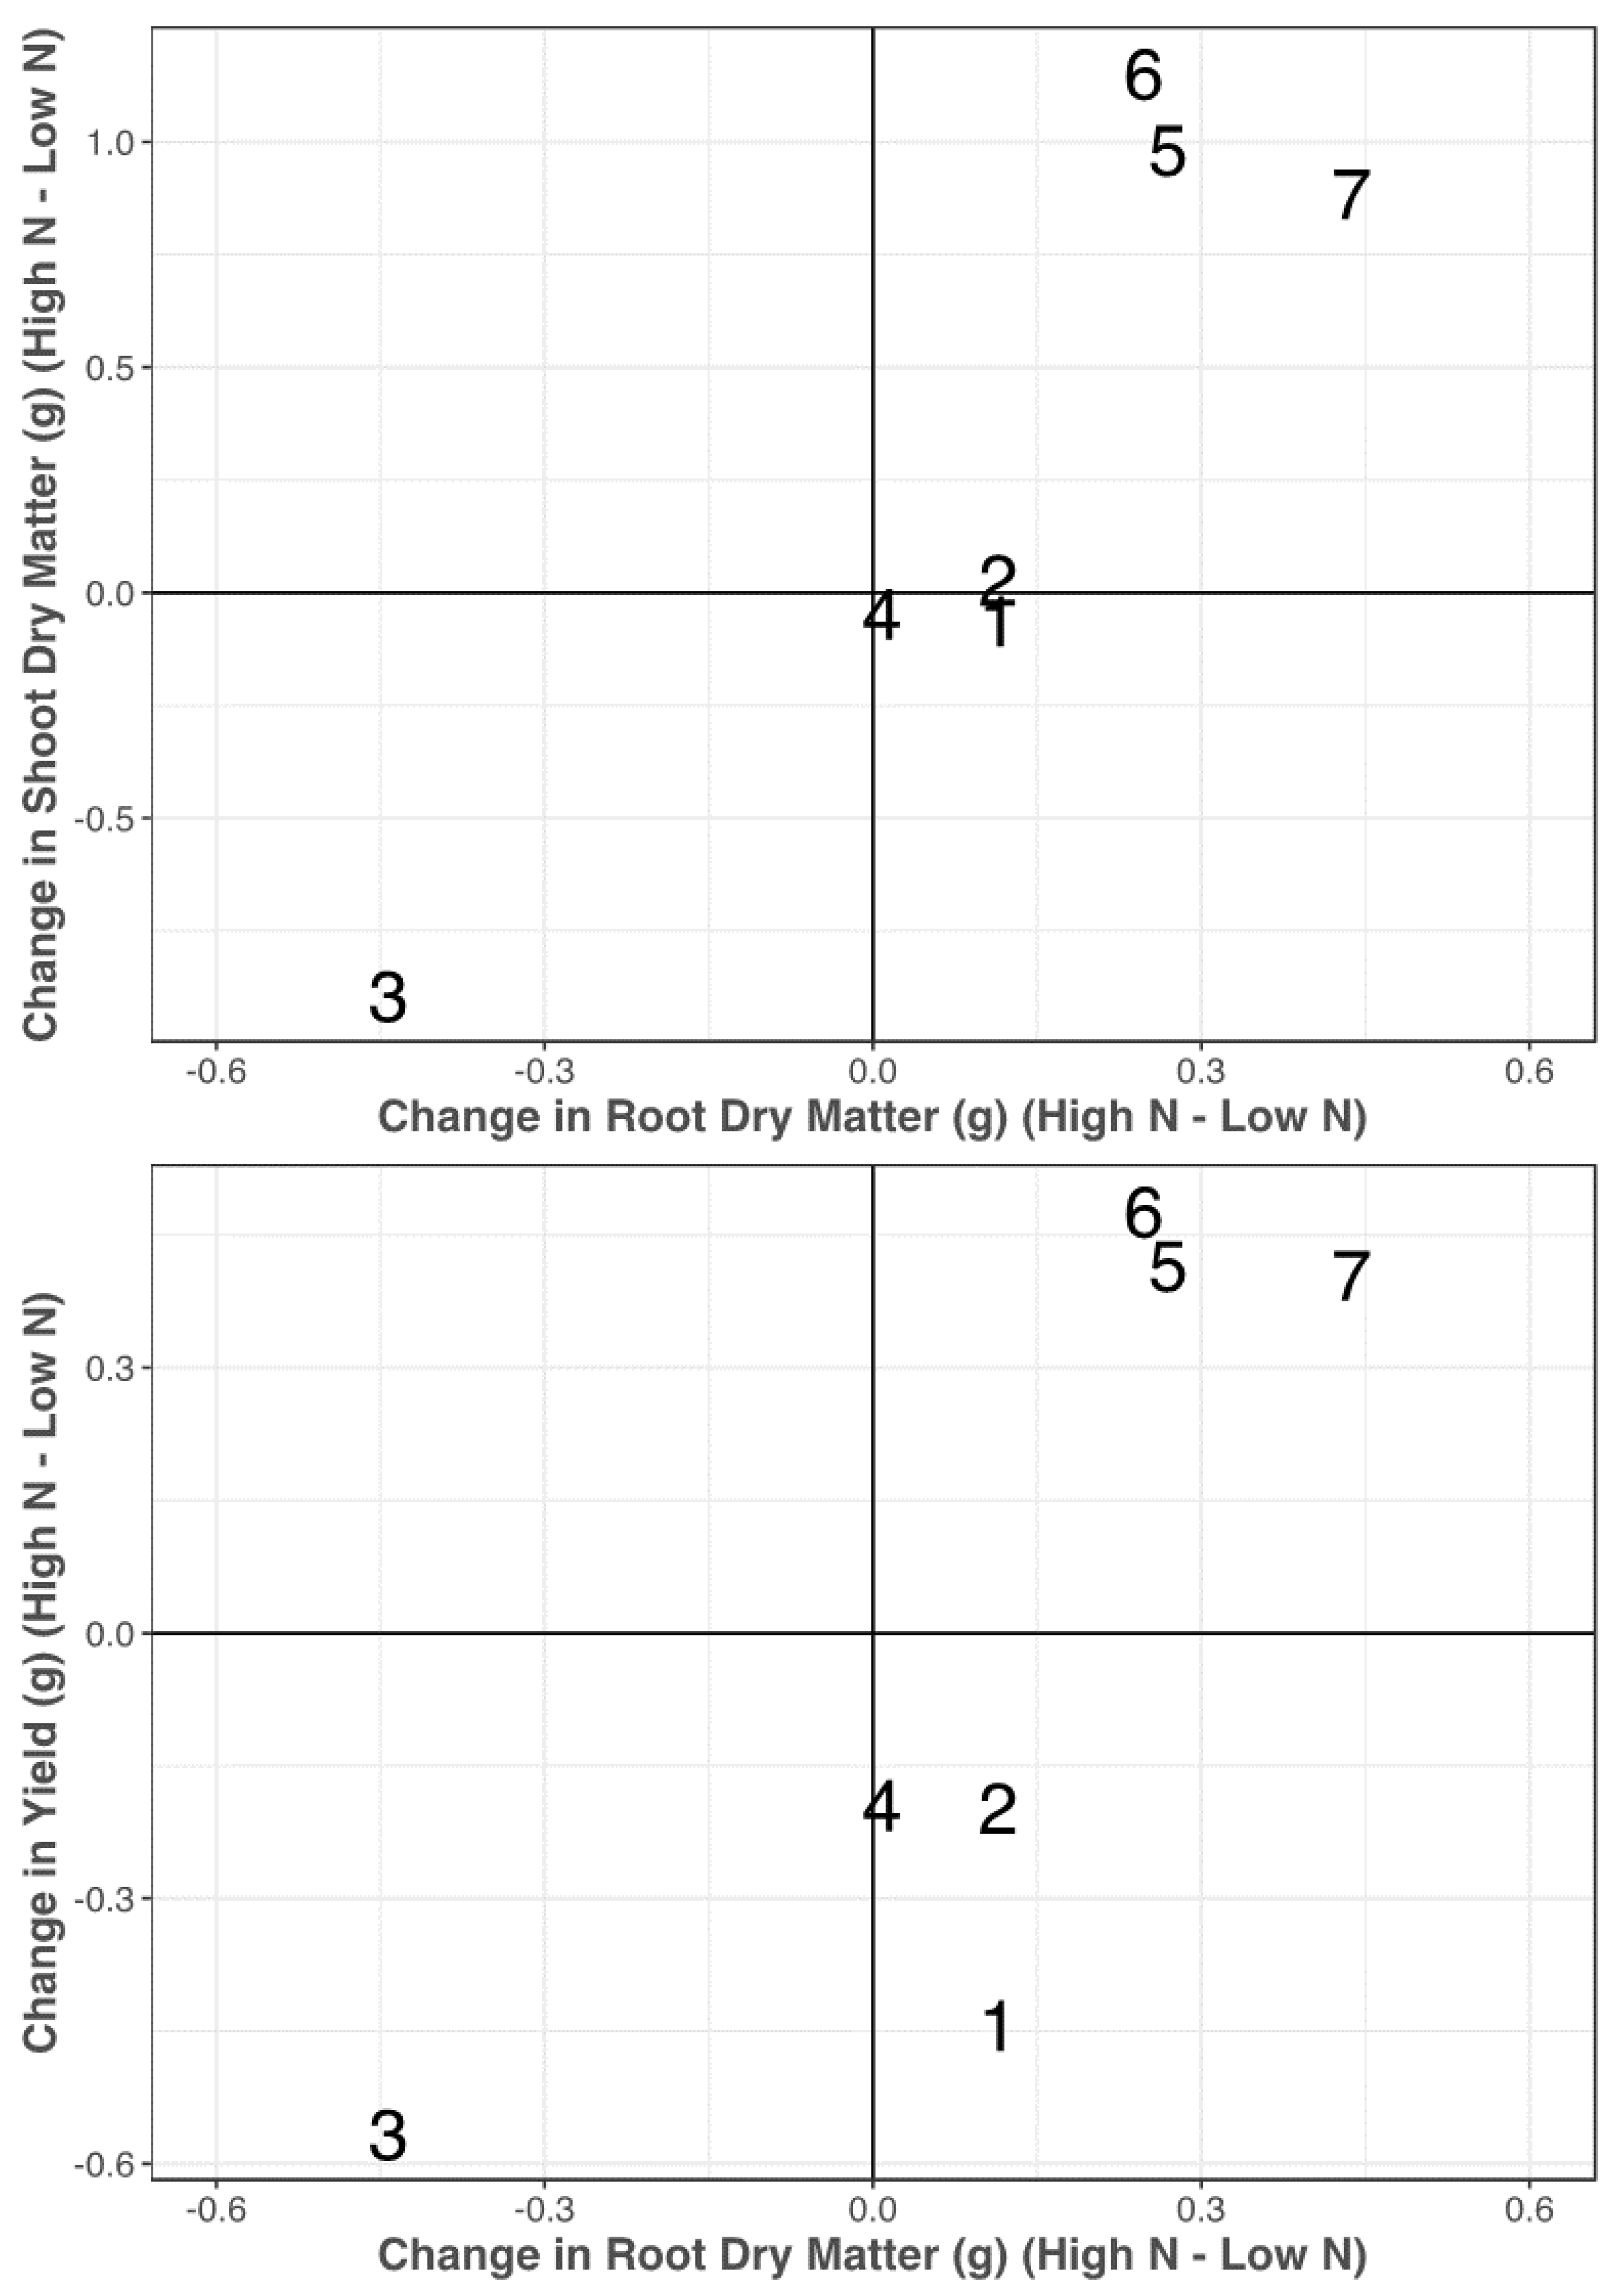
3.2. Substantial Correlation of Root with Key Above-Ground Traits at Maturity Stage
3.3. Distribution of Dry Matter between Shoot and Root at Maturity
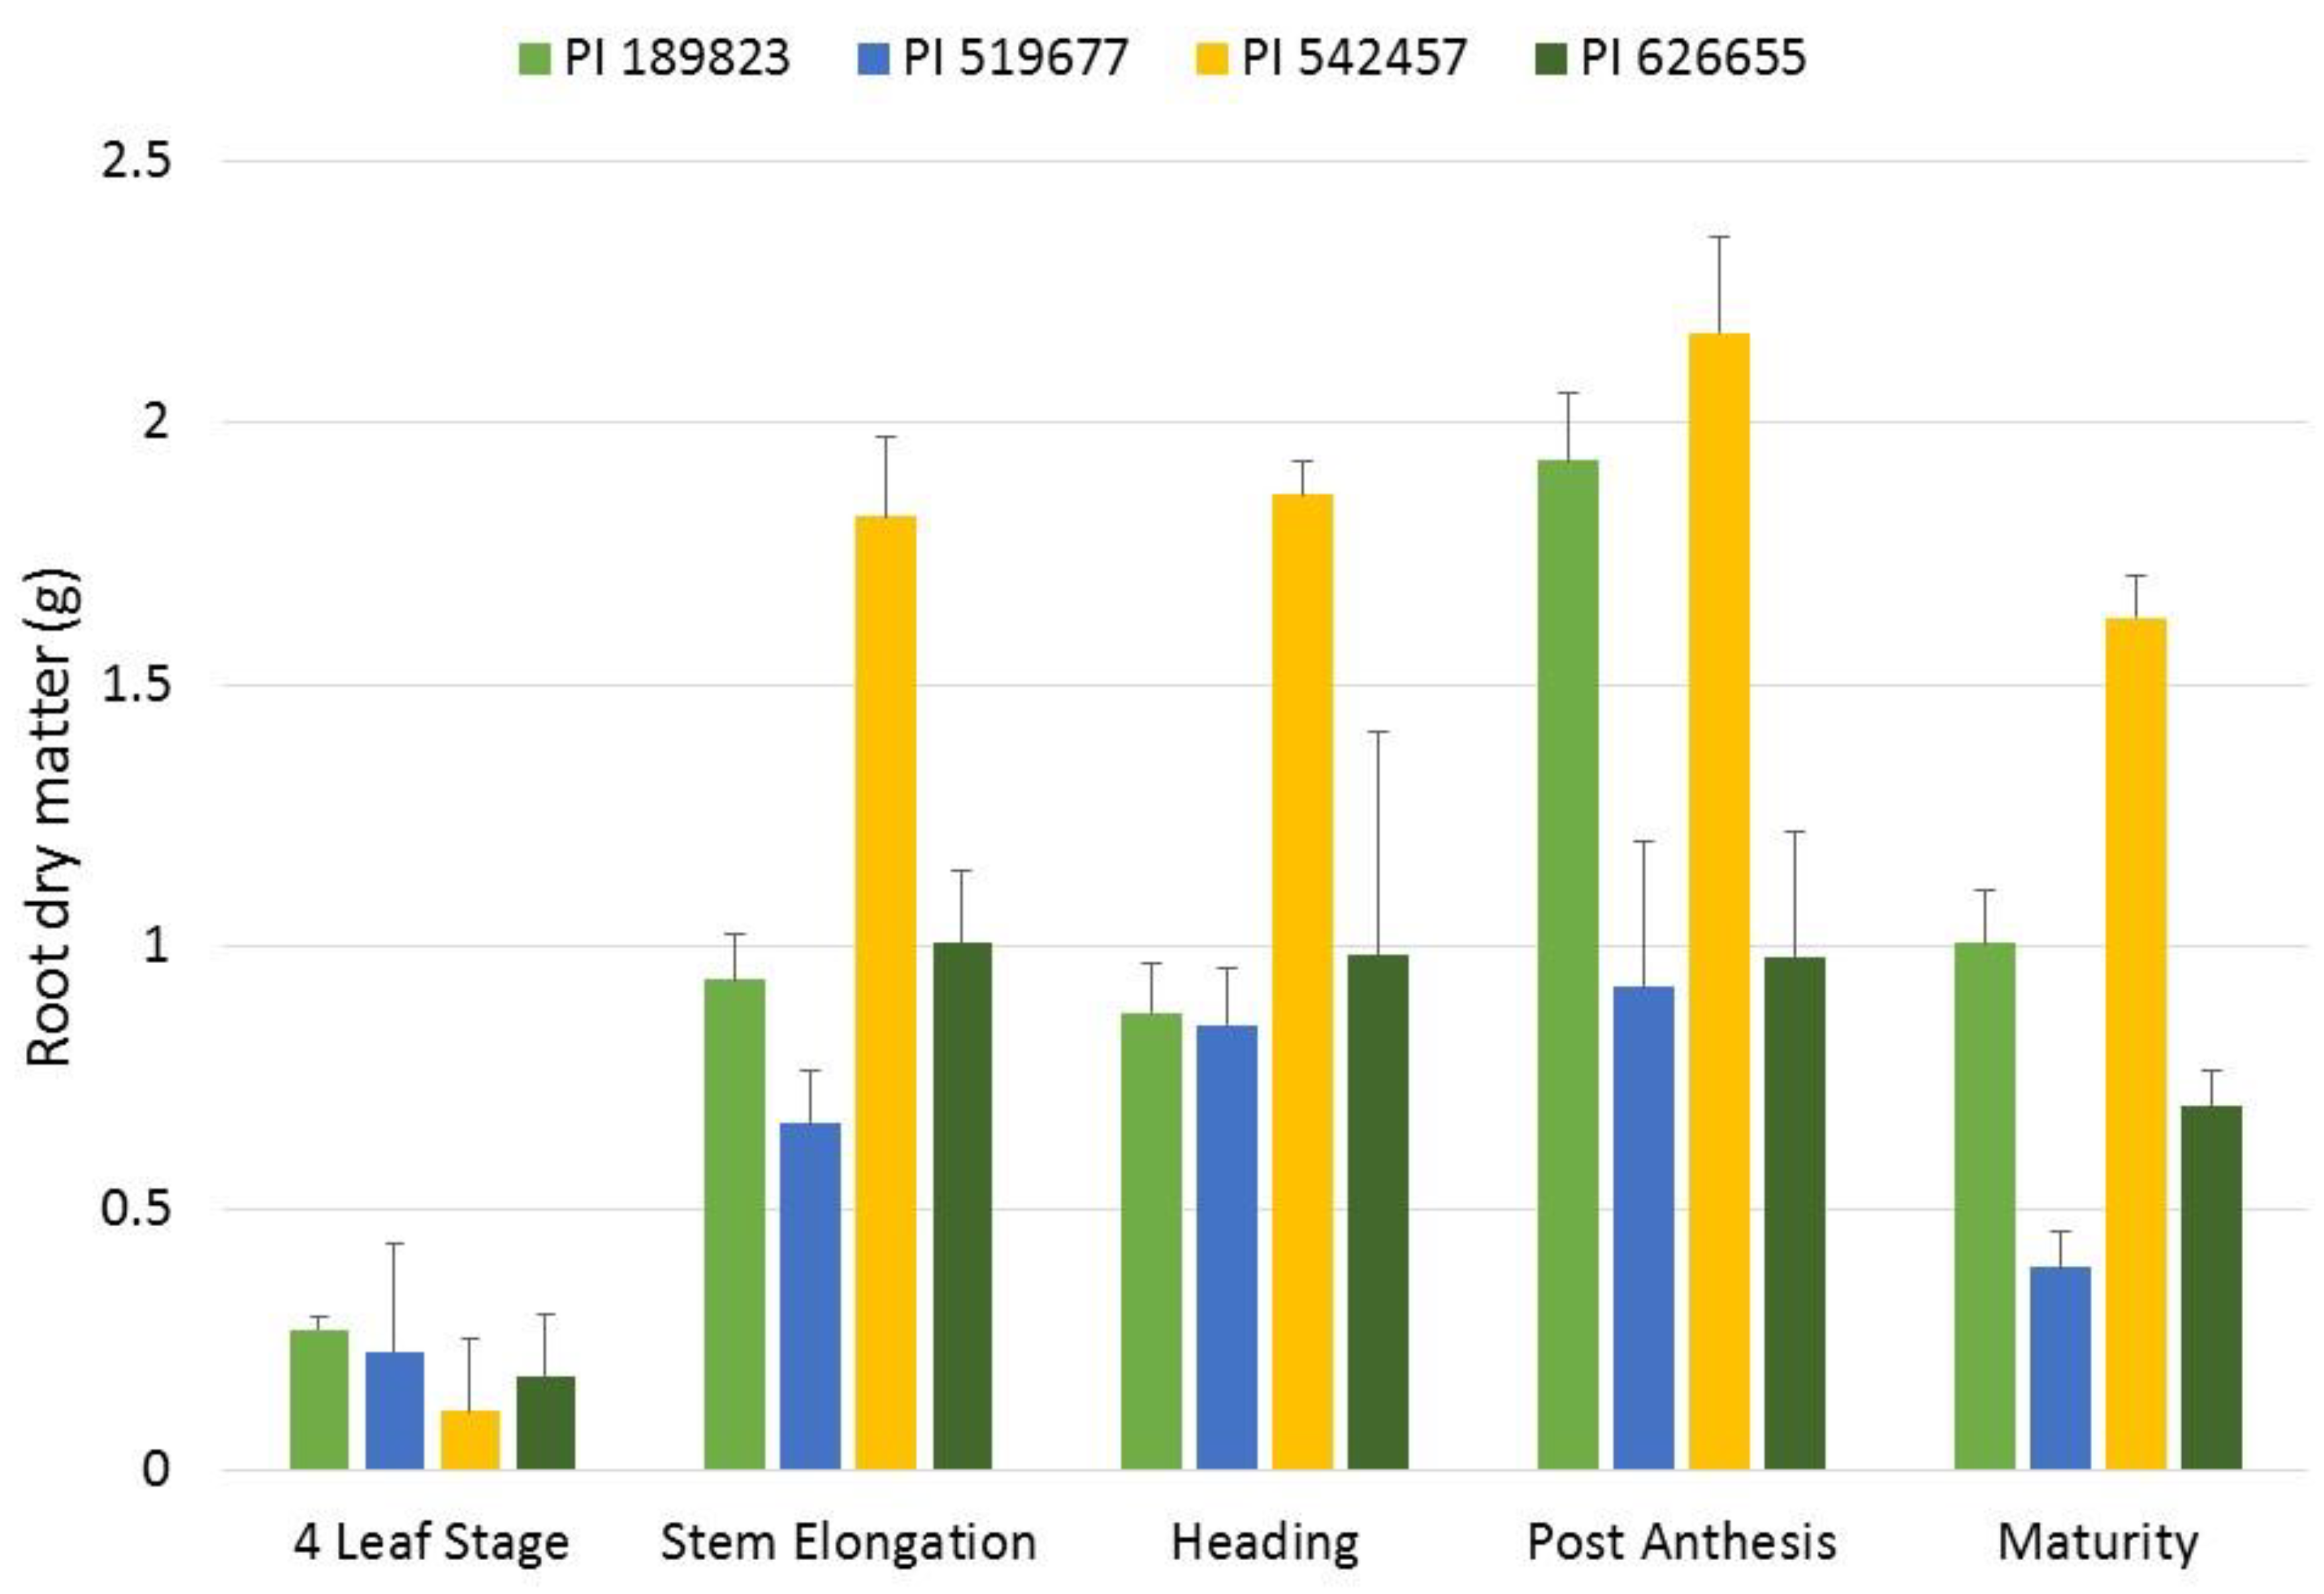
3.4. Temporal Assay and Root Growth Rate Analysis
4. Discussion
4.1. Structural Variation of Root Traits
4.2. N Recovery and Utilization as a Functional Trait
4.3. Implications of Trait Correlations for Future Genetic Research
4.4. Correlation of Seedling and Maturity Root Phenotypes and Time-Dependent Genotypic Differences
5. Conclusions
Author Contributions
Funding
Acknowledgments
Conflicts of Interest
References
- FAO. FAOSTAT. 2017. Available online: http://www.fao.org/faostat/en/#data/QC (accessed on 21 February 2019).
- Ray, D.K.; Ramankutty, N.; Mueller, N.D.; West, P.C.; Foley, J.A. Recent patterns of crop yield growth and stagnation. Nat. Commun. 2012, 3, 1293. [Google Scholar] [CrossRef] [PubMed]
- FAO. The Challenge; FAO: Rome, Italy, 2009; Available online: http://www.fao.org/fileadmin/templates/wsfs/docs/Issues_papers/HLEF2050_Global_Agriculture.pdf (accessed on 21 February 2019).
- Neelin, J.D.; Mu, M.; Su, H.; Meyerson, J.E.; Holloway, C.E. Tropical drying trends in global warming models and observations. Proc. Natl. Acad. Sci. USA 2006, 18. [Google Scholar] [CrossRef] [PubMed]
- Montgomery, D.R.; Matson, P.A. Soil erosion and agricultural sustainability. Proc. Natl. Acad. Sci. USA 2007, 104, 1328–13272. [Google Scholar] [CrossRef] [PubMed]
- Gilbert, N. How to feed a hungry world. Nature 2010, 466, 531–532. [Google Scholar] [CrossRef]
- Ray, D.K.; Mueller, N.D.; West, P.C.; Foley, J.A. Yield trends Are insufficient to double global crop production by 2050. PLoS ONE 2013, 8, e66428. [Google Scholar] [CrossRef]
- Conant, R.T.; Berdanier, A.B.; Grace, P.R. Patterns and trends in nitrogen use and nitrogen recovery efficiency in world agriculture. Glob. Biogeochem. Cycles 2013, 27, 558–566. [Google Scholar] [CrossRef]
- Addiscott, T.M.; Powlson, D.S. Partitioning losses of nitrogen fertilizer between leaching and denitrification. J. Agric. Sci. 1992, 118, 101–107. [Google Scholar] [CrossRef]
- Rasmussen, I.S.; Dresbøll, D.B.; Thorup-Kristensen, K. Winter wheat cultivars and nitrogen (N) fertilization-Effects on root growth, N uptake efficiency and N use efficiency. Eur. J. Agron. 2015, 68, 38–49. [Google Scholar] [CrossRef]
- Raun, W.R.; Johnson, G.V. Improving Nitrogen Use Efficiency for Cereal Production. Agron. J. 1999, 91, 357. [Google Scholar] [CrossRef]
- Salvagiotti, F.; Miralles, D.J. Radiation interception, biomass production and grain yield as affected by the interaction of nitrogen and sulfur fertilization in wheat. Eur. J. Agron. 2007, 28, 282–290. [Google Scholar] [CrossRef]
- Kharel, T.P.; Clay, D.E.; Clay, S.A.; Beck, D.; Reese, C.; Carlson, G.; Park, H. Nitrogen and water stress affect winter wheat yield and dough quality. Agron. J. 2011, 103, 1389–1396. [Google Scholar] [CrossRef]
- Lynch, J.P. Roots of the Second Green Revolution. Aust. J. Bot. 2007, 55, 493–512. [Google Scholar] [CrossRef]
- Ehdaie, B.; Waines, J.G. Larger Root System Increases Water-Nitrogen Uptake and Grain Yield in Bread Wheat. 2008. Available online: https://ses.library.usyd.edu.au/bitstream/2123/3293/1/P285.pdf (accessed on 19 December 2018).
- An, D.; Su, J.; Liu, Q.; Zhu, Y.; Tong, Y.; Li, J.; Jing, R.; Li, B.; Li, Z. Mapping QTLs for nitrogen uptake in relation to the early growth of wheat (Triticum aestivum L.). Plant Soil 2006, 284, 73–84. [Google Scholar] [CrossRef]
- Pierret, A.; Latchackak, K.; Chathanvongsa, P.; Sengtaheuanghoung, O.; Valentin, C. Interactions between root growth, slope and soil detachment depending on land use: A case study in a small mountain catchment of Northern Laos. Plant Soil 2007, 301, 51–64. [Google Scholar] [CrossRef]
- Liao, M.; Fillery, I.R.P.; Palta, J.A. Early vigorous growth is a major factor influencing nitrogen uptake in wheat. Funct. Plant Biol. 2004, 31, 121–129. [Google Scholar] [CrossRef]
- Edwards, C.E.; Ewers, B.E.; Weinig, C. Genotypic variation in biomass allocation in response to field drought has a greater affect on yield than gas exchange or phenology. BMC Plant Biol. 2016, 16, 185. [Google Scholar] [CrossRef]
- King, J.; Gay, A.; Sylvester-Bradley, R.; Bingham, I.; Foulkes, J.; Gregory, P.; Robinson, D. Modelling cereal root systems for water and nitrogen capture: Towards an economic optimum. Ann. Bot. 2003, 71, 383–390. [Google Scholar] [CrossRef]
- Rahnama, A.; Munns, R.; Poustini, K.; Watt, M. A screening method to identify genetic variation in root growth response to a salinity gradient. J. Exp. Bot. 2011, 62, 69–77. [Google Scholar] [CrossRef] [PubMed]
- Hoagland, D.; Arnon, D. The Water-Culture Method for Growing Plants without Soil; California Agricultural Experiment Station: Berkeley, CA, USA, 1950. [Google Scholar]
- Zhu, Y.; Fan, X.; Hou, X.; Wu, J.; Wang, T. Effect of different levels of nitrogen deficiency on switchgrass seedling growth. Crop J. 2014. [Google Scholar] [CrossRef]
- Krotz, L.; Giazzi, G. Nitrogen, Carbon and Sulfur Determination in Paper by Flash Combustion. 2014. Available online: http://tools.thermofisher.com/content/sfs/posters/PN-42211-Nitrogen-Carbon-Sulfur-Paper-Flash-Combustion-PN42211-EN.pdf (accessed on 22 May 2019).
- R Core Team. R: A Language and Environment for Statistical Computing; R Foundation for Statistical Computing: Vienna, Austra, 2014. [Google Scholar]
- Lynch, J. Root architecture and plant productivity. Plant Physiol. 1995, 109, 7–13. [Google Scholar] [CrossRef]
- Mohammadi, M.; Tyagi, P.; Daba, S.; Beyer, S.; Bockelman, H.; Brown-Guedira, G. Association genetics and candidate gene identification for root length and branching in a historical and modern US wheat population (poster presentation). In Proceedings of the 4th International Plant Phenotyping Symposium, Mexico, Texcoco, 13–15 December 2016; International Maize and Wheat Improvement Center (CIMMYT): Mexico City, Mexico, 2016. [Google Scholar]
- Watt., M.; Moosavi, S.; Cunningham, S.C.; Kirkegaard, J.A.; Rebetzke, G.J.; Richards, R.A. A rapid, controlled-environment seedling root screen for wheat correlates well with rooting depths at vegetative, but not reproductive, stages at two field sites. Ann. Bot. 2013, 112, 447–455. [Google Scholar] [CrossRef] [PubMed]
- Waines, J.; Ehdaie, B. Domestication and crop physiology: Roots of green-revolution wheat. Ann. Bot. 2007, 100, 991–998. [Google Scholar] [CrossRef] [PubMed]
- Beyer, S.; Daba, S.; Tyagi, P.; Bockelman, H.; Brown-Guedira, G.; Mohammadi, M. Loci and candidate genes controlling root traits in wheat seedlings—A wheat root GWAS. Funct. Integr. Genom. 2018, 19, 91–107. [Google Scholar] [CrossRef] [PubMed]
- Narayanan, S.; Mohan, A.; Gill, K.S.; Vara Prasad, P.V. Variability of Root Traits in Spring Wheat Germplasm. PLoS ONE 2014, 9, e100317. [Google Scholar] [CrossRef] [PubMed]
- Mori, A.; Fukuda, T.; Vejchasarn, P.; Nestler, J.; Pariasca-Tanaka, J.; Wissuwa, M. The role of root size versus root efficiency in phosphorus acquisition in rice. J. Exp. Bot. 2016, 67, 1179–1189. [Google Scholar] [CrossRef]
- Zhu, J. Analysis of conditional genetic effects and variance components in developmental genetics. Genetics 1995, 141, 1633–1639. [Google Scholar]
- Zhang, H.; Chen, J.; Li, R.; Zhiying, D. Conditional QTL mapping of three yield components in common wheat (Triticum aestivum L.). Crop J. 2016, 4, 220–228. [Google Scholar] [CrossRef]
- Lupton, F.; Oliver, R.H.; Ellis, F.B.; Barnes, B.T. Root and shoot growth of semi-dwarf and taller winter wheats. Ann. Appl. Biol. 1974, 77, 129–144. [Google Scholar] [CrossRef]
- Richards, R.; Passioura, J. Seminal root morphology and water use of wheat. 1. Environmental Effects. Crop Sci. 1981, 21, 249–252. [Google Scholar] [CrossRef]
- Bai, C.; Liang, Y.; Hawkesford, M.J. Identification of QTLs associated with seedling root traits and their correlation with plant height in wheat. J. Exp. Bot. 2013, 64, 1745–1753. [Google Scholar] [CrossRef]
- Wang, Y.; Chen, L.; Yingying, D.; Yang, Z. Genetic effect of dwarfing gene Rht13 compared with Rht-D1b on plant height and some agronomic traits in common wheat (Triticum aestivum L.). Field Crop. Res. 2014, 162, 39–47. [Google Scholar] [CrossRef]
- Subira, J.; Ammar, K.; Álvaro, F.; García del Moral, L.F.; Dreisigacker, S.; Royo, C. Changes in durum wheat root and aerial biomass caused by the introduction of the Rht-B1b dwarfing allele and their effects on yield formation. Plant Soil 2016, 403, 291–304. [Google Scholar] [CrossRef]
- Liu, W.; Wang, J.; Wang, C.; Ma, G.; Wei, Q.; Lu, H.; Xie, Y.; Ma, D.; Kang, G. Root Growth, Water and Nitrogen Use Efficiencies in Winter Wheat Under Different Irrigation and Nitrogen Regimes in North China Plain. Front. Plant Sci. 2018, 9, 1798. [Google Scholar] [CrossRef] [PubMed]
- Anderson, E.L. Corn root growth and distribution as influenced by tillage and nitrogen fertilization. Agron. J. 1987, 79, 544–549. [Google Scholar] [CrossRef]
- Mengel, D.B.; Barber, S.A. Development and distribution of the corn root system under field conditions. Agron. J. 1974, 68, 341–344. [Google Scholar] [CrossRef]
- Wiesler, F.; Horst, W.J. Differences among maize cultivars in the utilization of soil nitrate and the related losses of nitrate through leaching. Plant Soil 1993, 151, 193–203. [Google Scholar] [CrossRef]
- Slaton, N.A.; Beyrouty, C.A.; Wells, B.R.; Norman, R.J.; Gbur, E.E. Root growth and distribution of two short-season rice genotypes. Plant Soil 1990, 126, 269–278. [Google Scholar] [CrossRef]


| Days to Heading (#) | Plant Height (cm) | Shoot Dry Matter (g) | Root-Shoot (g/g) | Root Dry Matter(g) | Yield (g) | Kernel Number (#) | Grain N Concentration (g N/g DM) | |||||||||
|---|---|---|---|---|---|---|---|---|---|---|---|---|---|---|---|---|
| High N | Low N | High N | Low N | High N | Low N | High N | Low N | High N | Low N | High N | Low N | High N | Low N | High N | Low N | |
| Opata | 39 | 40 | 57.9 | 63.2 | 1.74 | 1.80 | 0.16 | 0.09 | 0.27 | 0.15 | 1.82 | 2.26 | 43 | 59 | 56.7 | 57.6 |
| PI 189823 | 38 | 38 | 101.4 | 97.5 | 2.42 | 2.39 | 0.08 | 0.04 | 0.20 | 0.09 | 1.94 | 2.13 | 53 | 58 | 69.1 | 59.9 |
| PI 245427 | 44 | 51 | 77.0 | 94.9 | 1.67 | 2.57 | 0.26 | 0.32 | 0.47 | 0.91 | 1.85 | 2.42 | 37 | 55 | 51.4 | 48.9 |
| PI 519677 | 35 | 36 | 47.9 | 53.9 | 0.98 | 1.03 | 0.12 | 0.11 | 0.12 | 0.12 | 1.73 | 1.92 | 56 | 62 | 47.2 | 48.0 |
| PI 542457 | 62 | 64 | 100.8 | 94.6 | 5.08 | 4.10 | 0.32 | 0.34 | 1.66 | 1.39 | 2.28 | 1.86 | 107 | 93 | 61.1 | 39.1 |
| PI 626655 | 57 | 60 | 102.9 | 100.7 | 5.50 | 4.34 | 0.33 | 0.35 | 1.81 | 1.56 | 3.17 | 2.69 | 141 | 112 | 70.2 | 57.5 |
| PI 94379 | 53 | 57 | 105.4 | 104.6 | 4.25 | 3.36 | 0.25 | 0.18 | 1.06 | 0.62 | 2.55 | 2.15 | 67 | 55 | 63.4 | 49.1 |
| Average | 46 | 49 | 84.5 | 86.8 | 3.07 | 2.77 | 0.21 | 0.2 | 0.78 | 0.68 | 2.2 | 2.2 | 72.06 | 69.78 | 59.9 | 51.4 |
| Range | 35–62 | 36–64 | 47.9–105.4 | 53.9–104.6 | 0.98–5.49 | 1.03–4.34 | 0.08–0.33 | 0.03–0.35 | 0.12–1.81 | 0.09–1.56 | 1.73–3.17 | 1.86–2.69 | 37–141 | 55–112 | 47.2–70.2 | 39.1–59.9 |
| Repeatability | 86.79% | 77.18% | 83.08% | 85.13% | 85.76% | 73.87% | 50.20% | 62.86% | 69.74% | 72.41% | 25.24% | 3.01% | 73.87% | 49.35% | 87.13% | 95.45% |
| Line | *** | *** | *** | *** | *** | ns | *** | *** | ||||||||
| N Treatment | ns | ns | ns | . | ns | ns | ns | * | ||||||||
| L * T | ns | * | ** | ns | ns | ns | ns | ** | ||||||||
© 2020 by the authors. Licensee MDPI, Basel, Switzerland. This article is an open access article distributed under the terms and conditions of the Creative Commons Attribution (CC BY) license (http://creativecommons.org/licenses/by/4.0/).
Share and Cite
Tolley, S.; Mohammadi, M. Variation in Root and Shoot Growth in Response to Reduced Nitrogen. Plants 2020, 9, 144. https://doi.org/10.3390/plants9020144
Tolley S, Mohammadi M. Variation in Root and Shoot Growth in Response to Reduced Nitrogen. Plants. 2020; 9(2):144. https://doi.org/10.3390/plants9020144
Chicago/Turabian StyleTolley, Seth, and Mohsen Mohammadi. 2020. "Variation in Root and Shoot Growth in Response to Reduced Nitrogen" Plants 9, no. 2: 144. https://doi.org/10.3390/plants9020144
APA StyleTolley, S., & Mohammadi, M. (2020). Variation in Root and Shoot Growth in Response to Reduced Nitrogen. Plants, 9(2), 144. https://doi.org/10.3390/plants9020144