Biochemical and Genetic Responses of Tea (Camellia sinensis (L.) Kuntze) Microplants under Mannitol-Induced Osmotic Stress In Vitro

 ,
,  ,
,  and
and 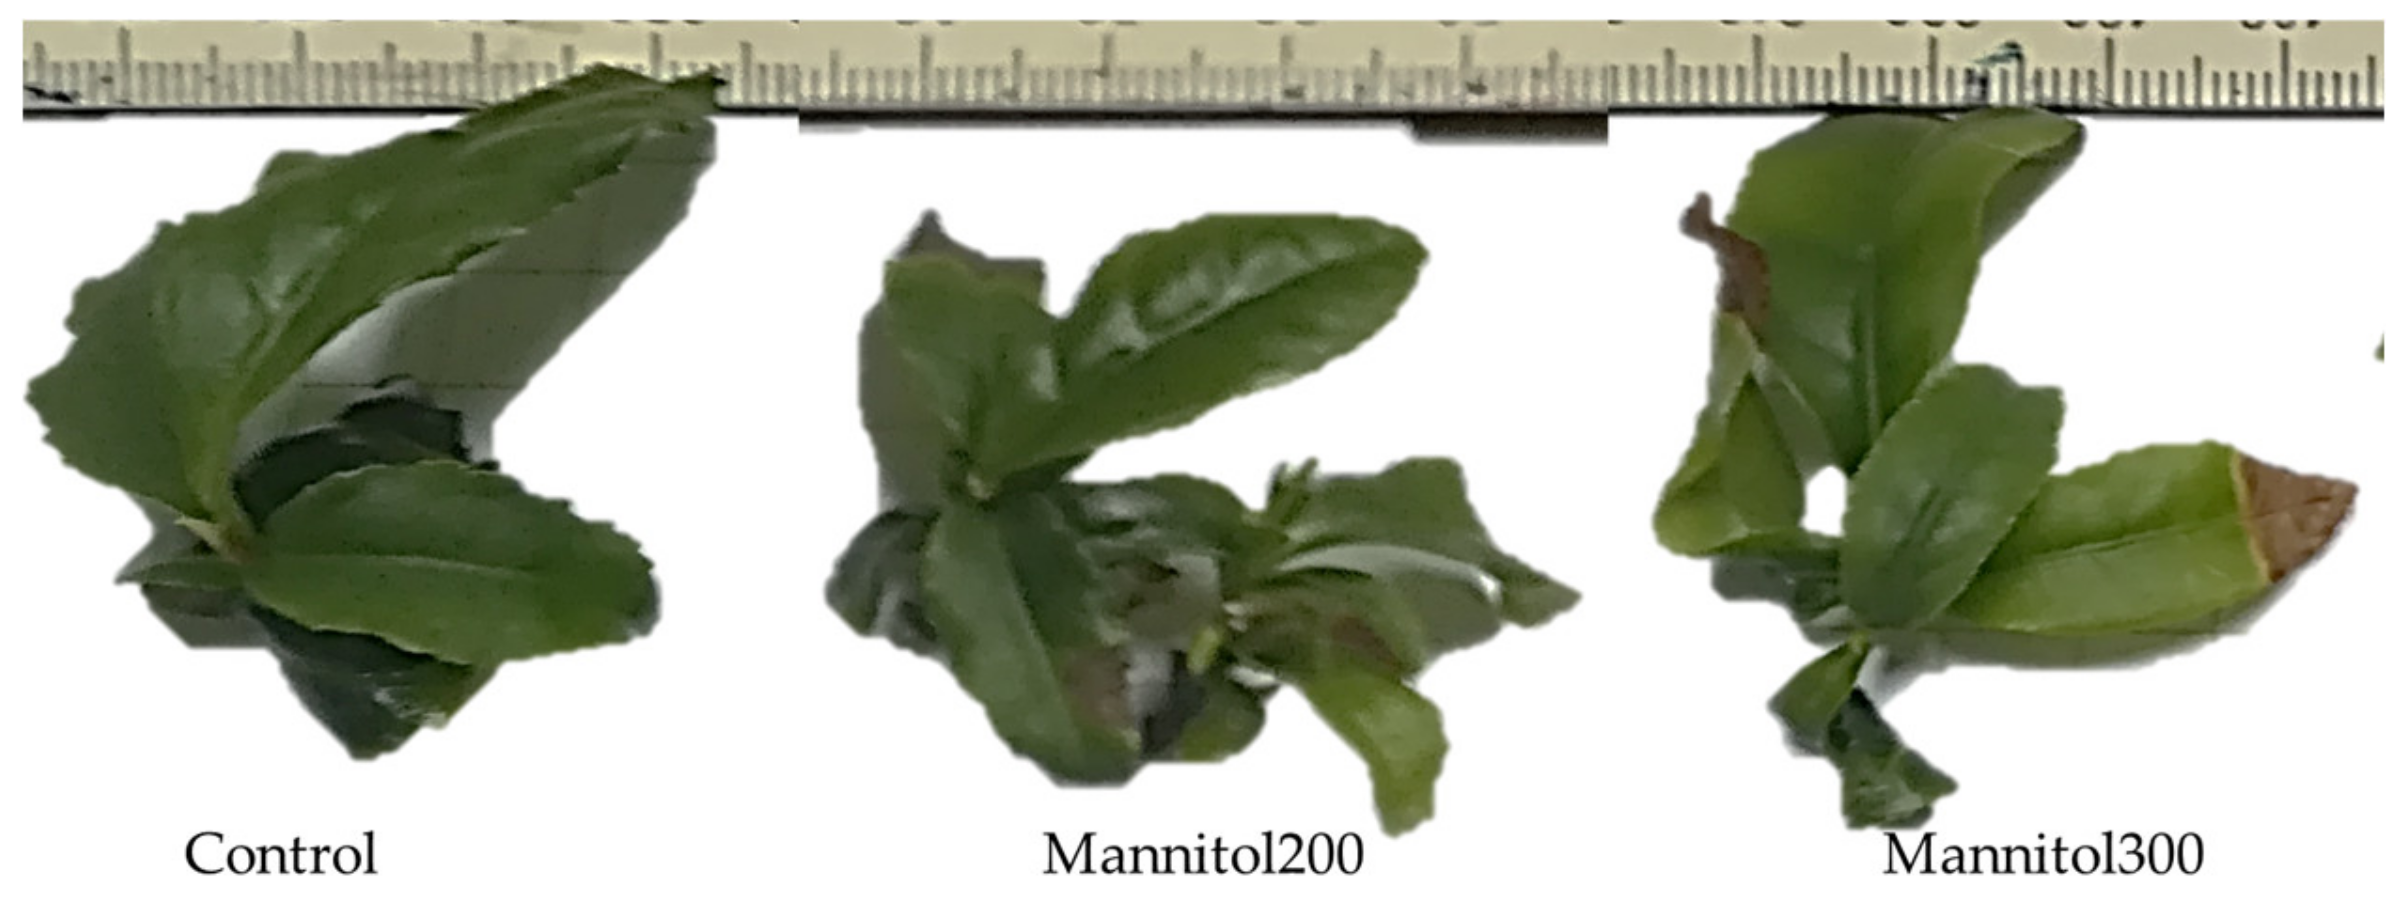
Abstract
1. Introduction
2. Results
2.1. Effect of Mannitol on Physiological and Biochemical Parameters of Tea Microplants
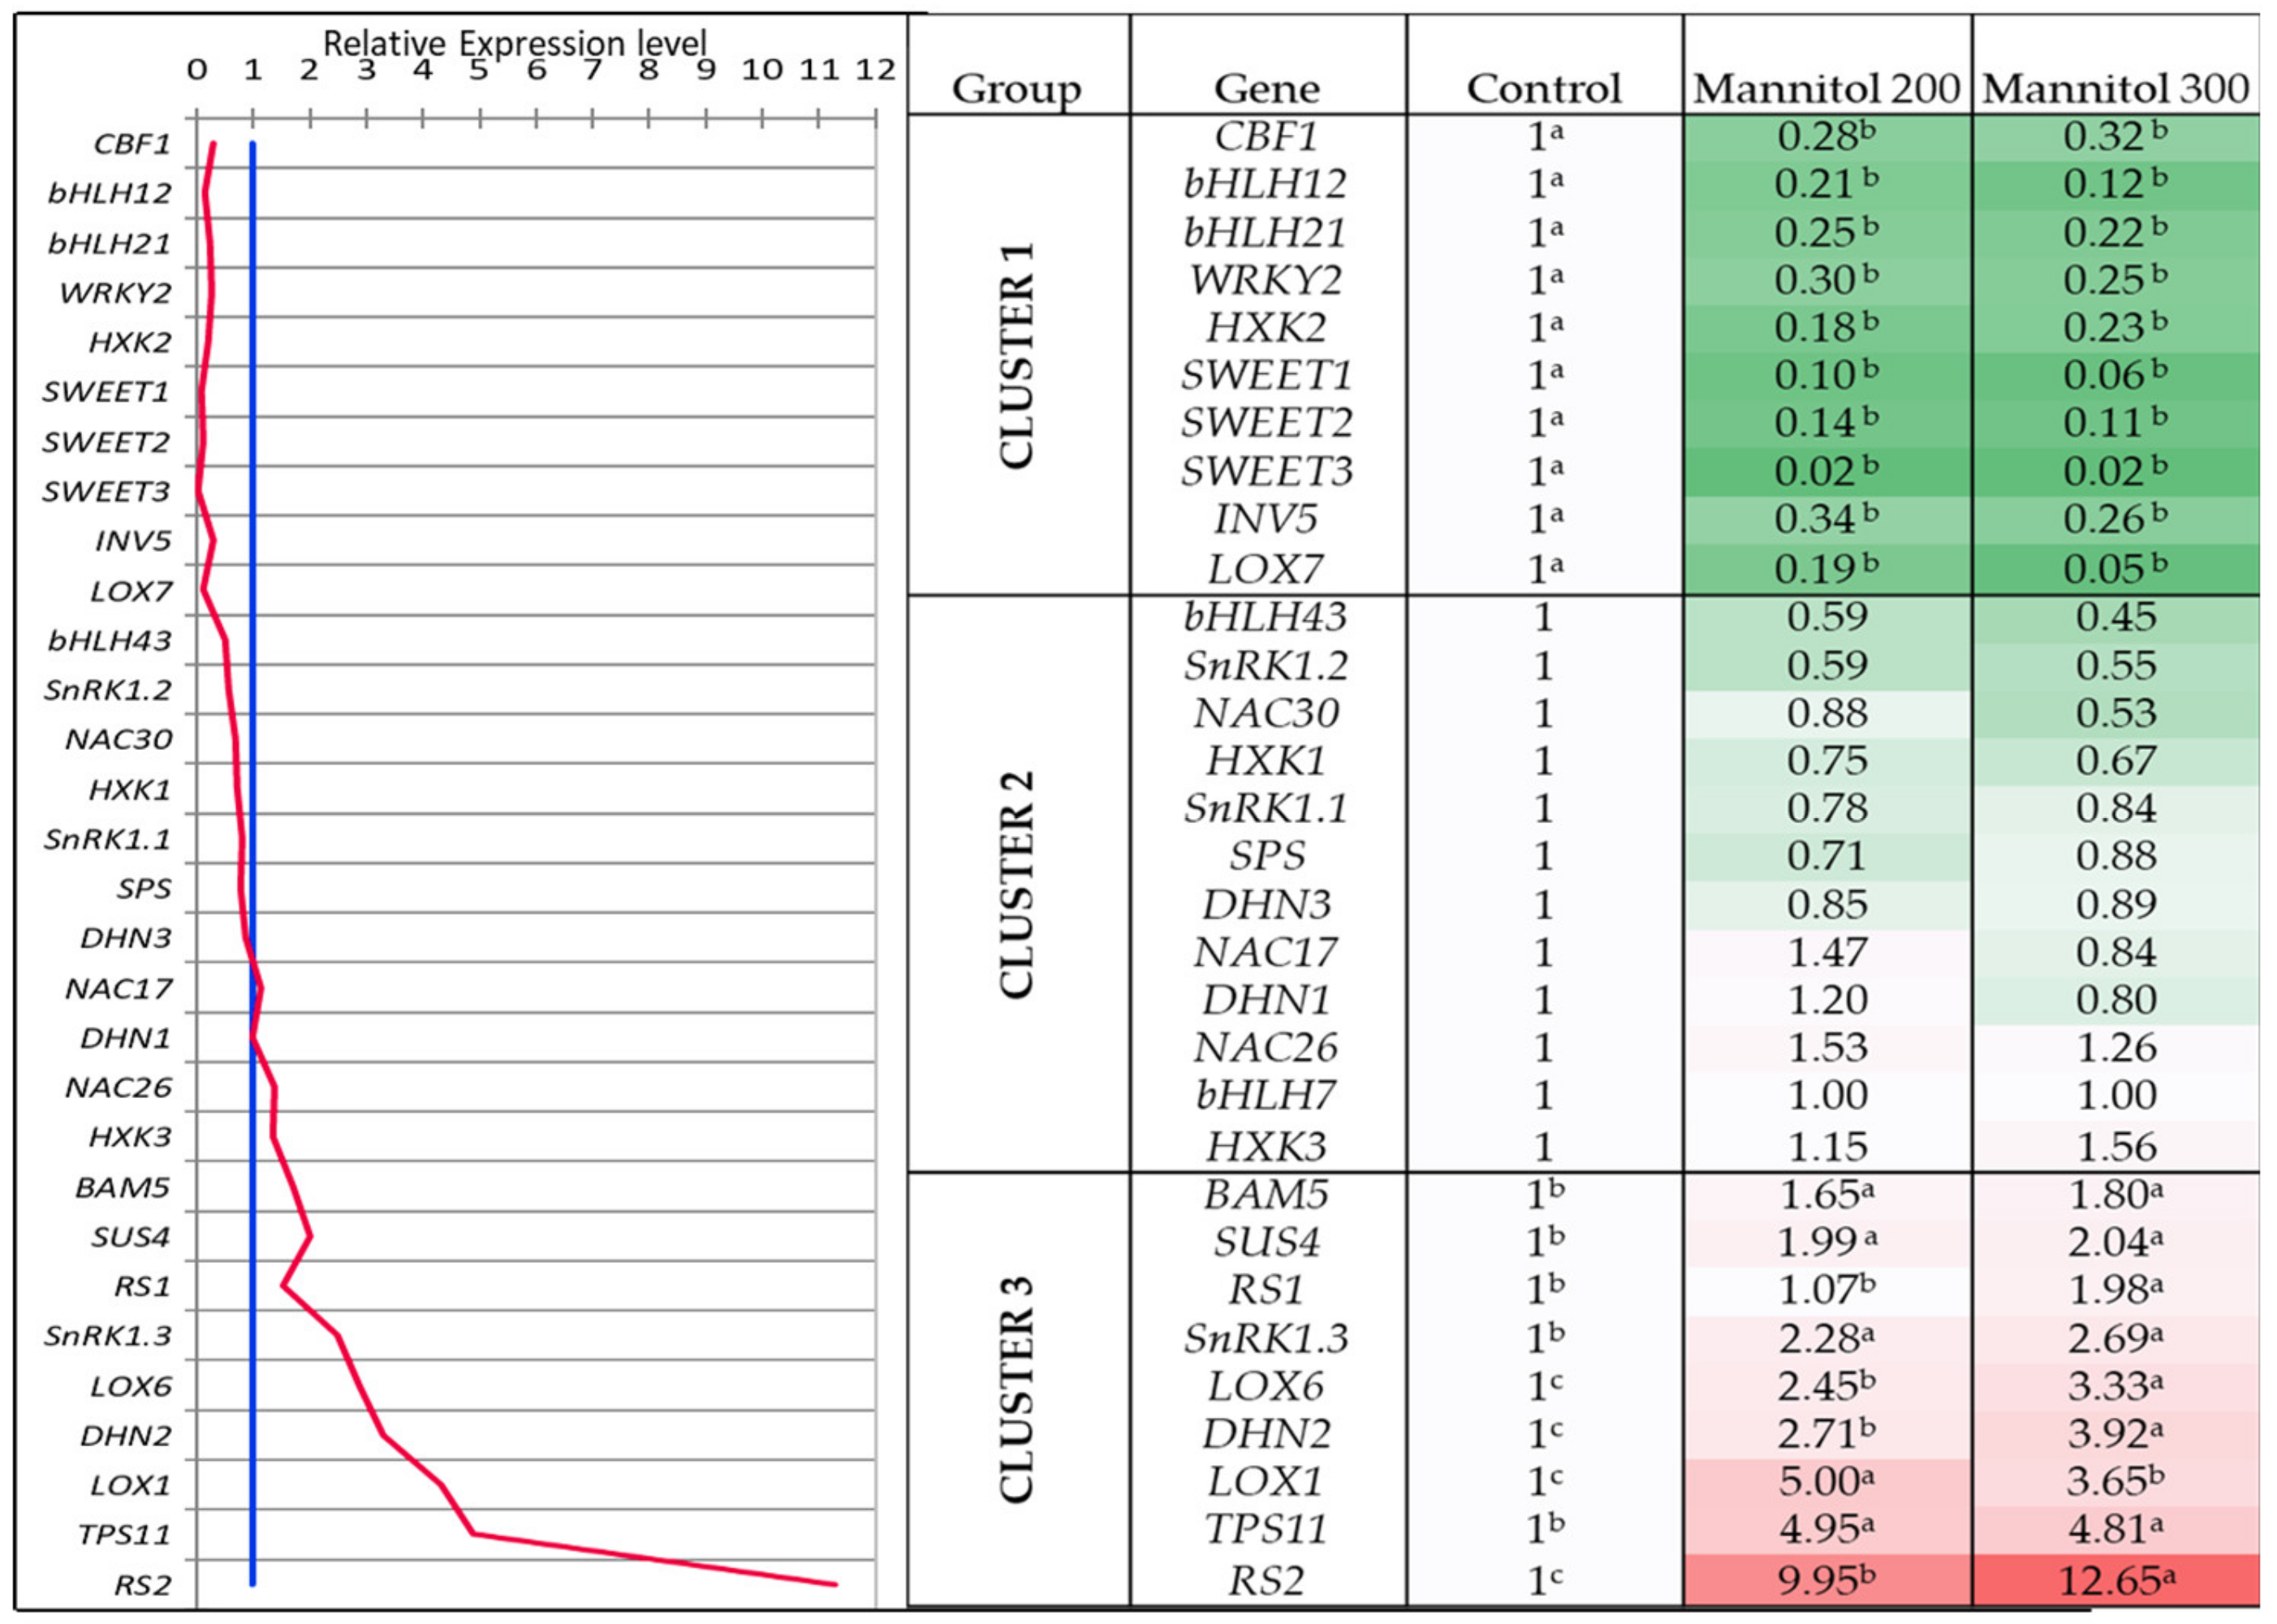
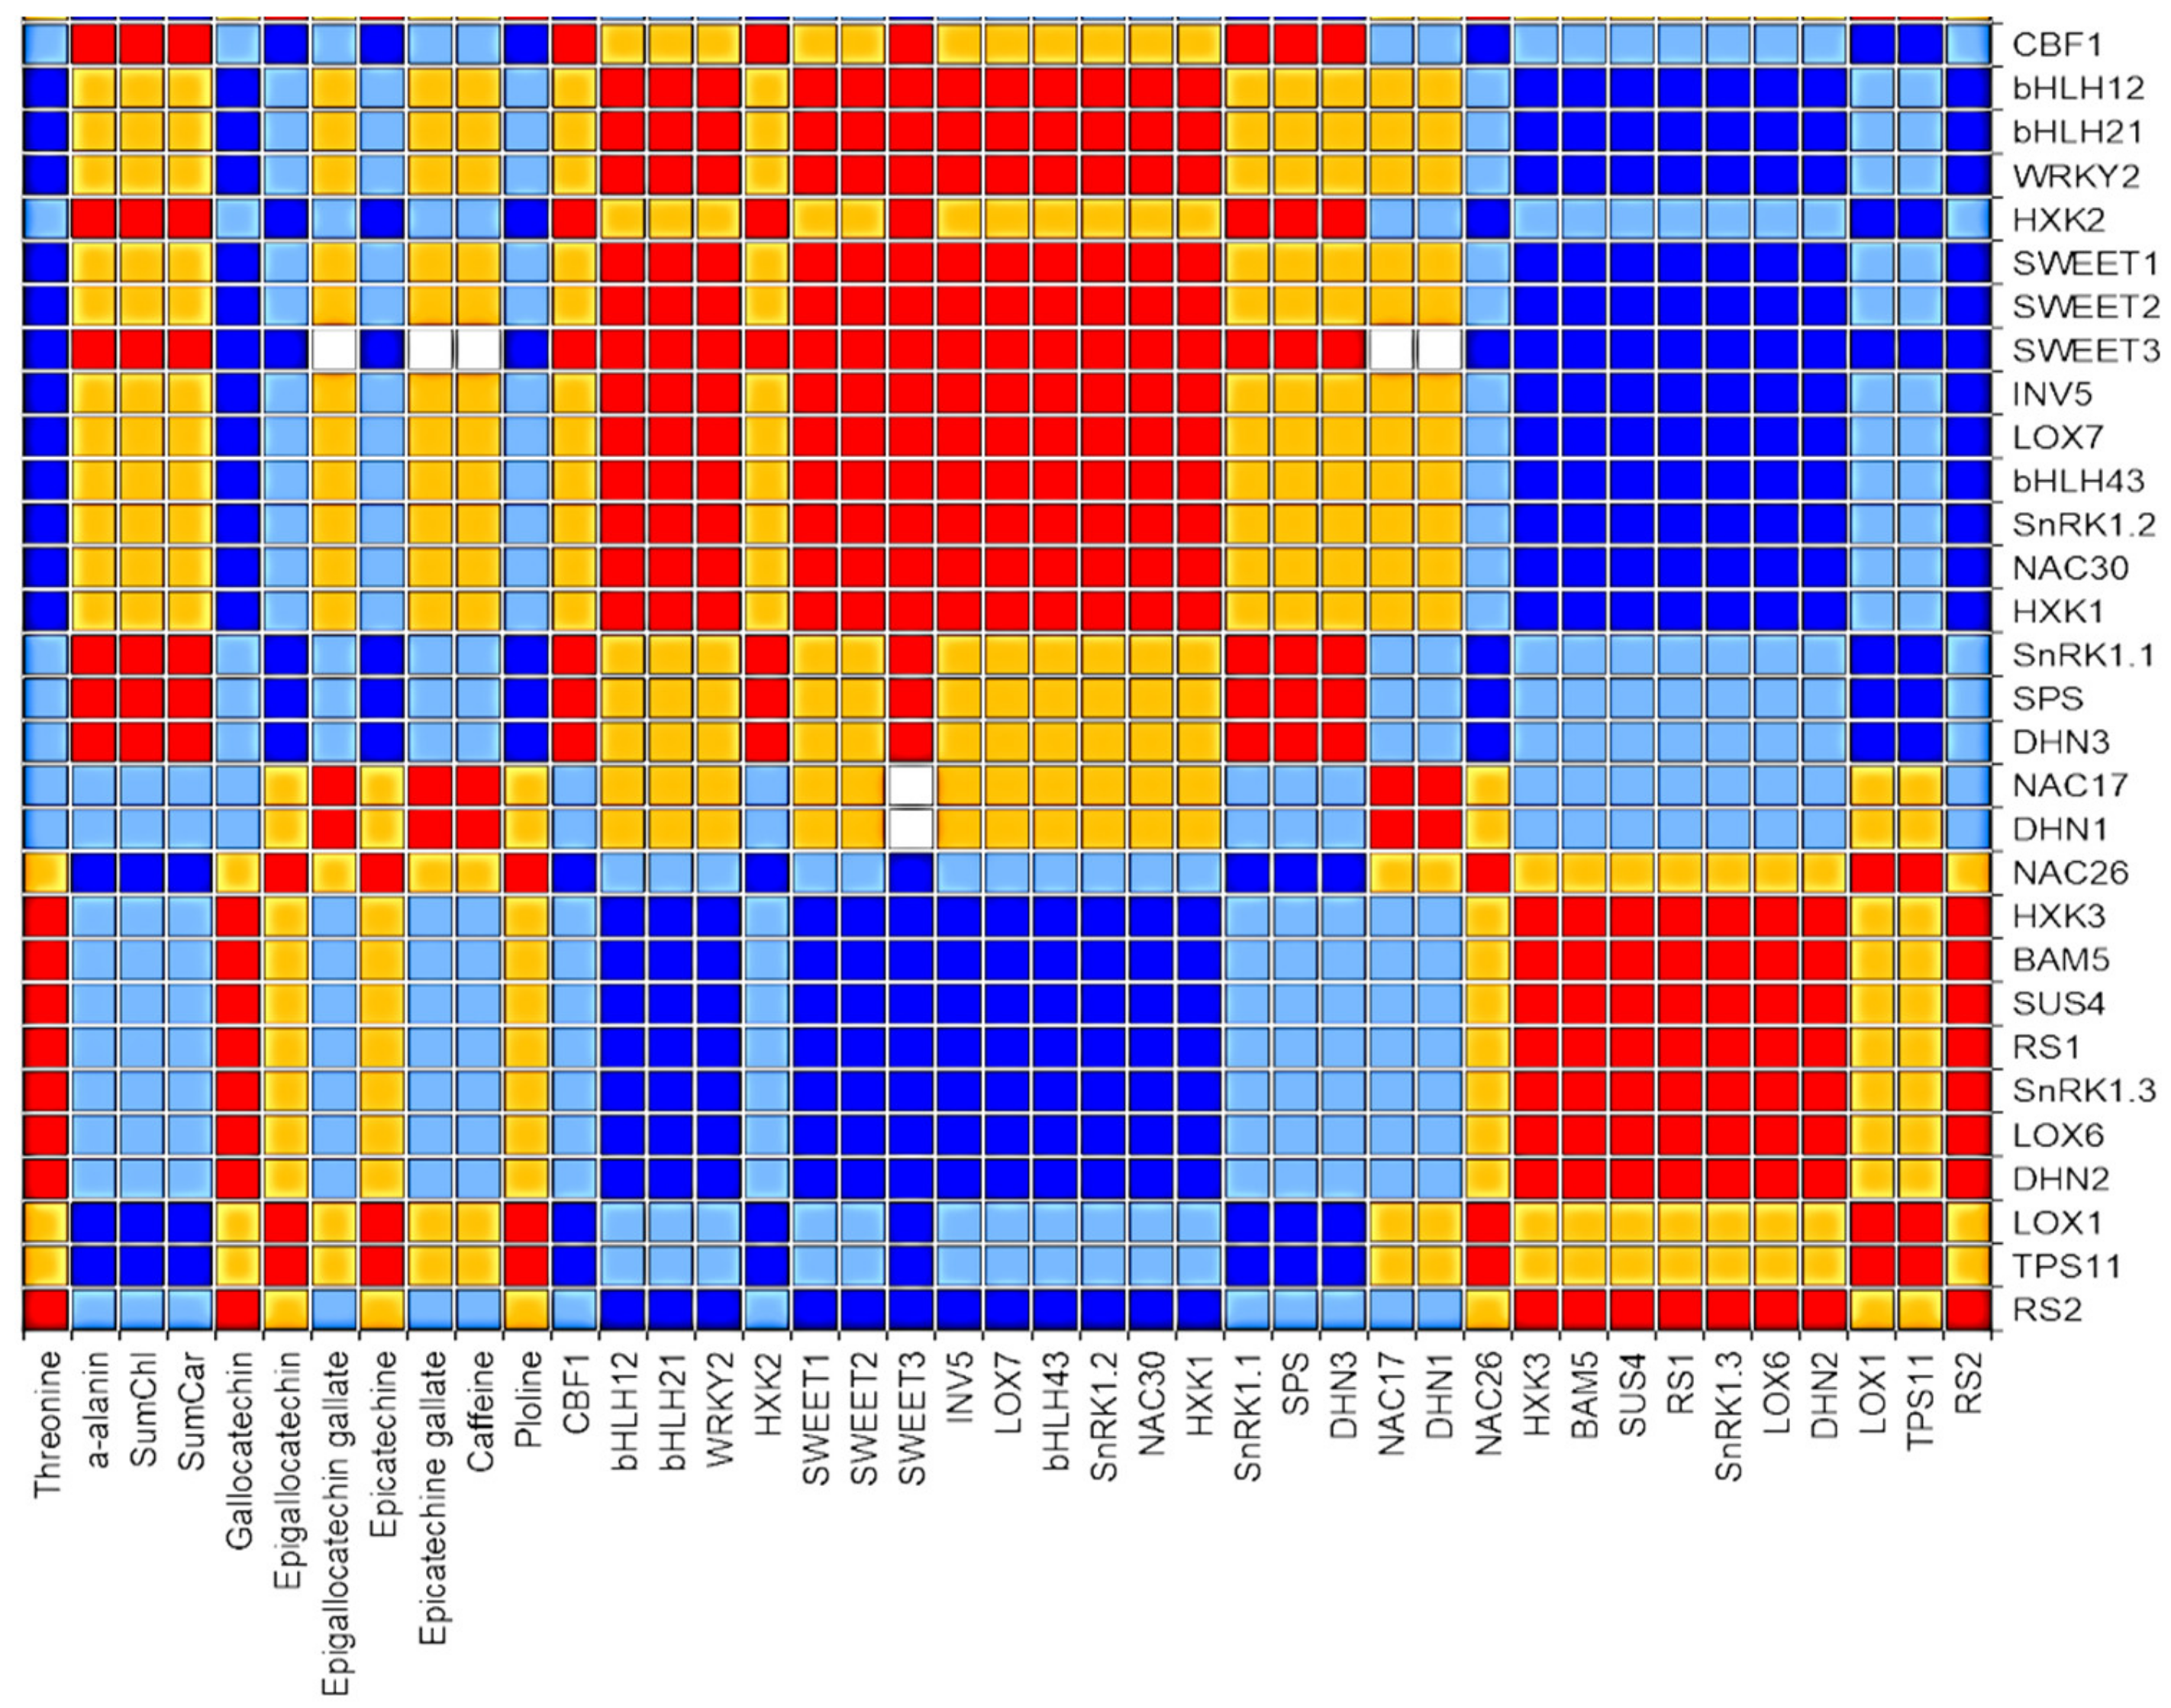
2.2. Effect of Mannitol on Expression Profile of Osmotic Stress-Related Genes in Tea Microplants
3. Discussion
4. Materials and Methods
4.1. Plant Material and Osmotic Stress Induction
4.2. Physiological Analyses
4.3. Gene Expression Analysis
4.4. Statistical Analysis
5. Conclusions
- (i)
- Threonine, proline, epigallocatechin, and epigallocatechin gallate were accumulated in response to mannitol and can be important markers for tea drought tolerance.
- (ii)
- Out of 31 studied genes, nine genes (DHN2, BAM, SUS4, RS1, RS2, SnRK1.3, TPS11, LOX1 and LOX6) were significantly upregulated in tea leaves under the mannitol effect, and six of them are related to the sugar metabolism. These genes can be proposed as the reliable markers of drought response in tea plant.
- (iii)
- Several transcription factors (CBF1, bHLH12, bHLH21, WRKY2) and sugar-signaling genes (HXK2, SWEET1,2,3), as well as metabolite genes (INV5, LOX7), were down-regulated in tea leaves under the mannitol effect, which can be related either to the stress exposure period or to their suppression under in vitro conditions.
- (iv)
- The similar expression character under both mannitol treatments was observed in the two groups of genes: the first group comprised seven genes (CBF1, DHN3, HXK2, SnRK1.1, SPS, SWEET3, and SWEET1) and second group included eight genes (DHN2, SnRK1.3, HXK3, RS1, RS2, LOX6, SUS4, and BAM5). These two modules of densely inter-connected genes can possibly have a high level of co-expression under the mannitol effect.
Supplementary Materials
Author Contributions
Funding
Acknowledgments
Conflicts of Interest
References
- Upadhyaya, H.; Sahoo, L.; Panda, S.K. Molecular Physiology of Osmotic Stress in Plants. In Molecular Stress Physiology of Plants; Rout, G., Das, A., Eds.; Springer: New Delhi, India, 2013. [Google Scholar] [CrossRef]
- Pérez-Clemente, R.M.; Gómez-Cadenas, A. In vitro tissue culture, a tool for the study and breeding of plants subjected to abiotic stress conditions. In Recent Advances in Plant In Vitro Culture; Leva, A., Rinaldi, L., Eds.; IntechOpen: Rijeka, Croatia, 2012; pp. 91–108. [Google Scholar] [CrossRef]
- Jewell, M.C.; Campbell, B.C.; Godwin, I.D. Transgenic plants for abiotic stress resistance. In Transgenic Crop Plants; Kole, C., Michler, C.H., Abbott, A.G., Hall, T.C., Eds.; Springer-Verlag: Berlin/Heidelberg, Germany, 2010; Volume 2, pp. 67–132. [Google Scholar]
- Darko, E.; Végh, B.; Khalil, R.; Marček, T.; Szalai, G.; Pál, M.; Janda, T. Metabolic responses of wheat seedlings to osmotic stress induced by various osmolytes under iso-osmotic conditions. PLoS ONE 2019, 14, e0226151. [Google Scholar] [CrossRef] [PubMed]
- Lopez-Puc, G. An effective in vitro slow growth protocol for conservation of the orchid Epidendrum chlorocorymbos SCHLTR. Trop. Subtrop. Agroecosyst. 2013, 16, 61–68. [Google Scholar]
- Claeys, H.; Landeghem, S.V.; Dubois, M.; Maleux, K.; Inzé, D. What is stress? Dose-response effects in commonly used in vitro stress assays. Plant Physiol. 2014, 165, 519–527. [Google Scholar] [CrossRef] [PubMed]
- Camillo, J.; Scherwinski-Pereira, J.E. In vitro maintenance, under slow-growth conditions, of oil palm germplasm obtained by embryo rescue. Pesqui. Agropecu. Bras. 2015, 50, 426–429. [Google Scholar] [CrossRef]
- El-Bahr, M.K.; Abd EL-Hamid, A.; Matter, M.A.; Shaltout, A.; Bekheet, S.A.; El-Ashry, A.A. In vitro conservation of embryogenic cultures of date palm using osmotic mediated growth agents. J. Genet. Eng. Biotechnol. 2016, 14, 363–370. [Google Scholar] [CrossRef]
- Ikeda, T.; Fujime, Y.; Terabayashi, S.; Date, S. Water status of garlic callus under various salt and osmotic stress conditions. HortScience 2002, 37, 404–405. [Google Scholar] [CrossRef]
- Roy, R.; Agrawal, V.; Gupta, S.C. Mannitol, polyethylene glycol and NaCl induced polypeptide changes during in vitro culture of three tomato cultivars. Biol. Plant. 2011, 55, 591–595. [Google Scholar] [CrossRef]
- Balen, B.; Tkalec, M.; Rogić, T.; Šimac, M.; Štefanić, P.P.; Rončević, S.; Svedružić, L.P.; Krsnik-Rasol, M. Effects of Iso-Osmotic NaCl and Mannitol on Growth, Proline Content, and Antioxidant Defense in Mammillaria gracilis Pfeiff. In Vitro-Grown Cultures. In Vitro Cell. Dev. Biol.—Plant 2013, 49, 421–432. [Google Scholar] [CrossRef]
- Osakabe, Y.; Arinaga, N.; Umezawa, T.; Katsura, S.; Nagamachi, K.; Tanaka, H.; Ohiraki, H.; Yamada, K.; Seo, S.; Abo, M.; et al. Osmotic Stress Responses and Plant Growth Controlled by Potassium Transporters in Arabidopsis. Plant Cell 2013, 25, 609–624. [Google Scholar] [CrossRef]
- Nikonorova, N.; Van den Broeck, L.; Zhu, S.; Van de Cotte, B.; Dubois, M.; Gevaert, K.; Inzé, D.; De Smet, I. Early mannitol-triggered changes in the Arabidopsis leaf (phospho)proteome reveal growth regulators. J. Exp. Bot. 2018, 69, 4591–4607. [Google Scholar] [CrossRef]
- Kulpa, D.; Gawlik, A.; Matuszak-Slamani, R.; Włodarczyk, M.; Bejger, R.; Sienkiewicz, M.; Gołębiowska, D.; Semeniuk, A. The effect of mannitol and sorbitol on soybean in vitro development. Folia Pomer. Univ. Technol. Stetin. Agric. Aliment. Pisc. Zootech. 2018, 341, 41–48. [Google Scholar] [CrossRef]
- Huang, G.T.; Ma, S.L.; Bai, L.P.; Zhang, L.; Ma, H.; Jia, P.; Liu, J.; Zhong, M.; Guo, Z.-F. Signal transduction during cold, salt, and drought stresses in plants. Mol. Biol. Rep. 2012, 2, 969–987. [Google Scholar] [CrossRef]
- Vinokur, B.; Altman, A. Recent advances in engineering plant tolerance to abiotic stress: Achievement and limitations. Curr. Opin. Biotechnol. 2005, 16, 123–132. [Google Scholar] [CrossRef]
- Rai, M.K.; Kalia, R.K.; Singh, R.; Gangola, M.P.; Dhawan, A.K. Developing stress tolerant plants through in vitro selection—An overview of the recent progress. Environ. Exp. Bot. 2011, 71, 89–98. [Google Scholar] [CrossRef]
- Turkozu, D.; Sanlier, N. L-theanine, unique amino acid of tea, and its metabolism, health effects, and safety. Crit. Rev. Food Sci. Nutr. 2017, 57, 1681–1687. [Google Scholar] [CrossRef]
- Tuov, M.; Ryndin, A. Perspective tea hybrids in subtropics of the Russian Federation. Subtrop. Ornam. Hortic. 2011, 44, 101–109. [Google Scholar]
- Parmar, R.; Seth, R.; Singh, P.; Singh, G.; Kumar, S.; Sharma, R.K. Transcriptional profiling of contrasting genotypes revealed key candidates and nucleotide variations for drought dissection in Camellia sinensis (L.) O. Kuntze. Sci. Rep. 2019, 9, 7487. [Google Scholar] [CrossRef]
- Fleta-Soriano, E.; Munné-Bosch, S. Stress Memory and the Inevitable Effects of Drought: A Physiological Perspective. Front. Plant Sci. 2016, 7, 143. [Google Scholar] [CrossRef]
- Wang, W.; Xin, H.; Wang, M.; Ma, Q.; Wang, L.; Kaleri, N.A.; Wang, Y.; Li, X. Transcriptomic Analysis Reveals the Molecular Mechanisms of Drought-Stress-Induced Decreases in Camellia sinensis Leaf Quality. Front. Plant Sci. 2016, 7, 385. [Google Scholar] [CrossRef]
- Liu, S.-C.; Jin, J.-Q.; Ma, J.-Q.; Yao, M.-Z.; Ma, C.-L.; Li, C.-F.; Ding, Z.-T.; Chen, L. Transcriptomic analysis of tea plant responding to drought stress and recovery. PLoS ONE 2016, 11, e0147306. [Google Scholar] [CrossRef]
- Wang, Y.; Jiang, C.-J.; Li, Y.-Y.; Wei, C.-L.; Deng, W.-W. CsICE1 and CsCBF1: Two transcription factors involved in cold responses in Camellia sinensis. Plant Cell Rep. 2012, 31, 27–34. [Google Scholar] [CrossRef]
- Yin, H.; Ma, Y.; Deng, Y.; Xu, Z.; Liu, J.; Zhao, J.; Dong, J.; Yu, J.; Chang, Z. Genome shuffling of Saccharomyces cerevisiae for enhanced glutathione yield and relative gene expression analysis using fluorescent quantitation reverse transcription polymerase chain reaction. J. Microbiol. Methods 2016, 127, 188–192. [Google Scholar] [CrossRef] [PubMed]
- Wang, Y.; Shu, Z.; Wang, W.; Jiang, X.; Li, D.; Pan, J.; Li, X. CsWRKY2, a novel WRKY gene from Camellia sinensis, is involved in cold and drought stress responses. Biol. Plant. 2016, 60, 443–451. [Google Scholar] [CrossRef]
- Wang, Y.-X.; Liu, Z.-W.; Wu, Z.-J.; Li, H.; Zhuang, J. Transcriptome-wide identification and expression analysis of the NAC gene family in tea plant [Camellia sinensis (L.) O. Kuntze]. PLoS ONE 2016, 11, e0166727. [Google Scholar] [CrossRef] [PubMed]
- Ban, Q.; Wang, X.; Pan, C.; Wang, Y.; Kong, L.; Jiang, H.; Xu, Y.; Wang, W.; Pan, Y.; Li, Y.; et al. Comparative analysis of the response and gene regulation in cold resistant and susceptible tea plants. PLoS ONE 2017, 12, e0188514. [Google Scholar] [CrossRef] [PubMed]
- Chen, J.; Gao, T.; Wan, S.; Zhang, Y.; Yang, J.; Yu, Y.; Wang, W. Genome-wide identification, classification and expression analysis of the hsp gene superfamily in tea plant (Camellia sinensis). Int. J. Mol. Sci. 2018, 19, 2633. [Google Scholar] [CrossRef]
- Cui, X.; Wang, Y.-X.; Liu, Z.-W.; Wang, W.-L.; Li, H.; Zhuang, J. Transcriptome-wide identification and expression profile analysis of the bHLH family genes in Camellia sinensis. Funct. Integr. Genomics 2018, 18, 489–503. [Google Scholar] [CrossRef] [PubMed]
- Hu, Z.; Ban, Q.; Hao, J.; Zhu, X.; Cheng, Y.; Mao, J.; Lin, M.; Xia, E.; Li, Y. Genome-Wide Characterization of the C-repeat Binding Factor (CBF) Gene Family Involved in the Response to Abiotic Stresses in Tea Plant (Camellia sinensis). Front. Plant Sci. 2020, 11, 921. [Google Scholar] [CrossRef] [PubMed]
- Nakashima, K.; Yamaguchi-Shinozaki, K.; Shinozaki, K. The transcriptional regulatory network in the drought response and its crosstalk in abiotic stress responses including drought, cold, and heat. Front. Plant Sci. 2014, 5, 170. [Google Scholar] [CrossRef]
- Yue, C.; Cao, H.L.; Wang, L.; Zhou, Y.H.; Huang, Y.T.; Hao, X.Y.; Wang, Y.C.; Wang, B.; Yang, Y.J.; Wang, X.C. Effects of CA on sugar metabolism and sugar-related gene expression in tea plant during the winter season. Plant Mol. Biol. 2015, 88, 591–608. [Google Scholar] [CrossRef]
- Samarina, L.S.; Malyukova, L.S.; Efremov, A.M.; Simonyan, T.A.; Matskiv, A.O.; Koninskaya, N.G.; Rakhmangulov, R.S.; Gvasaliya, M.V.; Malyarovskaya, V.I.; Ryndin, A.V.; et al. Physiological, biochemical and genetic responses of Caucasian tea (Camellia sinensis (L.) Kuntze) genotypes under cold and frost stress. PeerJ 2020, 8, e9787. [Google Scholar] [CrossRef] [PubMed]
- Kabbadj, A.; Makoudi, B.; Mouradi, M.; Pauly, N.; Frendo, P.; Ghoulam, C. Physiological and biochemical responses involved in water deficit tolerance of nitrogen-fixing Vicia faba. PLoS ONE 2017, 12, e0190284. [Google Scholar] [CrossRef] [PubMed]
- Ciarmiello, L.F.; Woodrow, P.; Fuggi, A.; Pontecorvo, G.; Carillo, P. Plant Genes for Abiotic Stress. In Abiotic Stress in Plants—Mechanisms and Adaptations; Shanker, A., Venkateswarlu, B., Eds.; InTech: Rijeka, Croatia, 2011; pp. 283–308. ISBN 978-953-307-394-1. [Google Scholar] [CrossRef]
- Rodrigues, R.M.; Souza, B.D.; Nogueira, R.M.; Santos, M.G. Tolerance to water deficit in young trees of jackfruit and sugar apple. Rev. Ciênc. Agron. 2010, 41, 245–252. [Google Scholar] [CrossRef]
- Parkash, V.; Singh, S. A Review on Potential Plant-Based Water Stress Indicators for Vegetable Crops. Sustainability 2020, 12, 3945. [Google Scholar] [CrossRef]
- Santos, C.V. Regulation of chlorophyll biosynthesis and degradation by salt stress in sunflower leaves. Sci. Hortic. 2004, 103, 93–99. [Google Scholar] [CrossRef]
- Füzy, A.; Kovács, R.; Cseresnyés, I.; Parádi, I.; Szili-Kovács, T.; Kelemen, B.; Rajkai, K.; Takács, T. Selection of plant physiological parameters to detect stress effects in pot experiments using principal component analysis. Acta Physiol. Plant. 2019, 41, 56. [Google Scholar] [CrossRef]
- Guo, X.; Xin, Z.; Yang, T.; Ma, T.; Zhang, Y.; Wang, Z.; Ren, Y.; Lin, T. Metabolomics response for drought stress tolerance in chinese wheat genotypes (Triticum aestivum). Plants 2020, 9, 520. [Google Scholar] [CrossRef]
- Hildebrandt, T.M. Synthesis versus degradation: Directions of amino acid metabolism during Arabidopsis abiotic stress response. Plant Mol. Biol. 2018, 98, 121–135. [Google Scholar] [CrossRef]
- Dar, M.I.; Naikoo, M.I.; Rehman, F.; Naushin, F.; Khan, F.A. Proline Accumulation in Plants: Roles in Stress Tolerance and Plant Development. In Osmolytes and Plants Acclimation to Changing Environment: Emerging Omics Technologies; Iqbal, N., Nazar, R., Khan, N.A., Eds.; Springer: New Delhi, India, 2016; pp. 155–166. [Google Scholar] [CrossRef]
- Muthuramalingam, P.; Krishnan, S.R.; Pandian, S.; Mareeswaran, N.; Aruni, W.; Pandian, S.K.; Ramesh, M. Global analysis of threonine metabolism genes unravel key players in rice to improve the abiotic stress tolerance. Sci. Rep. 2018, 8, 9270. [Google Scholar] [CrossRef]
- Joshi, V.; Joung, J.G.; Fei, Z.; Jander, G. Interdependence of threonine, methionine and isoleucine metabolism in plants: Accumulation and transcriptional regulation under abiotic stress. Amino Acids 2010, 39, 933–947. [Google Scholar] [CrossRef]
- Michaletti, A.; Naghavi, M.R.; Toorchi, M.; Zolla, L.; Rinalducci, S. Metabolomics and proteomics reveal drought-stress responses of leaf tissues from spring-wheat. Sci. Rep. 2018, 8, 5710. [Google Scholar] [CrossRef] [PubMed]
- You, J.; Zhang, Y.; Liu, A.; Li, D.; Wang, X.; Dossa, K.; Zhou, R.; Yu, J.; Zhang, Y.; Wang, L.; et al. Transcriptomic and metabolomic profiling of drought-tolerant and susceptible sesame genotypes in response to drought stress. BMC Plant Biol. 2019, 19, 267. [Google Scholar] [CrossRef] [PubMed]
- Diab, H.; Limami, A.M. Reconfiguration of N Metabolism upon Hypoxia Stress and Recovery: Roles of Alanine Aminotransferase (AlaAT) and Glutamate Dehydrogenase (GDH). Plants 2016, 5, 25. [Google Scholar] [CrossRef] [PubMed]
- Wei, K.; Wang, L.; Zhou, J.; He, W.; Zeng, J.; Jiang, Y.; Cheng, H. Catechin contents in tea (Camellia sinensis) as affected by cultivar and environment and their relation to chlorophyll contents. Food Chem. 2011, 125, 44–48. [Google Scholar] [CrossRef]
- Zhang, L.-Q.; Wei, K.; Cheng, H.; Wang, L.-Y.; Zhang, C.-C. Accumulation of catechins and expression of catechin synthetic genes in Camellia sinensis at different developmental stages. Bot. Stud. 2016, 57, 31. [Google Scholar] [CrossRef] [PubMed]
- Hernández, I.; Alegre, L.; Munné-Bosch, S. Drought-induced changes in flavonoids and other low molecular weight antioxidants in Cistus clusii grown under Mediterranean field conditions. Tree Physiol. 2004, 24, 1303–1311. [Google Scholar] [CrossRef]
- Langat, C.; Gathaara, M.H.; Cheruiyot, R. Comparative response of catechin levels in drought tolerant and drought susceptible tea clones (Camellia sinensis) (L) O. Kuntze under different moisture regimes. Afr. J. Plant Sci. 2015, 9, 334–338. [Google Scholar] [CrossRef]
- Cheruiyot, E.K.; Mumera, L.M.; Ng’etich, W.K.; Hassanali, A.; Wachira, F.; Wanyoko, J.K. Shoot Epicatechin and Epigallocatechin Contents Respond to Water Stress in Tea [Camellia sinensis (L.) O. Kuntze]. Biosci. Biotechnol. Biochem. 2008, 72, 1219–1226. [Google Scholar] [CrossRef][Green Version]
- Munivenkatappa, N.; Sarikonda, S.; Rajagopal, R.; Balakrishnan, R.; Krishnappa, N.C. Variations in quality constituents of green tea leaves in response to drought stress under south Indian condition. Sci. Hortic. 2018, 233, 359–369. [Google Scholar] [CrossRef]
- Król, A.; Amarowicz, R.; Weidner, S. Changes in the composition of phenolic compounds and antioxidant properties of grapevine roots and leaves (Vitis vinifera L.) under continuous of long-term drought stress. Acta Physiol. Plant. 2014, 36, 1491–1499. [Google Scholar] [CrossRef]
- Dey, N.; Bhattacharjee, S. Accumulation of polyphenolic compounds and osmolytes under dehydration stress and their implication in redox regulation in four indigenous aromatic rice cultivars. Rice Sci. 2020, 27, 329–344. [Google Scholar] [CrossRef]
- Hong, G.; Wang, J.; Hochstetter, D.; Gao, Y.; Xu, P.; Wang, Y. Epigallocatechin-3-gallate functions as a physiological regulator by modulating the jasmonic acid pathway. Physiol. Plant. 2015, 153, 432–439. [Google Scholar] [CrossRef] [PubMed]
- Petrussa, E.; Braidot, E.; Zancani, M.; Peresson, C.; Bertolini, A.; Patui, S.; Vianello, A. Plant flavonoids–biosynthesis, transport and involvement in stress responses. Int. J. Mol. Sci. 2013, 14, 14950–14973. [Google Scholar] [CrossRef] [PubMed]
- Ahammed, G.J.; Li, Y.; Li, X.; Han, W.-Y.; Chen, S. Epigallocatechin-3-Gallate alleviates salinity-retarded seed germination and oxidative stress in tomato. J. Plant Growth Regul. 2018, 37, 1349–1356. [Google Scholar] [CrossRef]
- Hanin, M.; Brini, F.; Ebel, C.; Toda, Y.; Takeda, S.; Masmoudi, K. Plant dehydrins and stress tolerance. Plant Signal. Behav. 2011, 6, 503–1509. [Google Scholar] [CrossRef]
- Zhu, J.; Wang, X.; Guo, L.; Xu, Q.; Zhao, S.; Li, F.; Yan, X.; Liu, S.; Wei, C. Characterization and alternative splicing profiles of the lipoxygenase gene family in tea plant (Camellia sinensis). Plant Cell Physiol. 2018, 59, 1765–1781. [Google Scholar] [CrossRef]
- Li, L.; Lu, X.; Ma, H.; Lyu, D. Jasmonic acid regulates the ascorbate–glutathione cycle in Malus baccata Borkh. roots under low root-zone temperature. Acta Physiol. Plant. 2017, 39, 174. [Google Scholar] [CrossRef]
- Stein, O.; Granot, D. An overview of sucrose synthases in plants. Front. Plant Sci. 2011, 10, 95. [Google Scholar] [CrossRef]
- Paul, M.J.; Primavesi, L.F.; Jhurreea, D.; Zhang, Y. Trehalose metabolism and signaling. Annu. Rev. Plant Biol. 2008, 59, 417–441. [Google Scholar] [CrossRef]
- Kaeppler, S.M.; Phillips, R.L. DNA methylation and tissue culture-induced variation in plants. In Vitro Cell. Dev. Biol.—Plant 1993, 29, 125–130. [Google Scholar] [CrossRef]
- Bednarek, P.T.; Orłowska, R. Plant tissue culture environment as a switch-key of (epi)genetic changes. Plant Cell Tissue Organ Cult. (PCTOC) 2020, 140, 245–257. [Google Scholar] [CrossRef]
- Us-Camas, R.; Rivera-Solıs, G.; Duarte-Ake, F.; De-la-Pena, C. In vitro culture: An epigenetic challenge for plants. Plant Cell Tissue Organ Cult. (PCTOC) 2014, 118, 187–201. [Google Scholar] [CrossRef]
- Sharma, R.; Singh, G.; Bhattacharya, S.; Singh, A. Comparative transcriptome meta-analysis of Arabidopsis thaliana under drought and cold stress. PLoS ONE 2018, 13, e0203266. [Google Scholar] [CrossRef] [PubMed]
- Li, J.; Yang, Y.; Iqba, A.; Qadri, R.; Shi, P.; Wang, Y.; Wu, Y.; Fan, H.; Wu, G. Correlation analysis of coldrelated gene expression with physiological and biochemical indicators under cold stress in oil palm. PLoS ONE 2019, 14, e0225768. [Google Scholar] [CrossRef]
- Murashige, T.; Skoog, F. A revised medium for rapid growth and bio assays with tobacco tissue cultures. Physiol. Plant. 1962, 15, 473–497. [Google Scholar] [CrossRef]
- Gvasaliya, M.V. Spontaneous and Induced Cultivars and Forms of Tea (Camellia sinensis (L.) Kuntze) in the Humid Subtropics of Russia and Georgia: Prospects for Their Cultivation and In Vitro Conservation. Ph.D. Thesis, Kuban State Agrarian University, Krasnodar, Russia, 2015. [Google Scholar]
- Bajji, M.; Kinet, J.-M.; Lutts, S. The use of the electrolyte leakage method for assessing cell membrane stability as a water stress tolerance test in durum wheat. Plant Growth Regul. 2002, 36, 61–70. [Google Scholar] [CrossRef]
- Saura-Mas, S.; Lloret, F. Leaf and shoot water content and leaf dry matter content of mediterranean woody species with different post-fire regenerative strategies. Ann. Bot. 2007, 99, 545–554. [Google Scholar] [CrossRef]
- Shlyk, A.A. Assessment of Chlorophyll and Carotenoids in Extracts of Green Leaves. In Biochem Methods Plant Physiol; Science: Moscow, Russia, 1971; pp. 154–171. [Google Scholar]
- Brykalov, A.V.; Yakub, Y.F.; Shanaeva, E.A.; Belik, E.V.; Gryadskikh, D.A. The Use of Capillary Electrophoresis and Gas Chromatography for the Study of Biologically Active Compounds. Ph.D. Thesis, Kuban State Agrarian University, Krasnodar, Russia, 2019. [Google Scholar]
- Doyle, J.J.; Doyle, J.L. Isolation of plant DNA from fresh tissue. Focus 1991, 12, 13–15. [Google Scholar]
- Hao, X.; Horvath, D.P.; Chao, W.S.; Yang, Y.; Wang, X.; Xiao, B. Identification and Evaluation of Reliable Reference Genes for Quantitative Real-Time PCR Analysis in Tea Plant (Camellia sinensis (L.) O. Kuntze). Int. J. Mol. Sci. 2014, 15, 22155–22172. [Google Scholar] [CrossRef]
- Livak, K.J.; Schmittgen, T.D. Analysis of relative gene expression data using realtime quantitative PCR and the 2−∆∆CT method. Methods 2001, 25, 402–408. [Google Scholar] [CrossRef]


Publisher’s Note: MDPI stays neutral with regard to jurisdictional claims in published maps and institutional affiliations. |
© 2020 by the authors. Licensee MDPI, Basel, Switzerland. This article is an open access article distributed under the terms and conditions of the Creative Commons Attribution (CC BY) license (http://creativecommons.org/licenses/by/4.0/).
Share and Cite
Samarina, L.; Matskiv, A.; Simonyan, T.; Koninskaya, N.; Malyarovskaya, V.; Gvasaliya, M.; Malyukova, L.; Tsaturyan, G.; Mytdyeva, A.; Martinez-Montero, M.E.; et al. Biochemical and Genetic Responses of Tea (Camellia sinensis (L.) Kuntze) Microplants under Mannitol-Induced Osmotic Stress In Vitro. Plants 2020, 9, 1795. https://doi.org/10.3390/plants9121795
Samarina L, Matskiv A, Simonyan T, Koninskaya N, Malyarovskaya V, Gvasaliya M, Malyukova L, Tsaturyan G, Mytdyeva A, Martinez-Montero ME, et al. Biochemical and Genetic Responses of Tea (Camellia sinensis (L.) Kuntze) Microplants under Mannitol-Induced Osmotic Stress In Vitro. Plants. 2020; 9(12):1795. https://doi.org/10.3390/plants9121795
Chicago/Turabian StyleSamarina, Lidiia, Alexandra Matskiv, Taisiya Simonyan, Natalia Koninskaya, Valentina Malyarovskaya, Maya Gvasaliya, Lyudmila Malyukova, Gregory Tsaturyan, Alfiya Mytdyeva, Marcos Edel Martinez-Montero, and et al. 2020. "Biochemical and Genetic Responses of Tea (Camellia sinensis (L.) Kuntze) Microplants under Mannitol-Induced Osmotic Stress In Vitro" Plants 9, no. 12: 1795. https://doi.org/10.3390/plants9121795
APA StyleSamarina, L., Matskiv, A., Simonyan, T., Koninskaya, N., Malyarovskaya, V., Gvasaliya, M., Malyukova, L., Tsaturyan, G., Mytdyeva, A., Martinez-Montero, M. E., Choudhary, R., & Ryndin, A. (2020). Biochemical and Genetic Responses of Tea (Camellia sinensis (L.) Kuntze) Microplants under Mannitol-Induced Osmotic Stress In Vitro. Plants, 9(12), 1795. https://doi.org/10.3390/plants9121795