Turfgrass Disease Diagnosis: Past, Present, and Future


Abstract

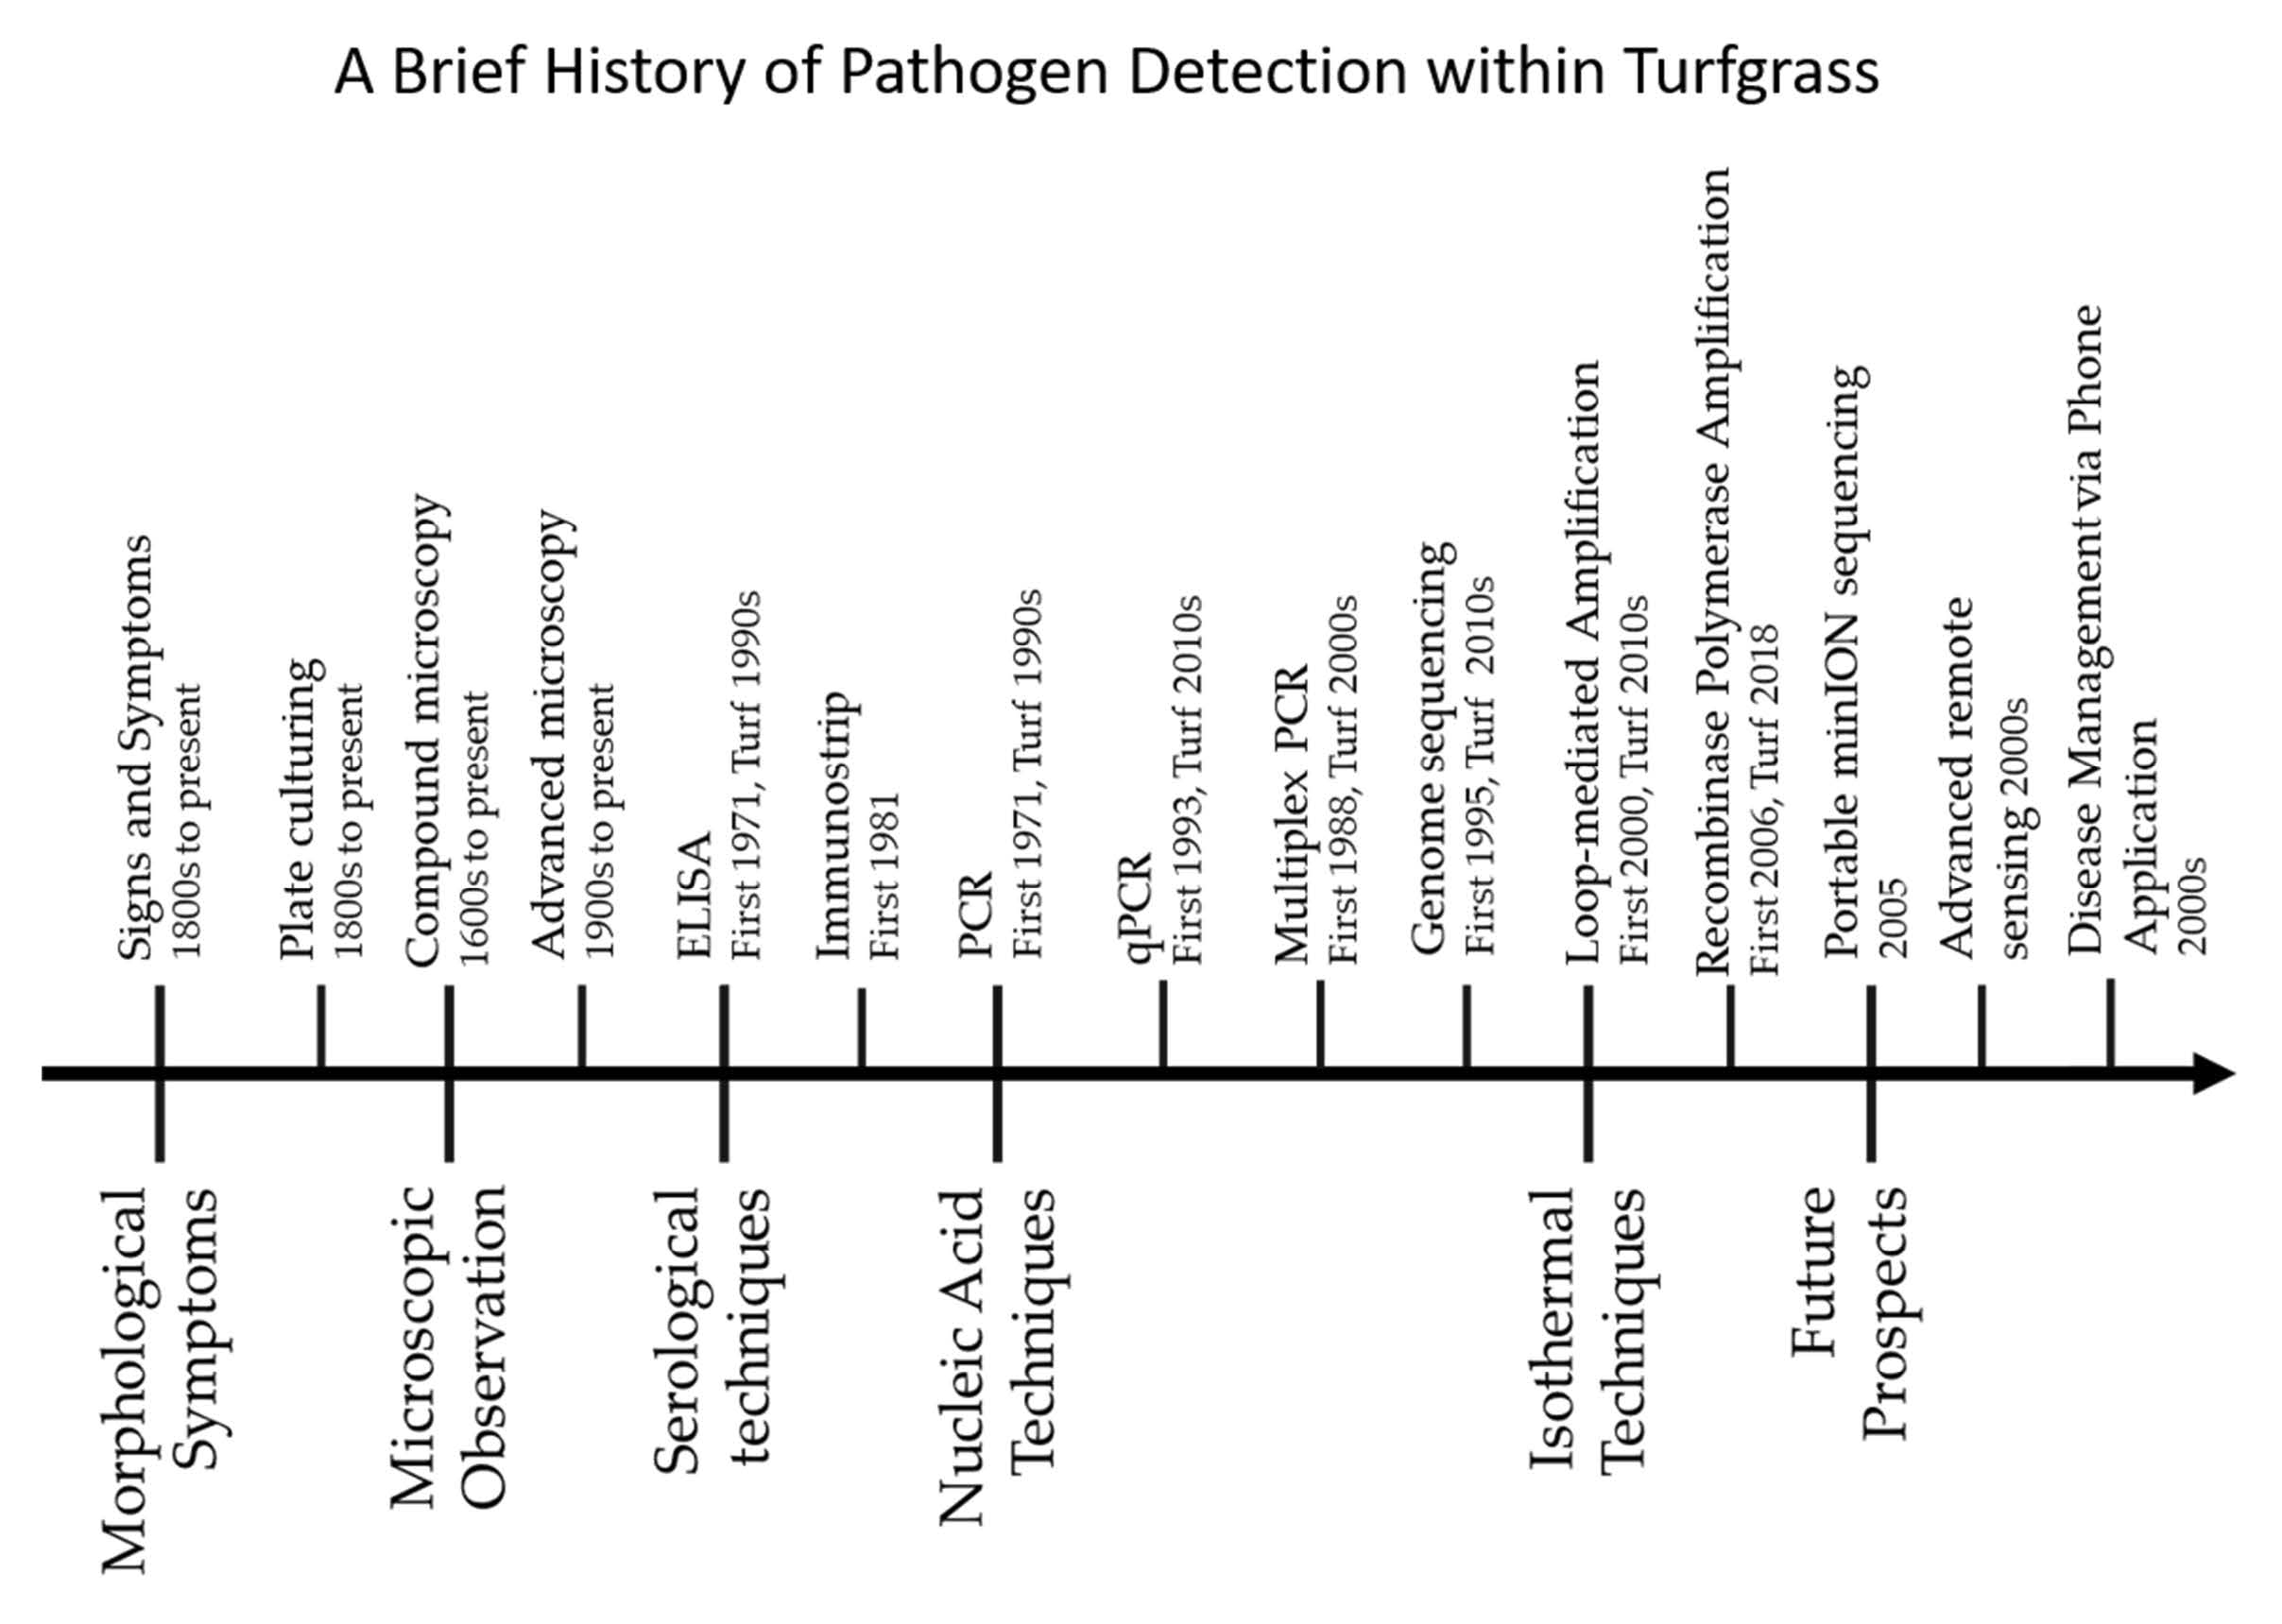
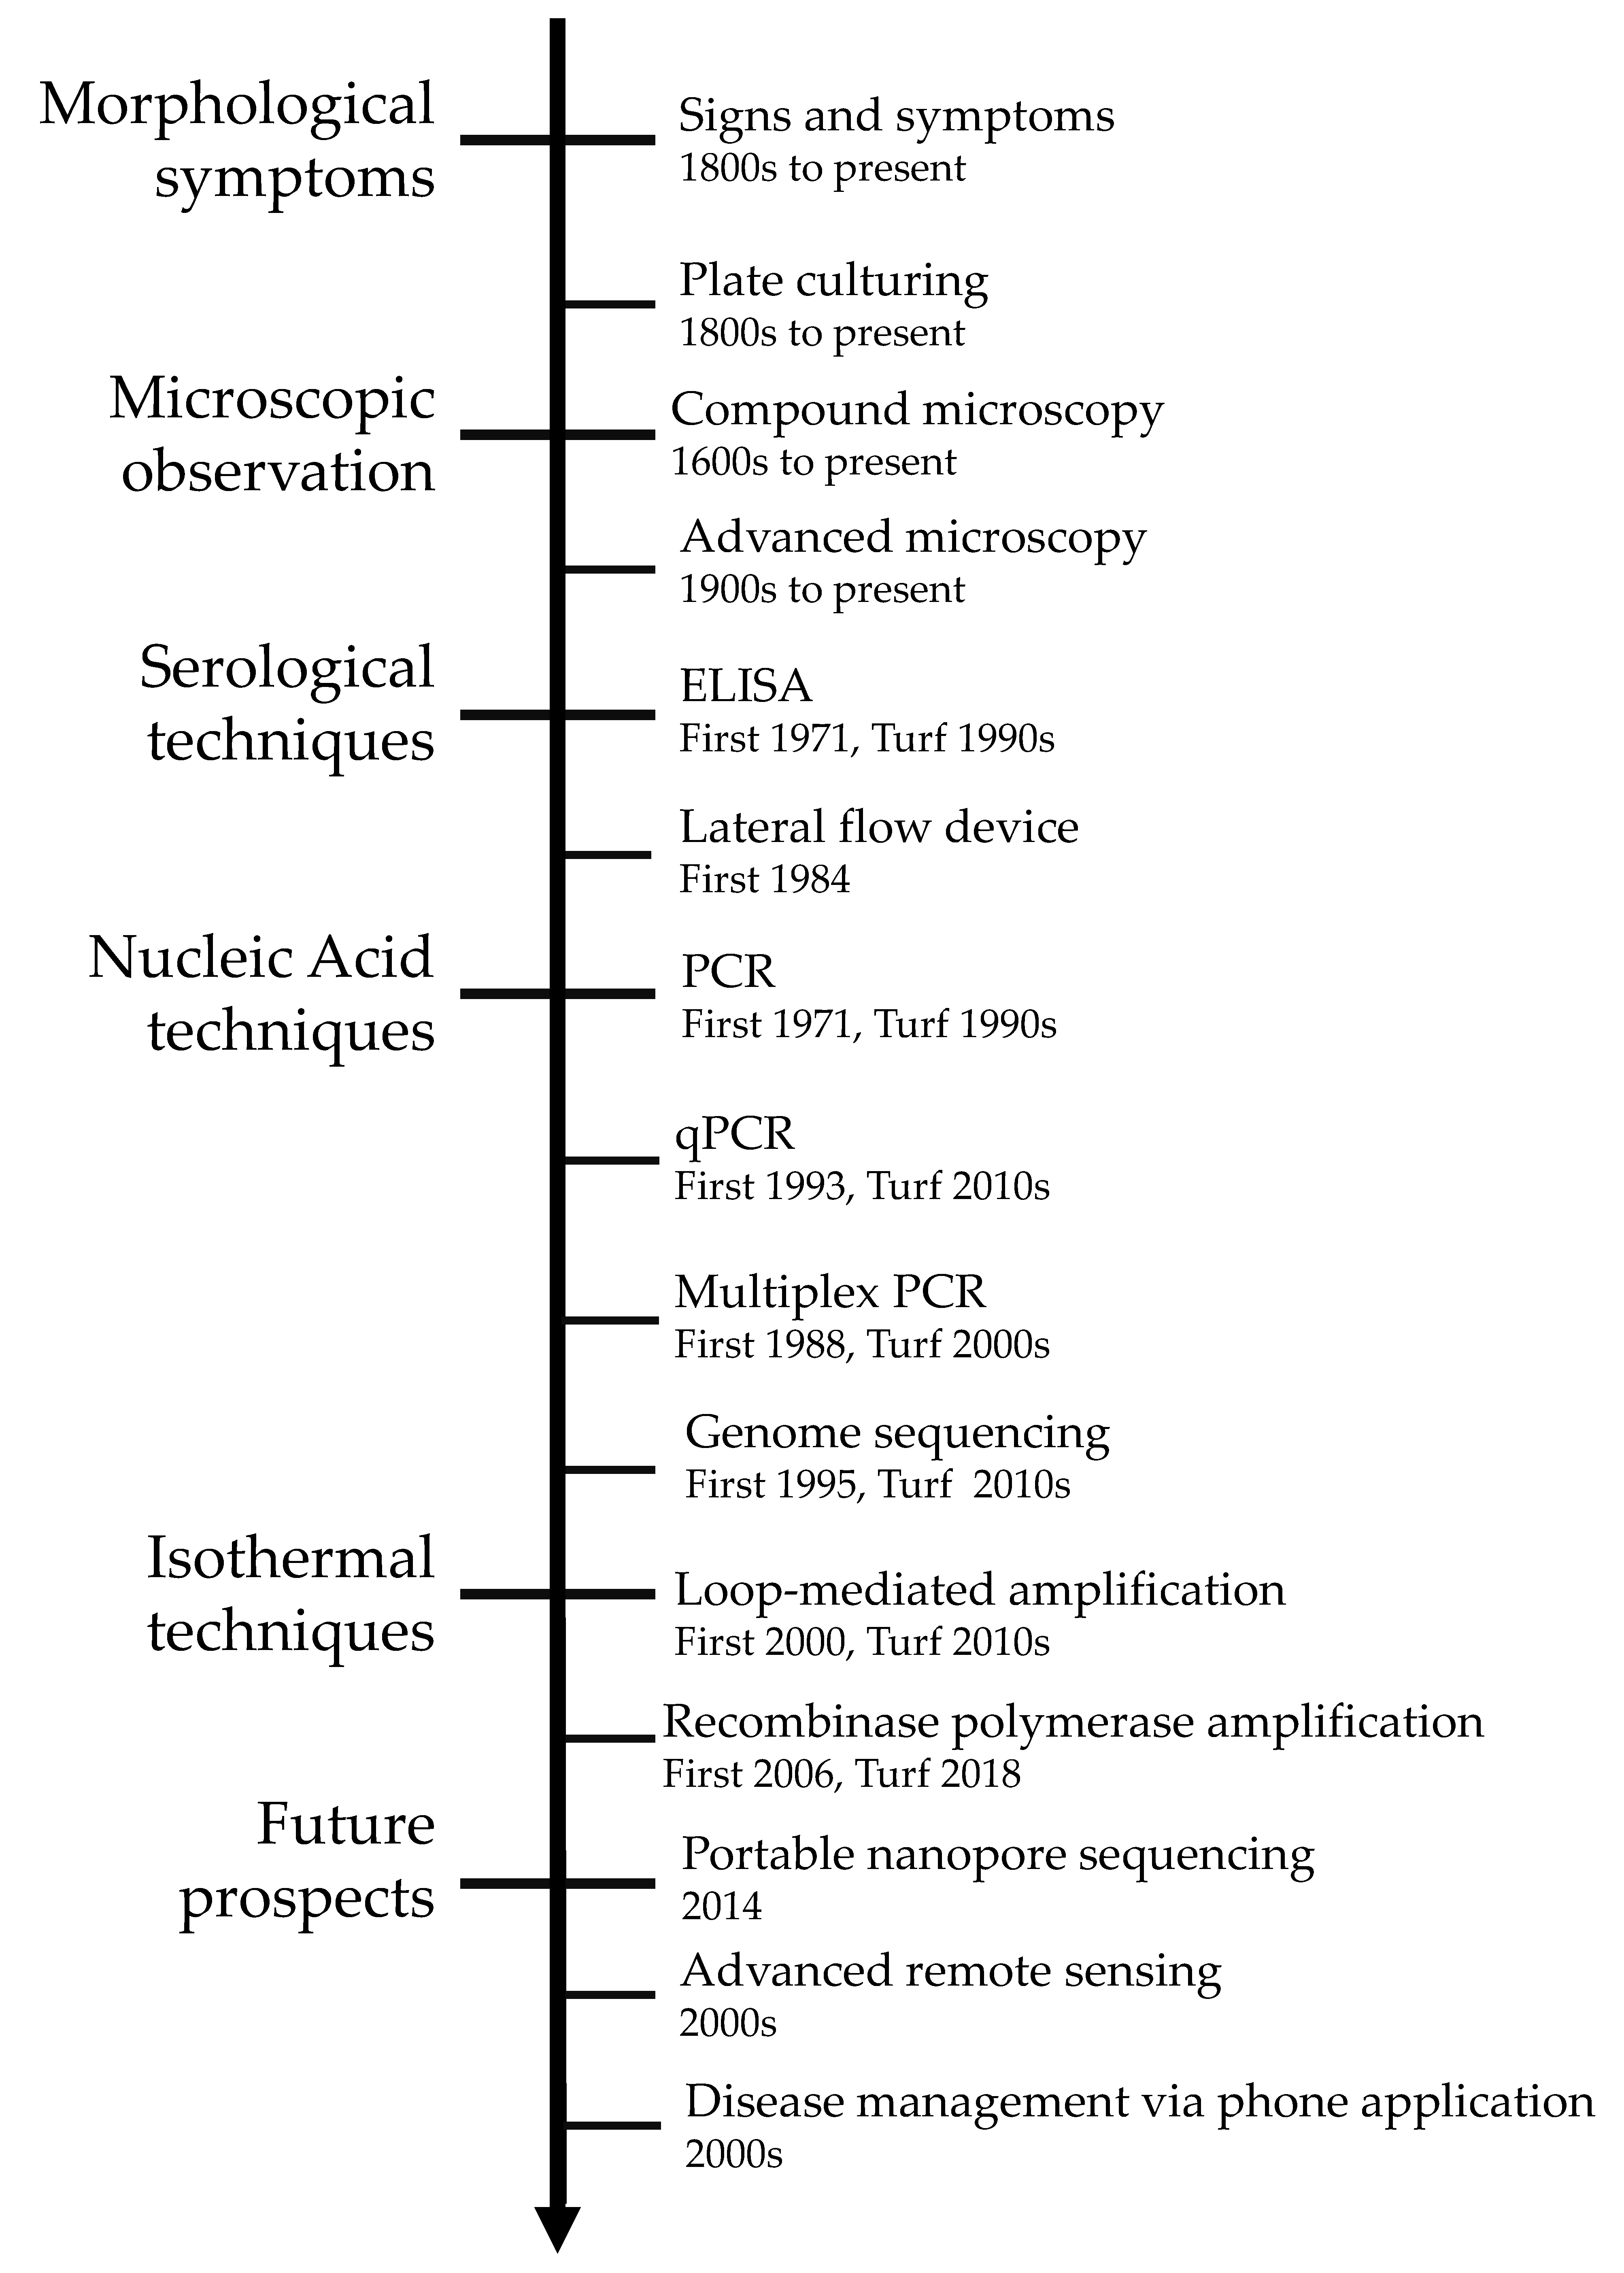
1. Introduction

2. Traditional Disease Detection Methods
2.1. Pathogen Signs and Disease Symptoms
2.2. Microscopy and Culturing
3. Serological Techniques
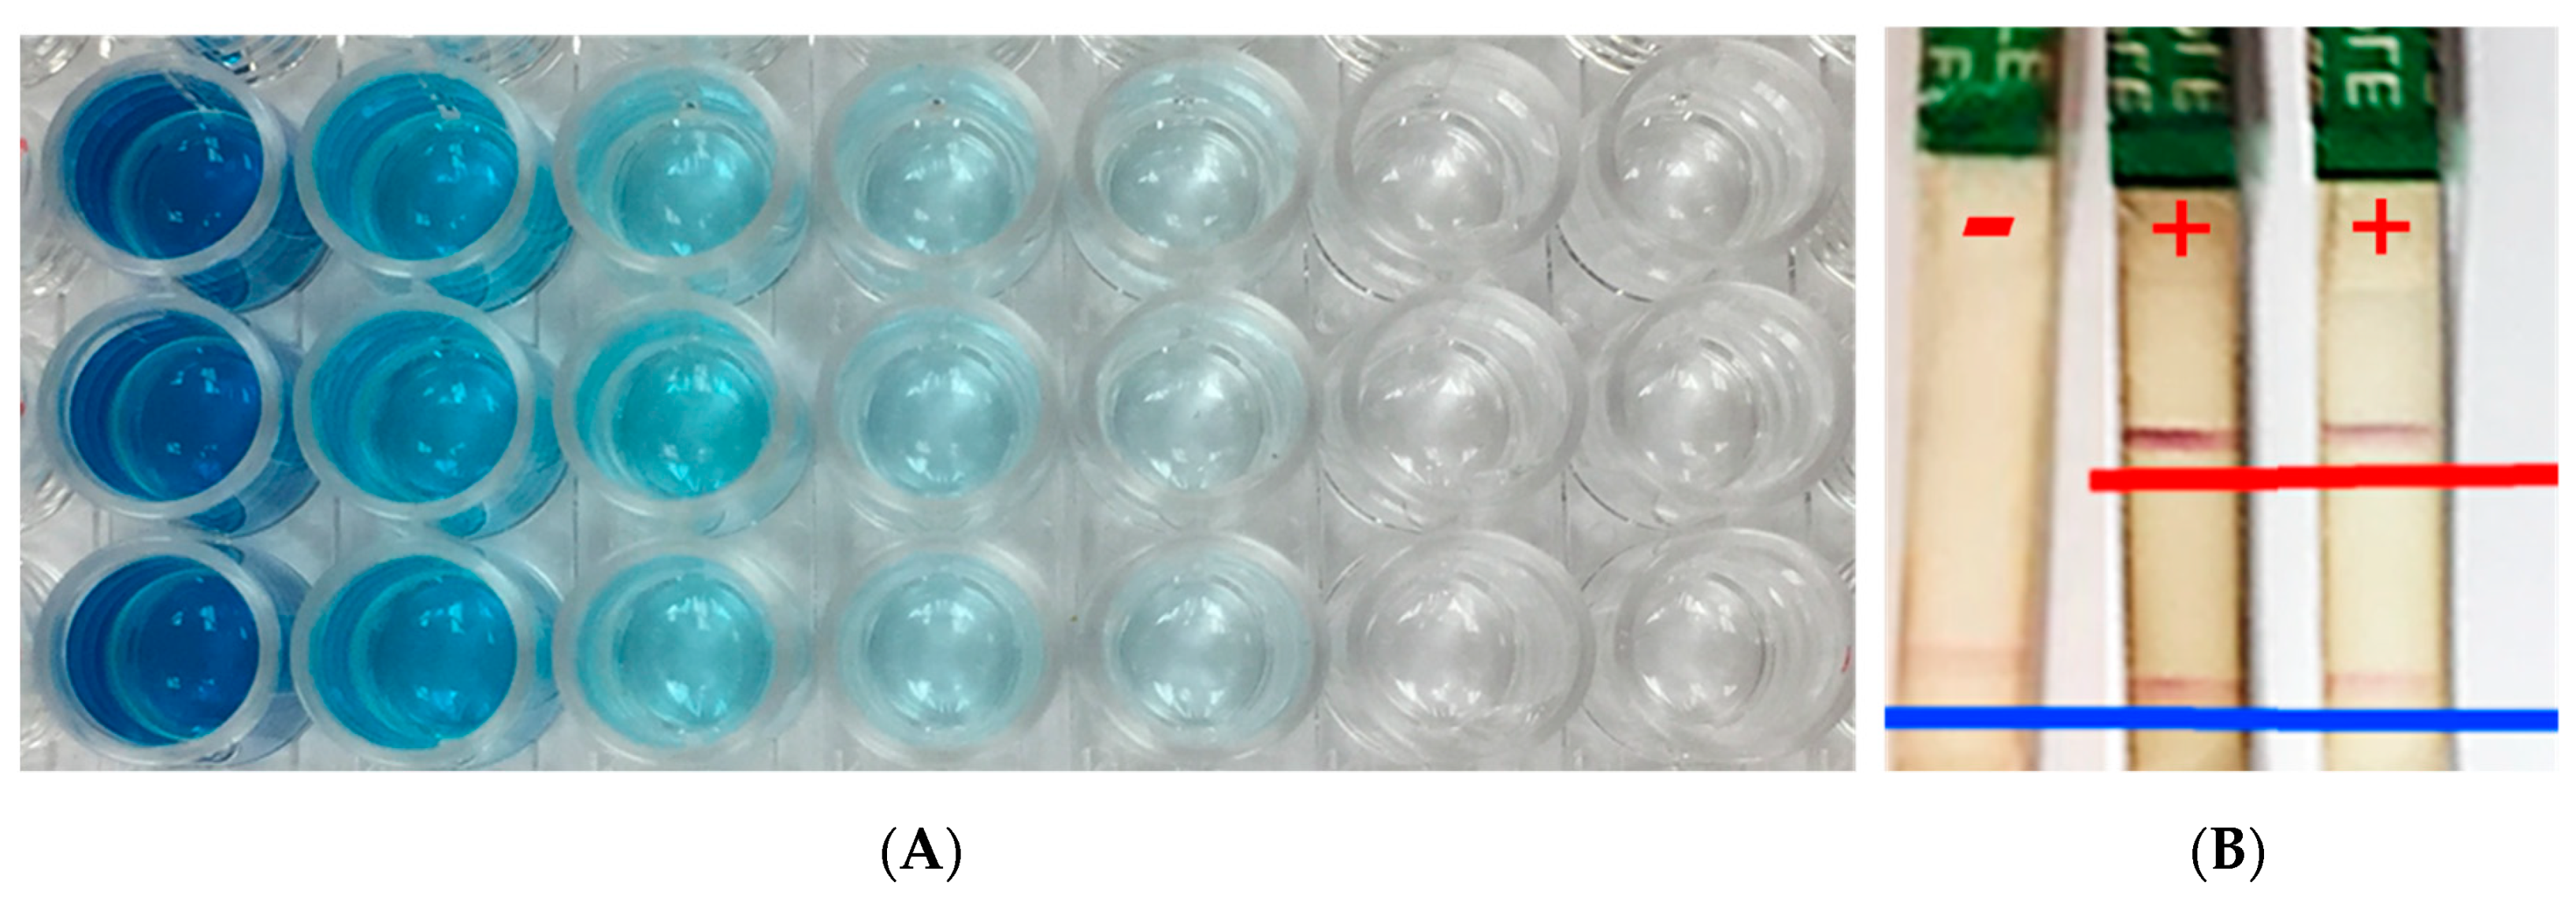
3.1. Enzyme-Linked Immunosorbent Assay (ELISA)
3.2. Lateral Flow Device
4. Nucleic Acid-Based Techniques
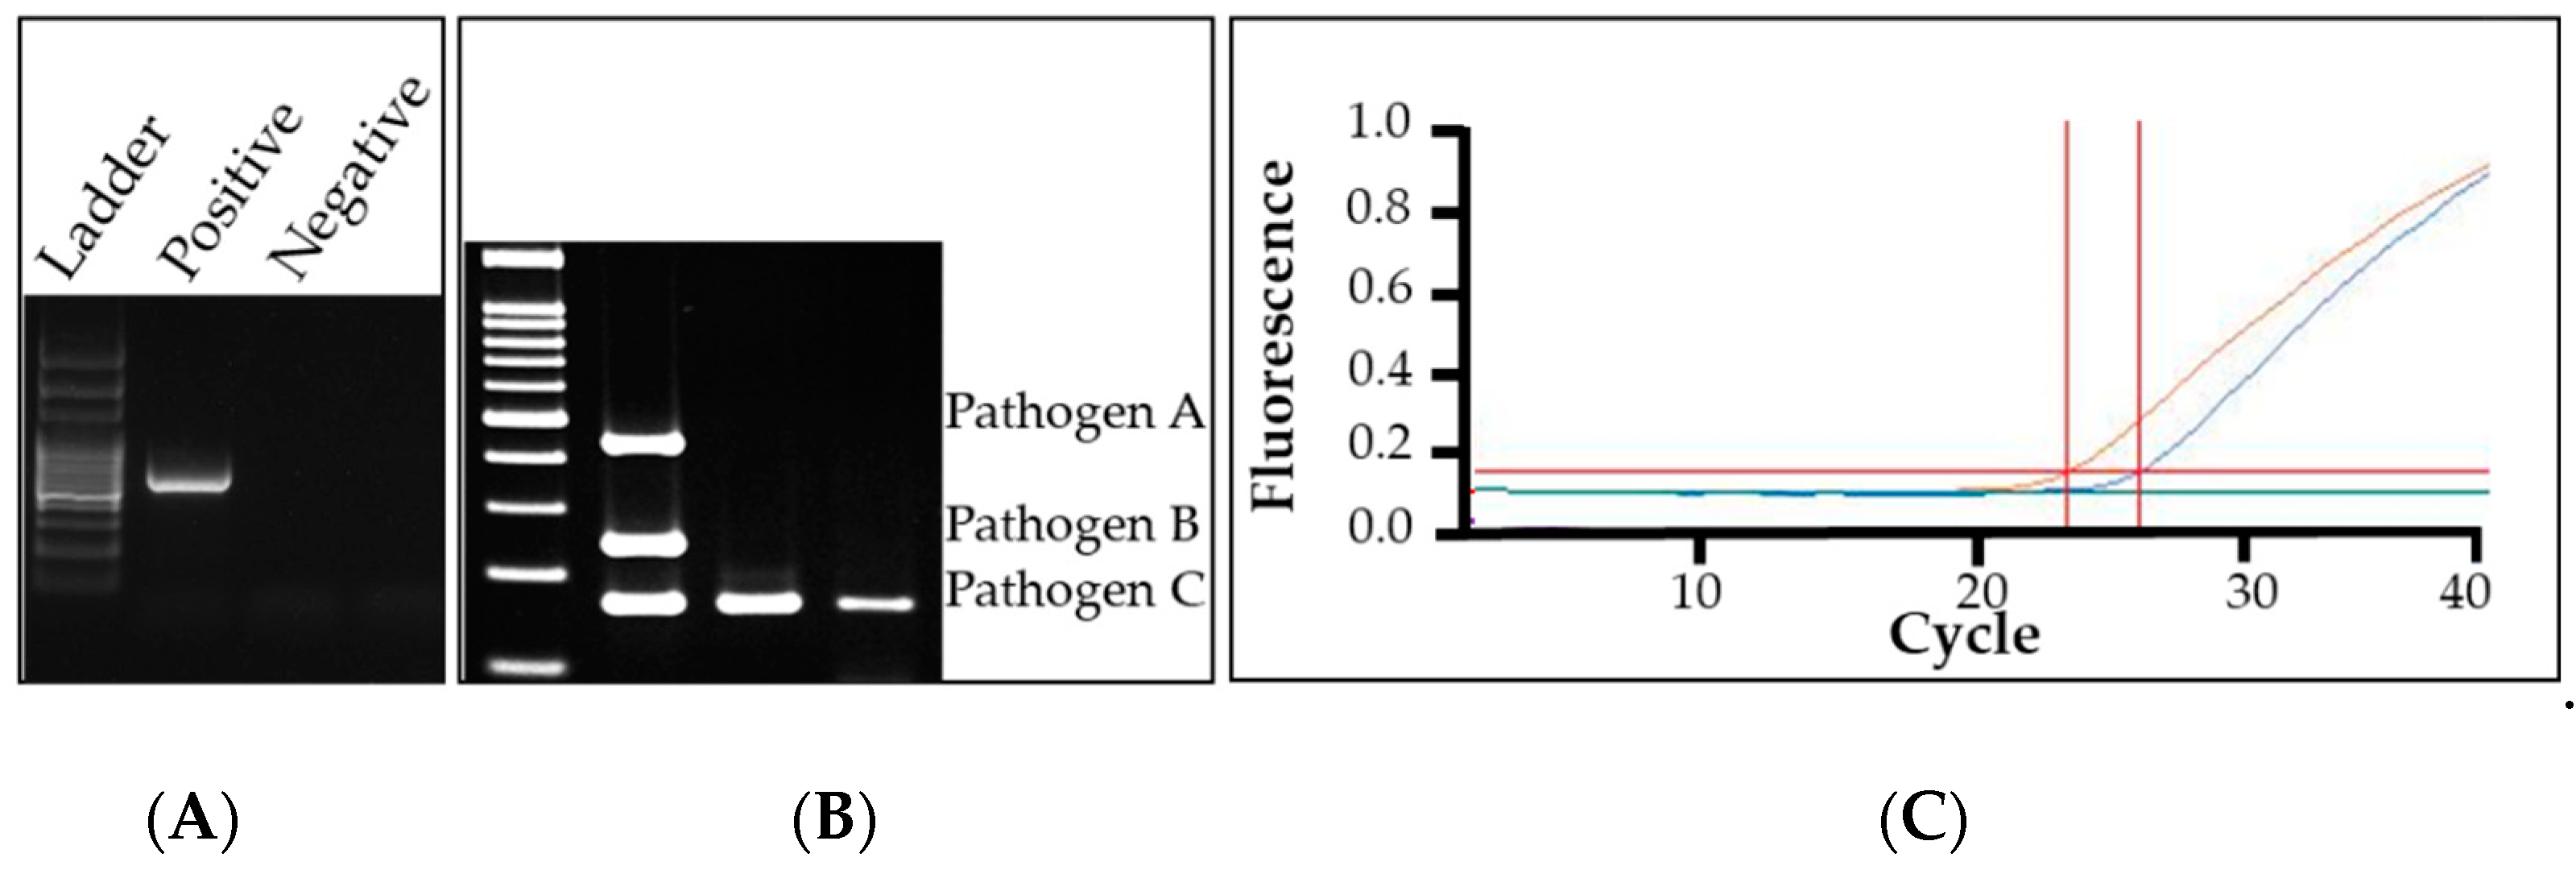
4.1. Conventional Polymerase Chain Reaction (PCR)
4.2. Multiplex Polymerase Chain Reaction
4.3. Quantitative Polymerase Chain Reaction (qPCR)
4.4. Random Amplification of Polymorphic DNA PCR
4.5. DNA Sequencing
4.6. Next Generation Sequencing
5. Isothermal Diagnosis Techniques
5.1. Loop-Mediated Amplification (LAMP)
5.2. Recombinase Polymerase Amplification (RPA)
6. Future Outlooks in Diagnostic Identification
6.1. Portable High-Throughput Sequencing
6.2. Remote Sensing of Pathogens
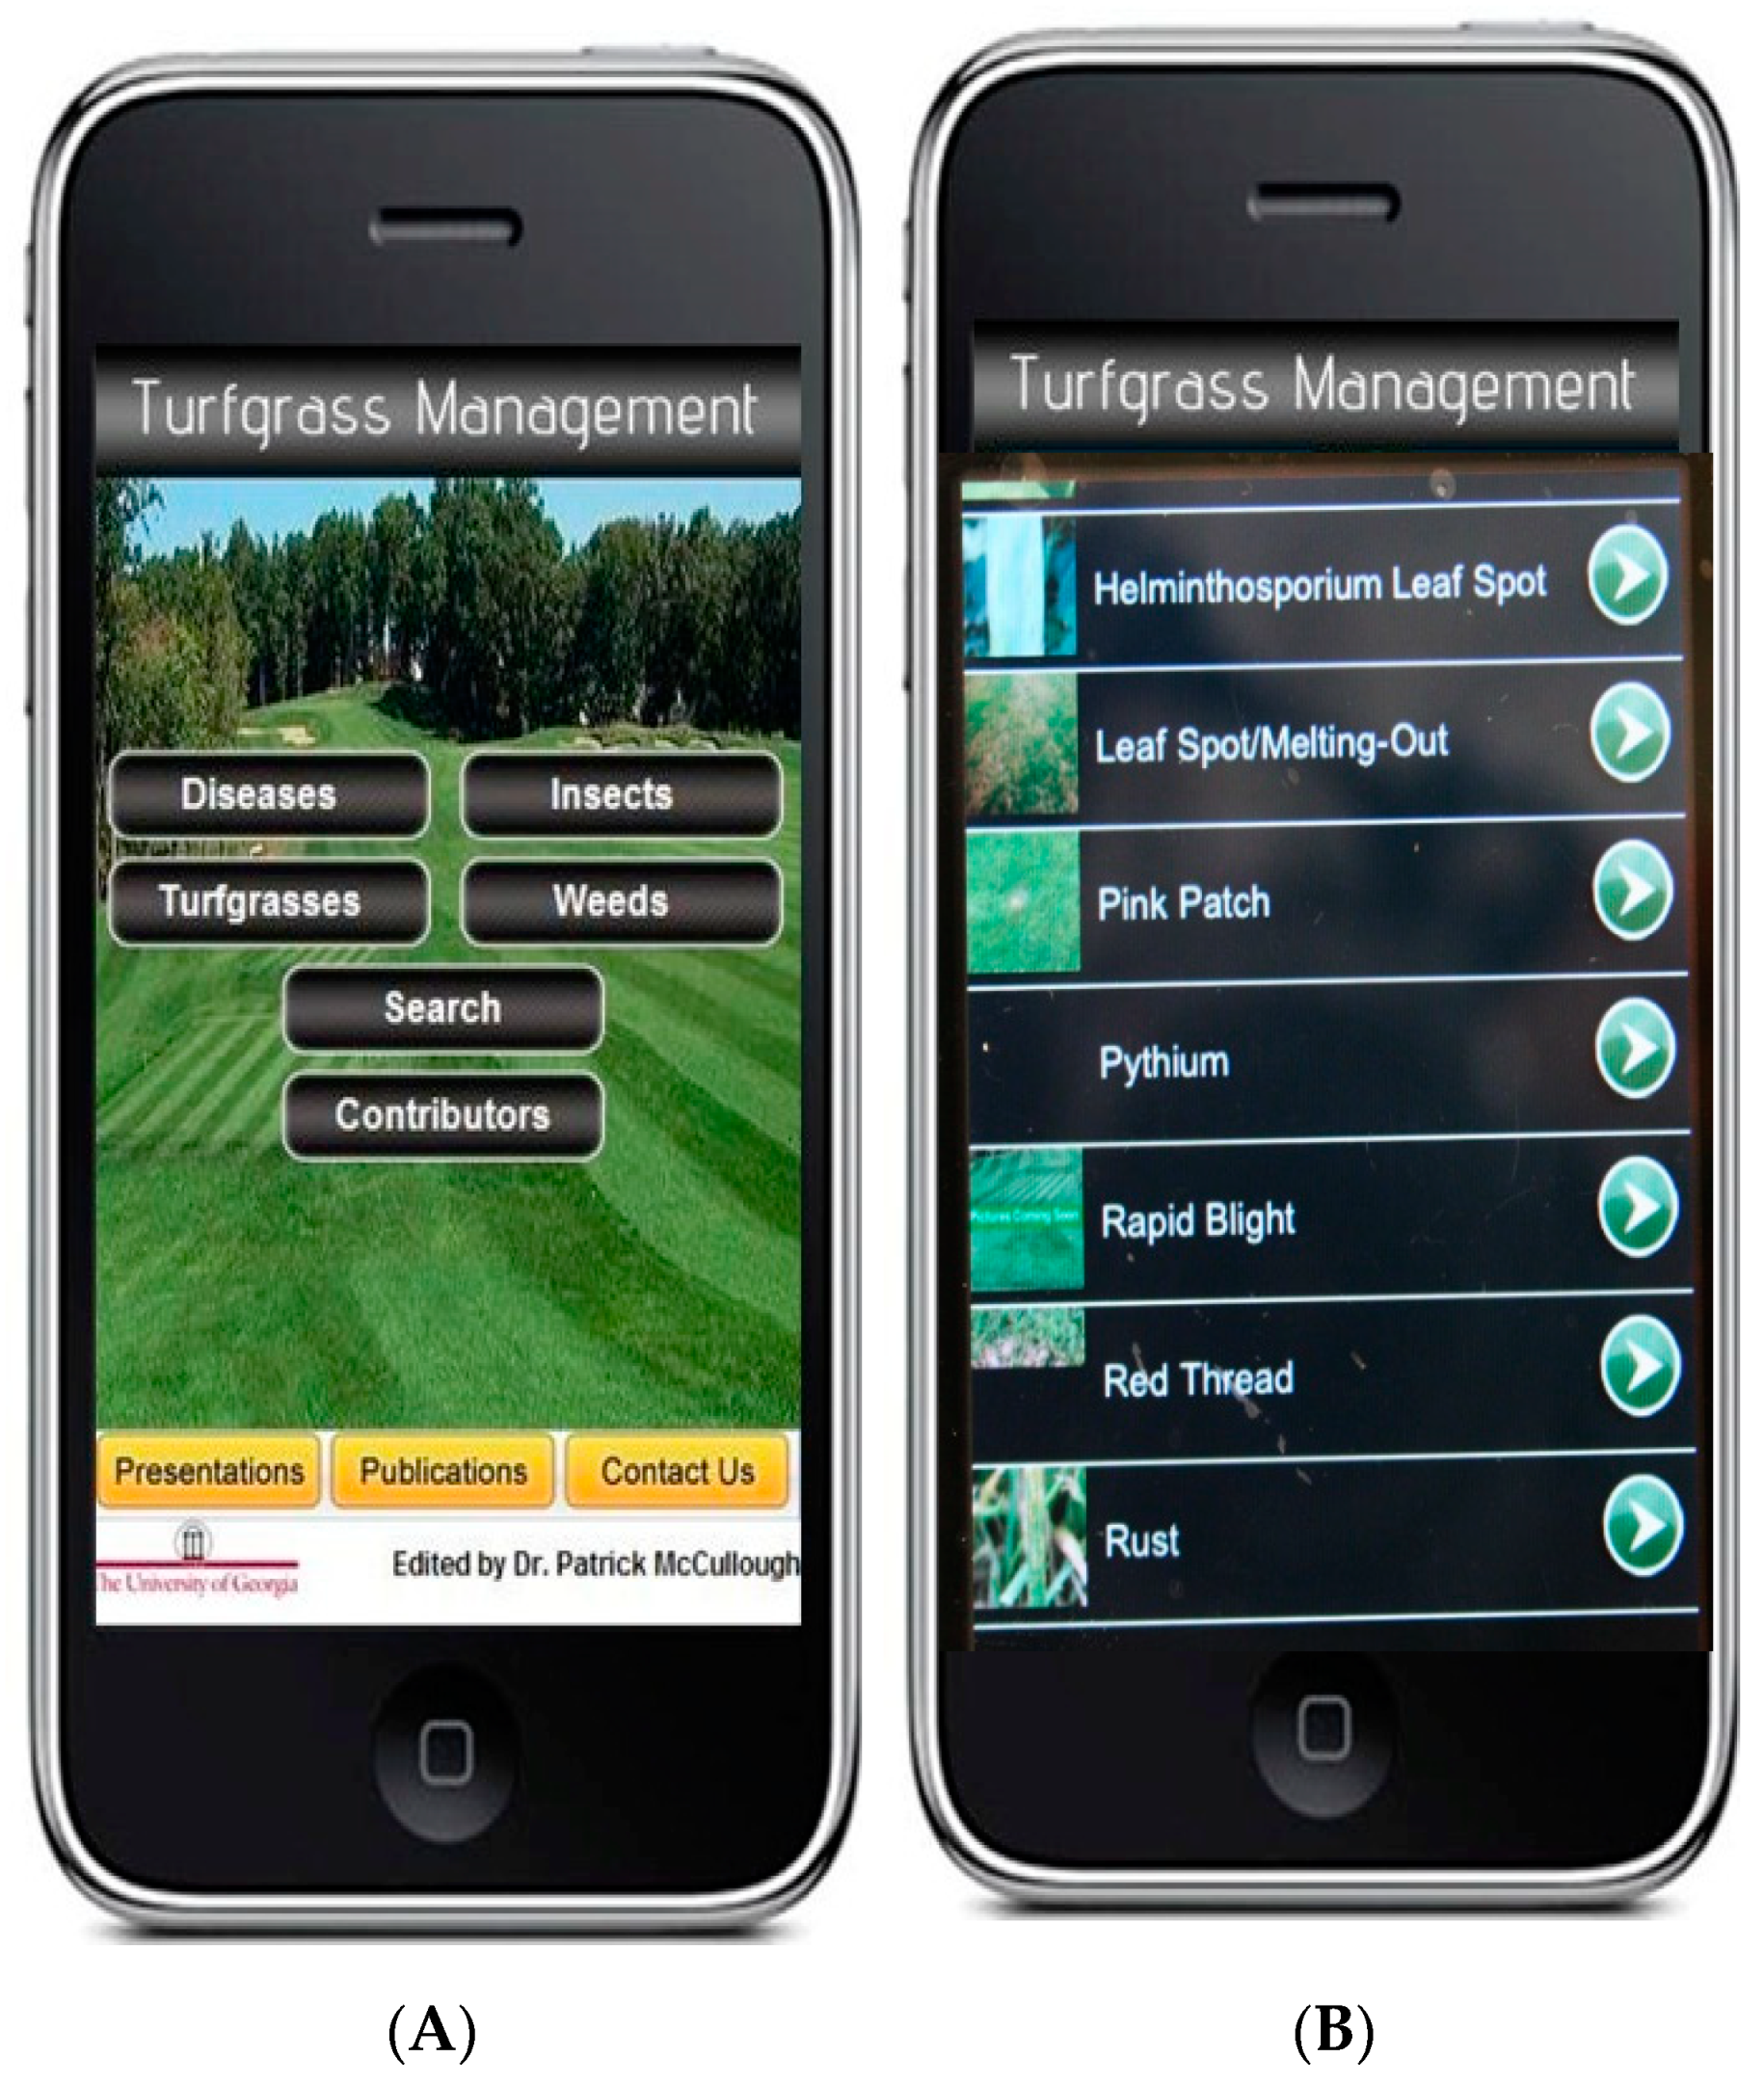
6.3. Smartphone Applications for Detection and Management
7. Conclusions
Author Contributions
Funding
Acknowledgments
Conflicts of Interest
References
- Chawla, S.; Roshni, A.; Patel, M.; Patil, S.; Shah, H. Turfgrass: A billion dollar industry. In Proceedings of the National Conference on Floriculture for Rural and Urban Prosperity in the Scenerio of Climate Change, Sikkim, India, 12 April 2018. [Google Scholar]
- Haydu, J.J.; Hodges, A.W.; Hall, C.R. Estimating the economic impact of the U.S. golf course industry: Challenges and solutions. HortScience 2008, 43, 759–763. [Google Scholar] [CrossRef]
- Duval, D.; Kerna, A.; Frisvold, G. Using enterprise software data to analyze the economic contributions and impacts of university programs with the implan model. In Proceedings of the Mid-Continent Regional Science Association, Charlotte, NC, USA, 6–11 June 2016. [Google Scholar]
- Dousset, B.; Gourmelon, F. Surface temperatures of the Paris Basin during summertime, using satellite remote sensing data. In Proceedings of the 5th International Conference on Urban Climate, Lodz, Poland, 1–5 September 2003. [Google Scholar]
- Parker, J.H. Landscaping to reduce the energy used in cooling buildings. J. For. 1983, 81, 82–105. [Google Scholar] [CrossRef]
- McPherson, E.G. Cooling urban heat islands with sustainable landscapes. In The Ecological City: Preserving and Restoring Urban Biodiversity; Platt, R.H.R., Rowan, A., Muick, P.C., Eds.; University of Massachusetts Press: Amherst, MA, USA, 1994; pp. 151–171. [Google Scholar]
- Walton, B.; Hoylman, A.; Perez, M.; Anderson, T.; Johnson, T.; Guthrie, E.; Christman, R. Bioremediation through rhizosphere technology. In Proceedings of the Rhizosphere Microbial Communities as a Plant Defense Against Toxic Substances in Soils, Washington, DC, USA, 23–27 August 1993; pp. 82–92. [Google Scholar]
- Olson, P.; Reardon, K.; Pilon-Smits, E. Ecology of Rhizosphere Bioremediation; John Wiley & Sons, Inc.: Hoboken, NJ, USA, 2003; pp. 317–354. [Google Scholar]
- Green, S.; Renault, S. Influence of papermill sludge on growth of Medicago Sativa, Festuca rubra and Agropyron trachycaulum in gold mine tailings: A greenhouse study. Environ. Pollut. 2008, 151, 524–531. [Google Scholar] [CrossRef]
- Kowalczyk, A.; Twardy, S.; Kuźniar, A. Permanent turf grass as the factor alleviating water erosion in the Carpathian Mountains. J. Water Land Dev. 2011, 15, 41–51. [Google Scholar] [CrossRef]
- Krenitsky, E.; Carroll, M.; Hill, R.; Krouse, J. Runoff and sediment losses from natural and man-made erosion control materials. Crop Sci. 1998, 38, 1042–1046. [Google Scholar] [CrossRef]
- Parsons, R.; Tassinary, L.G.; Ulrich, R.S.; Hebl, M.R.; Grossman-Alexander, M. The view from the road: Implications for stress recovery and immunization. J. Environ. Psychol. 1998, 18, 113–140. [Google Scholar] [CrossRef]
- Beard, J. Turfgrass benefits and the golf environment. In Fate and Management of Turfgrass Chemicals; Clark, J.M., Kenna, M.P., Eds.; ACS Publications: Washington, DC, USA, 2000; pp. 36–44. [Google Scholar]
- Monteiro, J.A. Ecosystem services from turfgrass landscapes. Urban For. Urban Green. 2017, 26, 151–157. [Google Scholar] [CrossRef]
- Martínez-Espinoza, A.D.; Burpee, L.L.; Waltz, C. Abiotic injuries and disorders of turfgrasses in Georgia. Univ. Ga. 2009, 1258, 1–14. [Google Scholar]
- Little, E.L. 2017 Georgia plant disease loss estimates. Univ. Ga. 2019, 102–110, 1–21. [Google Scholar]
- Bonos, S.A.; Kubik, C.; Clarke, B.B.; Meyer, W.A. Breeding perennial ryegrass for resistance to gray leaf spot. Crop Sci. 2004, 44, 575–580. [Google Scholar] [CrossRef]
- Vines, P.L.; Bara, R.F.; Smith, D.A.; Qu, Y.; Daddio, R.M.; Bonos, S.A.; Meyer, W.A. Performance of perennial ryegrass cultivars and selections in New Jersery turf trials. In Proceedings of the New Jersey Turfgrass Association, Atlantic City, NJ, USA, 5–7 December 2017. [Google Scholar]
- Stier, J.C.; Horgan, B.P.; Bonos, S.A. Turfgrass: Biology, Use, and Management; John Wiley & Sons: Hoboken, NJ, USA, 2020; Volume 104. [Google Scholar]
- Uddin, W.; Viji, G.; Vincelli, P. Gray leaf spot (blast) of perennial ryegrass turf: An emerging problem for the turfgrass industry. Plant Dis. 2003, 87, 880–889. [Google Scholar] [CrossRef] [PubMed][Green Version]
- Stowell, L.; Gelernter, W. Diagnosis of turfgrass diseases. Annu. Rev. Phytopathol. 2001, 39, 135–155. [Google Scholar] [CrossRef] [PubMed]
- Ainsworth, G.C. Introduction to the History of Plant Pathology; Cambridge University Press: New York, NY, USA, 1981. [Google Scholar]
- Van den Tweel, J.G.; Taylor, C.R. A brief history of pathology: Preface to a forthcoming series that highlights milestones in the evolution of pathology as a discipline. Virchows Arch. 2010, 457, 3–10. [Google Scholar] [CrossRef] [PubMed]
- Ball, C.S. The early history of the compound microscope. Bios 1966, 37, 51–60. [Google Scholar]
- Freundlich, M.M. Origin of the electron microscope. Science 1963, 142, 185–188. [Google Scholar] [CrossRef] [PubMed]
- Engvall, E.; Perlmann, P. Enzyme-linked immunosorbent assay (ELISA) quantitative assay of immunoglobulin G. Immunochemistry 1971, 8, 871–874. [Google Scholar] [CrossRef]
- Campbell, R.L.; Wagner, D.B.; O’Connell, J.P. Solid Phase Assay with Visual Readout. US Patent 4,703,017, 27 October 1987. [Google Scholar]
- Klenow, H.; Henningsen, I. Selective elimination of the exonuclease activity of the deoxyribonucleic acid polymerase from Escherichia coli B by limited proteolysis. Proc. Natl. Acad. Sci. USA 1970, 65, 168–175. [Google Scholar] [CrossRef]
- Mullis, K.B. The unusual origin of the polymerase chain reaction. Sci Am. 1990, 262, 56–65. [Google Scholar] [CrossRef]
- Higuchi, R.; Fockler, C.; Dollinger, G.; Watson, R. Kinetic PCR analysis: Real-time monitoring of DNA amplification reactions. Biotechnology 1993, 11, 1026–1030. [Google Scholar] [CrossRef]
- Chamberlain, J.S.; Gibbs, R.A.; Rainer, J.E.; Nguyen, P.N.; Thomas, C. Deletion screening of the Duchenne muscular dystrophy locus via multiplex DNA amplification. Nucleic Acids Res. 1988, 16, 11141–11156. [Google Scholar] [CrossRef]
- Fleischmann, R.D.; Adams, M.D.; White, O.; Clayton, R.A.; Kirkness, E.F.; Kerlavage, A.R.; Bult, C.J.; Tomb, J.-F.; Dougherty, B.A.; Merrick, J.M. Whole-genome random sequencing and assembly of Haemophilus influenzae Rd. Science 1995, 269, 496–512. [Google Scholar] [CrossRef] [PubMed]
- Notomi, T.; Okayama, H.; Masubuchi, H.; Yonekawa, T.; Watanabe, K.; Amino, N.; Hase, T. Loop-mediated isothermal amplification of DNA. Nucleic Acids Res. 2000, 28, e63. [Google Scholar] [CrossRef] [PubMed]
- Piepenburg, O.; Williams, C.H.; Stemple, D.L.; Armes, N.A. DNA detection using recombination proteins. PLoS Biol. 2006, 4, 1105–1121. [Google Scholar] [CrossRef] [PubMed]
- Loman, N.J.; Quinlan, A.R. Poretools: A toolkit for analyzing nanopore sequence data. Bioinformatics 2014, 30, 3399–3401. [Google Scholar] [CrossRef]
- Heim, R.H.J.; Carnegie, A.J.; Zarco-Tejada, P.J. Breaking down barriers between remote sensing and plant pathology. Trop. Plant Pathol. 2019, 44, 398–400. [Google Scholar] [CrossRef]
- McCullough, P.E.; Waltz, F.C., Jr.; Hudson, W.; Martinez-Espinoza, A.D. Turfgrass management at your fingertips: Information delivered through “smart” phone technology. J. Ext. 2011, 49, 3TOT10. [Google Scholar]
- Martínez, A.; Burpee, L. Turfgrass diseases: Quick reference guide. Univ. Ga. 2020, Circular 891, 1–4. [Google Scholar]
- Corwin, B.; Tisserat, N.; Fresenburg, B. Identification and management of turfgrass diseases. In University of Missouri, Extension Publications; University of Missouri: Columbia, MO, USA, 2007; Volume IPM1029, pp. 1–56. [Google Scholar]
- Smiley, R.; Dernoeden, P.; Clarke, B. Compendium of Turfgrass Diseases, 3rd ed.; American Phytopathological Society: St. Paul, MN, USA, 2005. [Google Scholar]
- Vargas, J.M. Management of Turfgrass Diseases, 2nd ed.; CRC Press: Boca Raton, FL, USA, 2018. [Google Scholar]
- Vines, P.L.; Tomaso-Peterson, M.; Crouch, J. Diagnosis of centipedegrass anthracnose caused by Colletotrichum eremochloae sp. nov. Phytopathology 2012, 102, 10. [Google Scholar]
- Goodwin, P.H.; Hsiang, T.; Xue, B.G.; Liu, H.W. Differentiation of Gaeumannomyces graminis from other turf-grass fungi by amplification with primers from ribosomal internal transcribed spacers. Plant Pathol. 1995, 44, 384–391. [Google Scholar] [CrossRef]
- Salgado-Salazar, C.; Beirn, L.A.; Ismaiel, A.; Boehm, M.J.; Carbone, I.; Putman, A.I.; Tredway, L.P.; Clarke, B.B.; Crouch, J.A. Clarireedia: A new fungal genus comprising four pathogenic species responsible for dollar spot disease of turfgrass. Fungal Biol. 2018, 122, 761–773. [Google Scholar] [CrossRef]
- Crous, P.W.; Hawksworth, D.L.; Wingfield, M.J. Identifying and naming plant-pathogenic fungi: Past, present, and future. Annu. Rev. Phytopathol. 2015, 53, 247–267. [Google Scholar] [CrossRef] [PubMed]
- Crow, W.T. Diagnosis of Trichodorus obtusus and Paratrichodorus minor on turfgrasses in the Southeastern United States. Plant Health Prog. 2005, 6, 20. [Google Scholar] [CrossRef]
- Schubert, T.; Jeyaprakash, A.; Harmon, C. Fundamentals and Advances in Plant Problem Diagnostics. In Handbook of Florists’ Crops Diseases; McGovern, R.J., Elmer, W.H., Eds.; Springer International Publishing: Cham, Switcherland, 2016; pp. 1–27. [Google Scholar]
- Martinez-Espinoza, A.; Martinez-Uribe, O.; Kim, D. Identification and characterization of tar spot on seashore paspalum in Georgia. In Proceedings of the American Phytopathological Society Annual Meeting, Providence, RI, USA, 4–8 August 2012; p. 76. [Google Scholar]
- Maiolini, R.; Masseyeff, R. A sandwich method of enzymoimmunoassay. I. Application to rat and human alpha-fetoprotein. J. Immunol. Methods 1975, 8, 223–234. [Google Scholar] [CrossRef]
- Shane, W. Prospects for early detection of Pythium blight epidemics on turfgrass by antibody-aided monitoring. Plant Dis. 1991, 75, 921–925. [Google Scholar] [CrossRef]
- Nameth, S.; Shane, W.; Stier, J. Development of a monoclonal antibody for detection of Leptosphaeria korrae, the causal agent of necrotic ringspot disease of turfgrass. Phytopathology 1990, 80, 1208–1211. [Google Scholar] [CrossRef]
- Yuen, G.; Xia, J.; Sutula, C. A sensitive ELISA for Pythium ultimum using polyclonal and species-specific monoclonal antibodies. Plant Dis. 1998, 82, 1029–1032. [Google Scholar] [CrossRef] [PubMed]
- Yuen, G.Y.; Kim, K.-N.; Horst, G.L. Use of ELISA and isolation for determining the distribution of Rhizoctonia solani and other Rhizoctonia spp. in asymptomatic creeping bentgrass. Crop Prot. 1994, 13, 296–300. [Google Scholar] [CrossRef]
- Asano, T.; Senda, M.; Suga, H.; Kageyama, K. Development of multiplex PCR to detect five Pythium species related to turfgrass diseases. J. Phytopathol. 2010, 158, 609–615. [Google Scholar] [CrossRef]
- Ward, E. Improved polymerase chain reaction (PCR) detection of Gaeumannomyces graminis including a safeguard against false negatives. Eur. J. Plant Path. 1995, 101, 561–566. [Google Scholar] [CrossRef]
- Rachdawong, S.; Cramer, C.L.; Grabau, E.A.; Stromberg, V.K.; Lacy, G.H.; Stromberg, E.L. Gaeumannomyces graminis vars. avenae, graminis, and tritici identified using PCR amplification of Avenacinase-like genes. Plant Dis. 2002, 86, 652–660. [Google Scholar] [CrossRef]
- Toda, T.; Mushika, T.; Hyakumachi, M. Development of specific PCR primers for the detection of Rhizoctonia solani AG 2-2 LP from the leaf sheaths exhibiting large-patch symptom on zoysia grass. FEMS Microbiol. Lett. 2004, 232, 67–74. [Google Scholar] [CrossRef]
- Terashima, Y.; Ogiwara, K.; Seki, A.; Kojima, M.; Kubo, C.; Fujiie, A. Primers based on specific ITS sequences of rDNAs for PCR detection of two fairy ring fungi of turfgrass, Vascellum pratense and Lycoperdon pusillum. Mycoscience 2002, 43, 261–265. [Google Scholar] [CrossRef]
- Harmon, P.F.; Dunkle, L.D.; Latin, R. A rapid PCR-based method for the detection of Magnaporthe oryzae from infected perennial ryegrass. Plant Dis. 2003, 87, 1072–1076. [Google Scholar] [CrossRef] [PubMed]
- Kaminski, J.E.; Dernoeden, P.H.; O’Neill, N.R.; Wetzel, H.C. A PCR-based method for the detection of Ophiosphaerella agrostis in creeping bentgrass. Plant Dis. 2005, 89, 980–985. [Google Scholar] [CrossRef] [PubMed]
- Tsuchida, T.; Yamaga, A.; Mitsuhori, T.; Shingu, Y.; Yamashita, Y.; Kudo, K.; Yoneyama, K. Development of PCR primer kits for seasonal diagnosis of turfgrass diseases. Bull. School Agric. Meiji Univ. 2006, 55, 81–97. [Google Scholar]
- O’Gorman, D.; Xue, B.; Hsiang, T.; Goodwin, P. Detection of Leptosphaeria korrae with PCR and primers from the ribosomal internal transcribed spacers. Can. J. Bot. 2011, 72, 342–346. [Google Scholar] [CrossRef]
- Groben, G.; Clarke, B.B.; Murphy, J.A.; Koch, P.L.; Crouch, J.A.; Lee, S.; Zhang, N. Real-time PCR detection of Clarireedia spp., the causal agents of dollar spot in turfgrasses. Plant Dis. 2020. [Google Scholar] [CrossRef]
- Zhao, S.; Clarke, B.B.; Shen, Q.; Zhang, L.; Zhang, N. Development and application of a TaqMan real-time PCR assay for rapid detection of Magnaporthe poae. Mycologia 2012, 104, 1250–1259. [Google Scholar] [CrossRef]
- Okubara, P.A.; Schroeder, K.L.; Paulitz, T.C. Identification and quantification of Rhizoctonia solani and R. oryzae using real-time polymerase chain reaction. Phytopathology 2008, 98, 837–847. [Google Scholar] [CrossRef]
- Beirn, L.A.; Moy, M.; Meyer, W.A.; Clarke, B.B.; Crouch, J.A. Molecular analysis of turfgrass rusts reveals the widespread distribution of Puccinia coronata as a pathogen of Kentucky bluegrass in the United States. Plant Dis. 2011, 95, 1547–1557. [Google Scholar] [CrossRef]
- Giordano, P.R.; Wang, J.; Vargas, J.M.; Jacobs, J.; Chilvers, M.I.; Zeng, Q. Using a genome-based PCR primer prediction pipeline to develop molecular diagnostics for the turfgrass pathogen Acidovorax avenae. Plant Dis. 2018, 102, 2224–2232. [Google Scholar] [CrossRef] [PubMed]
- Karakkat, B.B.; Hockemeyer, K.; Franchett, M.; Olson, M.; Mullenberg, C.; Koch, P.L. Detection of root-infecting fungi on cool-season turfgrasses using loop-mediated isothermal amplification and recombinase polymerase amplification. J. Microbiol. Methods 2018, 151, 90–98. [Google Scholar] [CrossRef] [PubMed]
- Villari, C.; Mahaffee, W.F.; Mitchell, T.K.; Pedley, K.F.; Pieck, M.L.; Hand, F.P. Early detection of airborne inoculum of Magnaporthe oryzae in turfgrass fields using a quantitative LAMP assay. Plant Dis. 2016, 101, 170–177. [Google Scholar] [CrossRef] [PubMed]
- Patel, J.S.; Brennan, M.S.; Khan, A.; Ali, G.S. Implementation of loop-mediated isothermal amplification methods in lateral flow devices for the detection of Rhizoctonia solani. Can. J. Plant Path. 2015, 37, 118–129. [Google Scholar] [CrossRef]
- Langlois, P.A.; Snelling, J.; Hamilton, J.P.; Bragard, C.; Koebnik, R.; Verdier, V.; Triplett, L.R.; Blom, J.; Tisserat, N.A.; Leach, J.E. Characterization of the Xanthomonas translucens complex using draft genomes, comparative genomics, phylogenetic analysis, and diagnostic LAMP assays. Phytopathology 2017, 107, 519–527. [Google Scholar] [CrossRef]
- Zhang, L.; Gleason, C. Loop-mediated isothermal amplification for the diagnostic detection of Meloidogyne chitwoodi and M. fallax. Plant Dis. 2018, 103, 12–18. [Google Scholar] [CrossRef]
- Ye, W.; Zeng, Y.; Kerns, J. Molecular characterisation and diagnosis of root-knot nematodes (Meloidogyne spp.) from turfgrasses in North Carolina, USA. PLoS ONE 2015, 10, e0143556. [Google Scholar] [CrossRef]
- Watkins, J.; Atkins, B.; Holborow, E. Quantitative estimation of protein by electroimmunodiffusion on Cellogel acetate membranes. J. Clin. Pathol. 1971, 24, 665. [Google Scholar] [CrossRef]
- Liebenberg, A.; Freeborough, M.-J.; Visser, C.J.; Bellstedt, D.U.; Burger, J.T. Genetic variability within the coat protein gene of grapevine fanleaf virus isolates from South Africa and the evaluation of RT-PCR, DAS-ELISA and ImmunoStrips as virus diagnostic assays. Virus Res. 2009, 142, 28–35. [Google Scholar] [CrossRef]
- Avila, F.J.; Schoedel, B.; Abad, Z.G.; Coffey, M.D.; Blomquist, C. ELISA and ImmunoStrip® for detection of Phytophthora ramorum, P. kernoviae, and other Phytophthora species. In Proceedings of the Sudden Oak Death Fourth Science Symposium, Santa Cruz, CA, USA, 15–18 June 2009; pp. 95–96. [Google Scholar]
- Sea-liang, N.; Sereemaspun, A.; Patarakul, K.; Gaywee, J.; Rodkvamtook, W.; Srisawat, N.; Wacharaplusadee, S.; Hemachudha, T. Development of multiplex PCR for neglected infectious diseases. PLoS Negl. Trop. Dis. 2019, 13, 1–12. [Google Scholar] [CrossRef]
- Pallás, V.; Sánchez-Navarro, J.A.; James, D. Recent advances on the multiplex molecular detection of plant viruses and viroids. Front. Microbiol. 2018, 9, 2087. [Google Scholar] [CrossRef] [PubMed]
- Boonham, N.; Glover, R.; Tomlinson, J.; Mumford, R. Exploiting generic platform technologies for the detection and identification of plant pathogens. In Sustainable Disease Management in a European Context; Collinge, D.B., Munk, L., Cooke, B.M., Eds.; Springer: Dordrecht, The Netherlands, 2008; pp. 355–363. [Google Scholar]
- Li, W.; Hartung, J.S.; Levy, L. Evaluation of DNA amplification methods for improved detection of “Candidatus Liberibacter species” associated with citrus huanglongbing. Plant Dis. 2007, 91, 51–58. [Google Scholar] [CrossRef] [PubMed]
- Mahuku, G.S.; Hsiang, T.O.M.; Yang, L. Genetic diversity of Microdochium nivale isolates from turfgrass. Mycol. Res. 1998, 102, 559–567. [Google Scholar] [CrossRef]
- Crouch, J.A.; Glasheen, B.M.; Uddin, W.; Clarke, B.B.; Hillman, B.I. Patterns of diversity in populations of the turfgrass pathogen Colletotrichum cereale as revealed by transposon fingerprint profiles. Crop Sci. 2008, 48, 1203–1210. [Google Scholar] [CrossRef]
- Hsiang, T.; Wu, C. Genetic relationships of pathogenic Typhula species assessed by RAPD, ITS-RFLP and ITS sequencing. Mycol. Res. 2000, 104, 16–22. [Google Scholar] [CrossRef]
- Janda, J.M.; Abbott, S.L. 16S rRNA gene sequencing for bacterial identification in the diagnostic laboratory: Pluses, perils, and pitfalls. J. Clin. Microbiol. 2007, 45, 2761–2764. [Google Scholar] [CrossRef]
- White, T.J.; Bruns, T.; Lee, S.J.W.T.; Taylor, J. Amplification and direct sequencing of fungal ribosomal RNA genes for phylogenetics. In PCR Protocols: A Guide to Methods and Applications; Innis, M.A., Gelfand, D.H., Sninsky, J., White, T.J., Eds.; Academic Press: London, UK, 1990; pp. 315–322. [Google Scholar]
- Gergerich, R.C.; Dolja, V.V. Introduction to plant viruses, the invisible foe. Plant Health Instr. 2006, 4. [Google Scholar] [CrossRef]
- Madden, M.J.; Young, R.G.; Brown, J.W.; Miller, S.E.; Frewin, A.J.; Hanner, R.H. Using DNA barcoding to improve invasive pest identification at US ports-of-entry. PLoS ONE 2019, 14, 1–15. [Google Scholar] [CrossRef]
- Powers, T. Nematode molecular diagnostics: From bands to barcodes. Annu. Rev. Phytopathol. 2004, 42, 367–383. [Google Scholar] [CrossRef]
- Vincelli, P.; Tisserat, N. Nucleic acid-based pathogen detection in applied plant pathology. Plant Dis. 2008, 92, 660–669. [Google Scholar] [CrossRef]
- Margulies, M.; Egholm, M.; Altman, W.E.; Attiya, S.; Bader, J.S.; Bemben, L.A.; Berka, J.; Braverman, M.S.; Chen, Y.-J.; Chen, Z. Genome sequencing in microfabricated high-density picolitre reactors. Nature 2005, 437, 376–380. [Google Scholar] [CrossRef] [PubMed]
- Tyler, A.D.; Mataseje, L.; Urfano, C.J.; Schmidt, L.; Antonation, K.S.; Mulvey, M.R.; Corbett, C.R. Evaluation of Oxford nanopore’s MinION sequencing device for microbial whole genome sequencing applications. Sci. Rep. 2018, 8, 1–12. [Google Scholar] [CrossRef] [PubMed]
- Jain, M.; Fiddes, I.T.; Miga, K.H.; Olsen, H.E.; Paten, B.; Akeson, M. Improved data analysis for the MinION nanopore sequencer. Nat. Methods 2015, 12, 351–356. [Google Scholar] [CrossRef] [PubMed]
- Cui, C.; Herlihy, J.H.; Bombarely, A.; McDowell, J.M.; Haak, D.C. Draft assembly of Phytophthora capsici from long-read sequencing uncovers complexity. Mol. Plant Microbe Interact. 2019, 32, 1559–1563. [Google Scholar] [CrossRef] [PubMed]
- Leiva, A.M.; Siriwan, W.; Lopez-Alvarez, D.; Barrantes, I.; Hemniam, N.; Saokham, K.; Cuellar, W.J. Nanopore-based complete genome sequence of a Sri Lankan cassava mosaic virus (Geminivirus) strain from Thailand. Microbiol. Resour. Announc. 2020, 9, 1–3. [Google Scholar] [CrossRef]
- Crouch, J.A.; Beirn, L.; Boehm, M.; Carbone, I.; Clarke, B.B.; Kerns, J.P.; Malapi, M.; Mitchell, T.; Venu, R.; Tredway, L. Genome resources for seven fungal isolates that cause dollar spot disease in turfgrass, including Clarireedia jacksonii and C. monteithiana. Plant Dis. 2020. [Google Scholar] [CrossRef]
- Grünwald, N.J.; McDonald, B.A.; Milgroom, M.G. Population genomics of fungal and oomycete pathogens. Annu. Rev. Phytopathol. 2016, 54, 323–346. [Google Scholar] [CrossRef]
- Xu, J. Fungal species concepts in the genomics era. Genome 2020, 63, 459–468. [Google Scholar] [CrossRef]
- Nagamine, K.; Hase, T.; Notomi, T. Accelerated reaction by loop-mediated isothermal amplification using loop primers. Mol. Cell. Probes. 2002, 16, 223–230. [Google Scholar] [CrossRef]
- Goto, M.; Honda, E.; Ogura, A.; Nomoto, A.; Hanaki, K.-I. Colorimetric detection of loop-mediated isothermal amplification reaction by using hydroxy naphthol blue. Biotechniques 2009, 46, 167–172. [Google Scholar] [CrossRef]
- Mori, Y.; Nagamine, K.; Tomita, N.; Notomi, T. Detection of loop-mediated isothermal amplification reaction by turbidity derived from magnesium pyrophosphate formation. Biochem. Biophys. Res. Commun. 2001, 289, 150–154. [Google Scholar] [CrossRef] [PubMed]
- Lucchi, N.W.; Demas, A.; Narayanan, J.; Sumari, D.; Kabanywanyi, A.; Kachur, S.P.; Barnwell, J.W.; Udhayakumar, V. Real-time fluorescence loop mediated isothermal amplification for the diagnosis of malaria. PLoS ONE 2010, 5, e13733. [Google Scholar] [CrossRef] [PubMed]
- Mori, Y.; Notomi, T. Loop-mediated isothermal amplification (LAMP): A rapid, accurate, and cost-effective diagnostic method for infectious diseases. J. Infect. Chemother. 2009, 15, 62–69. [Google Scholar] [CrossRef] [PubMed]
- Niu, J.; Jian, H.; Guo, Q.; Chen, C.; Wang, X.; Liu, Q.; Guo, Y. Evaluation of loop-mediated isothermal amplification (LAMP) assays based on 5S rDNA-IGS2 regions for detecting Meloidogyne enterolobii. Plant Pathol. 2012, 61, 809–819. [Google Scholar] [CrossRef]
- Lobato, I.M.; O’Sullivan, C.K. Recombinase polymerase amplification: Basics, applications and recent advances. Trends. Anal. Chem. 2018, 98, 19–35. [Google Scholar] [CrossRef]
- Abd El Wahed, A.; El-Deeb, A.; El-Tholoth, M.; Abd El Kader, H.; Ahmed, A.; Hassan, S.; Hoffmann, B.; Haas, B.; Shalaby, M.A.; Hufert, F.T. A portable reverse transcription recombinase polymerase amplification assay for rapid detection of foot-and-mouth disease virus. PLoS ONE 2013, 8, e71642. [Google Scholar] [CrossRef]
- Shin, Y.; Perera, A.P.; Kim, K.W.; Park, M.K. Real-time, label-free isothermal solid-phase amplification/detection (ISAD) device for rapid detection of genetic alteration in cancers. Lab Chip 2013, 13, 2106–2114. [Google Scholar] [CrossRef]
- Shin, Y.; Perera, A.P.; Tang, W.Y.; Fu, D.L.; Liu, Q.; Sheng, J.K.; Gu, Z.; Lee, T.Y.; Barkham, T.; Park, M.K. A rapid amplification/detection assay for analysis of Mycobacterium tuberculosis using an isothermal and silicon bio-photonic sensor complex. Biosens. Bioelectron. 2015, 68, 390–396. [Google Scholar] [CrossRef]
- Daher, R.K.; Stewart, G.; Boissinot, M.; Boudreau, D.K.; Bergeron, M.G. Influence of sequence mismatches on the specificity of recombinase polymerase amplification technology. Mol. Cell. Probes. 2015, 29, 116–121. [Google Scholar] [CrossRef]
- Boyle, D.S.; Lehman, D.A.; Lillis, L.; Peterson, D.; Singhal, M.; Armes, N.; Parker, M.; Piepenburg, O.; Overbaugh, J. Rapid detection of HIV-1 proviral DNA for early infant diagnosis using recombinase polymerase amplification. MBio 2013, 4, 1–8. [Google Scholar] [CrossRef]
- Mekuria, T.A.; Zhang, S.; Eastwell, K.C. Rapid and sensitive detection of little cherry virus 2 using isothermal reverse transcription-recombinase polymerase amplification. J. Virol. Methods 2014, 205, 24–30. [Google Scholar] [CrossRef] [PubMed]
- Zhang, S.; Ravelonandro, M.; Russell, P.; McOwen, N.; Briard, P.; Bohannon, S.; Vrient, A. Rapid diagnostic detection of plum pox virus in Prunus plants by isothermal AmplifyRP® using reverse transcription-recombinase polymerase amplification. J. Virol. Methods 2014, 207, 114–120. [Google Scholar] [CrossRef] [PubMed]
- Hammond, R.W.; Zhang, S. Development of a rapid diagnostic assay for the detection of tomato chlorotic dwarf viroid based on isothermal reverse-transcription-recombinase polymerase amplification. J. Virol. Methods 2016, 236, 62–67. [Google Scholar] [CrossRef] [PubMed]
- Londoño, M.A.; Harmon, C.L.; Polston, J.E. Evaluation of recombinase polymerase amplification for detection of begomoviruses by plant diagnostic clinics. Virol. J. 2016, 13, 48. [Google Scholar] [CrossRef]
- Ghosh, D.K.; Kokane, S.B.; Kokane, A.D.; Warghane, A.J.; Motghare, M.R.; Bhose, S.; Sharma, A.K.; Reddy, M.K. Development of a recombinase polymerase based isothermal amplification combined with lateral flow assay (HLB-RPA-LFA) for rapid detection of Candidatus Liberibacter asiaticus. PLoS ONE 2018, 13, e0208530. [Google Scholar] [CrossRef]
- Doan, H.K.; Zhang, S.; Davis, R.M. Development and evaluation of AmplifyRP Acceler8 diagnostic assay for the detection of Fusarium oxysporum f. sp. vasinfectum race 4 in cotton. Plant Health Prog. 2014, 15, 48–52. [Google Scholar] [CrossRef]
- Lu, H.; Giordano, F.; Ning, Z. Oxford nanopore MinION sequencing and genome assembly. Genom. Proteom. Bioinform. 2016, 14, 265–279. [Google Scholar] [CrossRef]
- Brown, B.L.; Watson, M.; Minot, S.S.; Rivera, M.C.; Franklin, R.B. MinION™ nanopore sequencing of environmental metagenomes: A synthetic approach. GigaScience 2017, 6, gix007. [Google Scholar] [CrossRef]
- Greninger, A.L.; Naccache, S.N.; Federman, S.; Yu, G.; Mbala, P.; Bres, V.; Stryke, D.; Bouquet, J.; Somasekar, S.; Linnen, J.M.; et al. Rapid metagenomic identification of viral pathogens in clinical samples by real-time nanopore sequencing analysis. Genome Med. 2015, 7, 99. [Google Scholar] [CrossRef]
- Fellers, J.P.; Webb, C.; Fellers, M.C.; Shoup Rupp, J.; De Wolf, E. Wheat virus identification within infected tissue using nanopore sequencing technology. Plant Dis. 2019, 103, 2199–2203. [Google Scholar] [CrossRef]
- Juul, S.; Izquierdo, F.; Hurst, A.; Dai, X.; Wright, A.; Kulesha, E.; Pettett, R.; Turner, D.J. What’s in my pot? Real-time species identification on the MinION™. bioRxiv 2015. [Google Scholar] [CrossRef]
- Riley, J. Remote sensing in entomology. Annu. Rev. Entomol. 1989, 34, 247–271. [Google Scholar] [CrossRef]
- Zhang, J.; Huang, Y.; Pu, R.; Gonzalez-Moreno, P.; Yuan, L.; Wu, K.; Huang, W. Monitoring plant diseases and pests through remote sensing technology: A review. Comput. Electron. Agric. 2019, 165, 104943. [Google Scholar] [CrossRef]
- Nilsson, H.-E. Remote sensing and image analysis in plant pathology. Can. J. Plant Path. 1995, 17, 154–166. [Google Scholar] [CrossRef]
- Kobayashi, T.; Kanda, E.; Kitada, K.; Ishiguro, K.; Torigoe, Y. Detection of rice panicle blast with multispectral radiometer and the potential of using airborne multispectral scanners. Phytopathology 2001, 91, 316–323. [Google Scholar] [CrossRef] [PubMed]
- Colomina, I.; Molina, P. Unmanned aerial systems for photogrammetry and remote sensing: A review. ISPRS J. Photogramm. Remote Sens. 2014, 92, 79–97. [Google Scholar] [CrossRef]
- Schwartz, M.D.; Reed, B.C.; White, M.A. Assessing satellite-derived start-of-season measures in the conterminous USA. Int. J. Climatol. 2002, 22, 1793–1805. [Google Scholar] [CrossRef]
- Ahrends, H.E.; Brügger, R.; Stöckli, R.; Schenk, J.; Michna, P.; Jeanneret, F.; Wanner, H.; Eugster, W. Quantitative phenological observations of a mixed beech forest in northern Switzerland with digital photography. J. Geophys. Res. Biogeosci. 2008, 113. [Google Scholar] [CrossRef]
- Richardson, A.D.; Jenkins, J.P.; Braswell, B.H.; Hollinger, D.Y.; Ollinger, S.V.; Smith, M.-L. Use of digital webcam images to track spring green-up in a deciduous broadleaf forest. Oecologia 2007, 152, 323–334. [Google Scholar] [CrossRef]
- West, J.; Bravo, C.; Oberti, R.; Lemaire, D.; Moshou, D.; McCartney, H. The potential of optical canopy measurement for targeted control of field crop diseases. Annu. Rev. Phytopathol. 2003, 41, 593–614. [Google Scholar] [CrossRef]
- Myneni, R.B.; Maggion, S.; Iaquinta, J.; Privette, J.L.; Gobron, N.; Pinty, B.; Kimes, D.S.; Verstraete, M.M.; Williams, D.L. Optical remote sensing of vegetation: Modeling, caveats, and algorithms. Remote Sens. Environ. 1995, 51, 169–188. [Google Scholar] [CrossRef]
- Kuska, M.T.; Brugger, A.; Thomas, S.; Wahabzada, M.; Kersting, K.; Oerke, E.-C.; Steiner, U.; Mahlein, A.-K. Spectral patterns reveal early resistance reactions of barley against Blumeria graminis f. sp. hordei. Phytopathology 2017, 107, 1388–1398. [Google Scholar] [CrossRef] [PubMed]
- Mahlein, A.K.; Steiner, U.; Dehne, H.W.; Oerke, E.C. Spectral signatures of sugar beet leaves for the detection and differentiation of diseases. Precis. Agric. 2010, 11, 413–431. [Google Scholar] [CrossRef]
- Mahlein, A.-K.; Rumpf, T.; Welke, P.; Dehne, H.-W.; Plümer, L.; Steiner, U.; Oerke, E.-C. Development of spectral indices for detecting and identifying plant diseases. Remote Sens. Environ. 2013, 128, 21–30. [Google Scholar] [CrossRef]
- Katsoulas, N.; Elvanidi, A.; Ferentinos, K.P.; Kacira, M.; Bartzanas, T.; Kittas, C. Crop reflectance monitoring as a tool for water stress detection in greenhouses: A review. Biosyst. Eng. 2016, 151, 374–398. [Google Scholar] [CrossRef]
- Kuska, M.; Wahabzada, M.; Leucker, M.; Dehne, H.-W.; Kersting, K.; Oerke, E.-C.; Steiner, U.; Mahlein, A.-K. Hyperspectral phenotyping on the microscopic scale: Towards automated characterization of plant-pathogen interactions. Plant Methods 2015, 11, 28. [Google Scholar] [CrossRef] [PubMed]
- Zhang, M.; Liu, X.; O’Neill, M. Spectral discrimination of Phytophthora infestans infection on tomatoes based on principal component and cluster analyses. Int. J. Remote Sens. 2002, 23, 1095–1107. [Google Scholar] [CrossRef]
- Wang, X.; Zhang, M.; Zhu, J.; Geng, S. Spectral prediction of Phytophthora infestans infection on tomatoes using artificial neural network (ANN). Int. J. Remote Sens. 2008, 29, 1693–1706. [Google Scholar] [CrossRef]
- Gold, K.M.; Townsend, P.A.; Chlus, A.; Herrmann, I.; Couture, J.J.; Larson, E.R.; Gevens, A.J. Hyperspectral measurements enable pre-symptomatic detection and differentiation of contrasting physiological effects of late blight and early blight in potato. Remote Sens. 2020, 12, 286. [Google Scholar] [CrossRef]
- Gold, K.M.; Townsend, P.A.; Herrmann, I.; Gevens, A.J. Investigating potato late blight physiological differences across potato cultivars with spectroscopy and machine learning. Plant Sci. 2019. [Google Scholar] [CrossRef]
- Ramcharan, A.; McCloskey, P.; Baranowski, K.; Mbilinyi, N.; Mrisho, L.; Ndalahwa, M.; Legg, J.; Hughes, D.P. A mobile-based deep learning model for cassava disease diagnosis. Front. Plant Sci. 2019, 10, 272. [Google Scholar] [CrossRef] [PubMed]
- Singh, K.K. An artificial intelligence and cloud based collaborative platform for plant disease identification, tracking and forecasting for farmers. In Proceedings of the 2018 IEEE International Conference on Cloud Computing in Emerging Markets (CCEM), Bangalore, India, 23–24 November 2018; pp. 49–56. [Google Scholar]
- Yakkundimath, R.; Konnurmath, G.; Pujari, J.D. Android based detection of plant diseases affecting leaves. In Proceedings of the NCCCI, National Conference, Gandhigram, Tamilnadu, India, 27–28 January 2017; pp. 303–306. [Google Scholar]
- Pavan, W.; Fraisse, C.W.; Peres, N.A. The strawberry advisory system: A web-based decision support tool for timing fungicide applications in strawberry. Dep. Agric. Biol. Eng. UF/IFAS Ext. Univ. Fla. 2009, Bulletin AE450, 1–4. [Google Scholar]
- Cordova, L.G.; Amiri, A.; Peres, N.A. Effectiveness of fungicide treatments following the strawberry advisory system for control of Botrytis fruit rot in Florida. Crop Prot. 2017, 100, 163–167. [Google Scholar] [CrossRef]


| Technique | Common Name | Pathogen Assays | Target Gene/Protein/Technique | Citations |
|---|---|---|---|---|
| ELISA | Damping-off * | Pythium spp. | Commercial Pythium antibody | [50] |
| Necrotic ring spot | Leptosphaeria korrae | (MAb) LKc50 antibody | [51] | |
| Brown patch | Rhizoctonia spp. | Commercial Rhizoctonia antibody | [53] | |
| Damping-off * | Pythium ultimum | (MAb E5) antibody | [52] | |
| PCR | Damping-off * | Pythium spp. | ITS region | [54] |
| Take-all Patch | Gaeumannomyces graminis (3 varieties) | ITS; avenacinase-like genes | [43,55,56] | |
| Brown patch | Rhizoctonia solani | RAPD-PCR | [57] | |
| Fairy ring | Vascellum pratense | ITS region | [58] | |
| Fairy ring | Lycoperdon pusillum | ITS region | [58] | |
| Blast disease | Magnaporthe oryzae | Pot2 transposon | [59] | |
| Dead spot | Ophiosphaerella agrostis | ITS region | [60] | |
| Anthracnose | Colletotrichum graminicola | ITS region | [61] | |
| Necrotic ring spot | Ophiosphaerella korrae | ITS region | [62] | |
| qPCR | Dollarspot | Clarireedia spp. | ITS region | [63] |
| Summer patch | Magnaporthe poae | ITS region | [64] | |
| Brown patch | Rhizoctonia solani and R. oryzae | ITS region | [65] | |
| Rust | Puccinia spp. (three pathogenic spp.) | ITS region | [66] | |
| Bacterial etiolation | Acidovorax avenae | Draft genome | [67] | |
| Multiplex | Damping-off * | Pythium spp. (5 spp.) | ITS region | [54] |
| PCR | Take-all Patch | Gaeumannomyces graminis (3 varieties) | Avenacinase-like genes | [56] |
| LAMP | Take-all Patch | Gaeumannomyces avenae | 18S ribosome region | [68] |
| Necrotic ring spot | Ophiosphaerella korrae | 18S ribosome region | [68] | |
| Summer patch | Magnaporthiopsis poae | 18S ribosome region | [68] | |
| Gray leaf spot | Magnaporthe oryzae | Draft genome | [69] | |
| Brown patch | Rhizoctonia solani | ITS region | [70] | |
| Bacterial wilt | Xanthomonas translucens | Draft genome | [71] | |
| Root-Knot Nematodes | Meloidogyne chitwoodiMeloidogyne fallax | 18S ribosome region | [72,73] | |
| RPA | Take-all Patch | Gaeumannomyces avenae | 18S ribosome region | [68] |
| Necrotic ring spot | Ophiosphaerella korrae | 18S ribosome region | [68] | |
| Summer patch | Magnaporthiopsis poae | 18S ribosome region | [68] |
| Diagnostic Technique | Method Advantages | Method Disadvantages |
|---|---|---|
| Morphology, signs, and symptoms | There are very little inputs, and this method is extremely rapid. | With many diseases it is incredibly difficult to identify with morphology. It requires extensive knowledge. Many diseases have similar symptoms. Pathogens can also have similar signs. |
| Culturing and microscopy | These methods can be very rapid tests for some species with little equipment needed. | This method requires extensive knowledge and may not be able to identify down to species. Many pathogens are not culturable. |
| ELISA | ELISA does not require a DNA extraction and is commercially available. Quantifiable with a plate reader and controls and very cheap per sample. Visual results allow for simple qualitative interpretation. | This method takes about 24 h to run, requires a laboratory, is not as sensitive as other methods, and has a lot of hands on steps. |
| PCR | PCR has both universal primers for unknown samples and species-specific primers. Easy to run with commonly available equipment. | PCR is not as sensitive as qPCR, RPA, or LAMP and typically requires a lab setting and expertise. It sometimes needs an extraction, which can take 1–4 h. |
| qPCR | qPCR is an extremely sensitive method and has quantification. It is also faster than conventional PCR or ELISA. | qPCR requires a lab setting and very expensive equipment and moderately expensive reagents. Contamination can be common. |
| Multiplex PCR | Multiplex PCR allows for several tests to be performed at one time in the same assay. The ability to run several tests at once makes multiplex PCR have fewer inputs than conventional PCR. | Multiplex requires a lab setting and primer design can limit use of this method. |
| LAMP | LAMP is an isotheral reaction, which allows for in-field diagnosis. | LAMP is prone to false positives from contamination and similar issues. |
| RPA | RPA is an extremely sensitive isothermal reaction. | RPA is difficult to design primers and may be less sensitive to mismatches. This makes species-specificity more difficult. |
| Lateral flow assays | Lateral flow assays are field ready and are extremely rapid tests. They are simple will very little training needed to run the assay. | Lateral flow assays have lower sensitivity than any of the nucleic acid-based assays. |
| Portable high-throughput sequencing | High-throughput sequencing allows for testing without any information on the pathogen. It is sensitive and has mixed sample capability. | Portable high-throughput sequencing is still extremely expensive comparatively to all other methods. It produces a lot more data than is typically needed and often requires sorting through nonpathogenic results. |
| Remote Sensing | Remote sensing allows for detection before visual symptoms are present | Remote sensing is expensive and limited in its current data. It requires expensive equipment and human input in data analysis. |
Publisher’s Note: MDPI stays neutral with regard to jurisdictional claims in published maps and institutional affiliations. |
© 2020 by the authors. Licensee MDPI, Basel, Switzerland. This article is an open access article distributed under the terms and conditions of the Creative Commons Attribution (CC BY) license (http://creativecommons.org/licenses/by/4.0/).
Share and Cite
Stackhouse, T.; Martinez-Espinoza, A.D.; Ali, M.E. Turfgrass Disease Diagnosis: Past, Present, and Future. Plants 2020, 9, 1544. https://doi.org/10.3390/plants9111544
Stackhouse T, Martinez-Espinoza AD, Ali ME. Turfgrass Disease Diagnosis: Past, Present, and Future. Plants. 2020; 9(11):1544. https://doi.org/10.3390/plants9111544
Chicago/Turabian StyleStackhouse, Tammy, Alfredo D. Martinez-Espinoza, and Md Emran Ali. 2020. "Turfgrass Disease Diagnosis: Past, Present, and Future" Plants 9, no. 11: 1544. https://doi.org/10.3390/plants9111544
APA StyleStackhouse, T., Martinez-Espinoza, A. D., & Ali, M. E. (2020). Turfgrass Disease Diagnosis: Past, Present, and Future. Plants, 9(11), 1544. https://doi.org/10.3390/plants9111544