Article

Expression Analysis of Key Auxin Biosynthesis, Transport, and Metabolism Genes of Betula pendula with Special Emphasis on Figured Wood Formation in Karelian Birch

by
Tatiana V. Tarelkina
*,
Ludmila L. Novitskaya
,
Natalia A. Galibina
,
Yulia L. Moshchenskaya
,
Kseniya M. Nikerova
,
Nadezhda N. Nikolaeva
,
Irina N. Sofronova
,
Diana S. Ivanova
and
Ludmila I. Semenova
Karelian Research Centre of the Russian Academy of Sciences, Forest Research Institute, 11 Pushkinskaya st., 185910 Petrozavodsk, Russia
*
Author to whom correspondence should be addressed.
The author has passed away.
Plants 2020, 9(11), 1406; https://doi.org/10.3390/plants9111406
Submission received: 22 September 2020 / Revised: 19 October 2020 / Accepted: 20 October 2020 / Published: 22 October 2020
(This article belongs to the Special Issue Advances in Auxin Research)

Abstract

:
Auxin status in woody plants is believed to be a critical factor for the quantity and quality of the wood formed. It has been previously demonstrated that figured wood formation in Karelian birch (Betula pendula Roth var. carelica (Merckl.) Hämet-Ahti) is associated with a reduced auxin level and elevated sugar content in the differentiating xylem, but the molecular mechanisms of the abnormal xylogenesis remained largely unclear. We have identified genes involved in auxin biosynthesis (Yucca), polar auxin transport (PIN) and the conjugation of auxin with amino acids (GH3) and UDP-glucose (UGT84B1) in the B. pendula genome, and analysed their expression in trunk tissues of trees differing in wood structure. Almost all the investigated genes were overexpressed in Karelian birch trunks. Although Yucca genes were overexpressed, trunk tissues in areas developing figured grain had traits of an auxin-deficient phenotype. Overexpression of GH3s and UGT84B1 appears to have a greater effect on figured wood formation. Analysis of promoters of the differentially expressed genes revealed a large number of binding sites with various transcription factors associated with auxin and sugar signalling. These data agree with the hypothesis that anomalous figured wood formation in Karelian birch may be associated with the sugar induction of auxin conjugation.

1. Introduction

The hormone auxin is involved in regulating virtually all morphogenetic processes in plant organisms, and its role in conducting tissues differentiation in tree trunks is well known [1,2,3,4,5,6,7,8]. Auxin contribution to the regulation of morphogenetic processes largely depends on its concentration and distribution in plant organs and tissues. The level of free (physiologically active) auxin in cells and tissues is the result of an intricate crosstalk of processes for its transport and metabolism, which, in turn, includes hormone biosynthesis, degradation and conjugation [9,10,11].
The principal gene families involved in IAA (the main natural auxin form) homeostasis in tissues have been identified. Much of IAA in plants is synthesised from tryptophan with the involvement of Yucca flavin-dependent monooxygenases [11]. Yucca family genes have been detected in many plants, including woody plants—Populus trichocarpa [12], Vitis vinifera [13], Prunus persica [14], Eucalyptus globulus [15] and Malus domestica [16,17]. It has been shown that de novo biosynthesis of auxin in various organs and tissues is an important player in generating the local gradients of the hormone [18,19,20].
Polar auxin transport is responsible for the elongate prosenchymatous shape of conducting tissue cells and is required for the differentiation of the most specialised conducting elements of the xylem vessels [21,22,23,24,25,26,27,28]. Proteins involved in polar auxin transport are encoded by PIN family genes [29]. Two groups of PIN proteins are distinguished based on their structural organisation and localisation in the cell. So-called “long” PINs contain a long hydrophilic domain localised between two transmembrane domains; they are localised on the plasmalemma and participate in auxin efflux from the cell. “Short” PINs have a reduced hydrophilic domain and are localised in the endoplasmic reticulum (ER) membrane [30,31]. There is some evidence that the PIN6 protein, which has the hydrophilic loop of intermediate length in comparison with “long” and “short” PINs, is localised on the plasmalemma as well as in the ER membrane [32,33]. PIN family genes have been identified in a number of woody plants—Picea abies [34], Populus sp. [32,35], E. globulus [15], M. domestica [16], V. vinifera [36], Pinus radiata [37] and Pyrus bretschneideri [38].
Genes of the GH3 family encode the enzymes contributing to the conjugation of auxin and some other plant hormones with amino acids to produce amide conjugates [9,39]. GH3 genes have been detected in many woody plants, such as P. trichocarpa [40], M. domestica [41], Castanea sativa [42], Betula platyphylla [43], P. abies [44], and Larix leptolepis × Larix olgensis [45]. Some plants were also found to have genes encoding UDP-glycosyl transferases (UGT), which participate in IAA conjugation with UDP-glucose [46,47,48]. Auxin conjugates are physiologically inactive, and have no role in polar transport of the hormone [9,39,49]. It is believed that different forms of conjugates perform different functions. Ester conjugates as well as some amide conjugates (IAA–Ala, IAA–Leu, IAA–Phe) are the forms for non-polar hormone transport and storage, which can be cleaved to release free IAA [9,49,50]. In contrast, IAA–Asp and IAA–Glu are suggested to be precursors for the degradation pathway [39,49]. Some data indicate that IAA–Trp is an auxin antagonist, affecting its signalling [51].
Although the role of auxin in conducting tissues formation has been known for quite a while and the key genes involved in its homeostasis have been identified in some woody plants, papers investigating the molecular–genetic aspects of auxin biosynthesis, transport and inactivation in woody plant trunk tissues are scarce. Furthermore, the activity of the genes in woody plants has been chiefly studied in trees younger than 5 years [12,16,17,41,42,43,52,53]. To the best of our knowledge, there have been no previous integrated studies of the activity of the genes involved in auxin homeostasis in trunk tissues of naturally growing older trees.
Silver birch (Betula pendula Roth) is a fast-growing woody species and an important source of timber in Northern Europe [54,55]. A naturally occurring silver birch variety—Karelian or curly birch (Betula pendula Roth var. carelica (Merckl.) Hämet-Ahti)—forms highly valuable figured wood [56,57,58]. Figured wood of Karelian birch resembles “wooden marble” in appearance and is one of the most expensive timbers in Europe. The ability to develop figured wood is hereditary, but even the progeny obtained through controlled pollination of plus trees would always contain straight-grained individuals—so-called non-figured Karelian birch trees [59,60,61,62].
Wide variation of wood structure makes birch an interesting object for studying mechanisms regulating xylogenesis. The figured wood of Karelian birch is different from the typical straight-grained wood of silver birch not only in appearance, but also in the ratio of cell types. While the dominant elements in common silver birch wood are those with the water conducting and mechanical functions—fibrous tracheids and vessels—the figured wood of Karelian birch mainly consists of radial and axial parenchyma [58,59,63]. Research into biochemical aspects revealed that figured wood in Karelian birch forms in the context of a reduced level of free (physiologically active) auxin and a high concentration of sucrose in trunk tissues, which is degraded involving cell wall invertase, while birch trees forming wood typical of the species have a higher auxin level, and sucrose in their trunk tissues is primarily metabolised by sucrose synthase [58,63,64,65,66,67,68]. The molecular groundwork of interactions between auxin and sugars in the process of anomalous wood formation in Karelian birch, however, has so far been studied very little [69]. Meanwhile, such studies are of high theoretical as well as practical interest, since variants of abnormal xylogenesis occur in a number of other woody plants, too. E.g., the formation of spiral grain in Pinus sylvestris wood is connected with auxin distribution and transport in trunk tissues [2,70,71,72,73,74] and also is associated with a reduced sucrose synthase activity and an elevated cell wall invertase activity in the differentiating xylem [75].
A hypothesis has recently been proposed that figured wood formation in Karelian birch may have to do with inactivation of free auxin as a result of auxin conjugation which, via a chain of biochemical reactions, may be associated with hexoses produced in the apoplast through sucrose cleavage by cell wall invertase [69]. We know, however, that sugars can modulate auxin metabolism and transport both by acting as substrates in conjugation reactions and by regulating gene expression [39,76,77,78]. To elucidate how auxin homeostasis can be affected during figured wood formation, we identified the genes encoding the main auxin biosynthesis, transport and conjugation enzymes and studied their expression patterns in various xylogenesis scenarios in silver birch. The objects were common silver birch, non-figured and figured Karelian birch trees.

2. Results

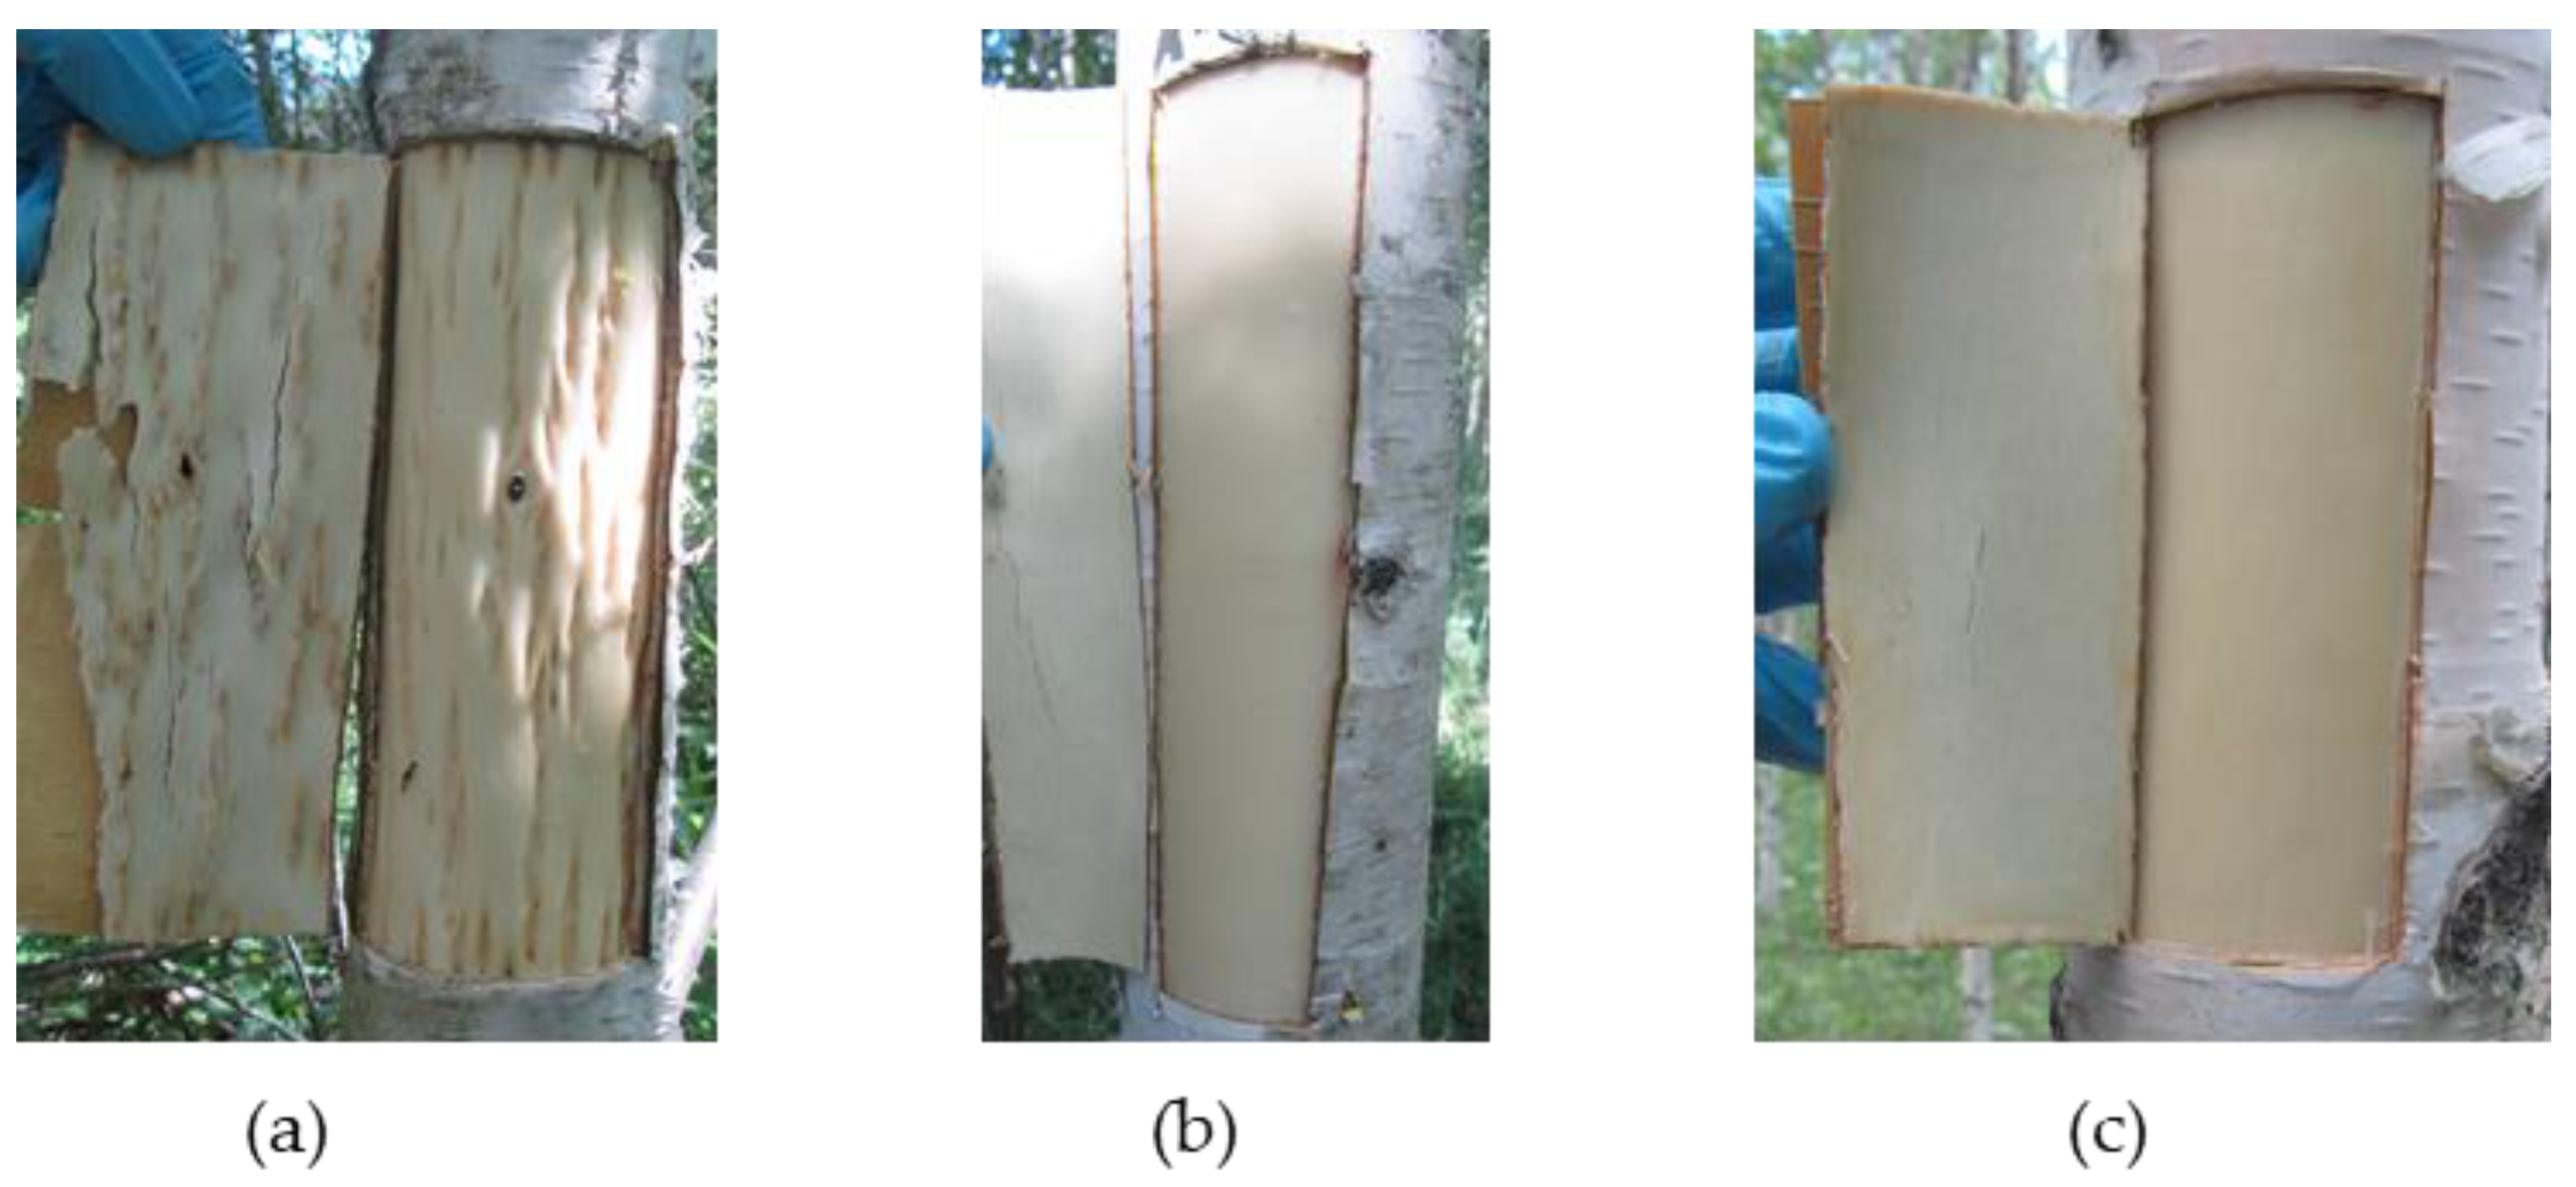
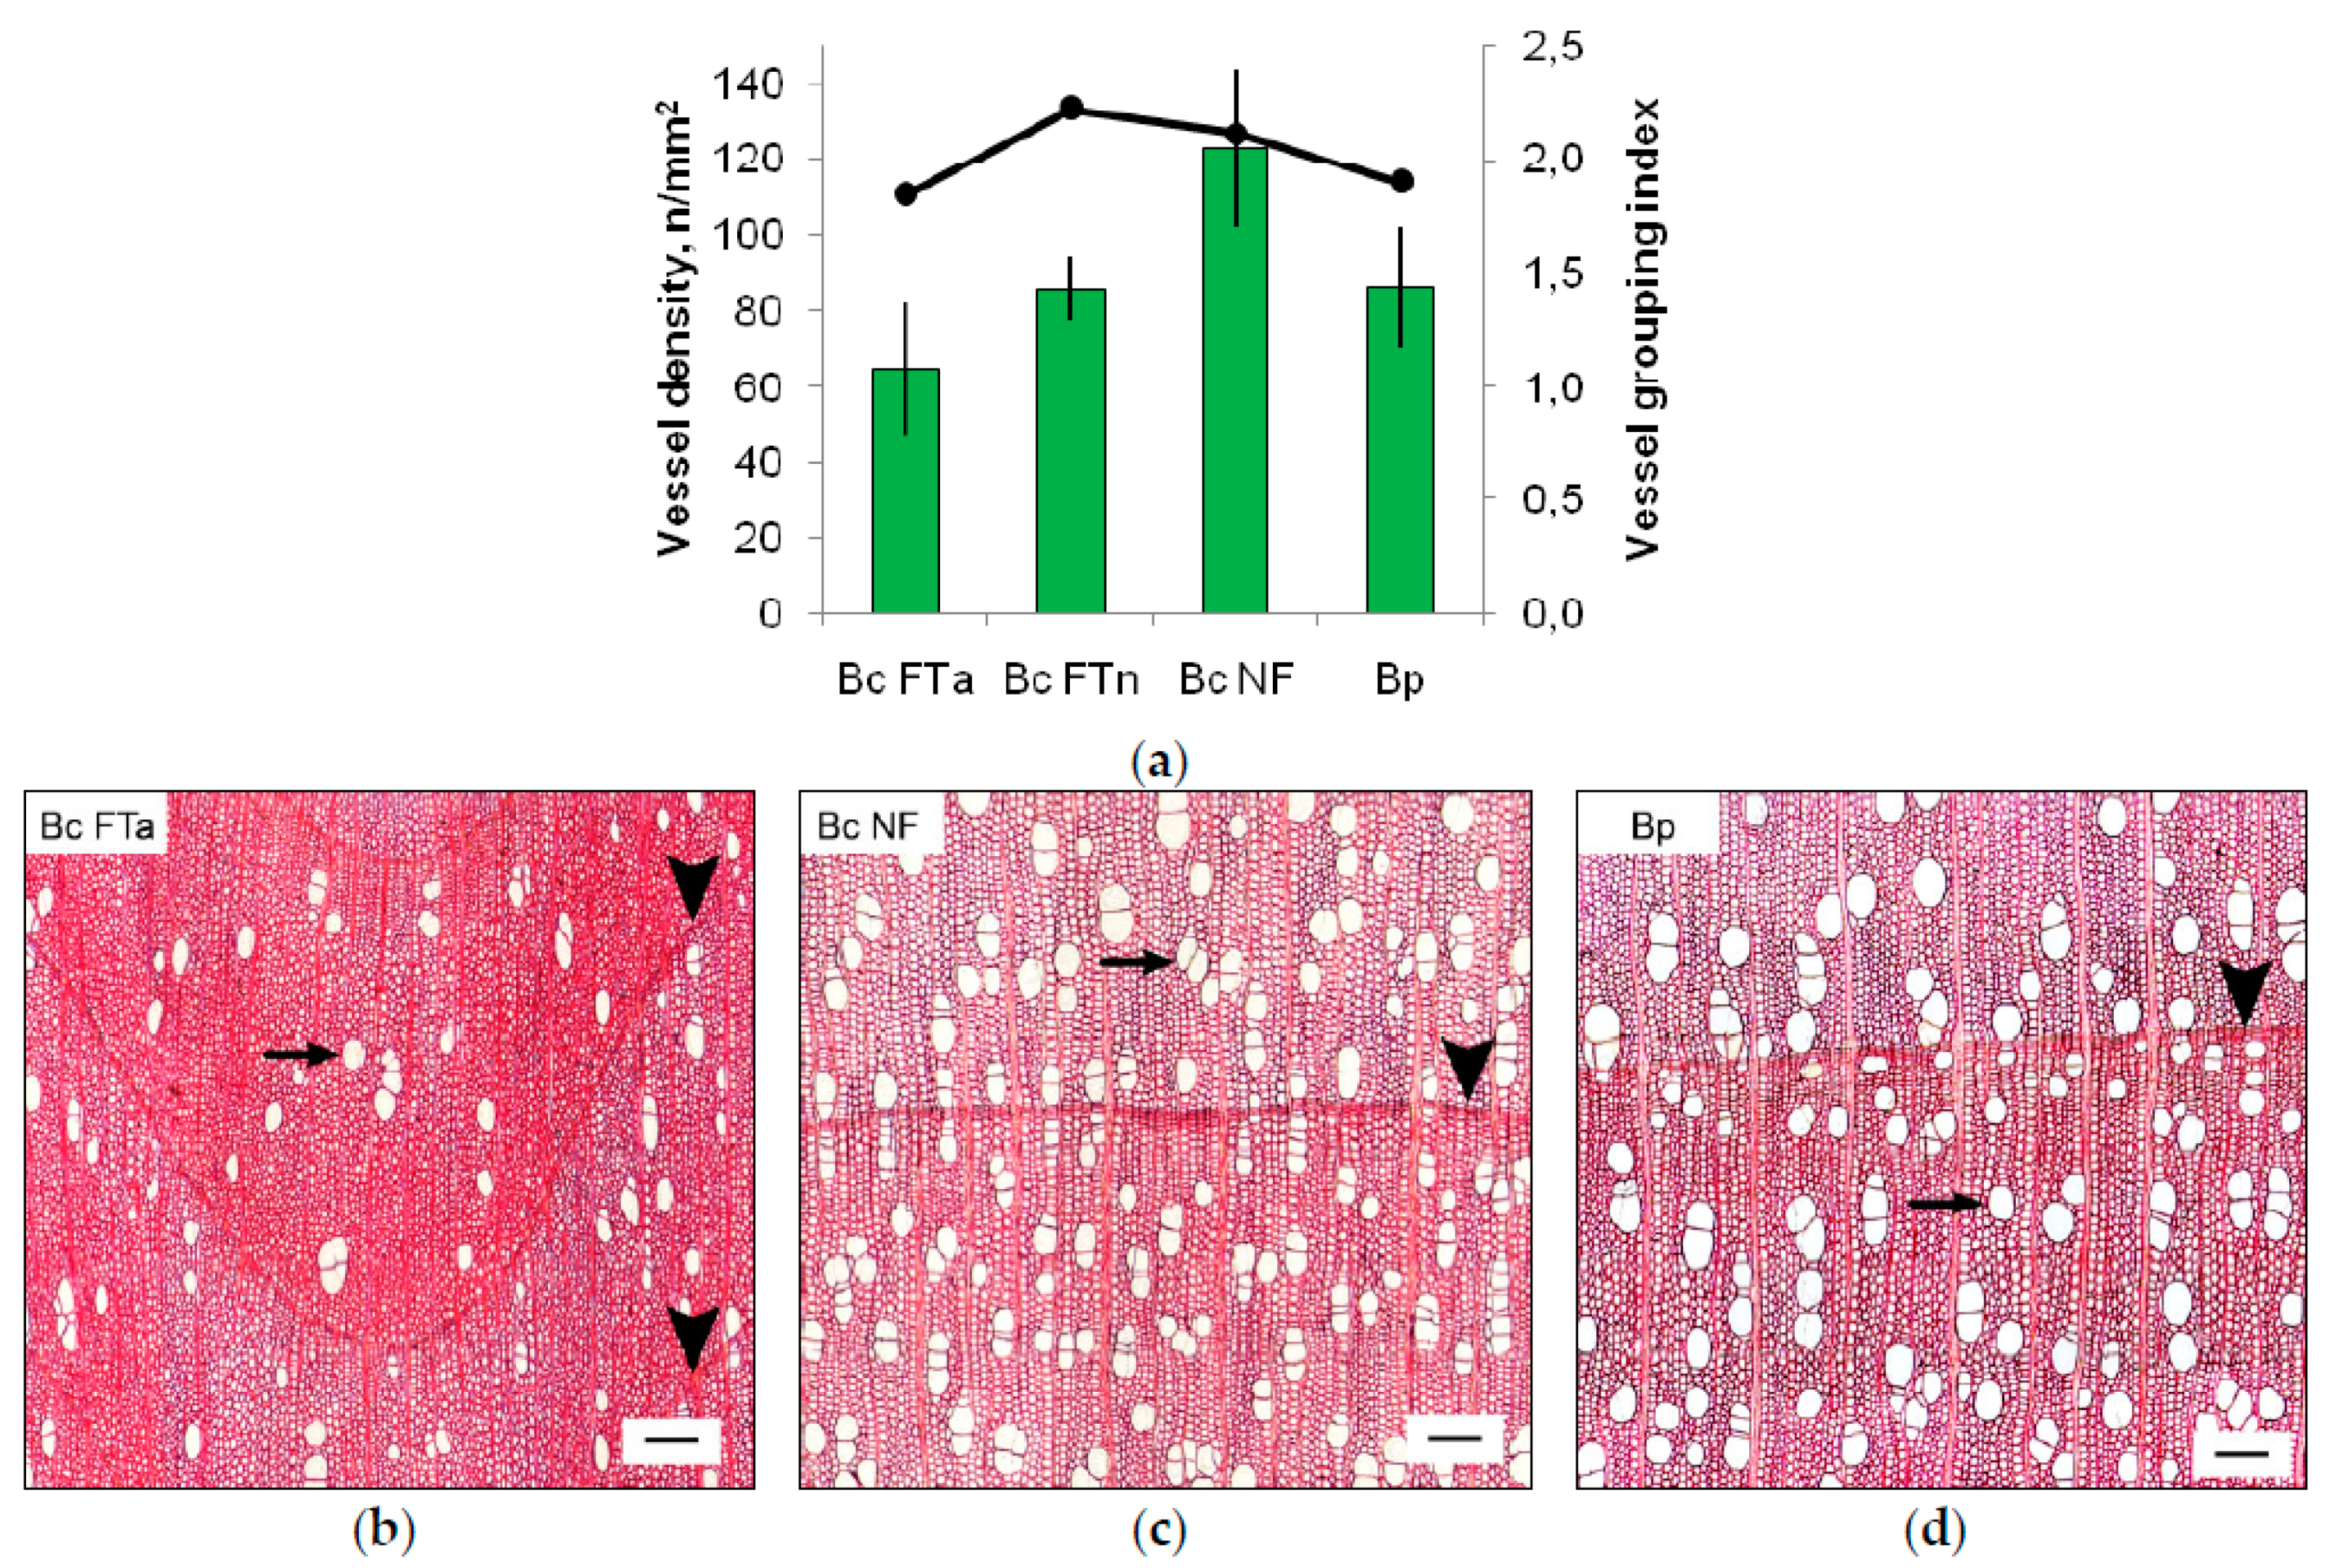
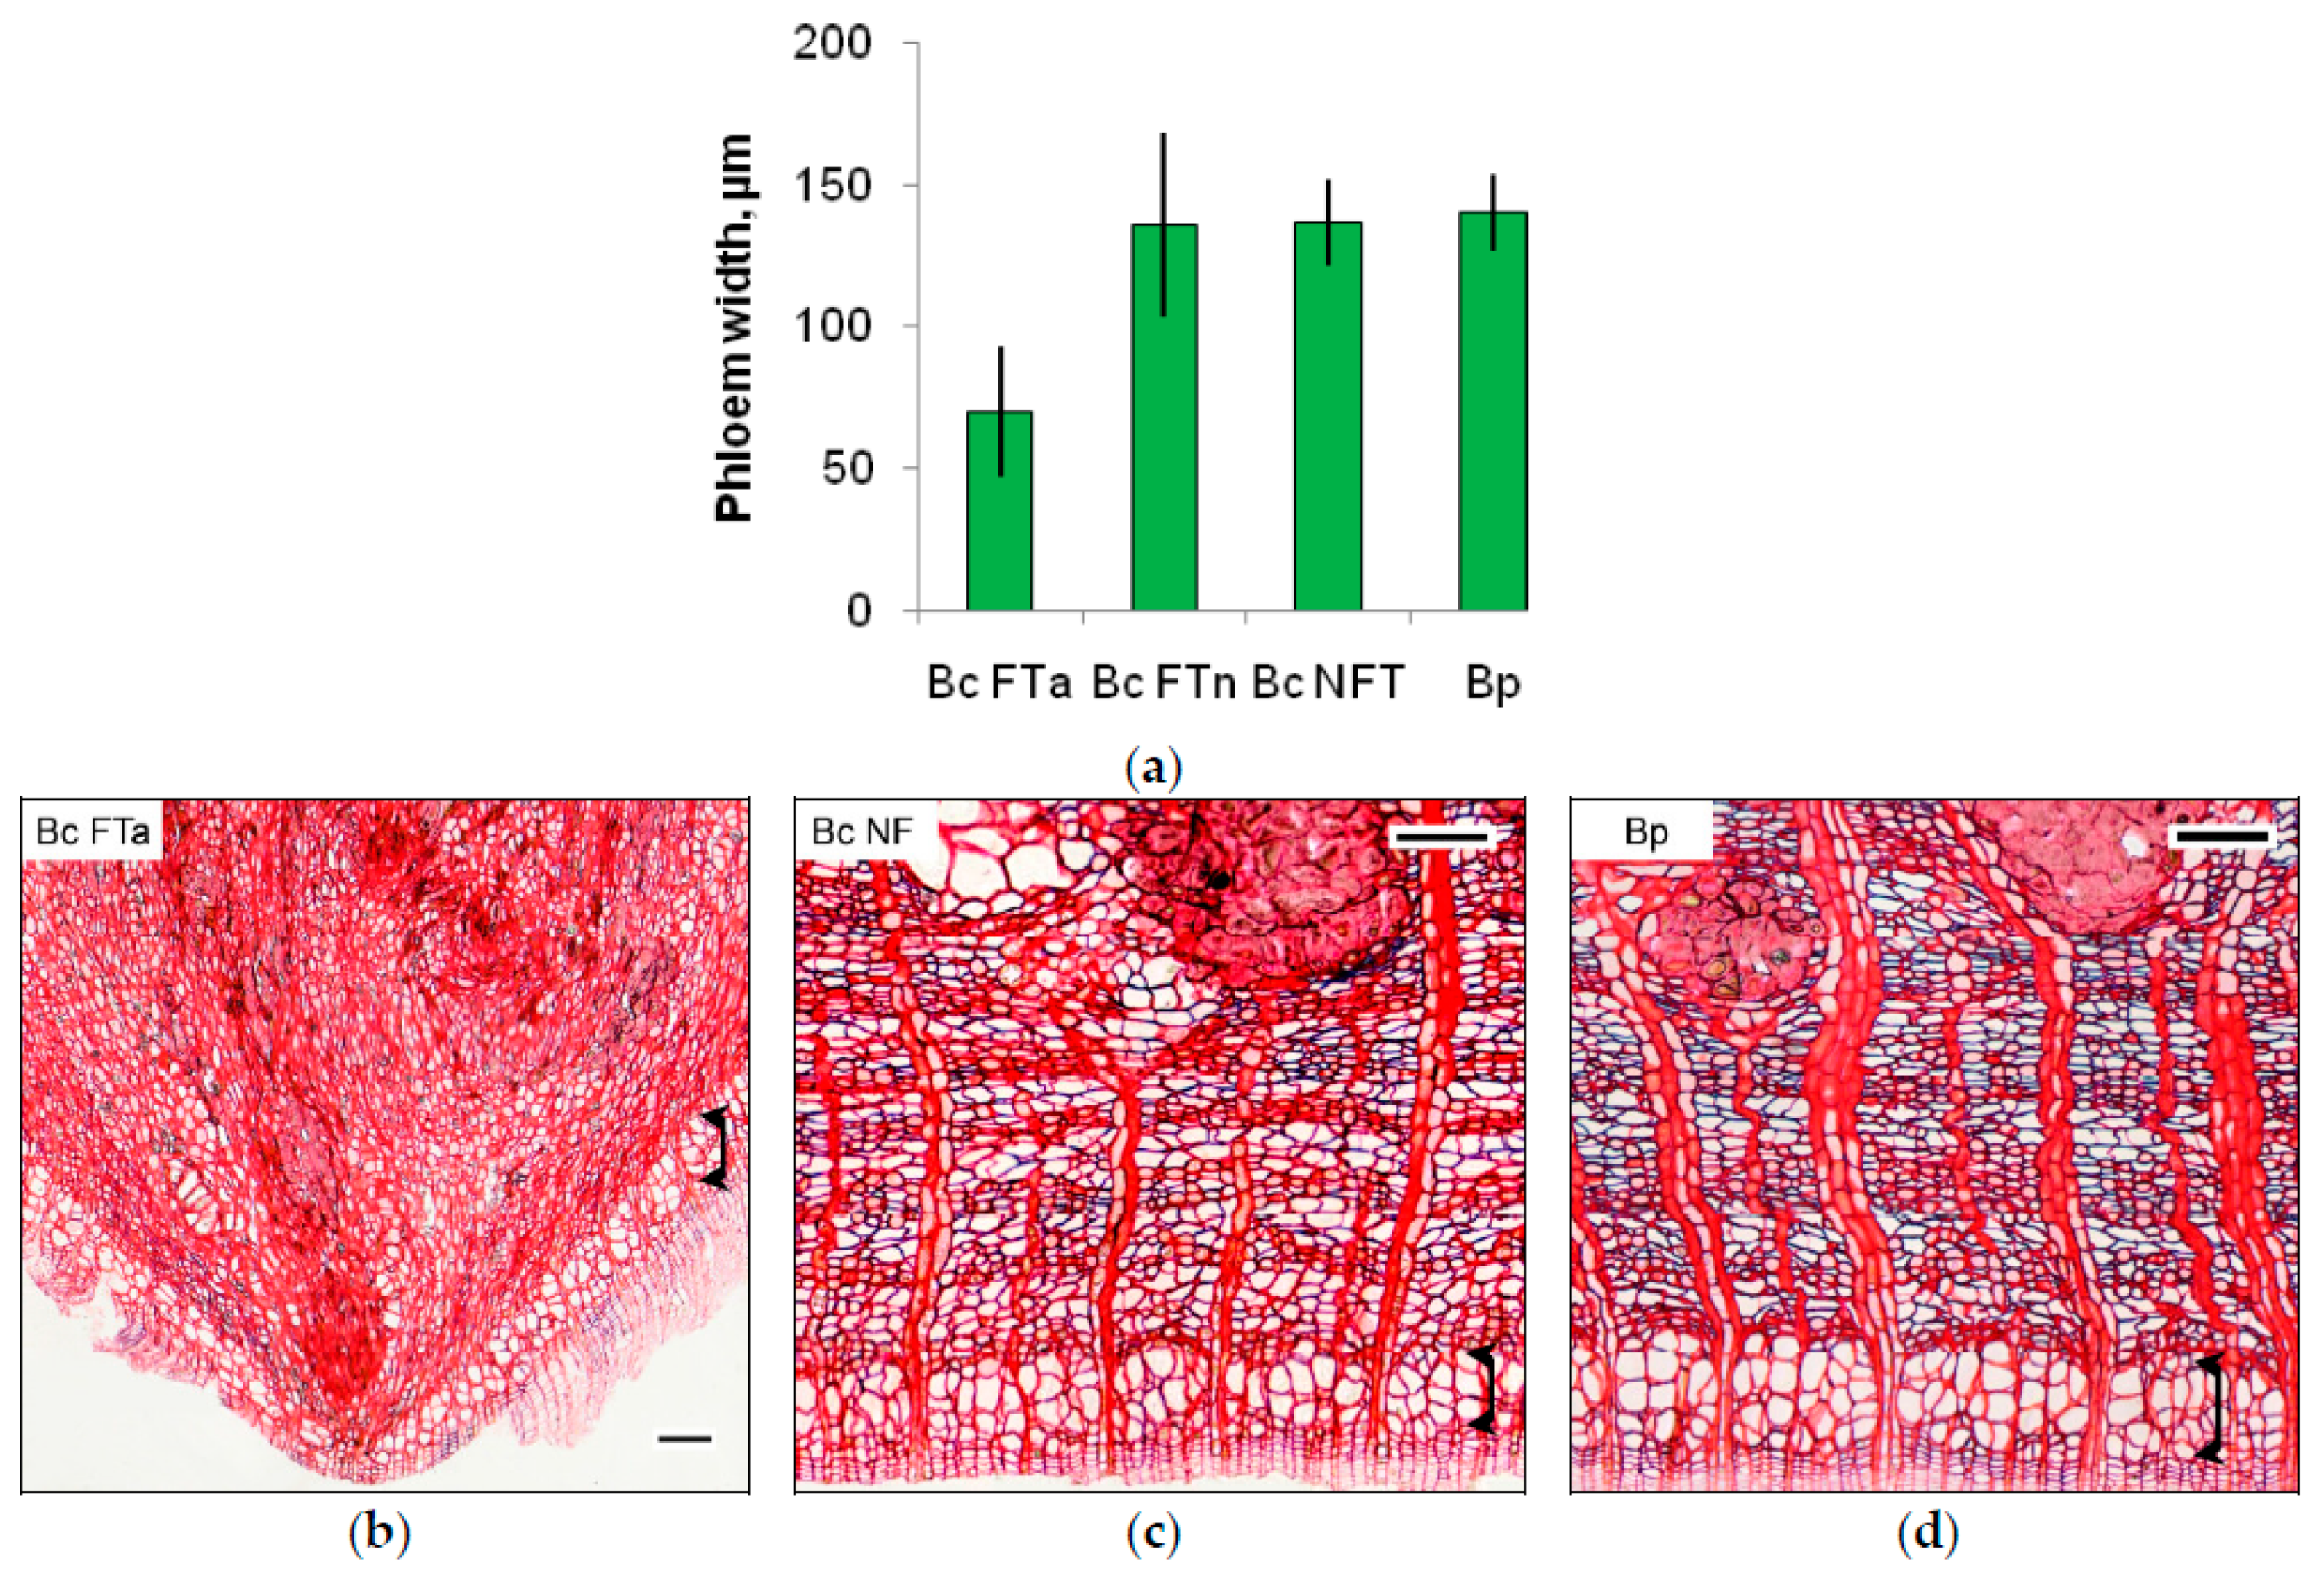
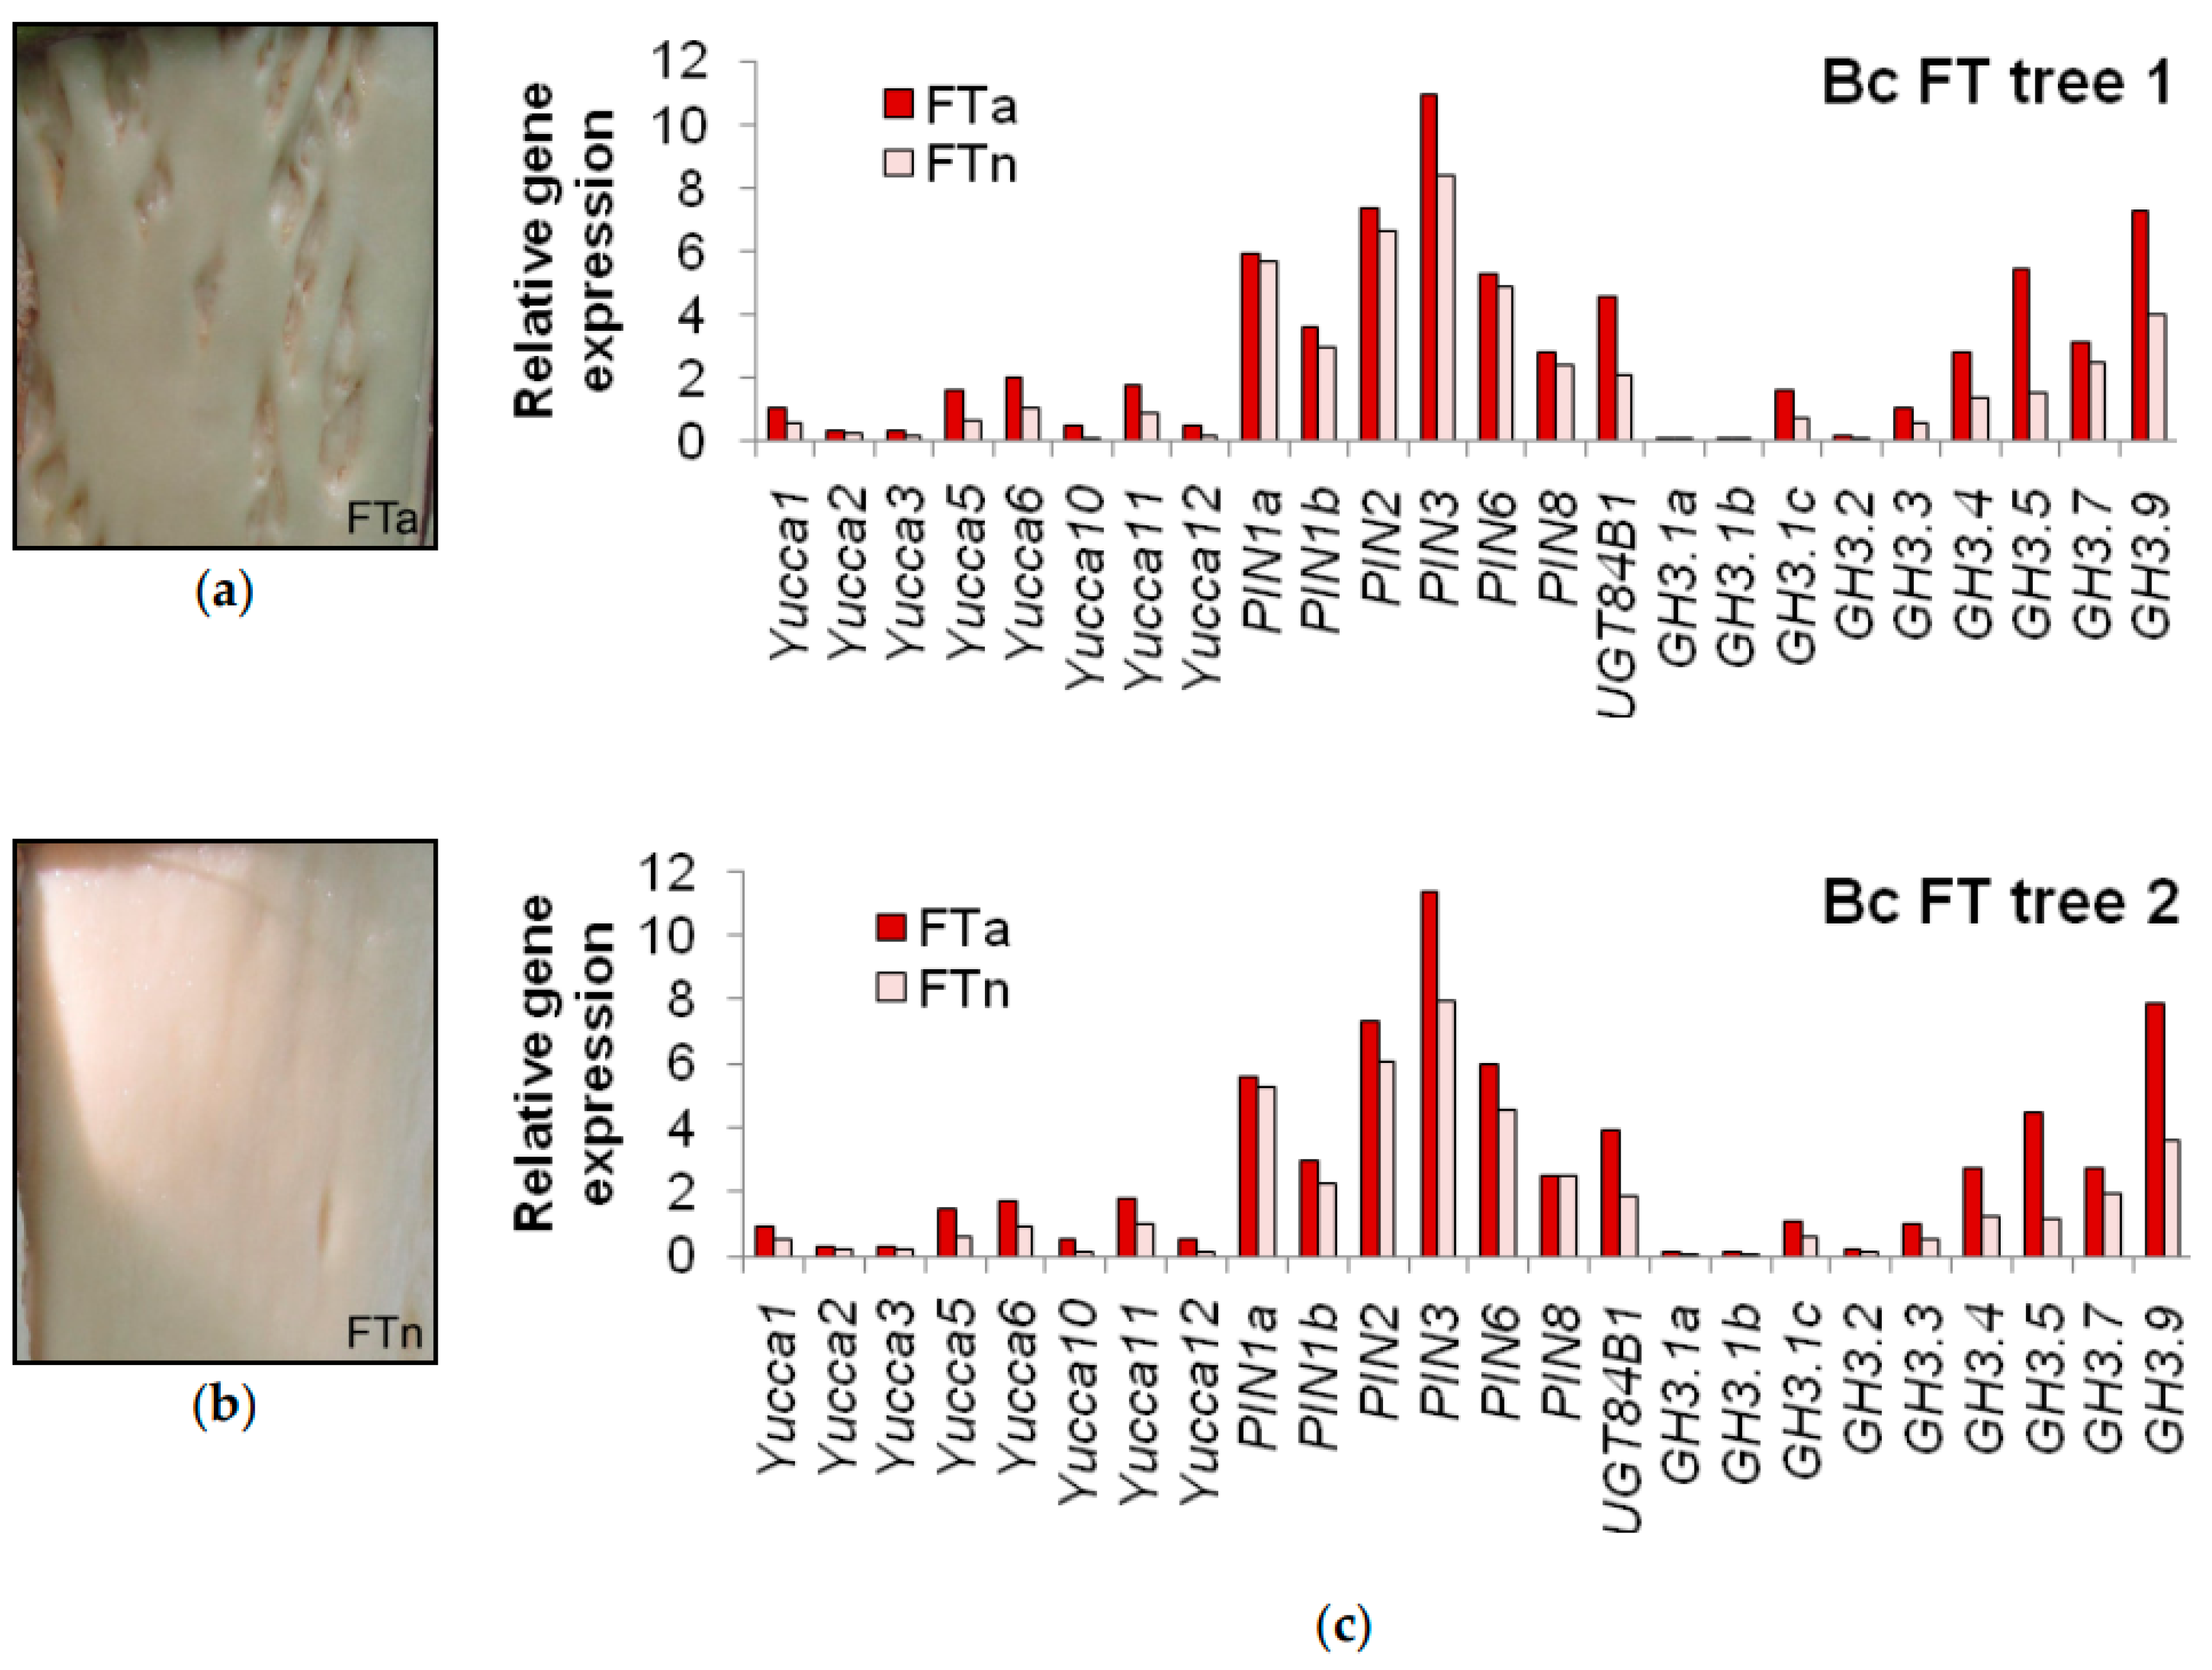
2.1. The Anatomy of Conducting Tissues in Sample Tree Trunks

Visual observation revealed no signs of anomalous structure in the trunk tissues of common silver birch trees (B. pendula var. pendula, hereafter Bp trees) and Karelian birch trees with straight-grained non-figured wood (non-figured B. pendula var. carelica trees, hereafter Bc NF trees), whereas Karelian birch trees with richly figured wood (figured B. pendula var. carelica trees, hereafter Bc FT trees) demonstrated pronounced anomalies in wood and bark structure (Figure 1).
Abnormal wood in trunk areas with figured grain (Bc FTa parts) has been forming over at least the last three growing seasons. The main traits of an abnormal xylem structure were a tortuous annual increment outline and a reduced density of vessels (Figure 2). The number of vessels per unit area was the greatest in Karelian birch xylem with a normal structure (in Bc NF trees and in trunk areas with non-figured wood (Bc FTn parts)). The lowest values of this parameter were found in Bc FTa parts. The greater number of vessels in Karelian birch xylem with a normal structure ensued from a larger proportion of vessels in groups (radial multiples and clusters). We saw no large parenchyma aggregations or pronounced curling of structural elements in the xylem in Bc FTa parts.
Bark tissues in Bc FTn parts, as well as in Bc NF trees and Bp trees, had a structure typical of the species, with no signs of anomalies. The bark in Bc FTa parts was thicker than in non-figured parts of the same trunk. At the same time, conducting phloem width in anomaly areas was half its width in the bark formed in the variants with straight-grained wood. The reduced conducting phloem thickness in Bc FTa parts was a consequence of a smaller number of sieve elements (2–3 cells in annual phloem increment) compared to other variants (5–6 cells in annual phloem increment) (Figure 3).

2.2. Yucca and GH3 Identification in the Silver Birch Genome

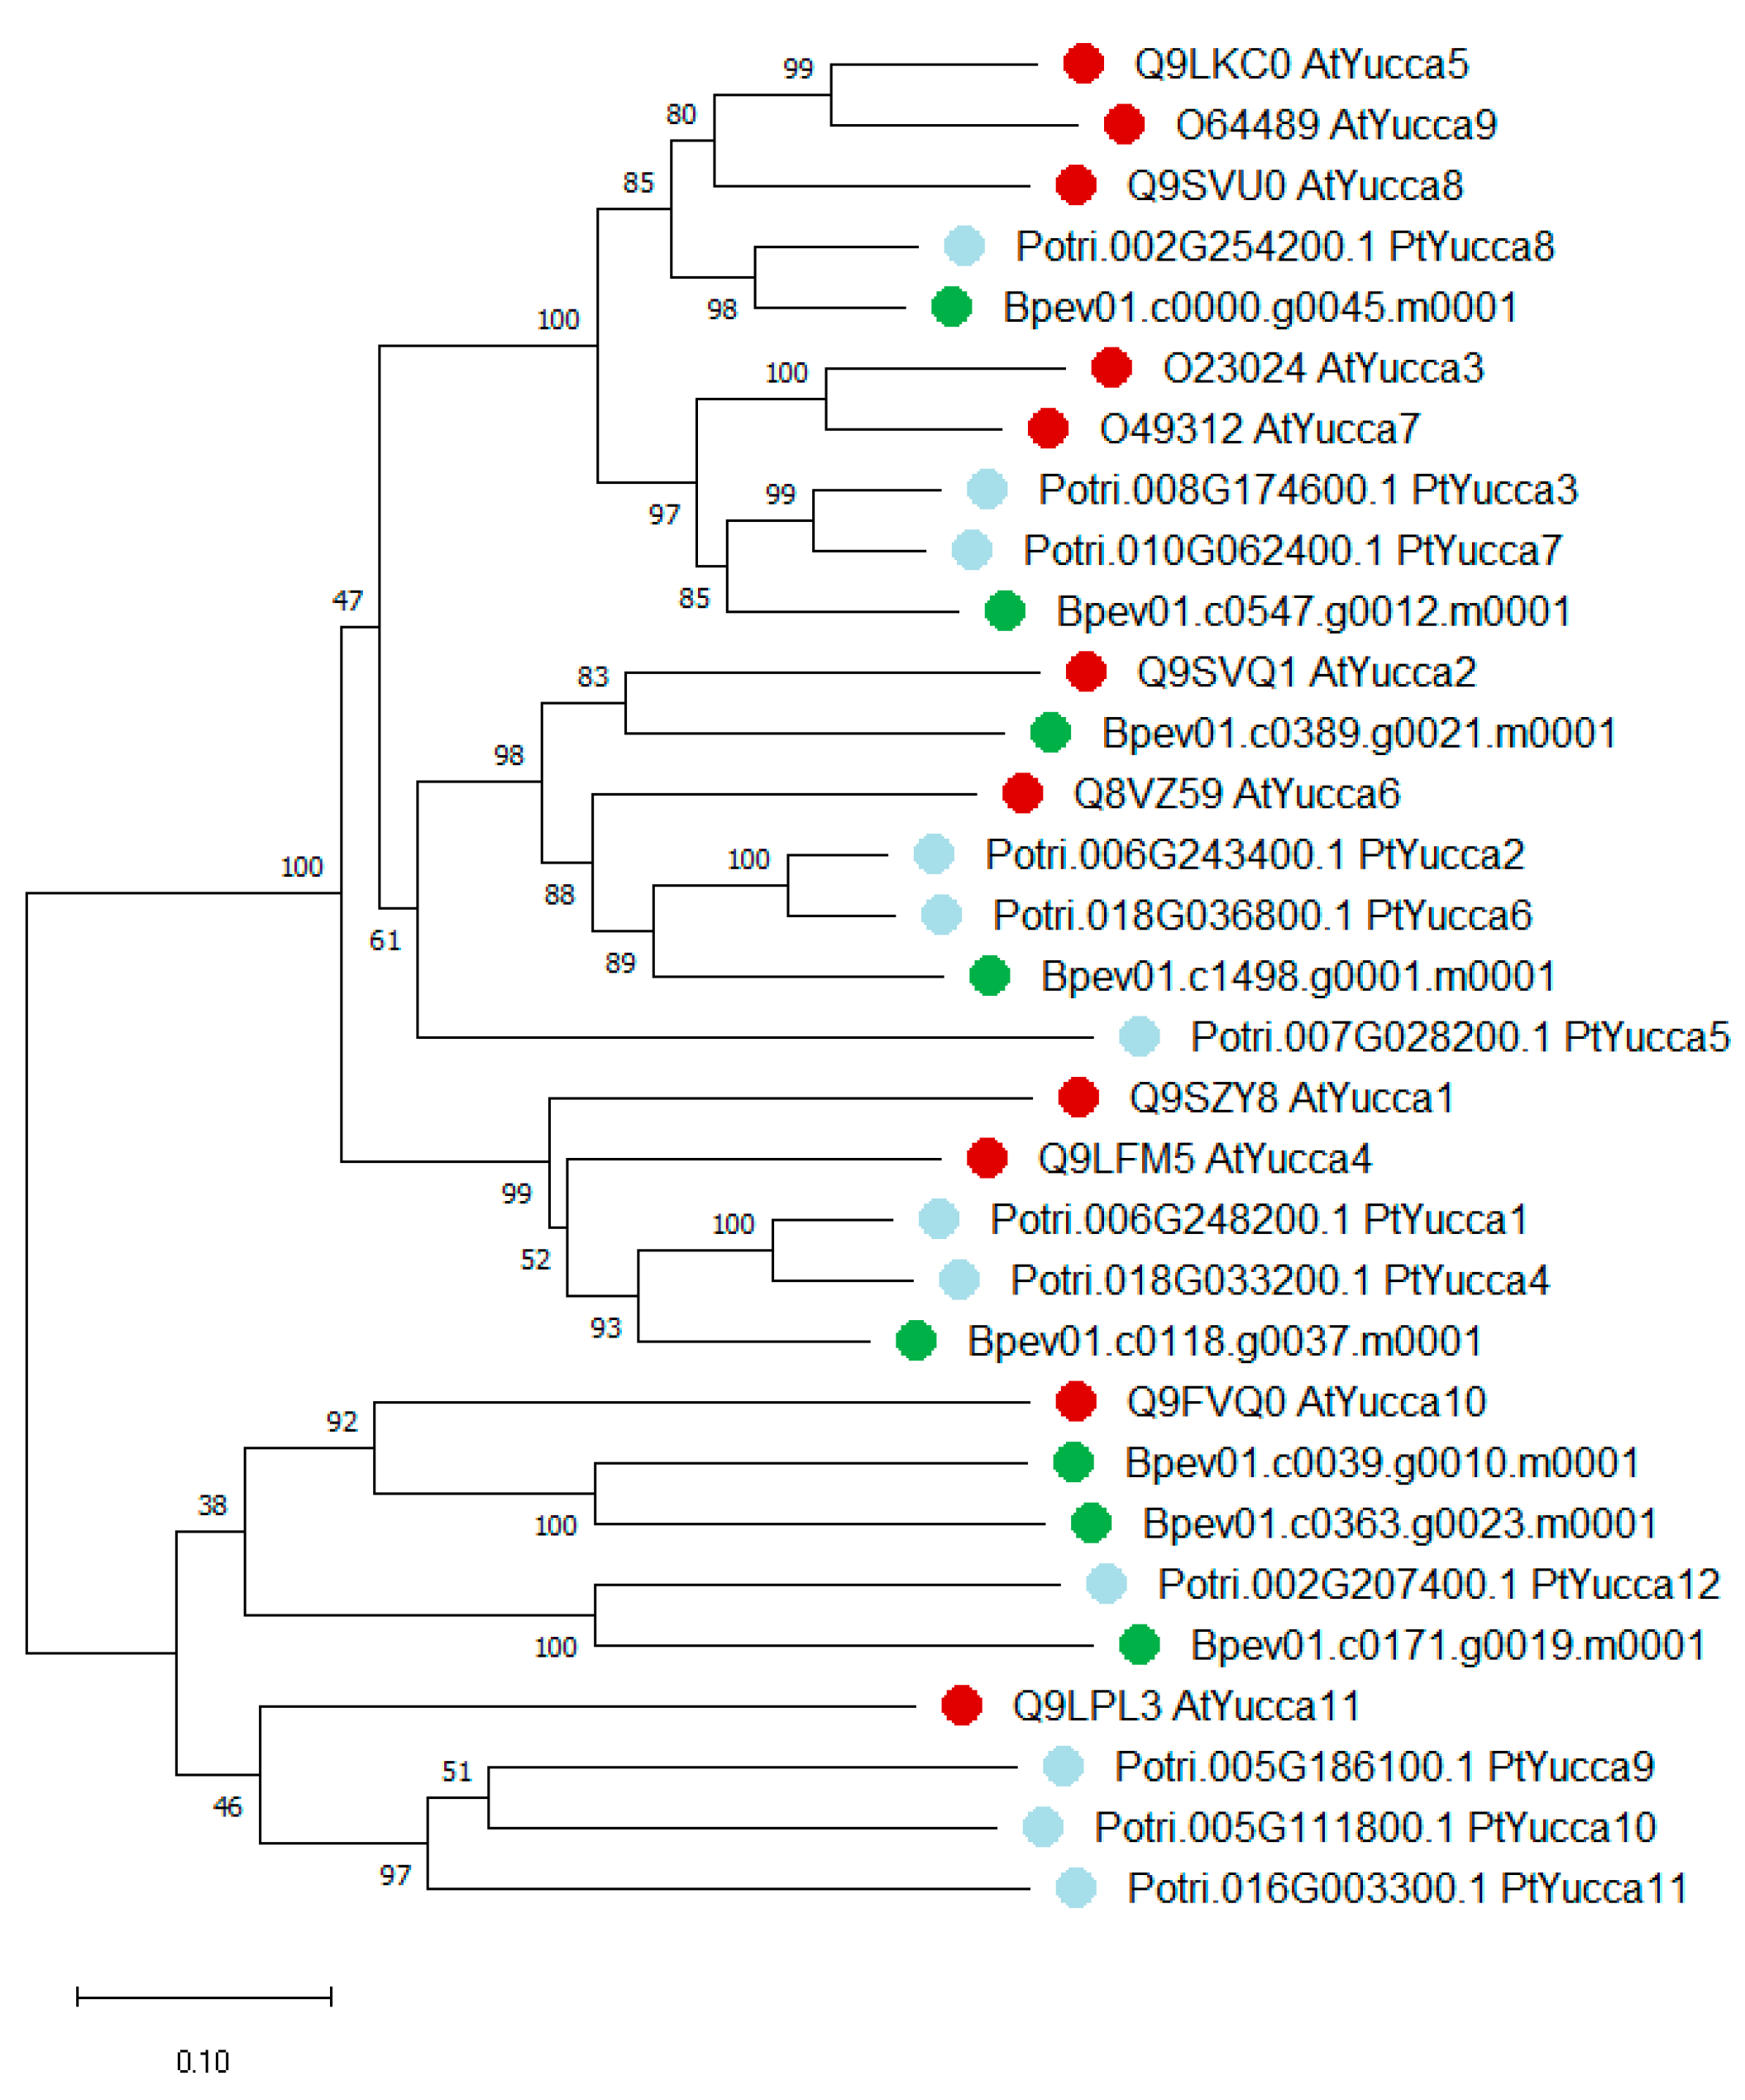
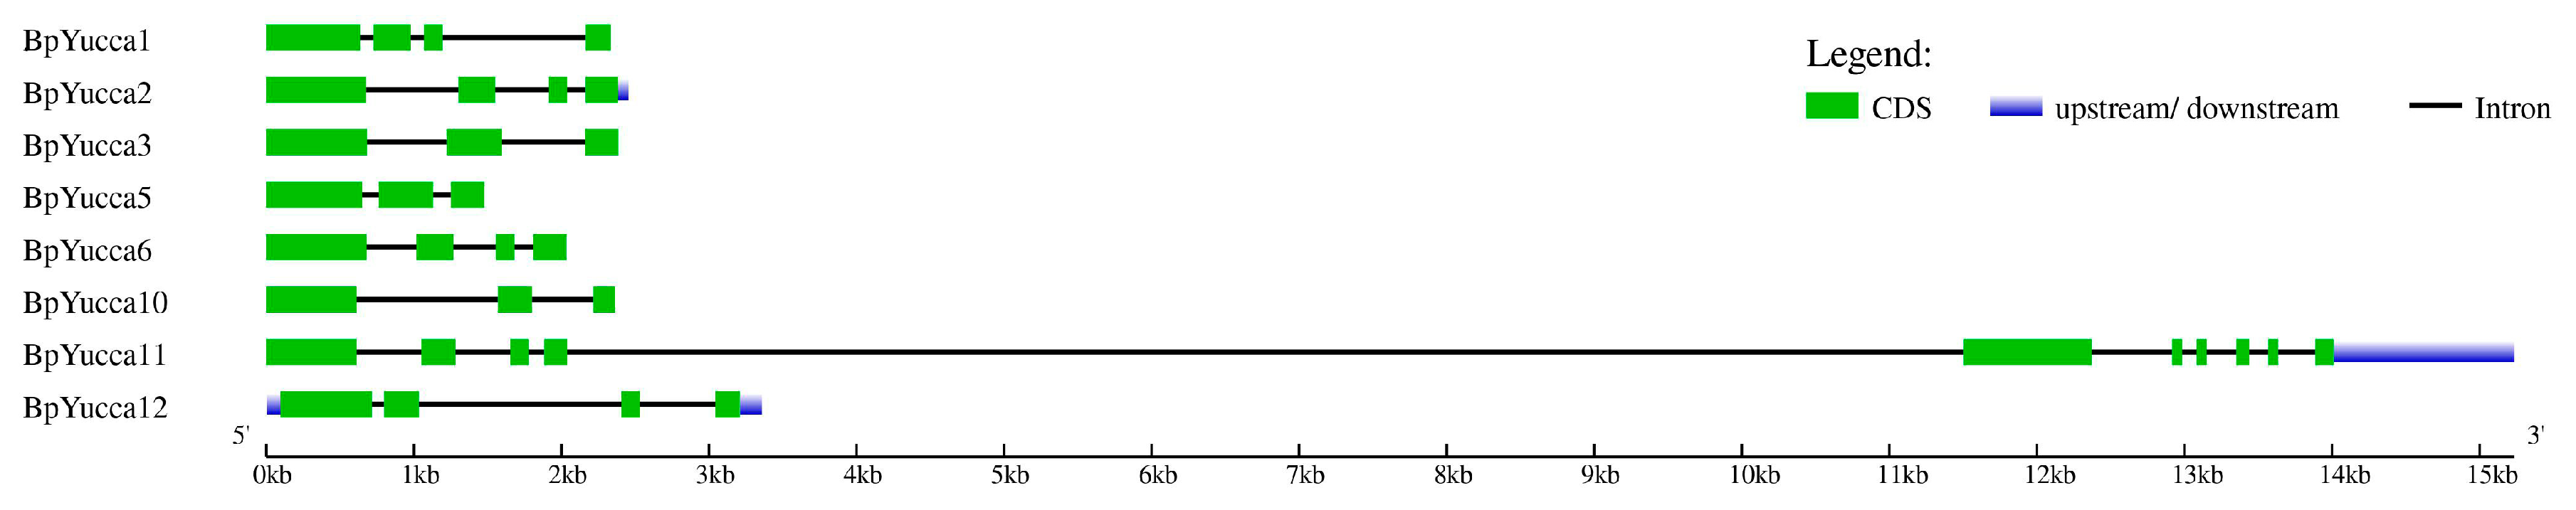
2.2.1. Yucca Family Genes

Eight genes coding for sequences homologous to Yucca proteins of A. thaliana and P. trichocarpa were identified in the silver birch genome. Putative Yucca proteins of silver birch were named according to phylogenetic analysis results (Figure 4, Table 1). Yucca genes of B. pendula were distributed on five chromosomes: Chr_01, Chr_04, Chr_07, Chr_09, Chr_10 (Figure 5). The distribution of Yucca genes was not uniform: Chr_10 had three Yucca genes (BpYucca2, BpYucca5, BpYucca10), Chr_09 had two genes (BpYucca1 and BpYucca6), while each of Chr_01, Chr_04 and Chr_07 had only one gene. Four Yucca members (BpYucca1, BpYucca2, BpYucca6, BpYucca12) fad four exons, three Yucca genes (BpYucca3, BpYucca5, BpYucca10) had three exons, and BpYucca11 had 10 exons (Figure 6).
The identified sequences contained motifs characteristic of flavin-containing monooxygenases and Yucca proteins: FMO-identifying motif “FxGxxxHxxxY/F”, two conservative “GxGxxG” motifs, (FAD-binding site and NADP-binding site), GC motif “ExxxxxAS”, ATG-containing motif 1 “WL(I/V)VATGENAE” and ATG-containing motif 2 “F/LATGY”. ATG-containing motif 1 was missing in three of the eight putative proteins. In five of the eight putative proteins, the ATG-containing motif 2 was represented by the “LATGY” sequence and in another two by the “FATGY” sequence, whereas the BpYucca12 protein was found to have two amino acid replacements within this fragment of the sequence (Table 1).
The percent identity of putative silver birch Yucca proteins shared with A. thaliana and P. trichocarpa proteins was 47.9–86.0%, excluding BpYucca11 with 27.4% and 27.2%, respectively (Table 1). Structural analysis of the Yucca11 protein showed its sequence to be longer compared to Yucca proteins of other species, and to contain the signal peptidase I, bacterial type (TIGR02227) domain, which is not typical of Yucca proteins. Previously, Alonso-Serra and others [79] demonstrated that the gene Bpev01.c0363.g0023.m0001, encoding BpYucca11, was expressed in silver birch trunk tissues, so we did not exclude this gene from our analysis, but the primer was chosen while keeping previous data in mind.

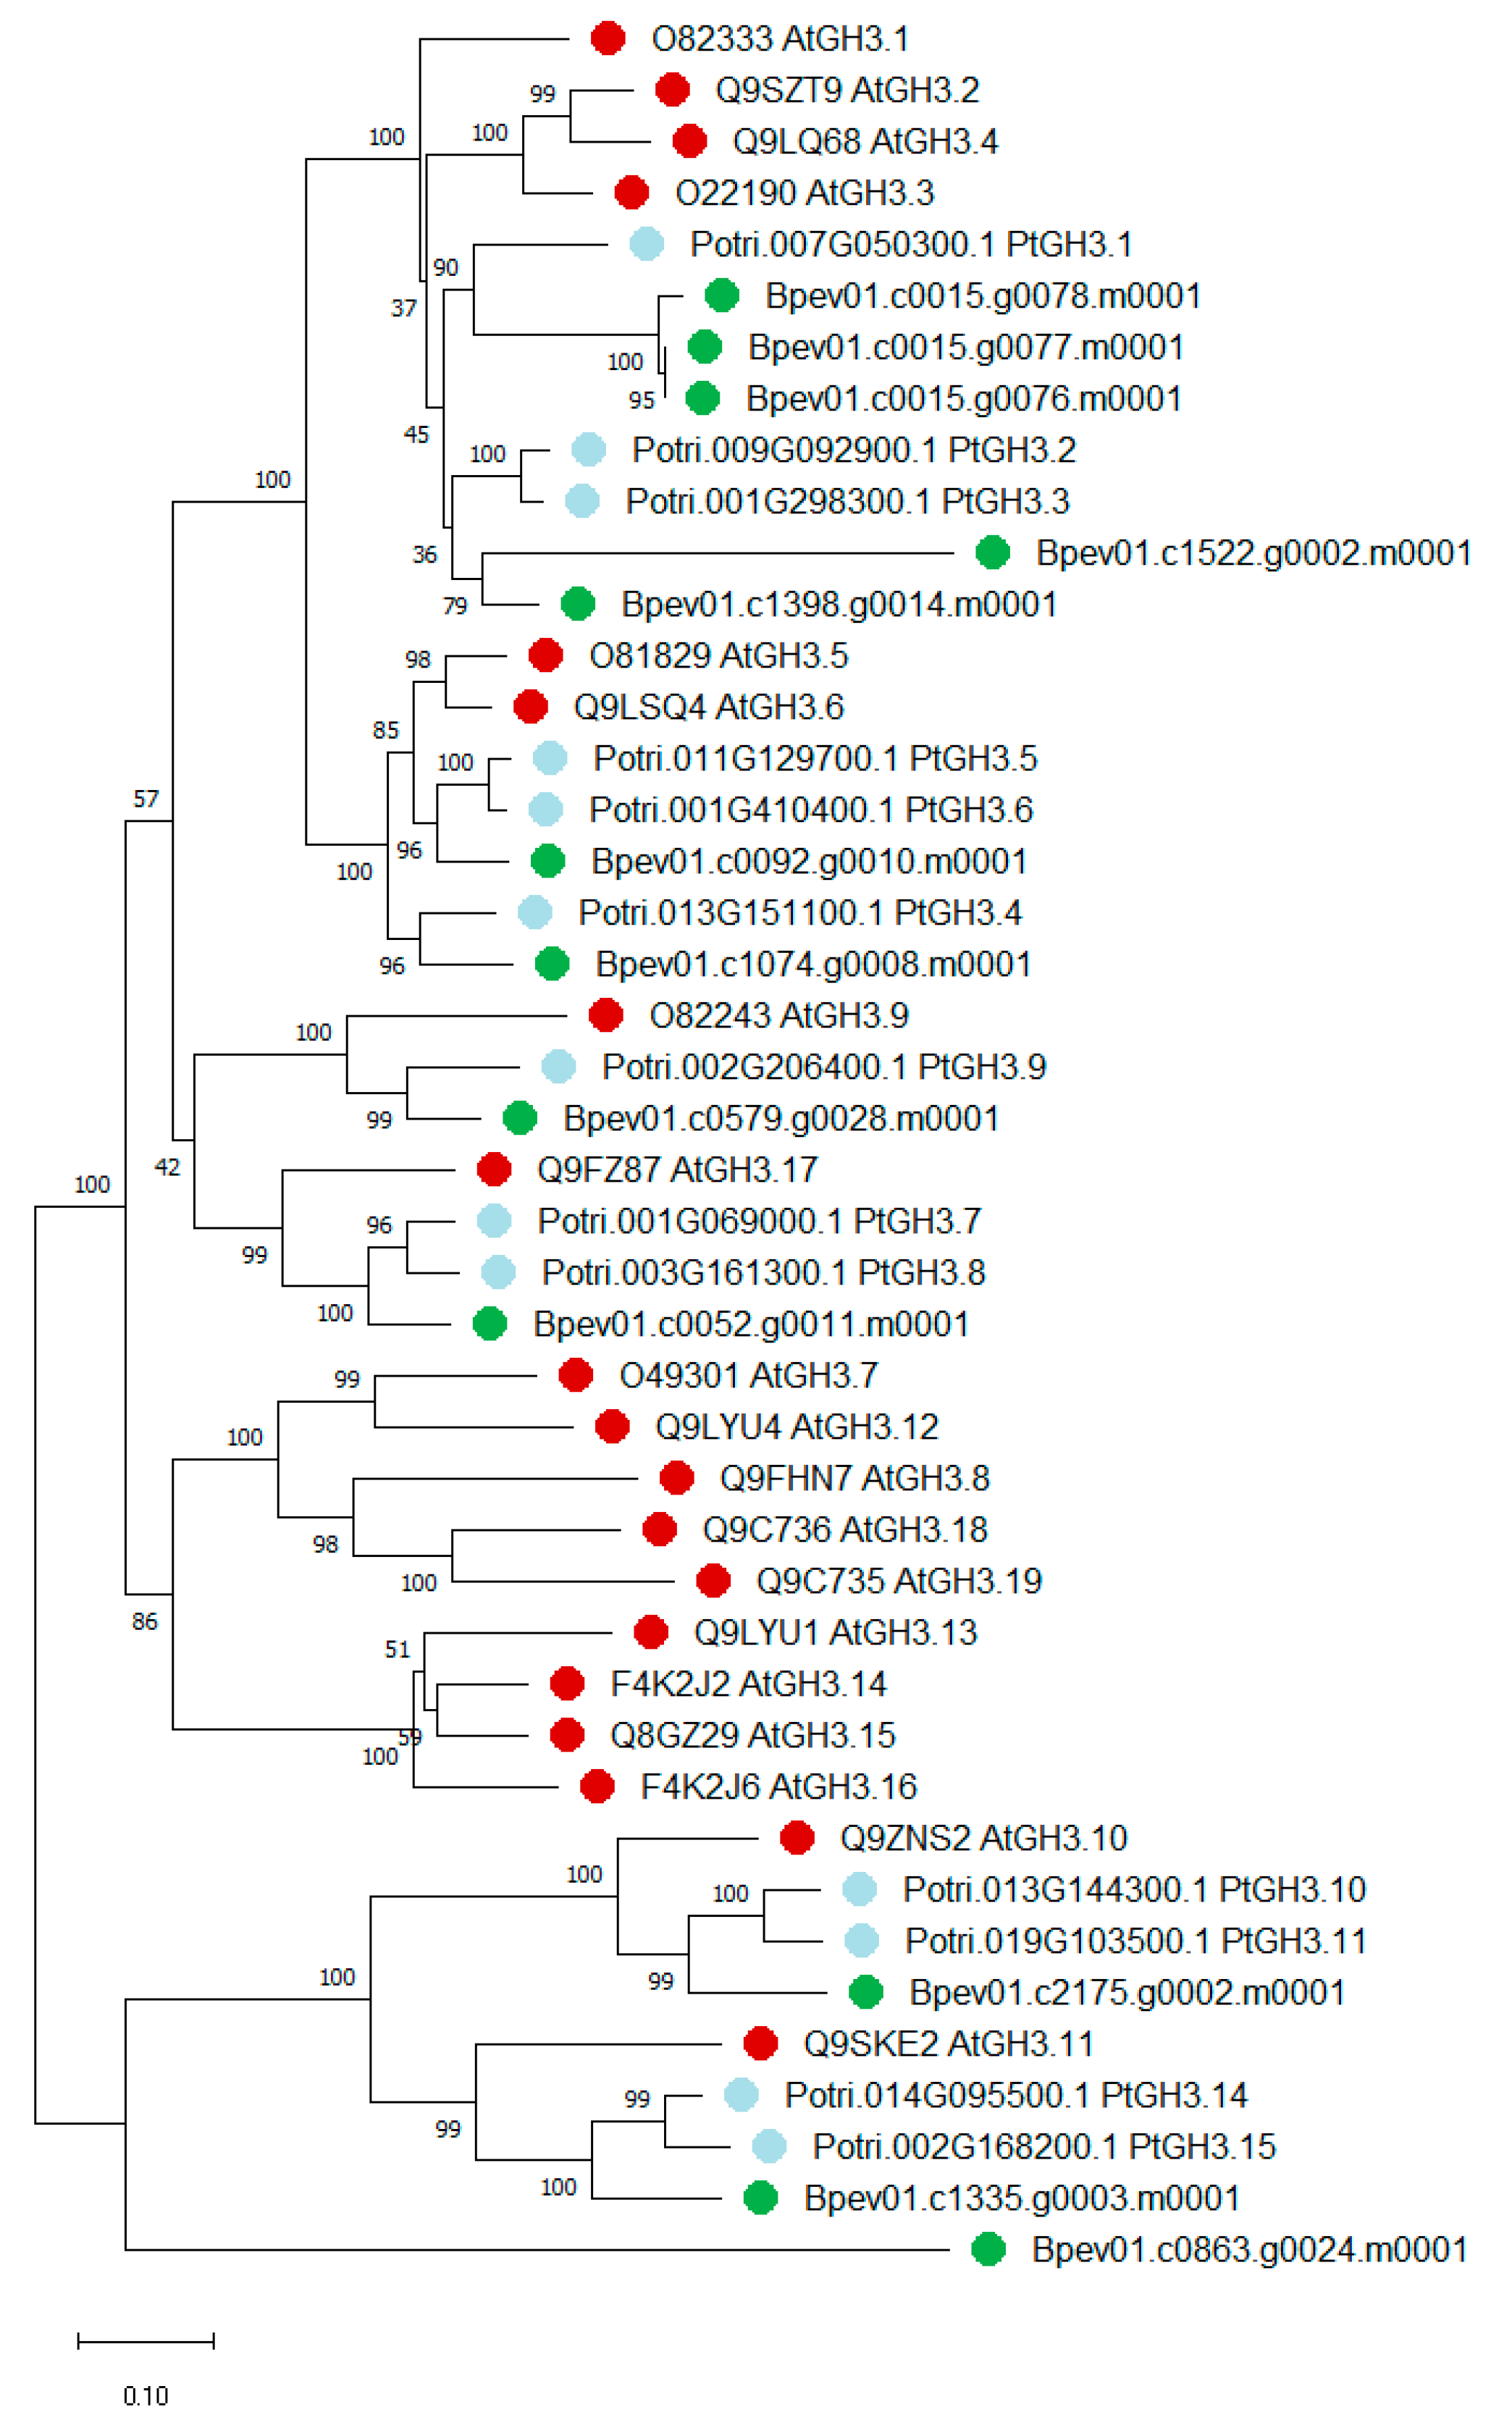
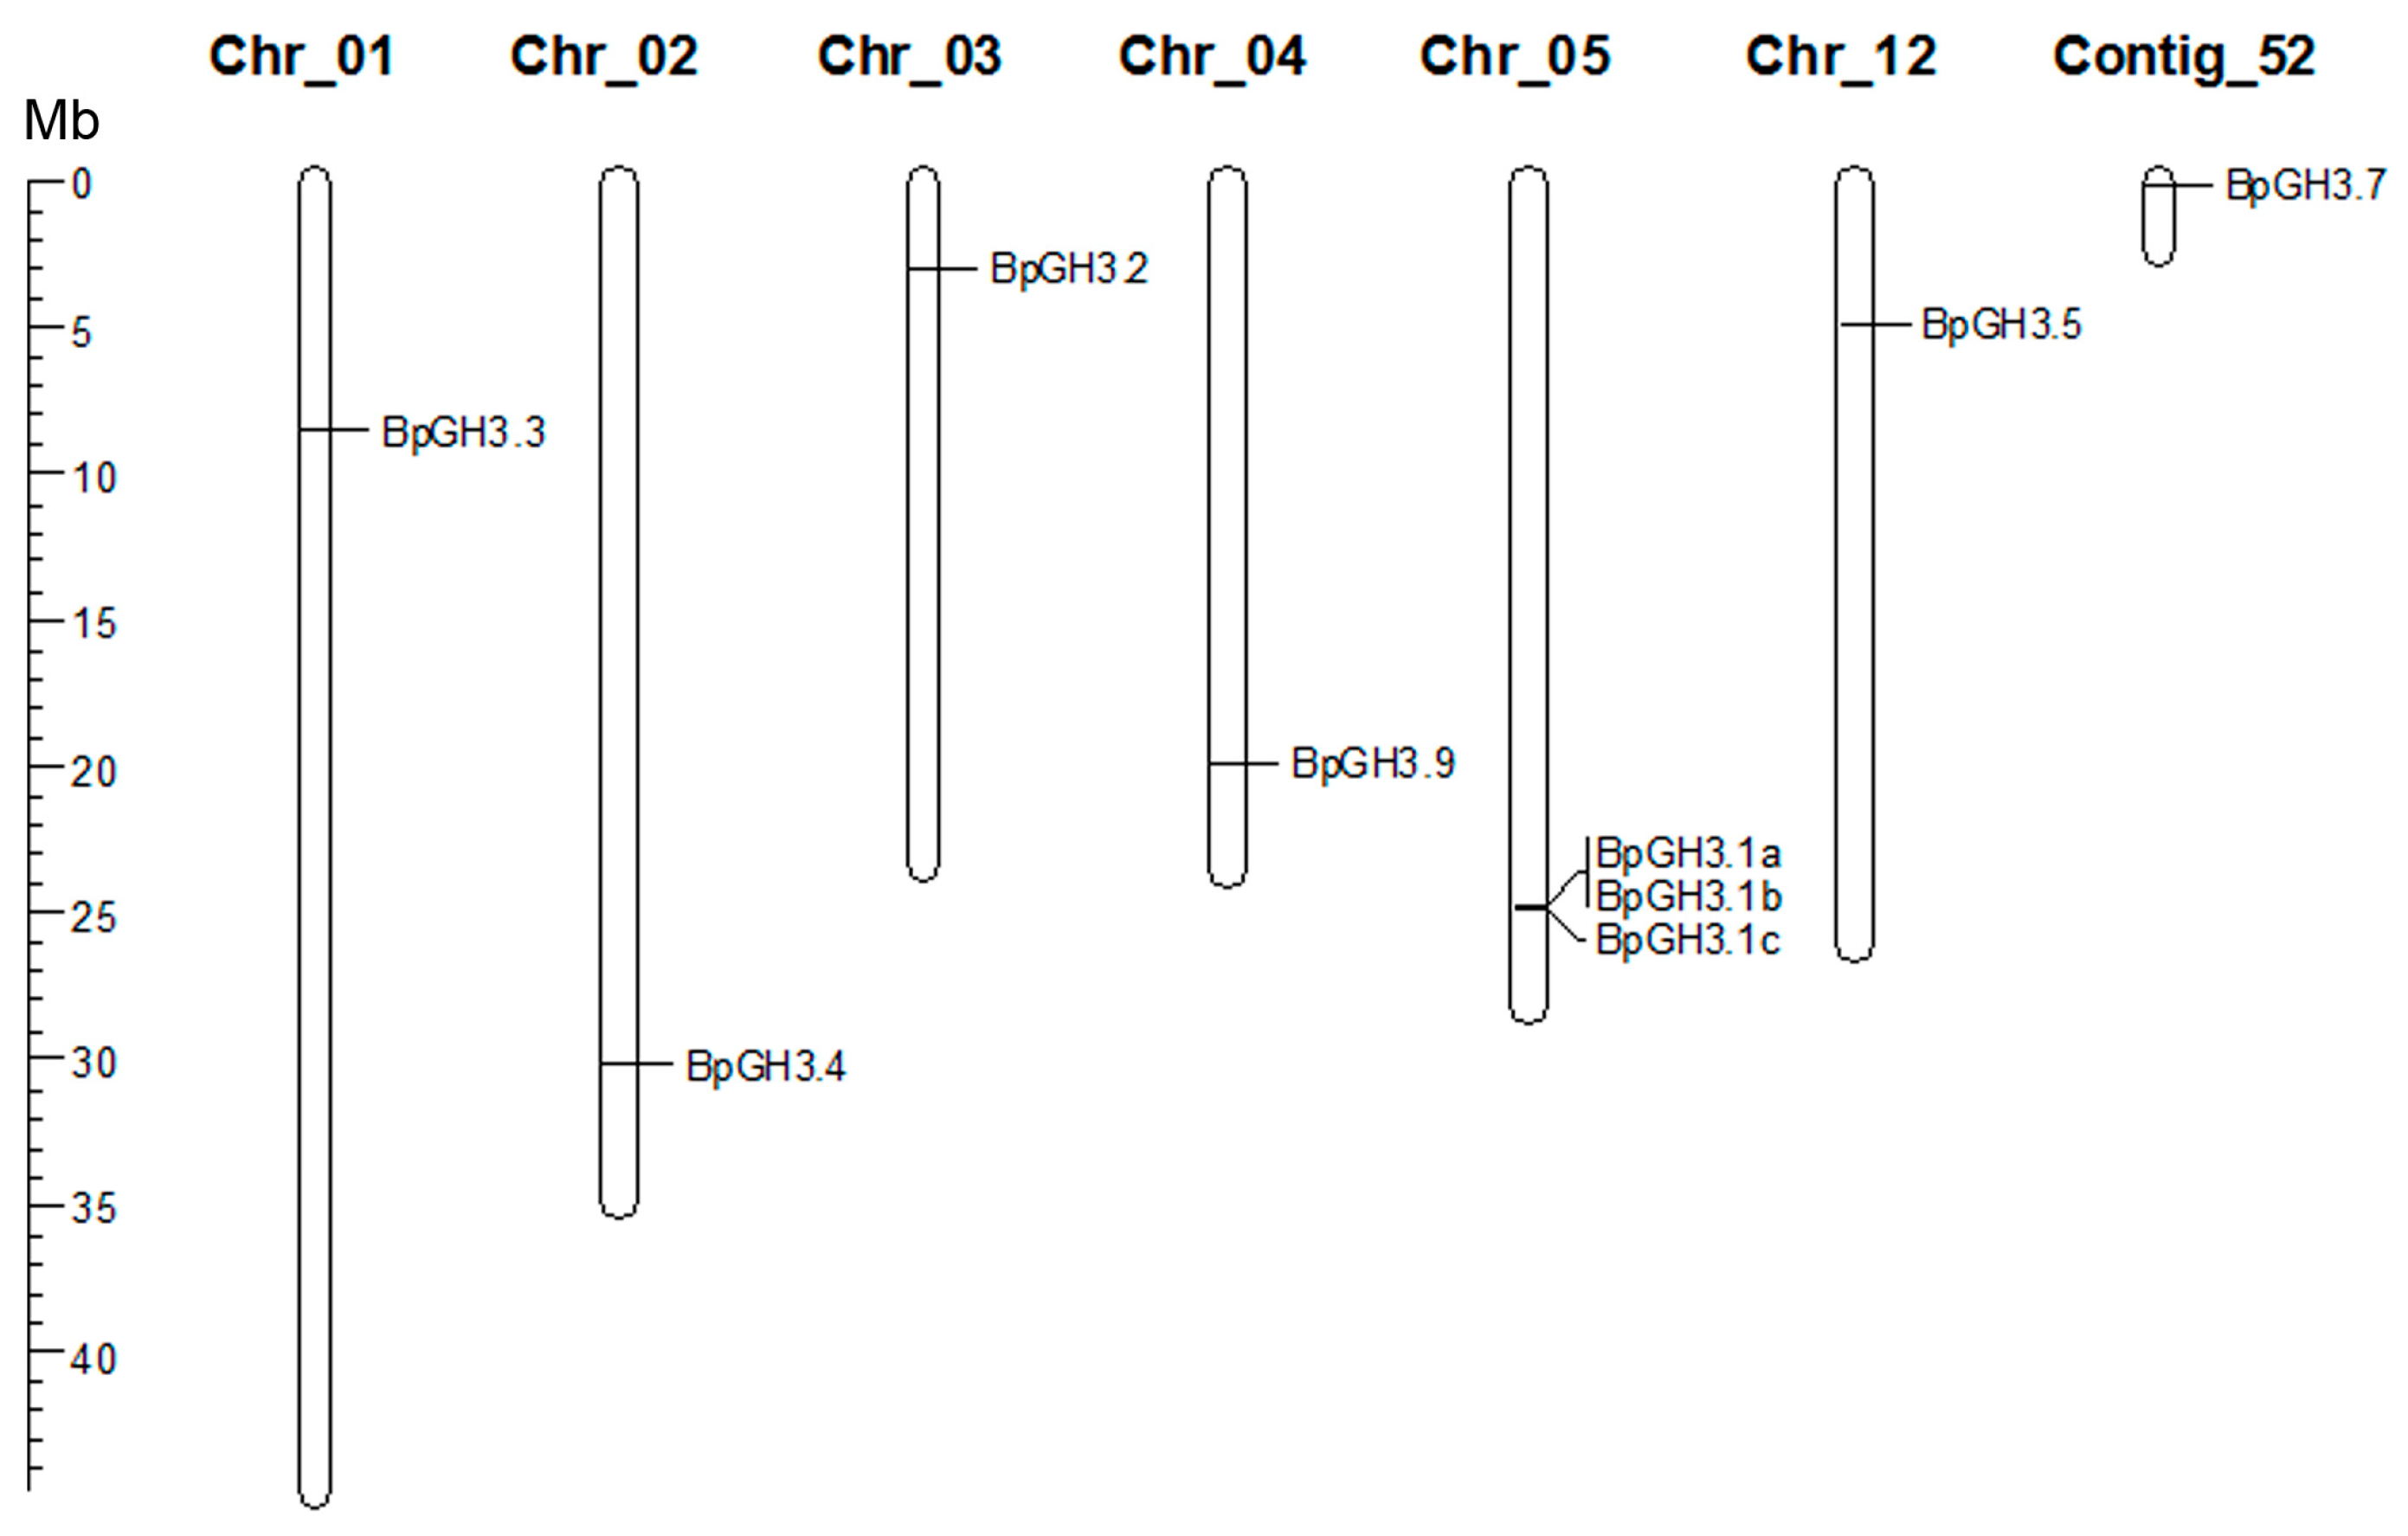
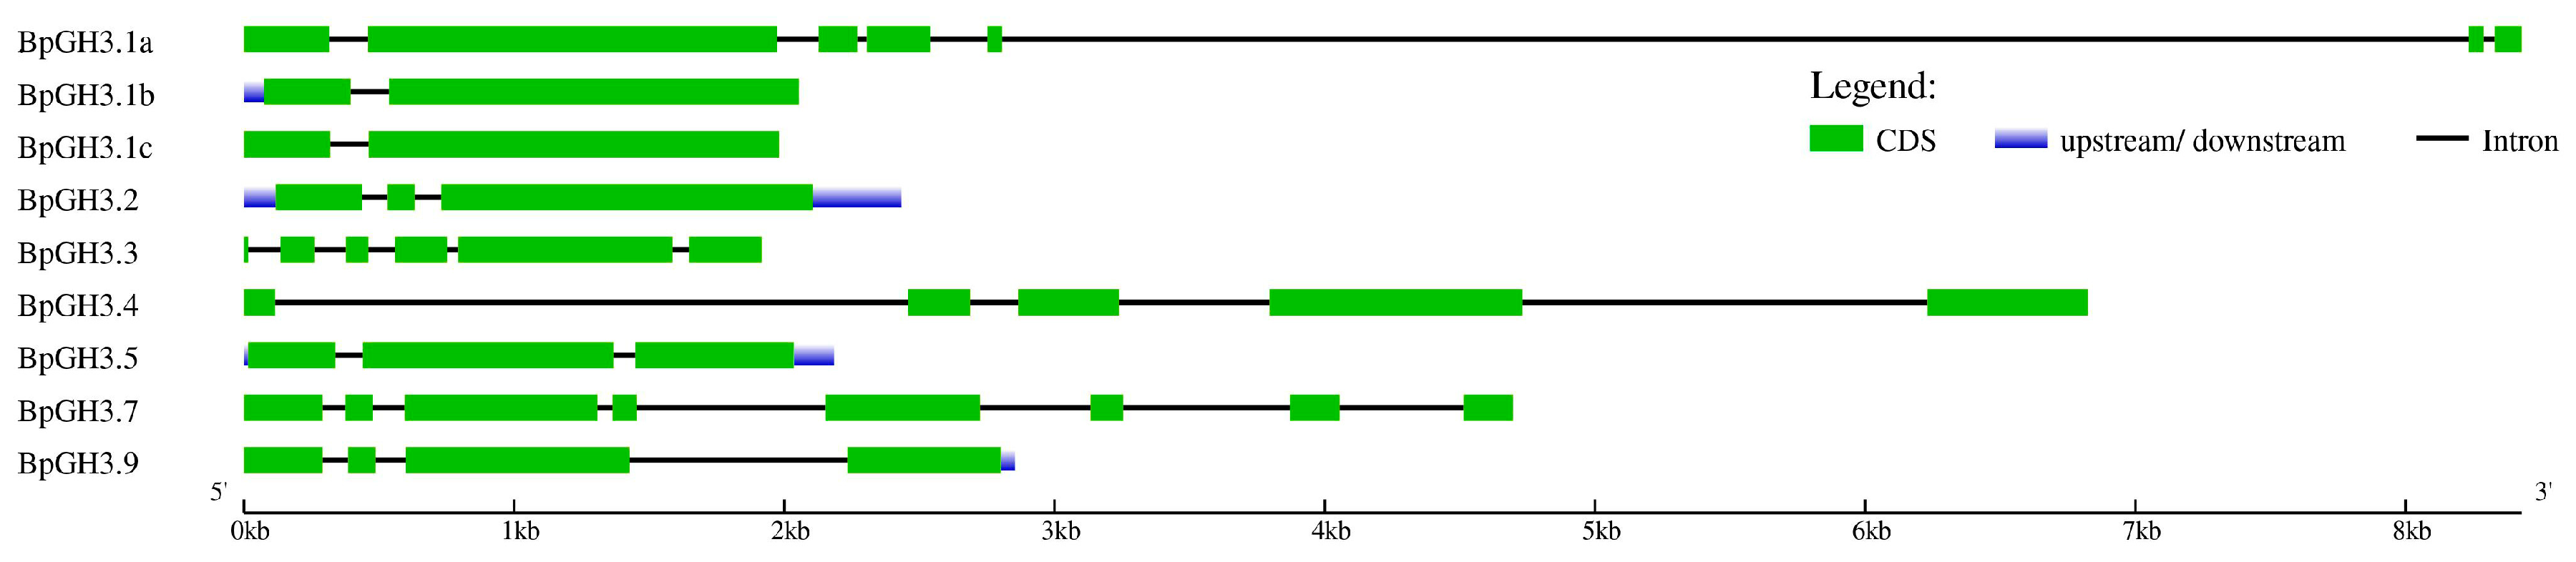
2.2.2. GH3 Family Genes

Silver birch genome was found to contain 12 genes coding for sequences homologous to GH3 proteins of A. thaliana and P. trichocarpa. All the identified sequences contained domains characteristic of amido synthetases. Based on the similarity of protein amino acid sequences and substrate specificity, the family GH3 falls into three groups [80,81]. Phylogenetic analysis showed that two potential GH3 proteins in silver birch belong to group I amido synthetases, which perform the conjugation of jasmonic acid and salicylic acid. Nine birch proteins belong to the clade formed by group II amido synthetases, which are involved in auxin conjugation (Figure 7). The protein encoded by the gene Bpev01.c0863.g0024.m0001 appears to belong to group IV amido synthetases [82]. The percent identity for protein sequences of the Bpev01.c0863.g0024.m0001 gene product and GH3.12 protein from Castanea mollissima, which belongs to group IV, was 81.4%.
As this paper is dedicated to auxin homeostasis patterns, nine genes coding for group II GH3 were selected for further analysis. The characteristics of the potential proteins encoded by genes of this group are given in tabular form (Table 2).
The distribution of group II GH3 genes on chromosomes was not uniform. Chr_05 had three GH3 genes (BpGH3.1a, BpGH3.1a, BpGH3.1a), which were located very close to each other (Figure 8). Five group II GH3 genes (BpGH3.3, BpGH3.4, BpGH3.2, BpGH3.9, and BpGH3.5) were distributed on chromosomes Chr_01, Chr_02, Chr_03, Chr_04 and Chr_12. The BpGH3.7 gene was not mapped to any chromosome. The number of exons in B.pendula group II GH3 genes varied from two to eight (Figure 9).

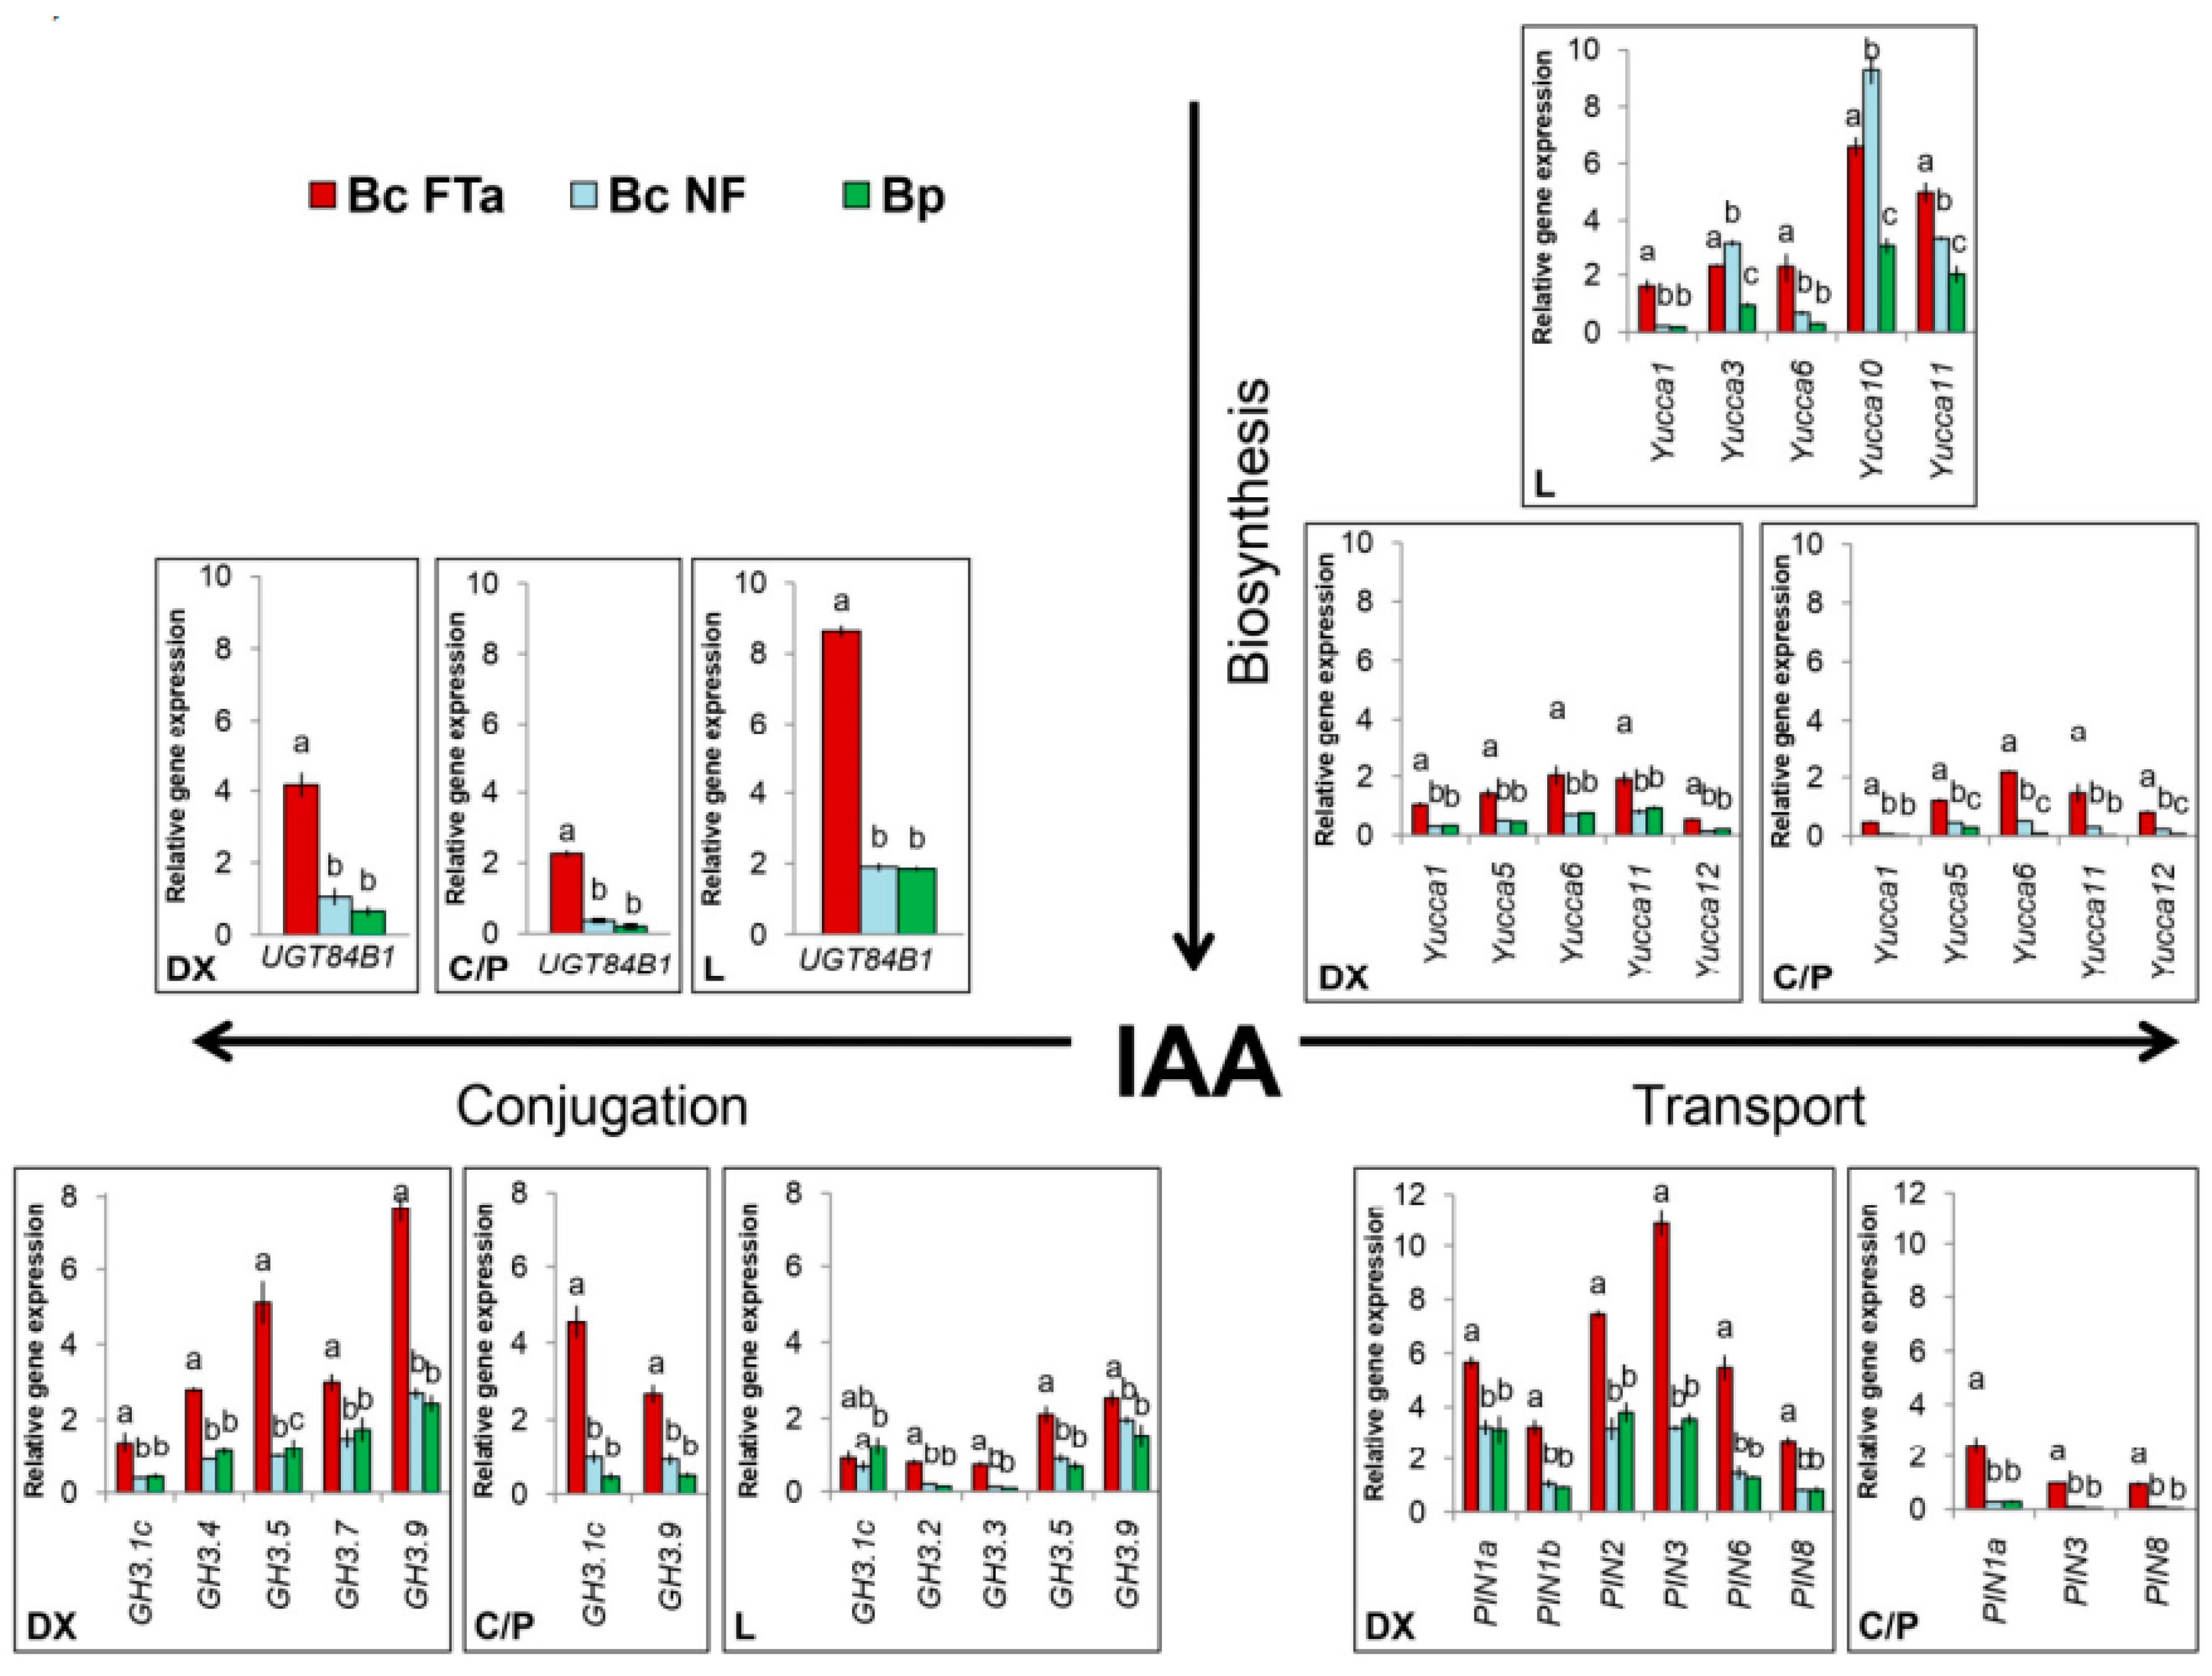
2.3. Expression of the Genes Involved in Auxin Biosynthesis, Transport and Conjugation

We investigated the expression of eight Yucca genes and nine GH3 genes identified within this study, as well as six PIN genes and two UGT genes identified in the silver birch genome previously [69]. The analysis revealed no expression of the Bpev01.c0015cg0065 gene coding for one of the two putative IAA–glucose synthases in any of the studied tissues. Data on the expression of all the genes selected for this study are shown in Supplementary Figure S1.
According to the results, the expression levels of all the Yucca family genes, one of the two UGT genes and five group II GH3 genes in leaves varied among groups of birch trees with different wood structures (Figure 10). Four group II GH3 genes (BpGH3a, BpGH3b, BpGH3.4 and BpGH3.7) were not expressed in leaves of Bp trees but had low activity in leaves of Bc NF and Bc FT trees (Supplementary Figure S1). The activity of PIN family genes in leaves was not determined in our study.
In trunk tissues of the sampled trees, all the genes of interest were active except for one of the two UGT genes. A comparison of the relative expression levels of the genes in birch trees’ organs and tissues in different xylogenesis scenarios revealed that figured wood formation in Karelian birch is accompanied by a higher activity of a majority of the genes in trunk tissues, both in the differentiating xylem layer and in the layer comprising cambium and conducting phloem (Figure 10).
Additionally, differentiated xylem from non-figured trunk areas (Bc FTn parts) was sampled from two Bc FT trees. Analysis revealed significant differences in the expression of some genes between figured and non-figured parts of the same trunk, suggesting that the activity of these genes is probably regulated locally (Figure 11).

2.4. Analysis of Promoters

Two sets of genes associated with figured wood formation in Karelian birch were selected for further analysis. Set 1 was made up of nine genes whose expression in Bc FTa parts was more than twofold higher than in Bc FTn parts of the same trunks. Set 2 was made up of 15 genes whose expression in Bc FTa parts was more than 2.5-fold higher than in the tissues of Bc NF trees (Table 3).
To gain further insights into the regulation of figured wood formation, we analysed the promoter regions of the genes included in Set 1 and Set 2 to identify transcription factor binding sites (TFBS). Analysis of the TFBS overrepresented compared to promoters in A. thaliana and P. trichocarpa revealed, respectively, 89 and 62 TFBS in gene promoters from Set 1. The greatest number of the predicted transcription factors (TFs) belonged to the families DOF, TCP and bZIP (Figure 12). For promoters of Set 2 genes, we revealed 168 and 126 TFBS were overrepresented compared to promoters in A. thaliana and P. trichocarpa, respectively. Promoters of Set 2 genes were found to have many binding sites for TFs of the families NAC, DOF and bZIP (Figure 12). The full list of predicted TFBS is provided in Supplementary Table S1.

3. Discussion

3.1. Yucca and GH3 Gene Families in the Silver Birch Genome

This paper gives a first description of the phylogenetic relationships, chromosomal localisation and structure of Yucca and GH3 family genes in B. pendula, as well as the proteins they code for.
Bioinformatic analysis revealed eight Yucca members in the genome of B. pendula, which is comparable to the number of Yucca genes in other woody plant genomes [12,13,14,17]. Yucca genes of birch were located on five chromosomes and contained from three to 10 exons. The structure of a majority of B. pendula proteins encoded by Yucca family genes, with the exception of BpYucca11, coincided with that of Yucca proteins in other higher plants. The sequence of the BpYucca11-encoding Bpev01.c0363.g0023.m0001 gene should probably be analysed in more detail.
Twelve GH3 members were identified in the genome of B. pendula, which is comparable with the number of genes of this family in other woody plant genomes [40,41,43,82]. Of the twelve GH3 family genes, two were classified as belonging to group I GH3s, which performs the conjugation of jasmonic acid and salicylic acid, while nine were group II GH3s genes, which are involved in auxin conjugation [80,81]. One gene appears to belong to group IV GH3s, recently identified in woody plants, whose function is yet unknown [82]. As this paper is dedicated to auxin homeostasis patterns, nine genes coding for group II GH3 were selected for further analysis. Group II GH3 genes in birch were located on six chromosomes and one contig, and contained between two and eight exons. Although three genes encoding proteins homologous to A. thaliana and P. trichocarpa GH3.1 proteins were closely localised on the same chromosome, analysis showed that the structure of these genes varied significantly.
The results for the Yucca and GH3 members identified in the genome of B. pendula provide the basis for further studies of auxin-related genes in non-model woody plants.

3.2. Conducting Tissue Structure in Karelian Birch Trunk Indicates a Reduced Free Auxin Level

The process of xylem vessel differentiation is believed to be the most sensitive to the level of free (physiologically active) auxin [23,26,83]. Numerous experiments with woody plant shoots and transgenic plants have demonstrated that the density of vessels in the xylem decreases where the auxin concentration is low [84,85,86,87,88,89,90]. Moreover, there is some evidence indicating that the differentiation of phloem sieve elements is induced by auxin, albeit in lower concentrations when compared with xylem vessel differentiation [5,26].
It has previously been demonstrated that, after many years of figured wood formation in adult Karelian birch trees (25–30-year-old), the vessel density in the anomaly areas is much lower than in the wood of common silver birch, while, in non-figured parts, vessel density is slightly lower [58,59,69]. Analysis of auxin content revealed a reduction in the concentration of free auxin and a rise in the concentration of auxin conjugates in the areas of anomalies [64], thus supporting the evidence that the development of anomalous conducting tissues in Karelian birch trunks is closely associated with auxin inactivation.
For the current study younger, 13–14-year-old common silver birch and Karelian birch trees were selected. One of the earliest signs of wood figure expression, as revealed by microscopic analysis, is the disruption of the formation of highly specialised conducting elements in the xylem and phloem—vessels and sieve tubes. Thus, conducting tissues in anomaly areas in Karelian birch trunks sampled for molecular genetic analysis show traits of an auxin-deficient phenotype.

3.3. Expression of the Main Genes Involved in Auxin Biosynthesis, Transport and Conjugation during the Formation of Wood Typical of Birch Species

The expression level of Yucca, PIN, UGT and GH3 genes varied among organs and tissues of the trees forming straight-grained wood typical of birch (Bp trees and Bc NF trees). A majority of Yucca genes were more active in leaves compared to trunk tissues, which is in good agreement with data from the literature arguing that the main localisation of auxin biosynthesis is leaves and shoot apexes [1,9,26], as well as with data on Yucca expression in the organs of other woody plants [12,17]. Among genes of this family, the expression level of BpYucca5, BpYucca6 and BpYucca11 was the highest in trunk tissues, potentially suggesting that these genes may be involved in the generation of local auxin gradients in the cambial zone [18,53].
The expression level of PIN family genes in trees forming normally structured wood was higher on the differentiating xylem side compared to the tissue layer comprising the cambial zone and the conducting phloem. Some studies have demonstrated that polar auxin transport is mainly channelled via cambial zone cells and the nearby differentiating derivatives [91,92], which agrees with the expression of the genes encoding “long” PIN proteins [32,93,94]. Sampling in our study was done during active xylem differentiation, while the conducting phloem in the birch trunk would usually be already fully formed by this time [95], which is probably the reason for the higher activity of PINs on the differentiating xylem side. The highest expression level was demonstrated by three genes coding for “long” PIN proteins—BpPIN1a, BpPIN2 and BpPIN3.
Interestingly, the available data indicate that, in normally growing and developing woody plants, the activity of the genes coding for the main auxin conjugation enzymes differs in leaves and in trunk tissues. Thus, auxin inactivation in leaves primarily results in the formation of IAA–glucose conjugate, whereas higher activity in trunk tissues is demonstrated by GH3 genes encoding IAA–amino synthases. To the best of our knowledge, there has been no comparative study of the expression profiles of the genes involved in auxin conjugation with sugar and amino acids in different organs of adult woody plants before. It has been shown for rice, however, that the OsIAGT1 gene encoding IAA–glucose synthase is the most active in mature leaves compared to other plant parts, whereas the expression of some GH3 family genes can differ significantly between leaves and the shoot [48,96]. We suppose these differences in the activity of the genes encoding auxin conjugation enzymes to be associated with the different functions of ester and amide conjugates.

3.4. Specific Traits of Expression of the Genes in Question during Figured Wood Formation in Karelian Birch

It is in early development stages that Karelian birch saplings feature a more active carbohydrate metabolism compared to common silver birch [97,98]. It has been demonstrated for trees of different ages that figured wood formation in Karelian birch is associated with a rise in the amount of photoassimilates transported via the phloem and with high hexose influx to cells in the differentiating xylem [58,63,67,69]. It can thus be concluded that an altered metabolic status of differentiating trunk tissues is strong biochemical marker of abnormal xylogenesis. In view of the above, we believe the elevated activity of the genes involved in auxin biosynthesis, transport and conjugation in Bc FT trees may be due to the effect of sugars on gene expression. Soluble sugars are known to be able to transcriptionally regulate a significant number of auxin-related genes. In both herbaceous and woody plants, a rise in sugar (glucose, sucrose) level caused an upregulation of Yucca, PIN and GH3 genes [99,100,101,102,103,104,105].
Overexpression of Yucca genes in different species resulted in the elevation of IAA content and the production of auxin-overproduced phenotypes [17,18,106,107]. Although the background for figured wood formation is the elevated activity of auxin-biosynthesis genes, the structure of conducting tissues in figured-wood parts still demonstrated signs of an auxin-deficient phenotype. The expression of auxin-responsive genes (PIN, GH3) also being elevated in figured parts of Karelian birch trunks probably cannot be explained by a loss of auxin sensitivity by the tissues and impaired auxin signalling, although this assumption also needs to be tested experimentally.
In turn, overexpression of various GH3 genes was demonstrated to entail a reduction in free (physiologically active) auxin levels and the generation of auxin-deficient phenotypes [39], and to hinder the formation of the hormone’s gradient in the cambial zone [42]. A negative correlation between the expression of some GH3 genes and foliar IAA content was found in the closely related species B. platyphylla [43]. Transgenic A. thaliana and Oryza sativa plants overexpressing the IAA–glucose synthase gene simultaneously exhibited a reduction in free auxin level and morphological changes characteristic of auxin-deficient phenotypes [48,108,109]. Thus, overexpression of auxin conjugation coding genes GH3 and UGT84B1 appears to have a greater effect on figured wood formation in birch than overexpression of Yucca genes. The likely reason for that is differences in the kinetics of the enzymatic reactions of auxin biosynthesis and metabolisation. There is some evidence that Yucca flavin-dependent monooxygenases, which catalyse the rate-limiting step in IAA synthesis, have slow kinetics [110,111], whereas IAA–amino synthases encoded by genes of the family GH3 are described as enzymes with fast kinetics [80,112,113,114].
Auxin can be inactivated not only through its biochemical transformations, but also by localising it in the cell so that it can no longer perform its regulatory functions. Of much interest in this connection is the study of the role of so-called “short” PIN proteins in auxin inactivation and figured wood formation in Karelian birch. The BpPIN6 and BpPIN8 genes, classified previously as encoding “short” PIN proteins [69], were upregulated in the differentiating xylem of figured Karelian birch trees. “Short” PIN proteins are believed to be involved in auxin transport between the cytoplasm and ER; this process may have a role in maintaining the free auxin concentration in the cytoplasm [115,116,117]. It has been demonstrated for Arabidopsis and tobacco plants that PIN8 overexpression promotes the accumulation of free auxin and IAA–glucose conjugate in cells, at the same time preventing auxin-dependent activation of gene expression, presumably because the hormone is primarily accumulated in ER [118]. Overexpression of the gene encoding the “short” PIN5 protein led to a marked decline of free auxin in tissues and to accumulation of the amide conjugates IAA–Asp and IAA–Glu, as well as reduced auxin transport out of cells [119].
Figured wood formation was also accompanied by overexpression of the genes encoding “long” PIN proteins involved in intercellular auxin transport, pointing to activated auxin transport to other organs and tissues. The most significantly upregulated was the BpPIN3 gene, which is in agreement with previously obtained data on older Karelian birch trees [69]. PIN3 expression in woody plants’ shoots and trunk tissues is mainly observed in parenchyma cells in the bark periphery, as well as in xylem radial parenchyma [35,79,93,120], suggesting the PIN3 protein may be involved in auxin radial intercellular transport [92,121]. It has been hypothesised that overexpression of BpPIN3 may promote the emergence of various auxin transport directions through tissues in figured-wood parts of Karelian birch trunks [69]. However, it was shown that “long” PINs affected auxin distribution in tissues not only by modulating the expression of corresponding genes but also through the alteration of their localisation on the membrane [29,99,120]. Therefore, the study of changes in the localisation of PIN proteins during the formation of figured wood is of great interest for future research.
Based on the results obtained through this study and previously [63,64,65,66,67,68,69], the possible mechanism of hexose influence on the expression of auxin-related genes and figured wood formation in the trunks of Karelian birch trees has been summarised in a flowchart (Figure 13).
Differences in the expression of the investigated genes between Bc NF trees and Bc FT trees support the statement that figured wood formation in Karelian birch trees is tightly connected with sugar distribution between different tree organs, namely crown and trunk [63,98,122]. Bc NF trees had a higher expression of BpYucca3, BpYucca10 and BpYucca12 in leaves compared to Bp trees. Since PIN, UGT84B1 and GH3 expression in trunk tissues of Bc NF trees was much lower than in Bc FT trees and the same as in Bp trees, it is probable that sugar in this group of trees is mostly retained in the crown, and auxin biosynthesis is thus activated. The higher level of sugar and auxin in the crown of Bc NF trees must be the reason for the previously detected more active growth of leaves and shoots in this group of trees as opposed to Bp trees [123]. The active acceptors of assimilates in Bc FT trees are the differentiating trunk tissues [98,122], and the richest wood figure is formed at confluences of phloem flows, where photoassimilate concentrations are locally elevated [63,67]. In our study, a majority of Yucca and GH3 genes were overexpressed only in Bc FTa parts (i.e., in areas with elevated sugar content) but not in Bc FTn parts, suggesting that their expression is regulated locally rather than at the whole-plant level.

3.5. Identification of Transcription Factors Potentially Involved in Gene Expression Regulation during Figured Wood Formation in Karelian Birch

As it is known that the influence of sugars on gene expression could be mediated through the different sugar-responsive transcription factors [123,124,125,126], we conducted an analysis of overrepresented TFBS in promoters of genes whose expression was significantly upregulated during figured wood formation. Quite a few binding sites for TFs of the families NAC, DOF, TCP and bZIP, as well as some others, were identified. TFs belonging to the families NAC and DOF are important players in conducting tissue formation [127,128,129]. Some NAC and DOF TFs regulate the differentiation of specific types of xylem cells for fibres and vessels [130,131,132,133]. Binding sites for several fibre- and vessel-specific TFs were detected in promoters of genes belonging to Set1 and Set2. Moreover, in the DOF family there is a small group of mobile transcription factors—PEAR proteins—which are involved in radial growth regulation [134]. Binding sites of four out of six PEAR proteins (DOF3.2, DOF5.1, DOF5.6/HCA2, DOF2.4) were detected in promoters of genes from Set1 and Set2. Previously, binding sites of three PEAR proteins (DOF3.2, DOF5.1, DOF5.6/HCA2) were identified in promoters of the genes CWInv1-CWInv3 coding for cell wall invertase in silver birch, whose activity was also significantly elevated during figured wood formation in Karelian birch [135]. TCP TFs participate in regulating plant organs’ morphogenesis and translate various endogenous and exogenous signals into growth responses [136,137]. bZIP are a large group of TFs with functions in the differentiation of various organs and tissues and in the plant response to biotic and abiotic environmental factors [138].
Some TFs in the above families are involved in auxin signalling. It was demonstrated for P. tremula × tremuloides plants, for instance, that auxin downregulates NAC TFs associated with fibre differentiation and induced vessel-specific NACs [139]. Mutant A. thaliana Dof5.1-D plants overexpressing PEAR2/DOF5.1 have a reduced level of auxin biosynthesis and signalling compared to wild-type plants [140]. TCPs are known to modulate auxin synthesis, transport and response [141]. bZIP binding sites in promoters of auxin-responsive genes can participate in the fine tuning of their auxin-induced transcription [142,143,144]. Furthermore, DOF TFs and bZIP TFs participate in sugar signalling [126,145], so it would be interesting to study the potential involvement of these two families in regulating alternative xylogenesis scenarios. Nevertheless, notice should be given to the fact that the transcription factors identified in this work have multiple downstream targets and could regulate other hormone pathways as well.

4. Materials and Methods

4.1. Choice of Trees and Sampling

The trees selected for the study were common silver birch and Karelian birch specimens raised from seeds collected from controlled pollinated plus trees (Forelia OY, Häkkilä, Finland). The sample trees were 13–14 years old. They were all growing in the same soil and climatic conditions in one test plot in the KarRC RAS Agrobiological Station situated 2 km away from Petrozavodsk.
Trunk tissue and leaves were collected during the period of high cambial activity, early in July 2019, from three specimens of (1) common silver birch trees (B. pendula var. pendula), (2) Karelian birch trees with straight-grained non-figured wood (non-figured B. pendula var. carelica trees), and (3) Karelian birch trees with richly figured wood (figured B. pendula var. carelica trees). All the Karelian birch trees were high stemmed, without signs of stunted growth. In figured Karelian birch trees, tissues were collected from (a) trunk areas with figured wood (Bc FTa parts), and (b) trunk areas with non-figured wood (Bc FTn parts).
For trunk tissue sampling, rectangular bark pieces were cut out on the trunk with a sharp knife 130 cm above the ground, and carefully separated from wood. A thin layer of xylem tissue comprising the zone of cell expansion and differentiation was scraped off the exposed wood surface with a razor. A layer of tissues comprising the conducting phloem and the cambial zone was scraped off the inner surface of the bark. Samples were collected under the microscope control. The tissues were frozen in liquid nitrogen directly after sampling. Bark and wood samples for microscopic analysis were taken from the immediate vicinity of the previous samples. In this case, cubic blocks with 1 cm sides, containing 2–3 annual increments, were chiselled out of the trunk.

4.2. Microscopy

Sample preparation for microscopy was done as described previously [69]. Microscopic analysis was carried out under an AxioImager A1 light microscope (Karl Zeiss, Oberkochen, Germany) equipped with an ADF PRO03 camera. Images were processed with ADF Image Capture software (ADF Optics, Wuhan, China). Anatomical measurements were made following available guidelines [146,147,148].

4.3. Total RNA Isolation and Complementary DNA Synthesis

To isolate total RNA, a 50–100 mg aliquot of plant tissue was ground in liquid nitrogen. The isolation procedure was run using two lysis buffers (based on cetyl trimethylammonium bromide (CTAB) and sodium dodecylsulphate (SDS)) and chloroform-isoamyl alcohol mixture (24:1) according to the technique described in [149]. Tissue lysate was additionally treated with RNase inhibitor to prevent sample degradation and with DNase (Syntol, Moscow, Russia) to remove genomic DNA impurities. The tissue/buffer ratio was 1:10. The CTAB extraction buffer contained 100 mM Tris–HCl (pH 8.0); 25 mM EDTA, 2 M NaCl, 2% CTAB, 2% PVP, and 2% mercaptoethanol (added immediately before use); the SDS extraction buffer contained 10 mM Tris–HCl, 1 mM EDTA, 1 M NaCl, and 0.5% SDS.
RNA was precipitated by 100% isopropanol. RNA precipitate was dissolved in an adequate amount of RNase-free water. The integrity of the resultant RNA was tested by electrophoresis in 1% agarose gel. RNA concentration was measured spectrophotometrically (microplate reader SPECTROstar NANO, BMG Labtech, Ortenberg, Germany) through absorbance at 260 nm wavelength. The purity of the specimen was evaluated by the optical density ratio measured at 230, 260 and 280 nm (A260/A280 and A260/A230). The absence of genomic DNA impurities was verified by PCR with the RNA sample as the matrix.
cDNA was synthesised following manufacturer’s protocol using the reverse transcription reagent kit MMLV RT (Evrogen, Moscow, Russia) in 20 µL of reaction mixture containing 6 µL RNA matrix (1 µg), 1 µL Oligo(dT) primer and 1 µL random primer (Randoom (dN)10-primer) (20 µM), 1 µL reverse transcriptase (MMLV revertase) (100 units), 4 µL of 5x buffer for the first chain synthesis cDNA (280 mM Tris-HCl, pH 8.7; 37 5 mM KCl; 30 mM MgCl2), 2 µL dNTP mixture (10 mM of each), 2 µL DDT (20 mM), 3 µL sterile RNase-free water. The RT reaction was performed in a QuantStudio 5 amplifier (Thermo Scientific, Waltham, MA, USA).

4.4. Gene Search in the Silver Birch Genome

Previously, six PIN family genes and two genes coding for proteins homologous to IAA–glucose synthase in Arabidopsis have been identified in the silver birch genome [69].
The search for Yucca and GH3 genes was carried out using the published genome of Betula pendula Roth [150]. To this end, the CDS of Arabidopsis thaliana and Populus trichocarpa Yucca and GH3 genes and the amino acid sequences of corresponding proteins were obtained from The Arabidopsis Information Resource (TAIR) database (release 13, https://www.arabidopsis.org) and Phytozome database (http://www.phytozome.net/poplar, release v3.0), respectively. The resulting sequences were then used as a BLAST search query across the genome of B. pendula var. pendula (release 1.2, https://genomevolution.org/coge) to identify homologous sequences.
The structures of candidate proteins were predicted using the National Centre for Biotechnology Information (NCBI) resource (http://www.ncbi.nlm.nih.gov/Structure/cdd/cdd.shtml) [151]. Phylogenetic analysis was carried out using MEGA X software [152]. Multiple sequence alignment for the protein sequences was performed using ClustalW. Phylogenetic trees were constructed using the neighbour-joining method based on the Poisson correction model with 1000 bootstrap replicates [153,154,155]. The percent identity of B. pendula and A. thaliana proteins was determined using the EMBOSS Needle online tool (https://www.ebi.ac.uk/Tools/psa/emboss_needle/).
The chromosome locations of Yucca and GH3 family members in B. pendula (2n = 28) were investigated using MapChart software [156]. The gene structures were analysed using the Gene Structure Display Server (http://gsds.cbi.pku.edu.cn/) [157].

4.5. Determination of Gene Expression Levels (Real-Time qPCR)

Specific primers (Evrogen, Russia) for amplifying the target and reference genes were constructed using BeaconDesigner 8.21 software (PREMIER Biosoft) (Table 4). The reference genes for calculating the relative expression of the target genes were GAPDH and EF1a [158]. To make sure that the reaction yielded one product, the melting curve was analysed and electrophoresis of quantitative PCR products in 8% acrylamide gel with ethidium bromide staining was performed.
Samples were amplified in QuantStudio 5 amplifier (Thermo scientific, USA) using kits with SYBR Green (qPCRmix-HS SYBR) intercalating dye (Evrogen, Russia). Real-time PCR was run in 25 µL of reaction mixture containing 5 µL qPCRmix-HS SYBR, 1 µL of each of forward and reverse primers (0.4 µM) (Syntol, Russia), 2 µL cDNA matrix, and 16 µL of deionised nuclease-free water. The final cDNA content in the reaction medium for all samples was 100 ng, as recommended in manufacturer’s protocol. The PCR protocol was 95 °C for 5 min, then forty 15 s cycles at 95 °C for denaturation, 30 s at 55 °C for annealing, and 30 s at 72 °C for elongation. Negative control was applied for each pair of primers, i.e., PCR was run without cDNA matrix.
PCR product specificity was evaluated by analysing melting curves. To determine the efficiency (E), PCR was performed with each pair of primers after serial 10-fold cDNA dilutions (10−1, 10−2, 10−3, 10−4 and 10−5). Cycle threshold (Ct) values were determined by plotting calibration curves in Microsoft Office Excel based on correlation coefficients R and slope (k), which can be calculated from the calibration curves of Ct values for each gene. The efficiency of PCR amplification (E) was calculated by the formula
E = (10^(−1/k) − 1) × 100.
The expression of specific genes was represented in relative units (r.u.) normalised to the expression of the reference gene. Based on the expression levels of two reference genes (GAPDH and EF1a) the arithmetic mean Ct of the reference genes was calculated for each sample.
Relative quantification (RQ) of gene transcription followed the formula
RQ = E−ΔCt,
where E is PCR efficiency,
ΔCt = Ct (target gene) − Ct (arithmetic mean of the two reference genes).
The data produced by PCR were analysed using the Relative Expression Software Tool 2009 V.2.0.13 (REST 2009).
All assays were performed at the Core Facility of the Karelian Research Centre RAS.

4.6. Analysis of Promoters

The 2-Kbp upstream promoter sequences from the start codon (ATG) of all the studied genes were used for the analysis of cis-acting elements. To identify over-represented TFBS, the frequency of cis-acting elements occurrence was analysed and statistically estimated based on the occurrence of cis-acting elements in promoters of the model organisms A. thaliana and P. trichocarpa using the Regulation Prediction tool from PlantRegMap (http://plantregmap.cbi.pku.edu.cn/) [159].

5. Conclusions

We have identified the key genes involved in auxin biosynthesis, transport and conjugation in the Betula pendula Roth genome and investigated their expression in trunk tissues and leaves of adult birch trees with different anatomical structure of the wood (figured and non-figured trees of Karelian birch and common silver birch trees).
Figured wood formation in Karelian birch was accompanied by overexpression of the genes involved in auxin homeostasis, suggesting that this hormone is an important actor in the formation of conducting trunk tissues with abnormal structures in woody plants. In spite of the higher expression of the genes encoding auxin biosynthesis enzymes, conducting tissues in trunk parts with figured wood exhibited traits of an auxin-deficient phenotype, which agrees with evidence on reduced free auxin content in anomaly areas in Karelian birch trunk. The probable cause of the decline in physiologically active auxin is its inactivation through conjugation with sugars and amino acids, as well as deposition in intracellular compartments.
We identified many binding sites with various TFs in promoters of the genes whose expression was significantly upregulated during figured wood formation. Most of them belong to the NAC, DOF, TCP, and bZIP families.
Undoubtedly, the formation of figured wood in Karelian birch is determined by the combination of multiple processes. Nevertheless, the data obtained are consistent with the hypothesis suggested before that anomalous figured wood formation in Karelian birch may be associated with the sugar induction of auxin conjugation.

Supplementary Materials

The following are available online at https://www.mdpi.com/2223-7747/9/11/1406/s1, Figure S1: Relative gene expression of all Yucca, PIN, GH3, and UGT family genes, Table S1: List of enriched TFs in the input gene lists of Set 1 and Set 2.

Author Contributions

Formal analysis, T.V.T., N.A.G., Y.L.M., K.M.N., N.N.N., I.N.S., D.S.I. and L.I.S.; funding acquisition, L.L.N.; investigation, T.V.T. and L.L.N.; visualization, L.I.S.; writing—original draft, T.V.T., L.L.N. and N.A.G.; writing—review and editing, T.V.T. and N.A.G. All authors have read and agreed to the published version of the manuscript.

Funding

This study was funded by the Russian Foundation for Basic Research, grant N 19-04-00622_a; the anatomical studies were carried out under state orders to the Karelian Research Centre of the Russian Academy of Sciences (Forest Research Institute KarRC RAS).

Conflicts of Interest

The authors declare no conflict of interest.

References

  1. Sundberg, B.; Uggla, C.; Tuominen, H. Cambial growth and auxin gradients. In Cell and Molecular Biology of Wood Formation; Savidge, R.A., Barnett, J.R., Napier, R., Eds.; BIOS Scientific Publishers Limited: Oxford, UK, 2000; pp. 169–188. [Google Scholar]
  2. Savidge, R.A. Intrinsic regulation of cambial growth. J. Plant Growth Regul. 2001, 20, 52–77. [Google Scholar] [CrossRef]
  3. Uggla, C.; Magel, E.; Moritz, T.; Sundberg, B. Function and dynamics of auxin and carbohydrates during earlywood/latewood transition in scots pine. Plant Physiol. 2001, 125, 2029–2039. [Google Scholar] [CrossRef] [PubMed] [Green Version]
  4. Nilsson, J.; Karlberg, A.; Antti, H.; Lopez-Vernaza, M.; Mellerowicz, E.; Perrot-Rechenmann, C.; Sandberg, G.; Bhalerao, R.P. Dissecting the molecular basis of the regulation of wood formation by auxin in hybrid aspen. Plant Cell 2008, 20, 843–855. [Google Scholar] [CrossRef] [PubMed] [Green Version]
  5. Aloni, R. The induction of vascular tissues by auxin. In Plant Hormones. Biosynthesis, Signal Transduction, Action! Davis, P.J., Ed.; Springer: Dordrecht, The Netherlands, 2010; pp. 485–518. [Google Scholar]
  6. Sorce, C.; Giovannelli, A.; Sebastiani, L.; Anfodillo, T. Hormonal signals involved in the regulation of cambial activity, xylogenesis and vessel patterning in trees. Plant Cell Rep. 2013, 32, 885–898. [Google Scholar] [CrossRef]
  7. Camargo, E.L.O.; Ployet, R.; Cassan-Wang, H.; Mounet, F.; Grima-Pettenati, J. Digging in wood: New insights in the regulation of wood formation in tree species. In Molecular Physiology and Biotechnology of Trees; Cánovas, F.M., Ed.; Academic Press: London, UK, 2019; Volume 89, pp. 201–233. [Google Scholar]
  8. Buttò, V.; Deslauriers, A.; Rossi, S.; Rozenberg, P.; Shishov, V.; Morin, H. The role of plant hormones in tree-ring formation. Trees 2020, 34, 315–335. [Google Scholar] [CrossRef]
  9. Woodward, A.W.; Bartel, B. Auxin: Regulation, action, and interaction. Ann. Bot. 2005, 95, 707–735. [Google Scholar] [CrossRef] [Green Version]
  10. Normanly, J. Approaching cellular and molecular resolution of auxin biosynthesis and metabolism. Cold Spring Harb. Perspect. Biol. 2010, 2, a001594. [Google Scholar] [CrossRef]
  11. Ljung, K. Auxin metabolism and homeostasis during plant development. Development 2013, 140, 943–950. [Google Scholar] [CrossRef] [Green Version]
  12. Ye, X.; Kang, B.; Osburn, L.D.; Li, Y.; Zong-Ming, C. Identification of the flavin-dependent monooxygenase-encoding YUCCA gene family in Populus trichocarpa and their expression in vegetative tissues and in response to hormone and environmental stresses. Plant Cell Tissue Organ Cult. 2009, 97, 271–283. [Google Scholar] [CrossRef]
  13. Böttcher, C.; Burbidge, C.A.; Boss, P.K.; Davies, C. Interactions between ethylene and auxin are crucial to the control of grape (Vitis vinifera L.) berry ripening. BMC Plant Biol. 2013, 13, 222. [Google Scholar] [CrossRef] [Green Version]
  14. Pan, L.; Zeng, W.; Niu, L.; Lu, Z.; Liu, H.; Cui, G.; Zhu, Y.; Chu, J.; Li, W.; Fang, W.; et al. PpYUC11, a strong candidate gene for the stony hard phenotype in peach (Prunus persica L. Batsch), participates in IAA biosynthesis during fruit ripening. J. Exp. Bot. 2015, 66, 7031–7044. [Google Scholar] [CrossRef] [PubMed] [Green Version]
  15. Ruedell, C.M.; de Almeida, M.R.; Fett-Neto, A.G. Concerted transcription of auxin and carbohydrate homeostasis-related genes underlies improved adventitious rooting of microcuttings derived from far-red treated Eucalyptus globulus Labill mother plants. Plant Physiol. Biochem. 2015, 97, 11–19. [Google Scholar] [CrossRef]
  16. Song, C.; Zhang, D.; Zhang, J.; Zheng, L.; Zhao, C.; Ma, J.; An, N.; Han, M. Expression analysis of key auxin synthesis, transport, and metabolism genes in different young dwarfing apple trees. Acta Physiol. Plant. 2016, 38, 43. [Google Scholar] [CrossRef]
  17. Song, C.; Zhang, D.; Zheng, L.; Shen, Y.; Zuo, X.; Mao, J.; Meng, Y.; Wu, H.; Zhang, Y.; Liu, X.; et al. Genome-wide identification and expression profiling of the YUCCA gene family in Malus domestica. Sci. Rep. 2020, 10, 10866. [Google Scholar] [CrossRef]
  18. Zhao, Y. Auxin biosynthesis. Arab. Book 2014, 12, e0173. [Google Scholar] [CrossRef] [PubMed] [Green Version]
  19. Robert, H.S.; Grones, P.; Stepanova, A.N.; Robles, L.M.; Lokerse, A.S.; Alonso, J.M.; Weijers, D.; Friml, J. Local auxin sources orient the apical-basal axis in Arabidopsis embryos. Curr. Biol. 2013, 23, 2506–2512. [Google Scholar] [CrossRef] [Green Version]
  20. Brumos, J.; Robles, L.M.; Yun, J.; Vu, T.C.; Jackson, S.; Alonso, J.M.; Stepanova, A.N. Local auxin biosynthesis is a key regulator of plant development. Dev. Cell 2018, 47, 306–318.e5. [Google Scholar] [CrossRef] [Green Version]
  21. Sachs, T.; Cohen, D. Circular vessels and the control of vascular differentiation in plants. Differentiation 1982, 21, 22–26. [Google Scholar] [CrossRef]
  22. Kurczyńska, E.U. Vessel differentiation in isolated stem segments of Fraxinus excelsior L. after treatment with auxin. Acta Soc. Bot. Pol. 1992, 61, 343–357. [Google Scholar] [CrossRef] [Green Version]
  23. Sachs, T. Integrating cellular and organismic aspects of vascular differentiation. Plant Cell Physiol. 2000, 41, 649–656. [Google Scholar] [CrossRef]
  24. Junghans, U.; Langenfeld-Heyser, R.; Polle, A.; Teichmann, T. Effect of auxin transport inhibitors and ethylene on the wood anatomy of poplar. Plant Biol. 2004, 6, 22–29. [Google Scholar] [CrossRef]
  25. Drazeta, L.; Lang, A.; Cappellini, C.; Hall, A.J.; Volz, R.K.; Jameson, P.E. Vessel differentiation in the pedicel of apple and the effects of auxin transport inhibition. Physiol. Plant. 2004, 120, 162–170. [Google Scholar] [CrossRef] [PubMed]
  26. Aloni, R. Ecophysiological implications of vascular differentiation and plant evolution. Trees 2015, 29, 1–16. [Google Scholar] [CrossRef]
  27. Mazur, E.; Benková, E.; Friml, J. Vascular cambium regeneration and vessel formation in wounded inflorescence stems of Arabidopsis. Sci. Rep. 2016, 6, 33754. [Google Scholar] [CrossRef] [PubMed]
  28. Johnson, D.; Eckart, P.; Alsamadisi, N.; Noble, H.; Martin, C.; Spicer, R. Polar auxin transport is implicated in vessel differentiation and spatial patterning during secondary growth in Populus. Am. J. Bot. 2018, 105, 1–11. [Google Scholar] [CrossRef] [Green Version]
  29. Wisniewska, J.; Xu, J.; Seifertová, D.; Brewer, P.B.; Růžička, K.; Blilou, I.; Rouquié, D.; Benková, E.; Scheres, B.; Friml, J. Polar PIN localization directs auxin flow in plants. Science 2006, 312, 883. [Google Scholar] [CrossRef] [Green Version]
  30. Křeček, P.; Skůpa, P.; Libus, J.; Naramoto, S.; Tejos, R.; Friml, J.; Zažímalová, E. The PIN-FORMED (PIN) protein family of auxin transporters. Genome Biol. 2009, 10, 249. [Google Scholar] [CrossRef] [Green Version]
  31. Zwiewka, M.; Bilanovičová, V.; Seifu, Y.W.; Nodzyński, T. The nuts and bolts of PIN auxin efflux carriers. Front. Plant Sci. 2019, 10, 985. [Google Scholar] [CrossRef] [Green Version]
  32. Liu, B.; Zhang, J.; Wang, L.; Li, J.; Zheng, H.; Chen, J.; Lu, M. A survey of Populus PIN-FORMED family genes reveals their diversified expression patterns. J. Exp. Bot. 2014, 65, 2437–2448. [Google Scholar] [CrossRef]
  33. Simon, S.; Skůpa, P.; Viaene, T.; Zwiewka, M.; Tejos, R.; Klíma, P.; Čarná, M.; Rolčík, J.; De Rycke, R.; Moreno, I.; et al. PIN6 auxin transporter at endoplasmic reticulum and plasma membrane mediates auxin homeostasis and organogenesis in Arabidopsis. New Phytol. 2016, 211, 65–74. [Google Scholar] [CrossRef]
  34. Palovaara, J.; Hallberg, H.; Stasolla, C.; Luit, B.; Hakman, I. Expression of a gymnosperm PIN homologous gene correlates with auxin immunolocalization pattern at cotyledon formation and in demarcation of the procambium during Picea abies somatic embryo development and in seedling tissues. Tree Physiol. 2010, 30, 479–489. [Google Scholar] [CrossRef] [PubMed] [Green Version]
  35. Carraro, N.; Tisdale-Orr, T.E.; Clouse, R.M.; Knöller, A.S.; Spicer, R. Diversification and expression of the PIN, AUX/LAX, and ABCB families of putative auxin transporters in Populus. Front. Plant Sci. 2012, 3, 1–17. [Google Scholar] [CrossRef] [PubMed] [Green Version]
  36. Kühn, N.; Serrano, A.; Abello, C.; Arce, A.; Espinoza, C.; Gouthu, S.; Deluc, L.; Arce-Johnson, P. Regulation of polar auxin transport in grapevine fruitlets (Vitis vinifera L.) and the proposed role of auxin homeostasis during fruit abscission. BMC Plant Biol. 2016, 16. [Google Scholar] [CrossRef] [Green Version]
  37. Salazar, R.; Pollmann, S.; Morales-Quintana, L.; Herrera, R.; Caparrós-Ruiz, D.; Ramos, P. In seedlings of Pinus radiata, jasmonic acid and auxin are differentially distributed on opposite sides of tilted stems affecting lignin monomer biosynthesis and composition. Plant Physiol. Biochem. 2019, 135, 215–223. [Google Scholar] [CrossRef]
  38. Qi, L.; Chen, L.; Wang, C.; Zhang, S.; Yang, Y.; Liu, J.; Li, D.; Song, J.; Wang, R. Characterization of the auxin efflux transporter PIN proteins in pear. Plants 2020, 9, 349. [Google Scholar] [CrossRef] [Green Version]
  39. Ludwig-Müller, J. Auxin conjugates: Their role for plant development and in the evolution of land plants. J. Exp. Bot. 2011, 62, 1757–1773. [Google Scholar] [CrossRef] [Green Version]
  40. Okrent, R.A.; Wildermuth, M.C. Evolutionary history of the GH3 family of acyl adenylases in rosids. Plant Mol. Biol. 2011, 76, 489–505. [Google Scholar] [CrossRef]
  41. Yuan, H.; Zhao, K.; Lei, H.; Shen, X.; Liu, Y.; Liao, X.; Li, T. Genome-wide analysis of the GH3 family in apple (Malus × domestica). BMC Genom. 2013, 14, 297. [Google Scholar] [CrossRef] [Green Version]
  42. Vielba, J.M.; Varas, E.; Rico, S.; Covelo, P.; Sánchez, C. Auxin-mediated expression of a GH3 gene in relation to ontogenic state in chestnut. Trees 2016, 30, 2237–2252. [Google Scholar] [CrossRef]
  43. Zhang, R.; Wang, Y.; Wang, C.; Wei, Z.; Xia, D.; Wang, Y.; Liu, G.; Yang, C. Time-course analysis of levels of indole-3-acetic acid and expression of auxin-responsive GH3 genes in Betula platyphylla. Plant Mol. Biol. Report. 2011, 29, 898–905. [Google Scholar] [CrossRef]
  44. Brunoni, F.; Collani, S.; Casanova-Sáez, R.; Šimura, J.; Karady, M.; Schmid, M.; Ljung, K.; Bellini, C. Conifers exhibit a characteristic inactivation of auxin to maintain tissue homeostasis. New Phytol. 2020, 226, 1753–1765. [Google Scholar] [CrossRef] [PubMed] [Green Version]
  45. Zhang, L.; Lan, Q.; Han, S.; Qi, L. A GH3-like gene, LaGH3, isolated from hybrid larch (Larix leptolepis × Larix olgensis) is regulated by auxin and abscisic acid during somatic embryogenesis. Trees 2019, 33, 1723–1732. [Google Scholar] [CrossRef]
  46. Szerszen, J.; Szczyglowski, K.; Bandurski, R. iaglu, a gene from Zea mays involved in conjugation of growth hormone indole-3-acetic acid. Science 1994, 265, 1699. [Google Scholar] [CrossRef] [PubMed]
  47. Jackson, R.G.; Lim, E.-K.; Li, Y.; Kowalczyk, M.; Sandberg, G.; Hoggett, J.; Ashford, D.A.; Bowles, D.J. Identification and biochemical characterization of an Arabidopsis indole-3-acetic acid glucosyltransferase. J. Biol. Chem. 2001, 276, 4350–4356. [Google Scholar] [CrossRef] [Green Version]
  48. Liu, Q.; Chen, T.-T.; Xiao, D.-W.; Zhao, S.-M.; Lin, J.-S.; Wang, T.; Li, Y.-J.; Hou, B.-K. OsIAGT1 is a glucosyltransferase gene involved in the glucose conjugation of auxins in rice. Rice 2019, 12, 92. [Google Scholar] [CrossRef] [Green Version]
  49. Bajguz, A.; Piotrowska, A. Conjugates of auxin and cytokinin. Phytochemistry 2009, 70, 957–969. [Google Scholar] [CrossRef]
  50. Nowacki, J.; Bandurski, R.S. Myo-inositol esters of indole-3-acetic acid as seed auxin precursors of Zea mays L. Plant Physiol. 1980, 65, 422–427. [Google Scholar] [CrossRef] [Green Version]
  51. Staswick, P.E. The tryptophan conjugates of jasmonic and indole-3-acetic acids are endogenous auxin inhibitors. Plant Physiol. 2009, 150, 1310–1321. [Google Scholar] [CrossRef] [Green Version]
  52. Zhang, J.; Gao, G.; Chen, J.-J.; Taylor, G.; Cui, K.-M.; He, X.-Q. Molecular features of secondary vascular tissue regeneration after bark girdling in Populus. New Phytol. 2011, 192, 869–884. [Google Scholar] [CrossRef]
  53. Immanen, J.; Nieminen, K.; Smolander, O.-P.; Kojima, M.; Alonso Serra, J.; Koskinen, P.; Zhang, J.; Elo, A.; Mähönen, A.P.; Street, N.; et al. Cytokinin and auxin display distinct but interconnected distribution and signaling profiles to stimulate cambial activity. Curr. Biol. 2016, 26, 1990–1997. [Google Scholar] [CrossRef] [Green Version]
  54. Environment Directorate. Consensus Document on the Biology of European white Birch (Betula Pendula Roth); Organisation for Economic Co-operation and Development: Paris, France, 2003. [Google Scholar]
  55. Hynynen, J.; Niemisto, P.; Vihera-Aarnio, A.; Brunner, A.; Hein, S.; Velling, P. Silviculture of birch (Betula pendula Roth and Betula pubescens Ehrh.) in northern Europe. Forestry 2009, 83, 103–119. [Google Scholar] [CrossRef]
  56. Velling, P.; Vihera-Aarnio, A.; Hagqvist, R.; Lehto, J. Valuable wood as a result of abnormal cambial activity—The case of Betula pendula var. carelica. In Cell and Molecular Biology of Wood Formation; Savidge, R.A., Barnett, J.R., Napier, R., Eds.; BIOS Scientific Publishers Limited: Oxford, UK, 2000; pp. 377–386. [Google Scholar]
  57. Hagqvist, R.; Mikkola, A. Visakoivun Kasvatus Ja Käyttö; Metsäkustannus & Visaseurary: Hämeenlinna, Finland, 2008. [Google Scholar]
  58. Novitskaya, L.; Nikolaeva, N.; Tarelkina, T. Endogenous variability of the figured wood of Karelian birch. Wulfenia 2016, 23, 175–188. [Google Scholar]
  59. Lyubavskaya, A.Y. Karelian Birch; Moscow State Forest University: Moscow, Russia, 1978. [Google Scholar]
  60. Yermakov, V.I. Mechanisms of Adaptation of Birch in the North; Science: Leningrad, Russia, 1986. [Google Scholar]
  61. Yevdokimov, A.P. Karelian Birch Biology and Cultivation; Publishing House of the Leningrad University: Leningrad, Russia, 1989. [Google Scholar]
  62. Paganova, V. Analysis of inheritance and growth of curly birch progenies from controlled hybridisation and possibilities of their utilisation for timber production in agricultural landscape. Czech J. Genet. Plant Breed. 2004, 40, 51–62. [Google Scholar] [CrossRef] [Green Version]
  63. Novitskaya, L.; Nikolaeva, N.; Galibina, N.; Tarelkina, T.; Semenova, L. The greatest density of parenchyma inclusions in Karelian birch wood occurs at confluences of phloem flows. Silva Fenn. 2016, 50, 1461–1478. [Google Scholar] [CrossRef] [Green Version]
  64. Shchetinkin, S.V. Histogenesis of Figured Wood in Birch (Betula pendula Roth var. carelica Merkl. and Betula pendula Roth). Ph.D. Thesis, Voronezh State University, Voronezh, Russia, 1987. [Google Scholar]
  65. Novitskaya, L.L.; Kushnir, F.V. The role of sucrose in regulation of trunk tissue development in Betula pendula Roth. J. Plant Growth Regul. 2006, 25, 18–29. [Google Scholar] [CrossRef]
  66. Galibina, N.A.; Novitskaya, L.L.; Krasavina, M.S.; Moshchenskaya, Y.L. Activity of sucrose synthase in trunk tissues of Karelian birch during cambial growth. Russ. J. Plant Physiol. 2015, 62, 381–389. [Google Scholar] [CrossRef]
  67. Galibina, N.A.; Novitskaya, L.L.; Nikerova, K.M.; Moshchenskaya, Y.L.; Borodina, M.N.; Sofronova, I.N. Apoplastic invertase activity regulation in the cambial zone of karelian birch. Russ. J. Dev. Biol. 2019, 50, 20–29. [Google Scholar] [CrossRef]
  68. Galibina, N.A.; Novitskaya, L.L.; Krasavina, M.S.; Moshchenskaya, J.L. Invertase activity in trunk tissues of Karelian birch. Russ. J. Plant Physiol. 2015, 62, 753–760. [Google Scholar] [CrossRef]
  69. Novitskaya, L.L.; Tarelkina, T.V.; Galibina, N.A.; Moshchenskaya, Y.L.; Nikolaeva, N.N.; Nikerova, K.M.; Podgornaya, M.N.; Sofronova, I.N.; Semenova, L.I. The formation of structural abnormalities in Karelian birch wood is associated with auxin inactivation and disrupted basipetal auxin transport. J. Plant Growth Regul. 2020, 39, 378–394. [Google Scholar] [CrossRef]
  70. Zajączkowski, S.; Wodzicki, T.J. Auxin and plant morphogenesis—A model of regulation. Acta Soc. Bot. Pol. 1978, 47, 233–243. [Google Scholar] [CrossRef] [Green Version]
  71. Zajączkowski, S.; Wodzicki, T.J. On the question of stem polarity with respect to auxin transport. Physiol. Plant. 1978, 44, 122–126. [Google Scholar] [CrossRef]
  72. Savidge, R.A. The role of plant hormones in higher plant cellular differentiation. II. Experiments with the vascular cambium, and sclereid and tracheid differentiation in the pine, Pinus contorta. Histochem. J. 1983, 15, 447–466. [Google Scholar] [CrossRef]
  73. Zagórska-Marek, B.; Little, C.H.A. Control of fusiform initial orientation in the vascular cambium of Abies balsamea stems by indol-3-ylacetic acid. Can. J. Bot. 1986, 64, 1120–1128. [Google Scholar] [CrossRef]
  74. Kramer, E.M. Wood grain pattern formation: A brief review. J. Plant Growth Regul. 2006, 25, 290–301. [Google Scholar] [CrossRef]
  75. Nikerova, K.M.; Galibina, N.A.; Sinkevich, S.M.; Borodina, M.N.; Sofronova, I.N. The alternative ways of sucrose utilization in Scots pine (Pinus sylvestris L.) spiral grain trees. Unpublished; Manuscript in Preparation.
  76. Eveland, A.L.; Jackson, D.P. Sugars, signalling, and plant development. J. Exp. Bot. 2012, 63, 3367–3377. [Google Scholar] [CrossRef] [PubMed] [Green Version]
  77. Wang, L.; Ruan, Y.-L. Regulation of cell division and expansion by sugar and auxin signaling. Front. Plant Sci. 2013, 4, 163. [Google Scholar] [CrossRef] [PubMed] [Green Version]
  78. Cho, H.; Dang, T.V.T.; Hwang, I. Emergence of plant vascular system: Roles of hormonal and non-hormonal regulatory networks. Curr. Opin. Plant Biol. 2017, 35, 91–97. [Google Scholar] [CrossRef] [PubMed]
  79. Alonso-Serra, J.; Safronov, O.; Lim, K.; Fraser-Miller, S.J.; Blokhina, O.B.; Campilho, A.; Chong, S.; Fagerstedt, K.; Haavikko, R.; Helariutta, Y.; et al. Tissue-specific study across the stem reveals the chemistry and transcriptome dynamics of birch bark. New Phytol. 2019, 222, 1816–1831. [Google Scholar] [CrossRef]
  80. Staswick, P.E.; Serban, B.; Rowe, M.; Tiryaki, I.; Maldonado, M.T.; Maldonado, M.C.; Suza, W. Characterization of an Arabidopsis enzyme family that conjugates amino acids to indole-3-acetic acid. Plant Cell 2005, 17, 616. [Google Scholar] [CrossRef] [Green Version]
  81. Staswick, P.E.; Tiryaki, I.; Rowe, M.L. Jasmonate Response Locus JAR1 and several related Arabidopsis genes encode enzymes of the firefly luciferase superfamily that show activity on jasmonic, salicylic, and indole-3-acetic acids in an assay for adenylation. Plant Cell 2002, 14, 1405–1415. [Google Scholar] [CrossRef] [Green Version]
  82. Vielba, J.M. Identification and initial characterization of a new subgroup in the GH3 gene family in woody plants. J. Plant Biochem. Biotechnol. 2019, 28, 280–290. [Google Scholar] [CrossRef]
  83. Mazur, E.; Friml, J. Vascular tissue development and regeneration in the model plant Arabidopsis. In Plant Engineering; Jurić, S., Ed.; InTech: Rijeka, Croatia, 2017; ISBN 978-953-51-3607-1. [Google Scholar]
  84. Doley, D.; Leyton, L. Effects of growth regulating substances and water potential on the development of secondary xylem in Fraxinus. New Phytol. 1968, 67, 579–594. [Google Scholar] [CrossRef]
  85. Aloni, R.; Zimmermann, M.H. The control of vessel size and density along the plant axis—A new hypothesis. Differentiation 1983, 24, 203–208. [Google Scholar] [CrossRef]
  86. Zakrzewski, J. Hormonal control of cambial activity and vessel differentiation in Quercus robur. Physiol. Plant. 1983, 57, 537–542. [Google Scholar] [CrossRef]
  87. Zakrzewski, J. Effect of indole-3-acetic acid (IAA) and sucrose on vessel size and density in isolated stem segments of oak (Quercus robur). Physiol. Plant. 1991, 81, 234–238. [Google Scholar] [CrossRef]
  88. Rinne, P.; Tuominen, H.; Sundberg, B. Growth patterns and endogenous indole-3-acetic acid concentrations in current-year coppice shoots and seedlings of two Betula species. Physiol. Plant. 1993, 88, 403–412. [Google Scholar] [CrossRef]
  89. Tuominen, H.; Sitbon, F.; Jacobsson, C.; Sandberg, G.; Olsson, O.; Sundberg, B. Altered growth and wood characteristics in transgenic hybrid aspen expressing Agrobacterium tumefaciens T-DNA indoleacetic acid-biosynthetic genes. Plant Physiol. 1995, 109, 1179–1189. [Google Scholar] [CrossRef] [Green Version]
  90. Lovisolo, C.; Schubert, A.; Sorce, C. Are xylem radial development and hydraulic conductivity in downwardly-growing grapevine shoots influenced by perturbed auxin metabolism? New Phytol. 2002, 156, 65–74. [Google Scholar] [CrossRef] [Green Version]
  91. Lachaud, S.; Bonnemain, J.L. Seasonal variations in the polar-transport pathways and retention sites of [3H]indole-3-acetic acid in young branches of Fagus sylvatica L. Planta 1984, 161, 207–215. [Google Scholar] [CrossRef]
  92. Spicer, R.; Tisdale-Orr, T.; Talavera, C. Auxin-responsive DR5 promoter coupled with transport assays suggest separate but linked routes of auxin transport during woody stem development in Populus. PLoS ONE 2013, 8, e72499. [Google Scholar] [CrossRef] [Green Version]
  93. Schrader, J.; Baba, K.; May, S.T.; Palme, K.; Bennett, M.; Bhalerao, R.P.; Sandberg, G. Polar auxin transport in the wood-forming tissues of hybrid aspen is under simultaneous control of developmental and environmental signals. Proc. Natl. Acad. Sci. USA 2003, 100, 10096–10101. [Google Scholar] [CrossRef] [PubMed] [Green Version]
  94. Schrader, J.; Moyle, R.; Bhalerao, R.; Hertzberg, M.; Lundeberg, J.; Nilsson, P.; Bhalerao, R.P. Cambial meristem dormancy in trees involves extensive remodelling of the transcriptome. Plant J. 2004, 40, 173–187. [Google Scholar] [CrossRef] [PubMed]
  95. Novitskaya, L.L. About the possible cause of the formation of structural anomalies in the Karelian birch trunk. Bot. Zhurnal 1997, 82, 61–66. [Google Scholar]
  96. Fu, J.; Yu, H.; Li, X.; Xiao, J.; Wang, S. Rice GH3 gene family: Regulators of growth and development. Plant Signal. Behav. 2011, 6, 570–574. [Google Scholar] [CrossRef] [PubMed] [Green Version]
  97. Moshchenskaya, Y.; Galibina, N.; Nikerova, K.; Novitskaya, L. Activity of sucrose dissimilating enzymes in early ontogeny in different forms of silver birch. Proc. Karelian Res. Cent. Russ. Acad. Sci. 2016, 78–87. [Google Scholar] [CrossRef]
  98. Galibina, N.A.; Novitskaya, L.L.; Nikerova, K.M. Source–sink relations in the organs and tissues of silver birch during different scenarios of xylogenesis. Russ. J. Plant Physiol. 2019, 66, 308–315. [Google Scholar] [CrossRef]
  99. Mishra, B.S.; Singh, M.; Aggrawal, P.; Laxmi, A. Glucose and auxin signaling interaction in controlling Arabidopsis thaliana seedlings root growth and development. PLoS ONE 2009, 4, e4502. [Google Scholar] [CrossRef]
  100. LeClere, S.; Schmelz, E.A.; Chourey, P.S. Sugar levels regulate tryptophan-dependent auxin biosynthesis in developing maize kernels. Plant Physiol. 2010, 153, 306–318. [Google Scholar] [CrossRef] [Green Version]
  101. Lilley, J.L.S.; Gee, C.W.; Sairanen, I.; Ljung, K.; Nemhauser, J.L. An endogenous carbon-sensing pathway triggers increased auxin flux and hypocotyl elongation. Plant Physiol. 2012, 160, 2261–2270. [Google Scholar] [CrossRef] [Green Version]
  102. Sairanen, I.; Novák, O.; Pěnčík, A.; Ikeda, Y.; Jones, B.; Sandberg, G.; Ljung, K. Soluble carbohydrates regulate auxin biosynthesis via PIF proteins in Arabidopsis. Plant Cell 2012, 24, 4907–4916. [Google Scholar] [CrossRef] [Green Version]
  103. Han, L.; Li, J.L.; Jin, M.; Su, Y.H. Transcriptome analysis of Arabidopsis seedlings responses to high concentrations of glucose. Genet. Mol. Res. 2015, 14, 4784–4801. [Google Scholar] [CrossRef] [PubMed]
  104. Barbier, F.; Peron, T.; Lecerf, M.; Perez-Garcia, M.-D.; Barriere, Q.; Rolcik, J.; Boutet-Mercey, S.; Citerne, S.; Lemoine, R.; Porcheron, B.; et al. Sucrose is an early modulator of the key hormonal mechanisms controlling bud outgrowth in Rosa hybrida. J. Exp. Bot. 2015, 66, 2569–2582. [Google Scholar] [CrossRef] [Green Version]
  105. Mao, J.; Li, W.; Mi, B.; Ma, Z.; Dawuda, M.M.; Zuo, C.; Zhang, Y.; Jiang, X.; Chen, B. Transcriptome analysis revealed glucose application affects plant hormone signal transduction pathway in “Red Globe” grape plantlets. Plant Growth Regul. 2018, 84, 45–56. [Google Scholar] [CrossRef]
  106. Ke, Q.; Wang, Z.; Ji, C.Y.; Jeong, J.C.; Lee, H.-S.; Li, H.; Xu, B.; Deng, X.; Kwak, S.-S. Transgenic poplar expressing Arabidopsis YUCCA6 exhibits auxin-overproduction phenotypes and increased tolerance to abiotic stress. Plant Physiol. Biochem. 2015, 94, 19–27. [Google Scholar] [CrossRef] [PubMed]
  107. Park, S.-C.; Kim, H.S.; Lee, H.-U.; Kim, Y.-H.; Kwak, S.-S. Overexpression of Arabidopsis YUCCA6 enhances environment stress tolerance and inhibits storage root formation in sweet potato. Plant Biotechnol. Rep. 2019, 13, 345–352. [Google Scholar] [CrossRef]
  108. Jackson, R.G.; Kowalczyk, M.; Li, Y.; Higgins, G.; Ross, J.; Sandberg, G.; Bowles, D.J. Over-expression of an Arabidopsis gene encoding a glucosyltransferase of indole-3-acetic acid: Phenotypic characterisation of transgenic lines. Plant J. 2002, 32, 573–583. [Google Scholar] [CrossRef] [PubMed]
  109. Ludwig-Müller, J.; Walz, A.; Slovin, J.P.; Epstein, E.; Cohen, J.D.; Dong, W.; Town, C.D. Overexpression of maize IAGLU in Arabidopsis thaliana alters plant growth and sensitivity to IAA but not IBA and 2,4-D. J. Plant Growth Regul. 2005, 24, 127–141. [Google Scholar] [CrossRef]
  110. Dai, X.; Mashiguchi, K.; Chen, Q.; Kasahara, H.; Kamiya, Y.; Ojha, S.; DuBois, J.; Ballou, D.; Zhao, Y. The biochemical mechanism of auxin biosynthesis by an Arabidopsis YUCCA flavin-containing monooxygenase. J. Biol. Chem. 2013, 288, 1448–1457. [Google Scholar] [CrossRef] [Green Version]
  111. Nishimura, T.; Hayashi, K.; Suzuki, H.; Gyohda, A.; Takaoka, C.; Sakaguchi, Y.; Matsumoto, S.; Kasahara, H.; Sakai, T.; Kato, J.; et al. Yucasin is a potent inhibitor of YUCCA, a key enzyme in auxin biosynthesis. Plant J. 2014, 77, 352–366. [Google Scholar] [CrossRef]
  112. Chen, Q.; Westfall, C.S.; Hicks, L.M.; Wang, S.; Jez, J.M. Kinetic basis for the conjugation of auxin by a GH3 family indole-acetic acid-amido synthetase. J. Biol. Chem. 2010, 285, 29780–29786. [Google Scholar] [CrossRef] [Green Version]
  113. Kramer, E.M.; Ackelsberg, E.M. Auxin metabolism rates and implications for plant development. Front. Plant Sci. 2015, 6, 150. [Google Scholar] [CrossRef] [PubMed] [Green Version]
  114. Ostrowski, M.; Mierek-Adamska, A.; Porowińska, D.; Goc, A.; Jakubowska, A. Cloning and biochemical characterization of indole-3-acetic acid-amino acid synthetase PsGH3 from pea. Plant Physiol. Biochem. 2016, 107, 9–20. [Google Scholar] [CrossRef] [PubMed]
  115. Friml, J.; Jones, A.R. Endoplasmic reticulum: The rising compartment in auxin biology. Plant Physiol. 2010, 154, 458–462. [Google Scholar] [CrossRef] [PubMed] [Green Version]
  116. Enders, T.A.; Strader, L.C. Auxin activity: Past, present, and future. Am. J. Bot. 2015, 102, 180–196. [Google Scholar] [CrossRef] [Green Version]
  117. Middleton, A.M.; Dal Bosco, C.; Chlap, P.; Bensch, R.; Harz, H.; Ren, F.; Bergmann, S.; Wend, S.; Weber, W.; Hayashi, K.; et al. Data-driven modeling of intracellular auxin fluxes indicates a dominant role of the ER in controlling nuclear auxin uptake. Cell Rep. 2018, 22, 3044–3057. [Google Scholar] [CrossRef]
  118. Dal Bosco, C.; Dovzhenko, A.; Liu, X.; Woerner, N.; Rensch, T.; Eismann, M.; Eimer, S.; Hegermann, J.; Paponov, I.A.; Ruperti, B.; et al. The endoplasmic reticulum localized PIN8 is a pollen-specific auxin carrier involved in intracellular auxin homeostasis. Plant J. 2012, 71, 860–870. [Google Scholar] [CrossRef]
  119. Mravec, J.; Skůpa, P.; Bailly, A.; Hoyerová, K.; Křeček, P.; Bielach, A.; Petrášek, J.; Zhang, J.; Gaykova, V.; Stierhof, Y.-D.; et al. Subcellular homeostasis of phytohormone auxin is mediated by the ER-localized PIN5 transporter. Nature 2009, 459, 1136–1140. [Google Scholar] [CrossRef]
  120. Gerttula, S.; Zinkgraf, M.; Muday, G.K.; Lewis, D.R.; Ibatullin, F.M.; Brumer, H.; Hart, F.; Mansfield, S.D.; Filkov, V.; Groover, A. Transcriptional and hormonal regulation of gravitropism of woody stems in Populus. Plant Cell 2015. [Google Scholar] [CrossRef] [Green Version]
  121. Zamski, E.; Warwing, P.F. Vertical and radial movement of auxin in young sycamore plants. New Phytol. 1974, 73, 61–69. [Google Scholar] [CrossRef]
  122. Novitskaya, L.L. Karelian Birch: Mechanisms of Growth and Development of Structural Abnormalities; Verso: Petrozavodsk, Russia, 2008. [Google Scholar]
  123. Nikolaeva, N.N. Formation of Leaf Apparatus in Silver Birch (Betula pendula Roth.) with Different Wood Grain. Ph.D. Thesis, Komarov Botanical Institute of the Russian Academy of Sciences, Saint Petersburg, Russia, 2004. [Google Scholar]
  124. Price, J.; Laxmi, A.; St. Martin, S.K.; Jang, J.-C. Global transcription profiling reveals multiple sugar signal transduction mechanisms in Arabidopsis. Plant Cell 2004, 16, 2128–2150. [Google Scholar] [CrossRef] [Green Version]
  125. Smeekens, S.; Ma, J.; Hanson, J.; Rolland, F. Sugar signals and molecular networks controlling plant growth. Curr. Opin. Plant Biol. 2010, 13, 273–278. [Google Scholar] [CrossRef]
  126. Sakr, S.; Wang, M.; Dédaldéchamp, F.; Perez-Garcia, M.-D.; Ogé, L.; Hamama, L.; Atanassova, R. The sugar-signaling hub: Overview of regulators and interaction with the hormonal and metabolic network. Int. J. Mol. Sci. 2018, 19, 2506. [Google Scholar] [CrossRef] [Green Version]
  127. Yamaguchi, M.; Demura, T. Transcriptional regulation of secondary wall formation controlled by NAC domain proteins. Plant Biotechnol. 2010, 27, 237–242. [Google Scholar] [CrossRef] [Green Version]
  128. Le Hir, R.; Bellini, C. The plant-specific Dof transcription factors family: New players involved in vascular system development and functioning in Arabidopsis. Front. Plant Sci. 2013, 4, 164. [Google Scholar] [CrossRef] [PubMed] [Green Version]
  129. Yanagisawa, S. Structure, function, and evolution of the Dof transcription factor family. In Plant Transcription Factors; Gonzalez, D.H., Ed.; Elsevier: Amsterdam, The Netherlands, 2016; pp. 183–197. [Google Scholar]
  130. Kubo, M. Transcription switches for protoxylem and metaxylem vessel formation. Genes Dev. 2005, 19, 1855–1860. [Google Scholar] [CrossRef] [Green Version]
  131. Mitsuda, N.; Iwase, A.; Yamamoto, H.; Yoshida, M.; Seki, M.; Shinozaki, K.; Ohme-Takagi, M. NAC transcription factors, NST1 and NST3, are key regulators of the formation of secondary walls in woody tissues of Arabidopsis. Plant Cell 2007, 19, 270–280. [Google Scholar] [CrossRef] [PubMed] [Green Version]
  132. Shi, R.; Wang, J.P.; Lin, Y.-C.; Li, Q.; Sun, Y.-H.; Chen, H.; Sederoff, R.R.; Chiang, V.L. Tissue and cell-type co-expression networks of transcription factors and wood component genes in Populus trichocarpa. Planta 2017, 245, 927–938. [Google Scholar] [CrossRef] [PubMed]
  133. Laubscher, M.; Brown, K.; Tonfack, L.B.; Myburg, A.A.; Mizrachi, E.; Hussey, S.G. Temporal analysis of Arabidopsis genes activated by Eucalyptus grandis NAC transcription factors associated with xylem fibre and vessel development. Sci. Rep. 2018, 8, 10983. [Google Scholar] [CrossRef] [Green Version]
  134. Miyashima, S.; Roszak, P.; Sevilem, I.; Toyokura, K.; Blob, B.; Heo, J.; Mellor, N.; Help-Rinta-Rahko, H.; Otero, S.; Smet, W.; et al. Mobile PEAR transcription factors integrate positional cues to prime cambial growth. Nature 2019, 565, 490–494. [Google Scholar] [CrossRef] [Green Version]
  135. Tarelkina, T.V.; Galibina, N.A.; Moshchenskaya, Y.L.; Novitskaya, L.L. In silico analysis of regulatory cis-elements in the promoters of genes encoding apoplastic invertase and sucrose synthase in silver birch. Russ. J. Dev. Biol. 2020, 51, 323–335. [Google Scholar] [CrossRef]
  136. Manassero, N.G.U.; Viola, I.L.; Welchen, E.; Gonzalez, D.H. TCP transcription factors: Architectures of plant form. Biomol. Concepts 2013, 4, 111–127. [Google Scholar] [CrossRef] [PubMed]
  137. Danisman, S. TCP transcription factors at the interface between environmental challenges and the plant’s growth responses. Front. Plant Sci. 2016, 7, 1930. [Google Scholar] [CrossRef] [PubMed]
  138. Dröge-Laser, W.; Snoek, B.L.; Snel, B.; Weiste, C. The Arabidopsis bZIP transcription factor family—An update. Curr. Opin. Plant Biol. 2018, 45, 36–49. [Google Scholar] [CrossRef] [PubMed]
  139. Johnsson, C.; Jin, X.; Xue, W.; Dubreuil, C.; Lezhneva, L.; Fischer, U. The plant hormone auxin directs timing of xylem development by inhibition of secondary cell wall deposition through repression of secondary wall NAC-domain transcription factors. Physiol. Plant. 2019, 165, 673–689. [Google Scholar] [CrossRef] [PubMed] [Green Version]
  140. Kim, H.-S.; Kim, S.J.; Abbasi, N.; Bressan, R.A.; Yun, D.-J.; Yoo, S.-D.; Kwon, S.-Y.; Choi, S.-B. The DOF transcription factor Dof5.1 influences leaf axial patterning by promoting Revoluta transcription in Arabidopsis. Plant J. 2010, 64, 524–535. [Google Scholar] [CrossRef] [PubMed]
  141. Nicolas, M.; Cubas, P. TCP factors: New kids on the signaling block. Curr. Opin. Plant Biol. 2016, 33, 33–41. [Google Scholar] [CrossRef]
  142. Heinekamp, T.; Strathmann, A.; Kuhlmann, M.; Froissard, M.; Müller, A.; Perrot-Rechenmann, C.; Dröge-Laser, W. The tobacco bZIP transcription factor BZI-1 binds the GH3 promoter in vivo and modulates auxin-induced transcription. Plant J. 2004, 38, 298–309. [Google Scholar] [CrossRef] [PubMed]
  143. Berendzen, K.W.; Weiste, C.; Wanke, D.; Kilian, J.; Harter, K.; Dröge-Laser, W. Bioinformatic cis-element analyses performed in Arabidopsis and rice disclose bZIP- and MYB-related binding sites as potential AuxRE-coupling elements in auxin-mediated transcription. BMC Plant Biol. 2012, 12, 125. [Google Scholar] [CrossRef] [Green Version]
  144. Weiste, C.; Pedrotti, L.; Selvanayagam, J.; Muralidhara, P.; Fröschel, C.; Novák, O.; Ljung, K.; Hanson, J.; Dröge-Laser, W. The Arabidopsis bZIP11 transcription factor links low-energy signalling to auxin-mediated control of primary root growth. PLoS Genet. 2017, 13, e1006607. [Google Scholar] [CrossRef]
  145. Lastdrager, J.; Hanson, J.; Smeekens, S. Sugar signals and the control of plant growth and development. J. Exp. Bot. 2014, 65, 799–807. [Google Scholar] [CrossRef]
  146. IAWA Committee. IAWA list of microscopic features for hardwood identification. IAWA Bull. 1989, 10, 219–332. [Google Scholar]
  147. Scholz, A.; Klepsch, M.; Karimi, Z.; Jansen, S. How to quantify conduits in wood? Front. Plant Sci. 2013, 4, 56. [Google Scholar] [CrossRef] [PubMed] [Green Version]
  148. Angyalossy, V.; Pace, M.R.; Evert, R.F.; Marcati, C.R.; Oskolski, A.A.; Terrazas, T.; Kotina, E.; Lens, F.; Mazzoni-Viveiros, S.C.; Angeles, G.; et al. IAWA list of microscopic bark features. IAWA J. 2016, 37, 517–615. [Google Scholar] [CrossRef] [Green Version]
  149. Xu, M.; Zang, B.; Yao, H.S.; Huang, M.R. Isolation of high quality RNA and molecular manipulations with various tissues of Populus. Russ. J. Plant Physiol. 2009, 56, 716–719. [Google Scholar] [CrossRef]
  150. Salojärvi, J.; Smolander, O.-P.; Nieminen, K.; Rajaraman, S.; Safronov, O.; Safdari, P.; Lamminmäki, A.; Immanen, J.; Lan, T.; Tanskanen, J.; et al. Genome sequencing and population genomic analyses provide insights into the adaptive landscape of silver birch. Nat. Genet. 2017, 49, 904–912. [Google Scholar] [CrossRef]
  151. Marchler-Bauer, A.; Bryant, S.H. CD-Search: Protein domain annotations on the fly. Nucleic Acids Res. 2004, 32, W327–W331. [Google Scholar] [CrossRef] [PubMed]
  152. Kumar, S.; Stecher, G.; Li, M.; Knyaz, C.; Tamura, K. MEGA X: Molecular Evolutionary Genetics Analysis across computing platforms. Mol. Biol. Evol. 2018, 35, 1547–1549. [Google Scholar] [CrossRef]
  153. Felsenstein, J. Confidence limits on phylogenies: An approach using the bootstrap. Evolution 1985, 39, 783–791. [Google Scholar] [CrossRef]
  154. Saitou, N.; Nei, M. The neighbor-joining method: A new method for reconstructing phylogenetic trees. Mol. Biol. Evol. 1987, 4, 406–425. [Google Scholar] [CrossRef]
  155. Nei, M.; Kumar, S. Molecular Evolution and Phylogenetics; Oxford University Press: Oxford, UK; New York, NY, USA, 2000. [Google Scholar]
  156. Voorrips, R.E. MapChart: Software for the graphical presentation of linkage maps and QTLs. J. Hered. 2002, 93, 77–78. [Google Scholar] [CrossRef] [Green Version]
  157. Hu, B.; Jin, J.; Guo, A.-Y.; Zhang, H.; Luo, J.; Gao, G. GSDS 2.0: An upgraded gene feature visualization server. Bioinformatics 2015, 31, 1296–1297. [Google Scholar] [CrossRef] [PubMed] [Green Version]
  158. Moshchenskaya, Y.L.; Galibina, N.A.; Tarelkina, T.V.; Nikerova, K.M.; Chirva, O.V.; Novitskaya, L.L. Selection of reference genes for normalization of quantitative PCR data in real time in two forms of silver birch. Russ. J. Plant Physiol. in press.
  159. Tian, F.; Yang, D.-C.; Meng, Y.-Q.; Jin, J.; Gao, G. PlantRegMap: Charting functional regulatory maps in plants. Nucleic Acids Res. 2019, 48, D1104–D1113. [Google Scholar] [CrossRef] [PubMed]
Figure 1. Appearance of trunk tissues (wood and bark) in sampled trees: (a) figured B. pendula var. carelica (Bc FT) tree; (b) non-figured B. pendula var. carelica (Bc NF) tree; (c) B. pendula var. pendula (Bp) tree.
Plants 09 01406 g001
Figure 2. Parameters and appearance of xylem tissue in sampled birch trees: (a) vessel density and vessel grouping index (indicated by the line chart). Vessel grouping index is defined as the ratio of the total number of vessels to the total number of vessel groupings (incl. solitary and grouped vessels). FTa and FTn indicate figured and non-figured parts from figured B. pendula var. carelica tree trunks; (b, c, d) transverse sections of the xylem: (b) figured B. pendula var. carelica (Bc FT) tree; (c) non-figured B. pendula var. carelica (Bc NF) tree; (d) B. pendula var. pendula (Bp) tree. Black arrowhead points to the annual increment outline, black arrow indicates vessels. Scale bar = 100 µm.
Plants 09 01406 g002
Figure 3. Conducting phloem width (a) and appearance of secondary phloem tissue in sampled birch trees (transverse section): (b) figured B. pendula var. carelica (Bc FT) tree; (c) non-figured B. pendula var. carelica (Bc NF) tree; (d) B. pendula var. pendula (Bp) tree. FTa and FTn indicate figured and non-figured parts from figured B. pendula var. carelica tree trunks. Conducting phloem is indicated by the rounded double arrow. Scale bar = 100 µm.
Plants 09 01406 g003
Figure 4. Phylogenetic relationships of Yucca proteins of B. pendula (green dots), A. thaliana (red dots) and P. trichocarpa (blue dots). The tree is drawn to scale, with branch lengths in the same units as those of the evolutionary distances used to infer the phylogenetic tree. Bootstrap values (1000 replicates) are shown next to the branches. The access codes of the A. thaliana and P. trichocarpa proteins in the UniProt/SwissProt and Phytozome databases are indicated next to the corresponding proteins.
Plants 09 01406 g004
Figure 5. The chromosomal locations of B. pendula Yucca genes. The scale represents a 45-Mb chromosomal distance.
Plants 09 01406 g005
Figure 6. Structure of B. pendula Yucca genes. Intron, exon and untranslated region (UTR) are represented by black lines, green boxes and light blue boxes, respectively.
Plants 09 01406 g006
Figure 7. Phylogenetic relationships of GH3 proteins of B. pendula (green dots), A. thaliana (red dots) and P. trichocarpa (blue dots). The tree is drawn to scale, with branch lengths in the same units as those of the evolutionary distances used to infer the phylogenetic tree. Bootstrap values (1000 replicates) are shown next to the branches. The access codes of the A. thaliana and P. trichocarpa proteins in the UniProt/SwissProt and Phytozome databases are indicated next to the corresponding proteins.
Plants 09 01406 g007
Figure 8. The chromosomal locations of B. pendula group II GH3 genes. The scale represents a 45-Mb chromosomal distance.
Plants 09 01406 g008
Figure 9. Structure of B. pendula group II GH3 genes. Intron, exon and untranslated region (UTR) are represented by black lines, green boxes and light blue boxes, respectively.
Plants 09 01406 g009
Figure 10. Relative gene expression of Yucca, PIN, GH3 and UGT family genes that were the most active in the studied tissues. DX—differentiating xylem; C/P—layer including the cambial zone and conducting phloem; L—leaf. Bc FTa—figured parts of figured B. pendula var. carelica tree trunks; Bc NF—non-figured B. pendula var. carelica trees; Bp—B. pendula var. pendula trees.
Plants 09 01406 g010
Figure 11. Appearance of wood in figured (a) and non-figured (b) parts of the same figured B. pendula var. carelica (Bc FT) tree trunk and relative gene expression in xylem samples obtained from two figured B. pendula var. carelica (Bc FT) trees (c). FTa and FTn indicate figured and non-figured parts from figured B. pendula var. carelica tree trunks.
Plants 09 01406 g011
Figure 12. Number of overrepresented (compared to promoters in A. thaliana and P. trichocarpa) binding sites with transcription factors (TFs) from different families identified in promoters of genes from Set1 and Set2.
Plants 09 01406 g012
Figure 13. Flowchart of possible interaction between sugars and auxin during figured wood formation in Karelian birch trunks. CWInv—cell wall invertase.
Plants 09 01406 g013
Table 1. Characteristics of Yucca members in birch.
Gene IDB. pendula Protein NameProtein Length (aa)Motif SequencesClosest Homolog in A. thaliana
(% Identity)
Closest Homolog in P. trichocarpa (% Identity)
ATG-Containing Motif 1ATG-Containing Motif 2
Bpev01.c0000.g0045.m0001BpYucca5414WLVVATGENAELATGYAtYucca9 (74.3%)PtYucca8 (86%)
Bpev01.c0039.g0010.m0001BpYucca10330FLIAATGENSEFATGYAtYucca10 (49.1%)PtYucca9 (47.9%)
Bpev01.c0118.g0037.m0001BpYucca1391WFIVATGENAELATGYAtYucca4 (65.9%)PtYucca1 (71.2%)
Bpev01.c0171.g0019.m0001BpYucca12381FLVVATGEATDFCTGFAtYucca10 (48.1%)PtYucca12 (68.5%)
Bpev01.c0363.g0023.m0001BpYucca11802FLVVATGENSEFATGYAtYucca10 (27.4%)PtYucca12 (27.2%)
Bpev01.c0389.g0021.m0001BpYucca2421WLIVATGENAELATGYAtYucca2 (67.9%)PtYucca6 (70%)
Bpev01.c0547.g0012.m0001BpYucca3426WLVVATGENAELATGYAtYucca7 (71.4%)PtYucca3 (79.1%)
Bpev01.c1498.g0001.m0001BpYucca6424WLVVATGENAELATGYAtYucca6 (68.2%)PtYucca2 (73.5%)
Table 2. Characteristics of GH3 members in birch.
Gene IDB. pendula Protein NameProtein Length (aa)Closest Homolog in A. thaliana (% identity)Closest Homolog in P. trichocarpa (% identity)
Bpev01.c0015.g0076.m0001BpGH3.1a806AtGH3.1 (55.2%)PtGH3.1 (59.9%)
Bpev01.c0015.g0077.m0001BpGH3.1b612AtGH3.1 (73.0%)PtGH3.1 (79.1%)
Bpev01.c0015.g0078.m0001BpGH3.1c612AtGH3.1 (72.0%)PtGH3.1 (78.1%)
Bpev01.c0052.g0011.m0001BpGH3.7753AtGH3.17 (57.4%)PtGH3.7 (66.2%)
Bpev01.c0092.g0010.m0001BpGH3.5612AtGH3.6 (84.3%)PtGH3.5 (87.7%)
Bpev01.c0579.g0028.m0001BpGH3.9595AtGH3.9 (72.1%)PtGH3.9 (81.5%)
Bpev01.c1074.g0008.m0001BpGH3.4749AtGH3.6 (64.2%)PtGH3.4 (67.5%)
Bpev01.c1398.g0014.m0001BpGH3.2598AtGH3.1 (81.5%)PtGH3.3 (86.8%)
Bpev01.c1522.g0002.m0001BpGH3.3495AtGH3.1 (50.0%)PtGH3.3 (53.9%)
Table 3. List of genes included in Set 1 and Set 2.
ProcessGene familySet 1Set 2
IAA biosynthesisYuccaBpYucca5BpYucca1
BpYucca10BpYucca5
BpYucca11BpYucca6
BpYucca12BpYucca10
BpYucca12
IAA transportPIN BpPIN1b
BpPIN3
BpPIN6
BpPIN8
IAA conjugationGH3GH3.1aGH3.1c
GH3.1bGH3.2
GH3.4GH3.4
GH3.5GH3.5
GH3.9
UGTUGT84B1UGT84B1
Table 4. List of primers for the RT-PCR reaction.
Gene NameForward PrimerReverse Primer
BpYucca1ATTCAATAATCTTAGCAACTGTGTATAAGTCCGTTCTCT
BpYucca2GTTAGAGATTCGGTTCATTGACATTAGAAGCAAGAA
BpYucca3TATTAGTTGTTGGTTGTGATATCAGCAATATCTTATCG
BpYucca5GGAGTACAAGAACACCATGCAAGAACAACTGAATCAA
BpYucca6TATACTCAGTTGGGTTTAAAATGAAATGAAGAATAAGG
BpYucca10AGGTGGAAGTATATGTTGTGTAATGGTTGGAATGTA
BpYucca11TAGAAGGAAGTATGGAAGGTTGGAATGGAGAATATC
BpYucca12GCTTCAAGAGGTCCACAATAGTCCAACGCAGTATAATCC
BpPIN1aAAGGCTTATTCTCATCATGTATGGAAATGGACTTTG
BpPIN1bCTCTCCTTTCCTTTCACTTCACCACCAAGACGATTACT
BpPIN2AATAGAGGAAGGATTGAAGGACTTGAGTAGGTGTTAG
BpPIN3GTTCTCGTCCACTATTACTAAGCAACTCCTTAGCATCAT
BpPIN6TCATATCTCAGAACAATCCAAGAGTGATAAGCCAATC
BpPIN8CATTATATGTTGTGATGATAGTAGAGCAGAGGAATTGAGTAT
BpGH3.1aGAAGCAATGGATATGATTCAATTAGTGTCTAGGATG
BpGH3.1bAGTGTTCAGAAGAGAATTGAGTGTTGGTATGTATTG
BpGH3.1cATTCCTACAACTCAACTGATTCGTGTGATTATACCTT
BpGH3.2TTTATTGCCAAAGAATGCAGATTGACTCCGAAATAG
BpGH3.3CAGACTCTGGATCACTATCATTATGGTGTACGAGAC
BpGH3.4TTATAGTAACAGGAACAATGGCAAGAACTCATAATAACA
BpGH3.5AGTATGTGGATGTTATTGTAAGAGGATTAAGGTTGAC
BpGH3.7CTGTTGTGAATTATGAAGAAAGGATGTTGTAGAAGAA
BpGH3.9TATCTCAACAACTATCTCAATCACCATTAGCAATTCTT
Publisher’s Note: MDPI stays neutral with regard to jurisdictional claims in published maps and institutional affiliations.

