Comparative Analysis between Wild and Cultivated Cucumbers Reveals Transcriptional Changes during Domestication Process

 ,
,  ,
, 
Abstract
1. Introduction
2. Results
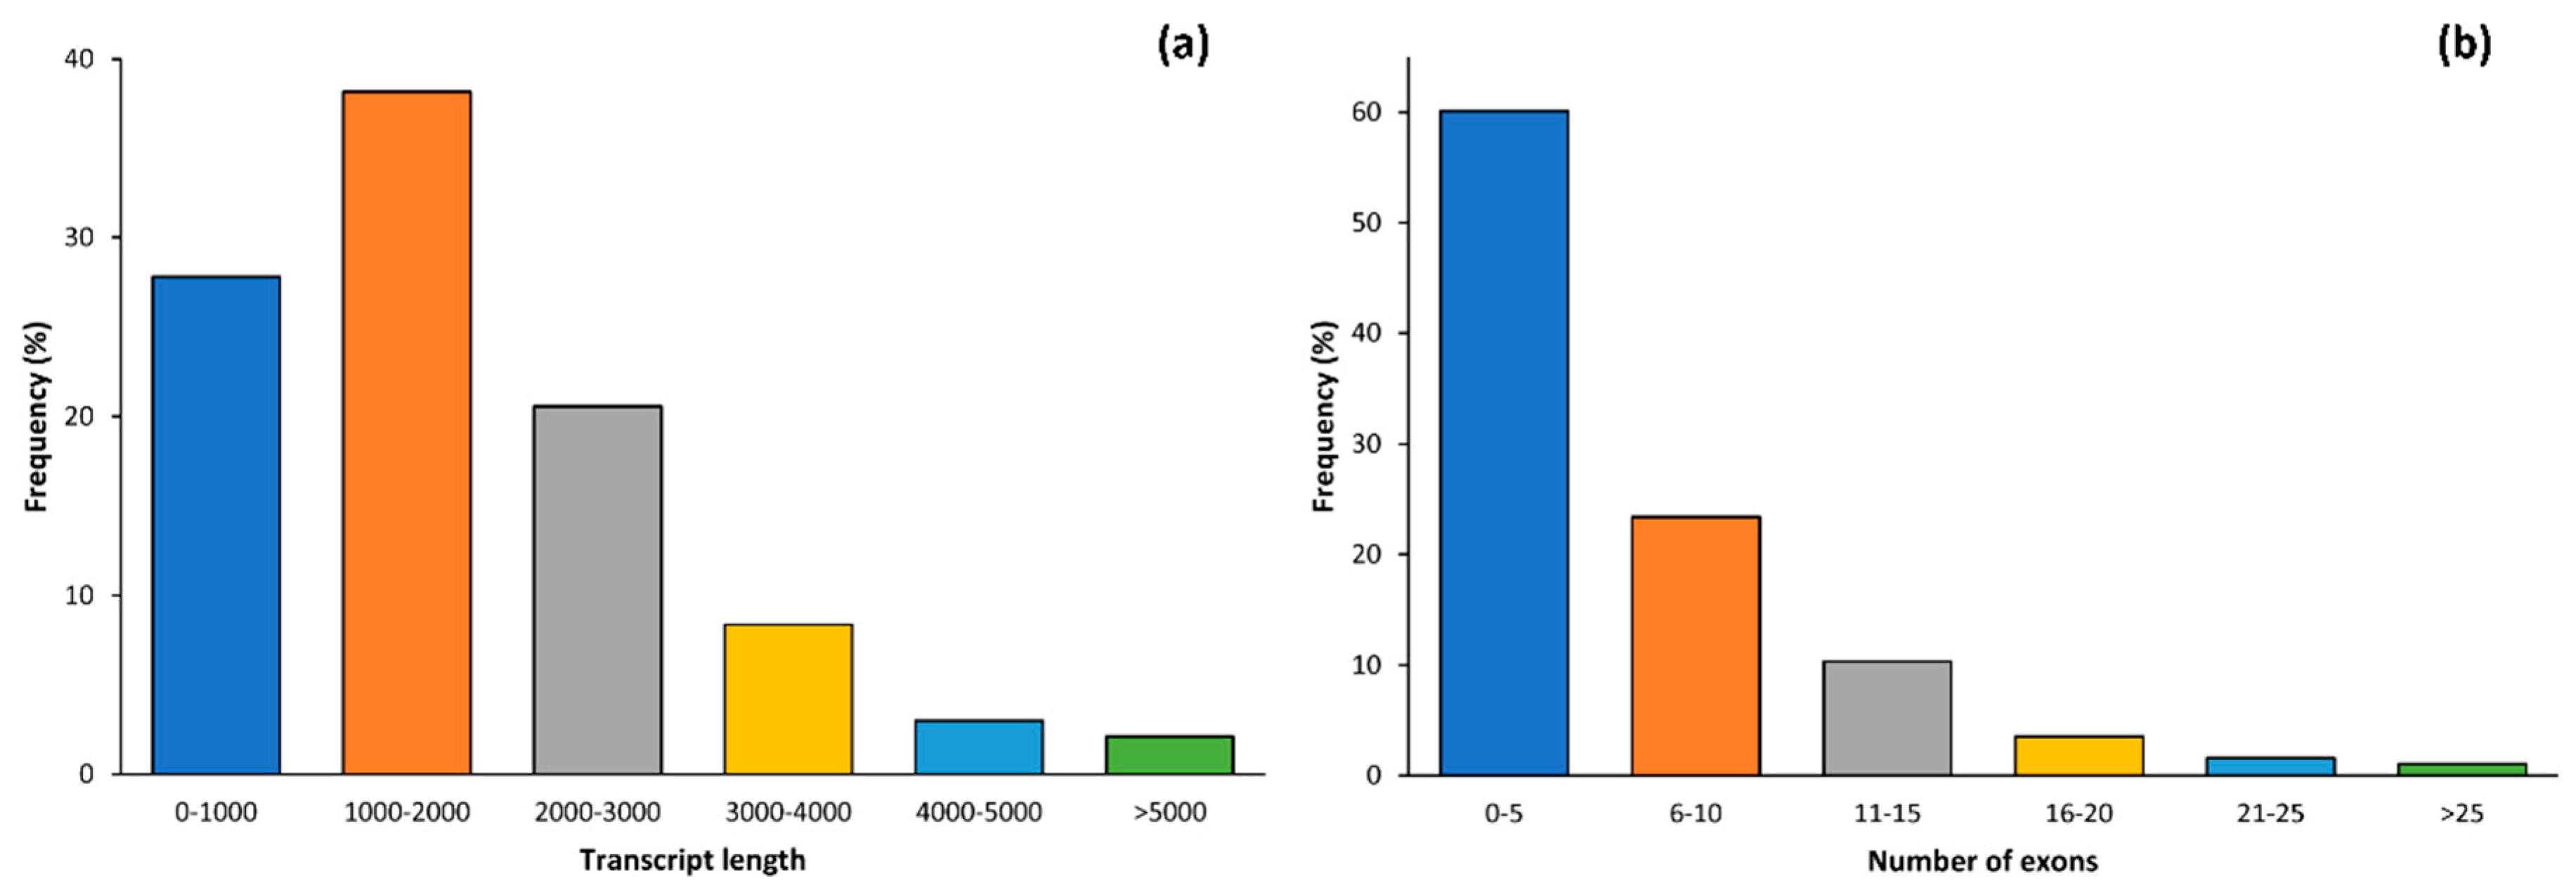
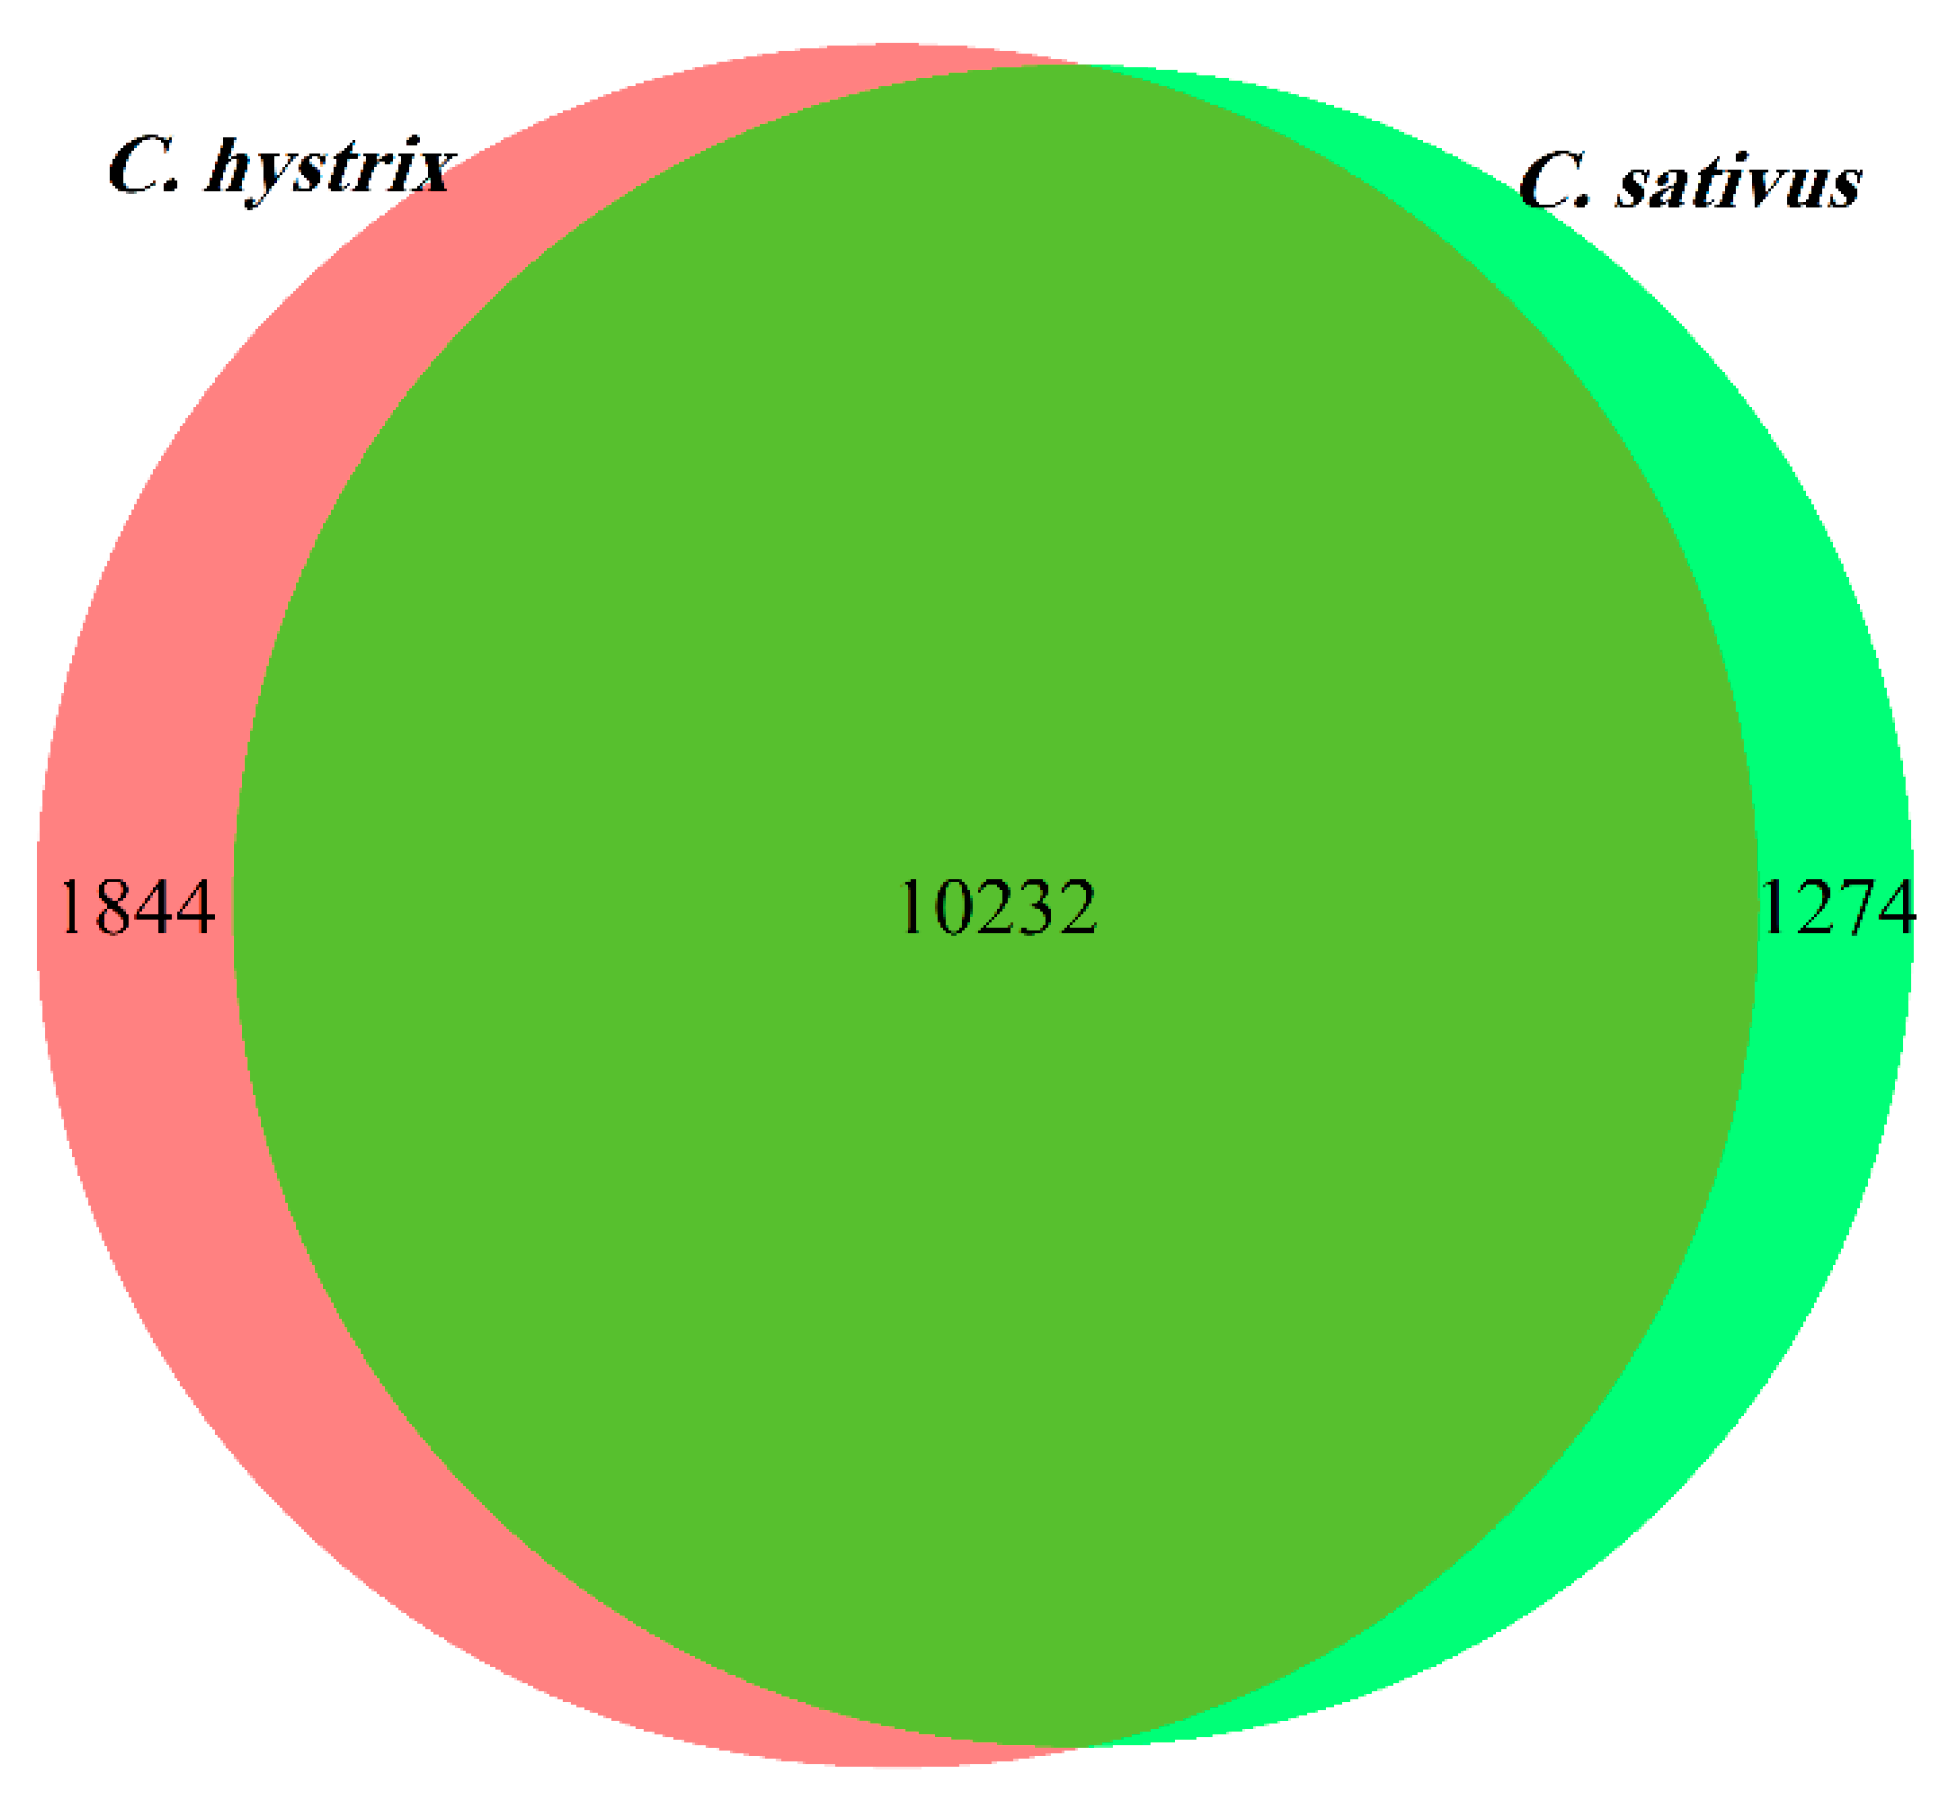
2.1. Data Alignment
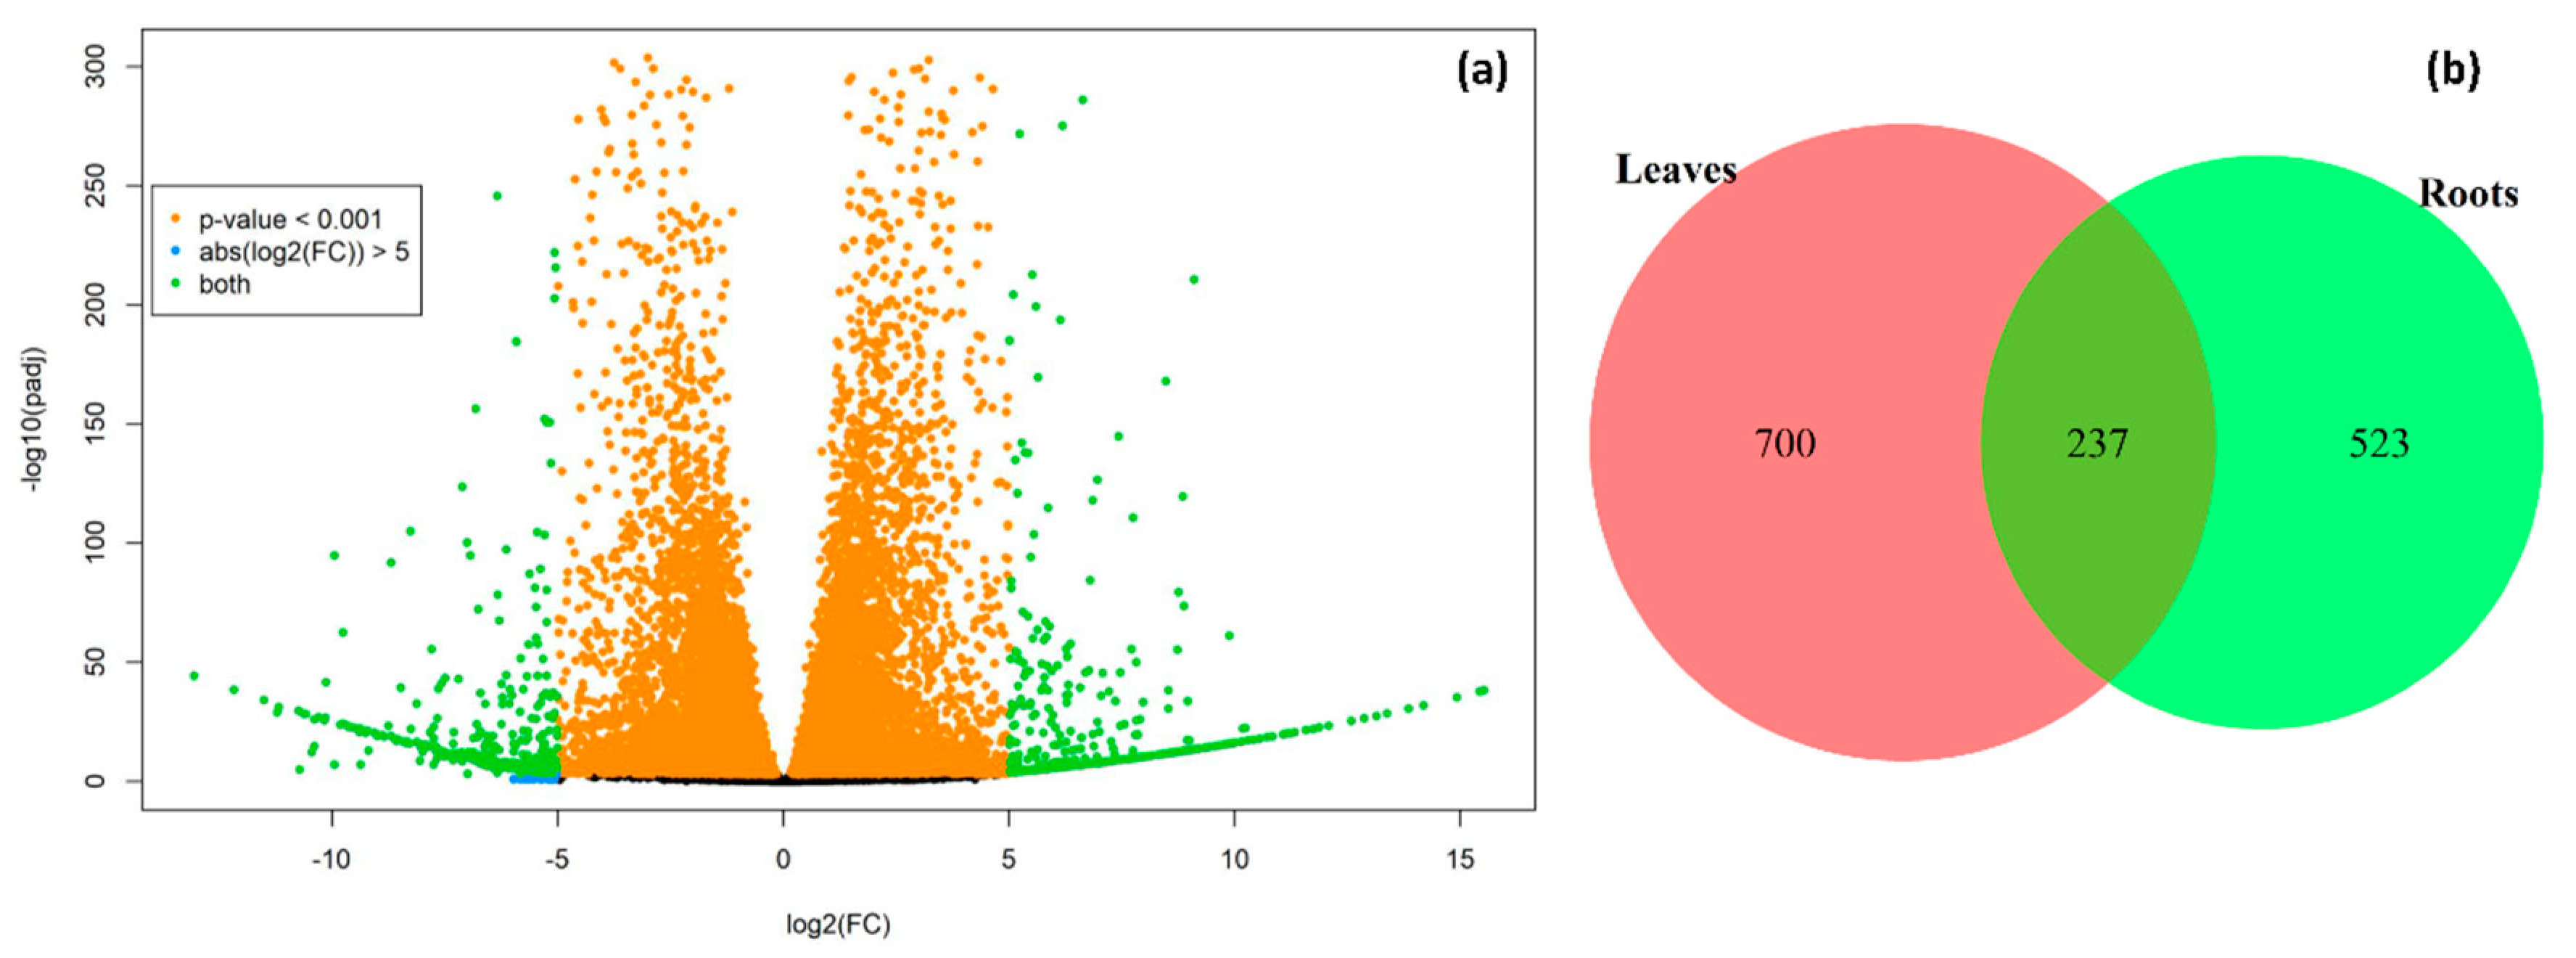
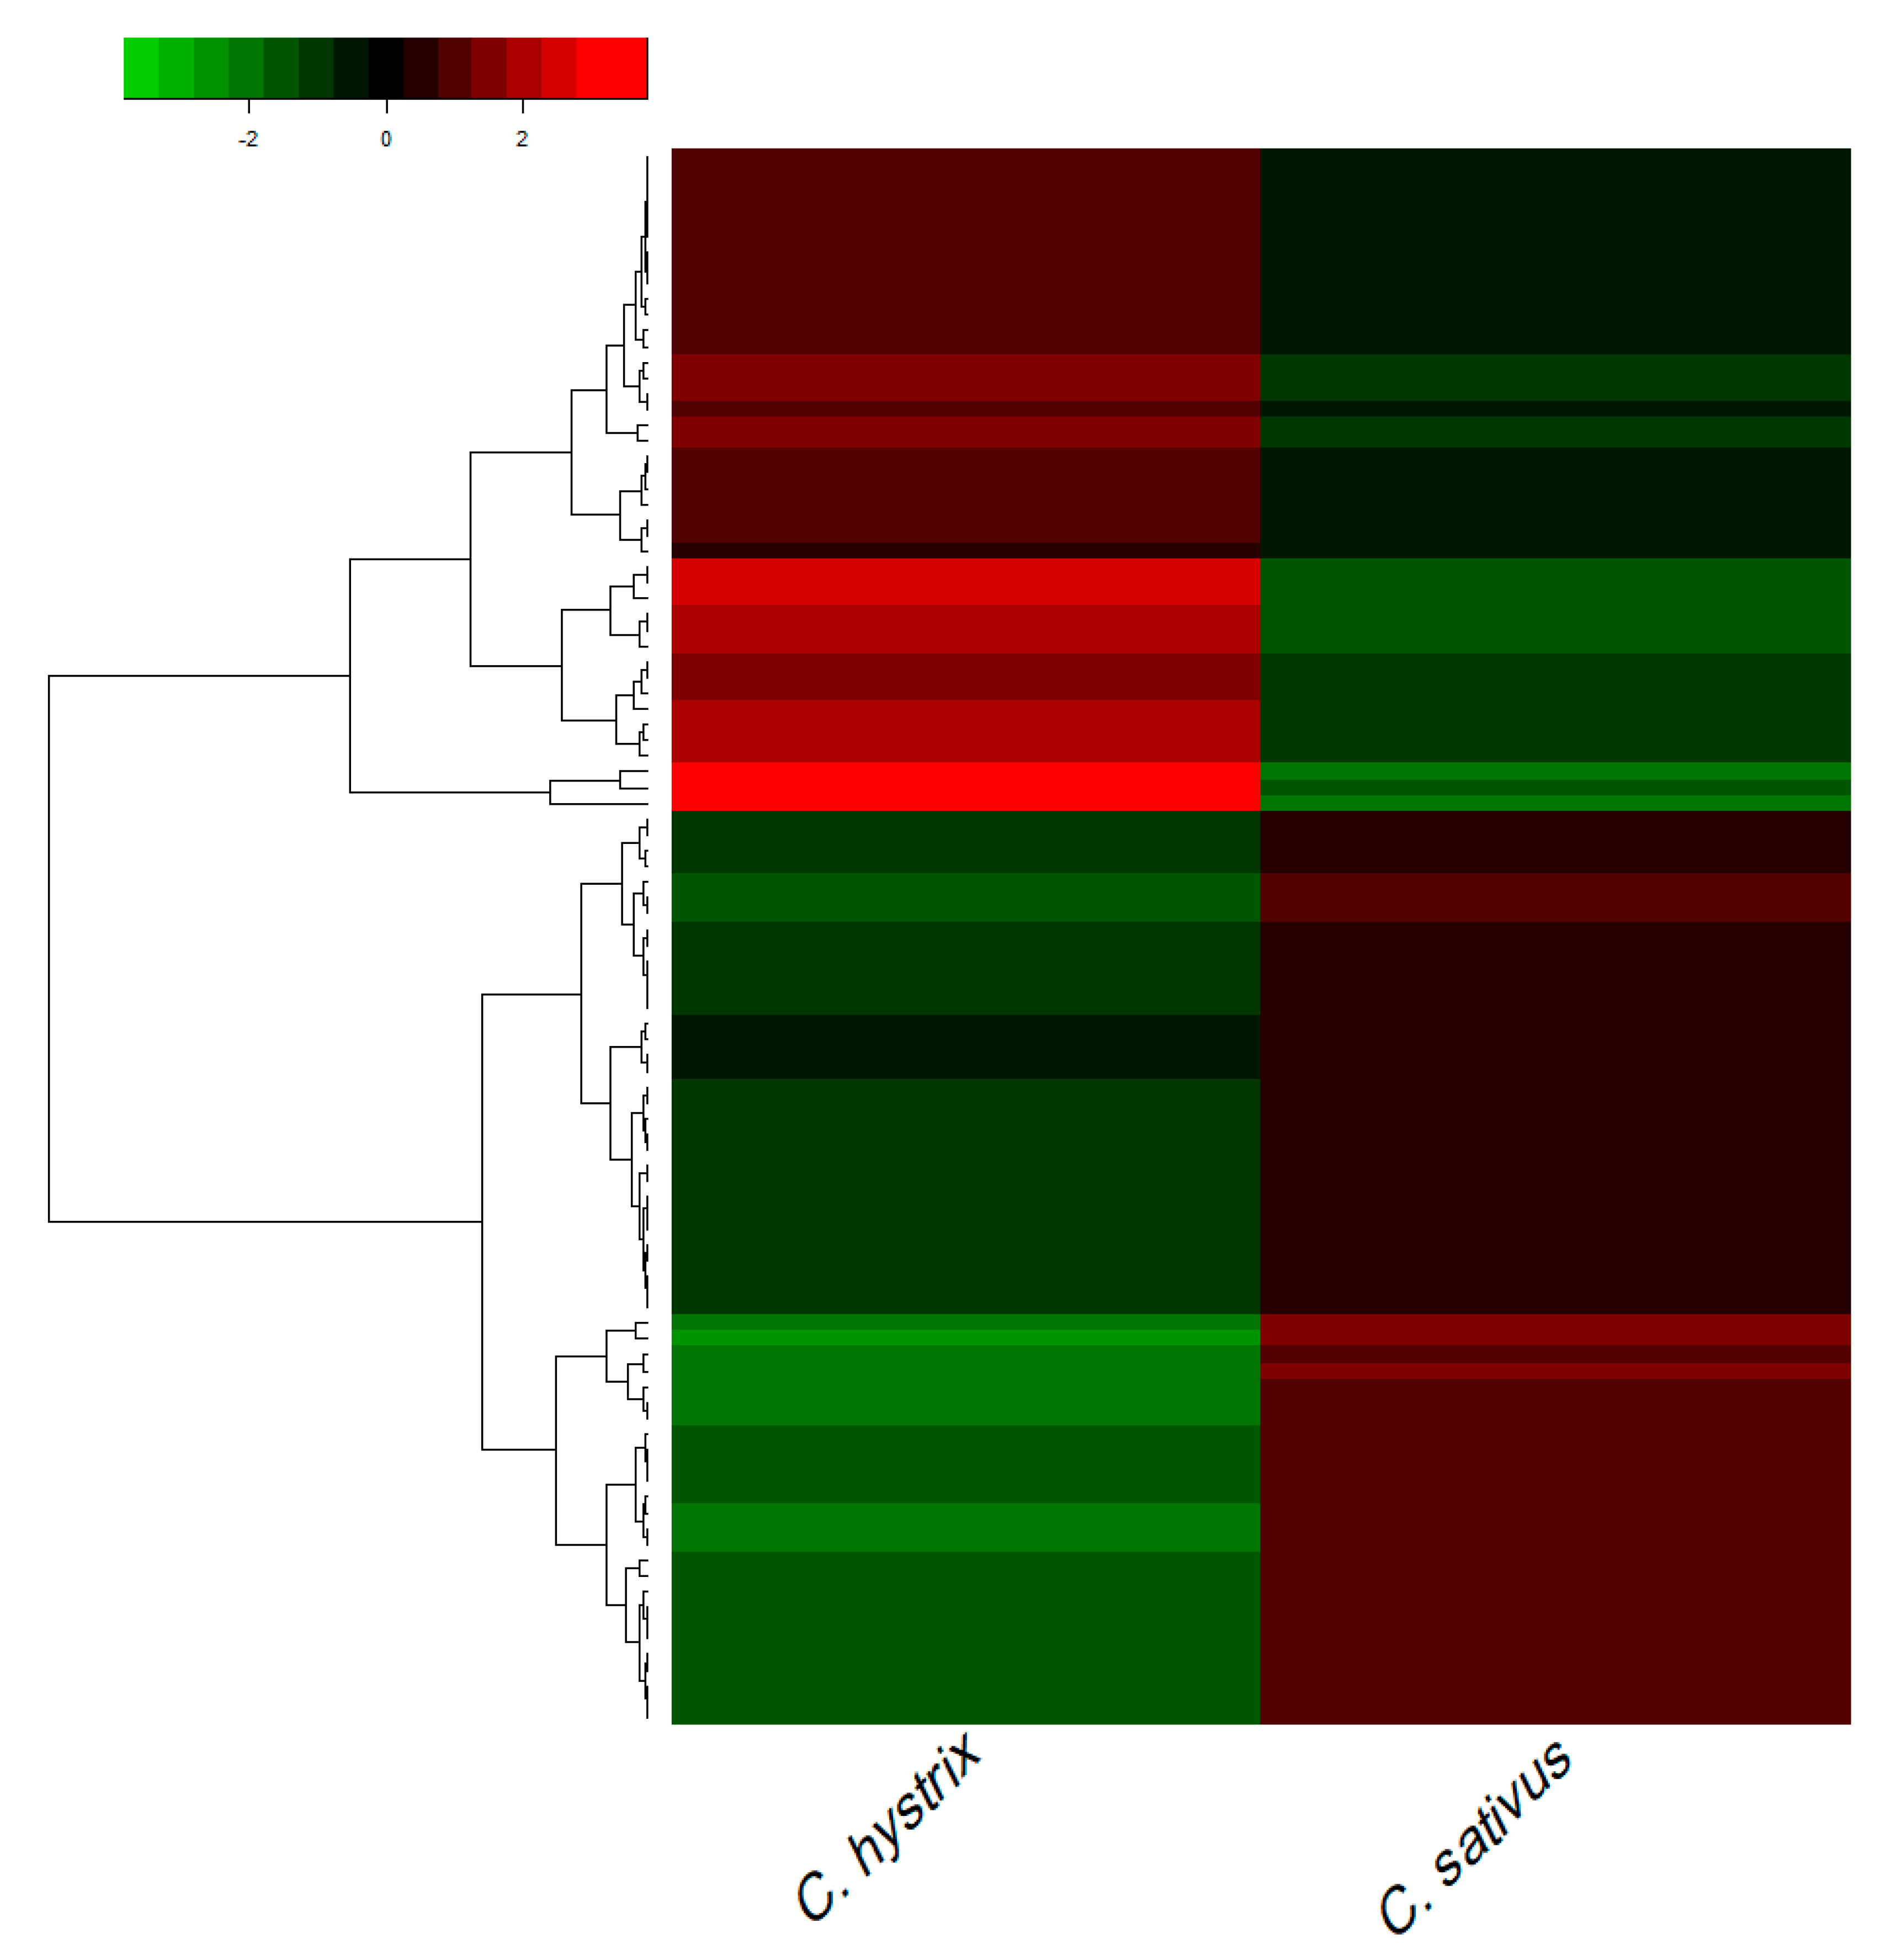
2.2. Identification of Differentially Expressed Genes (DEGs)
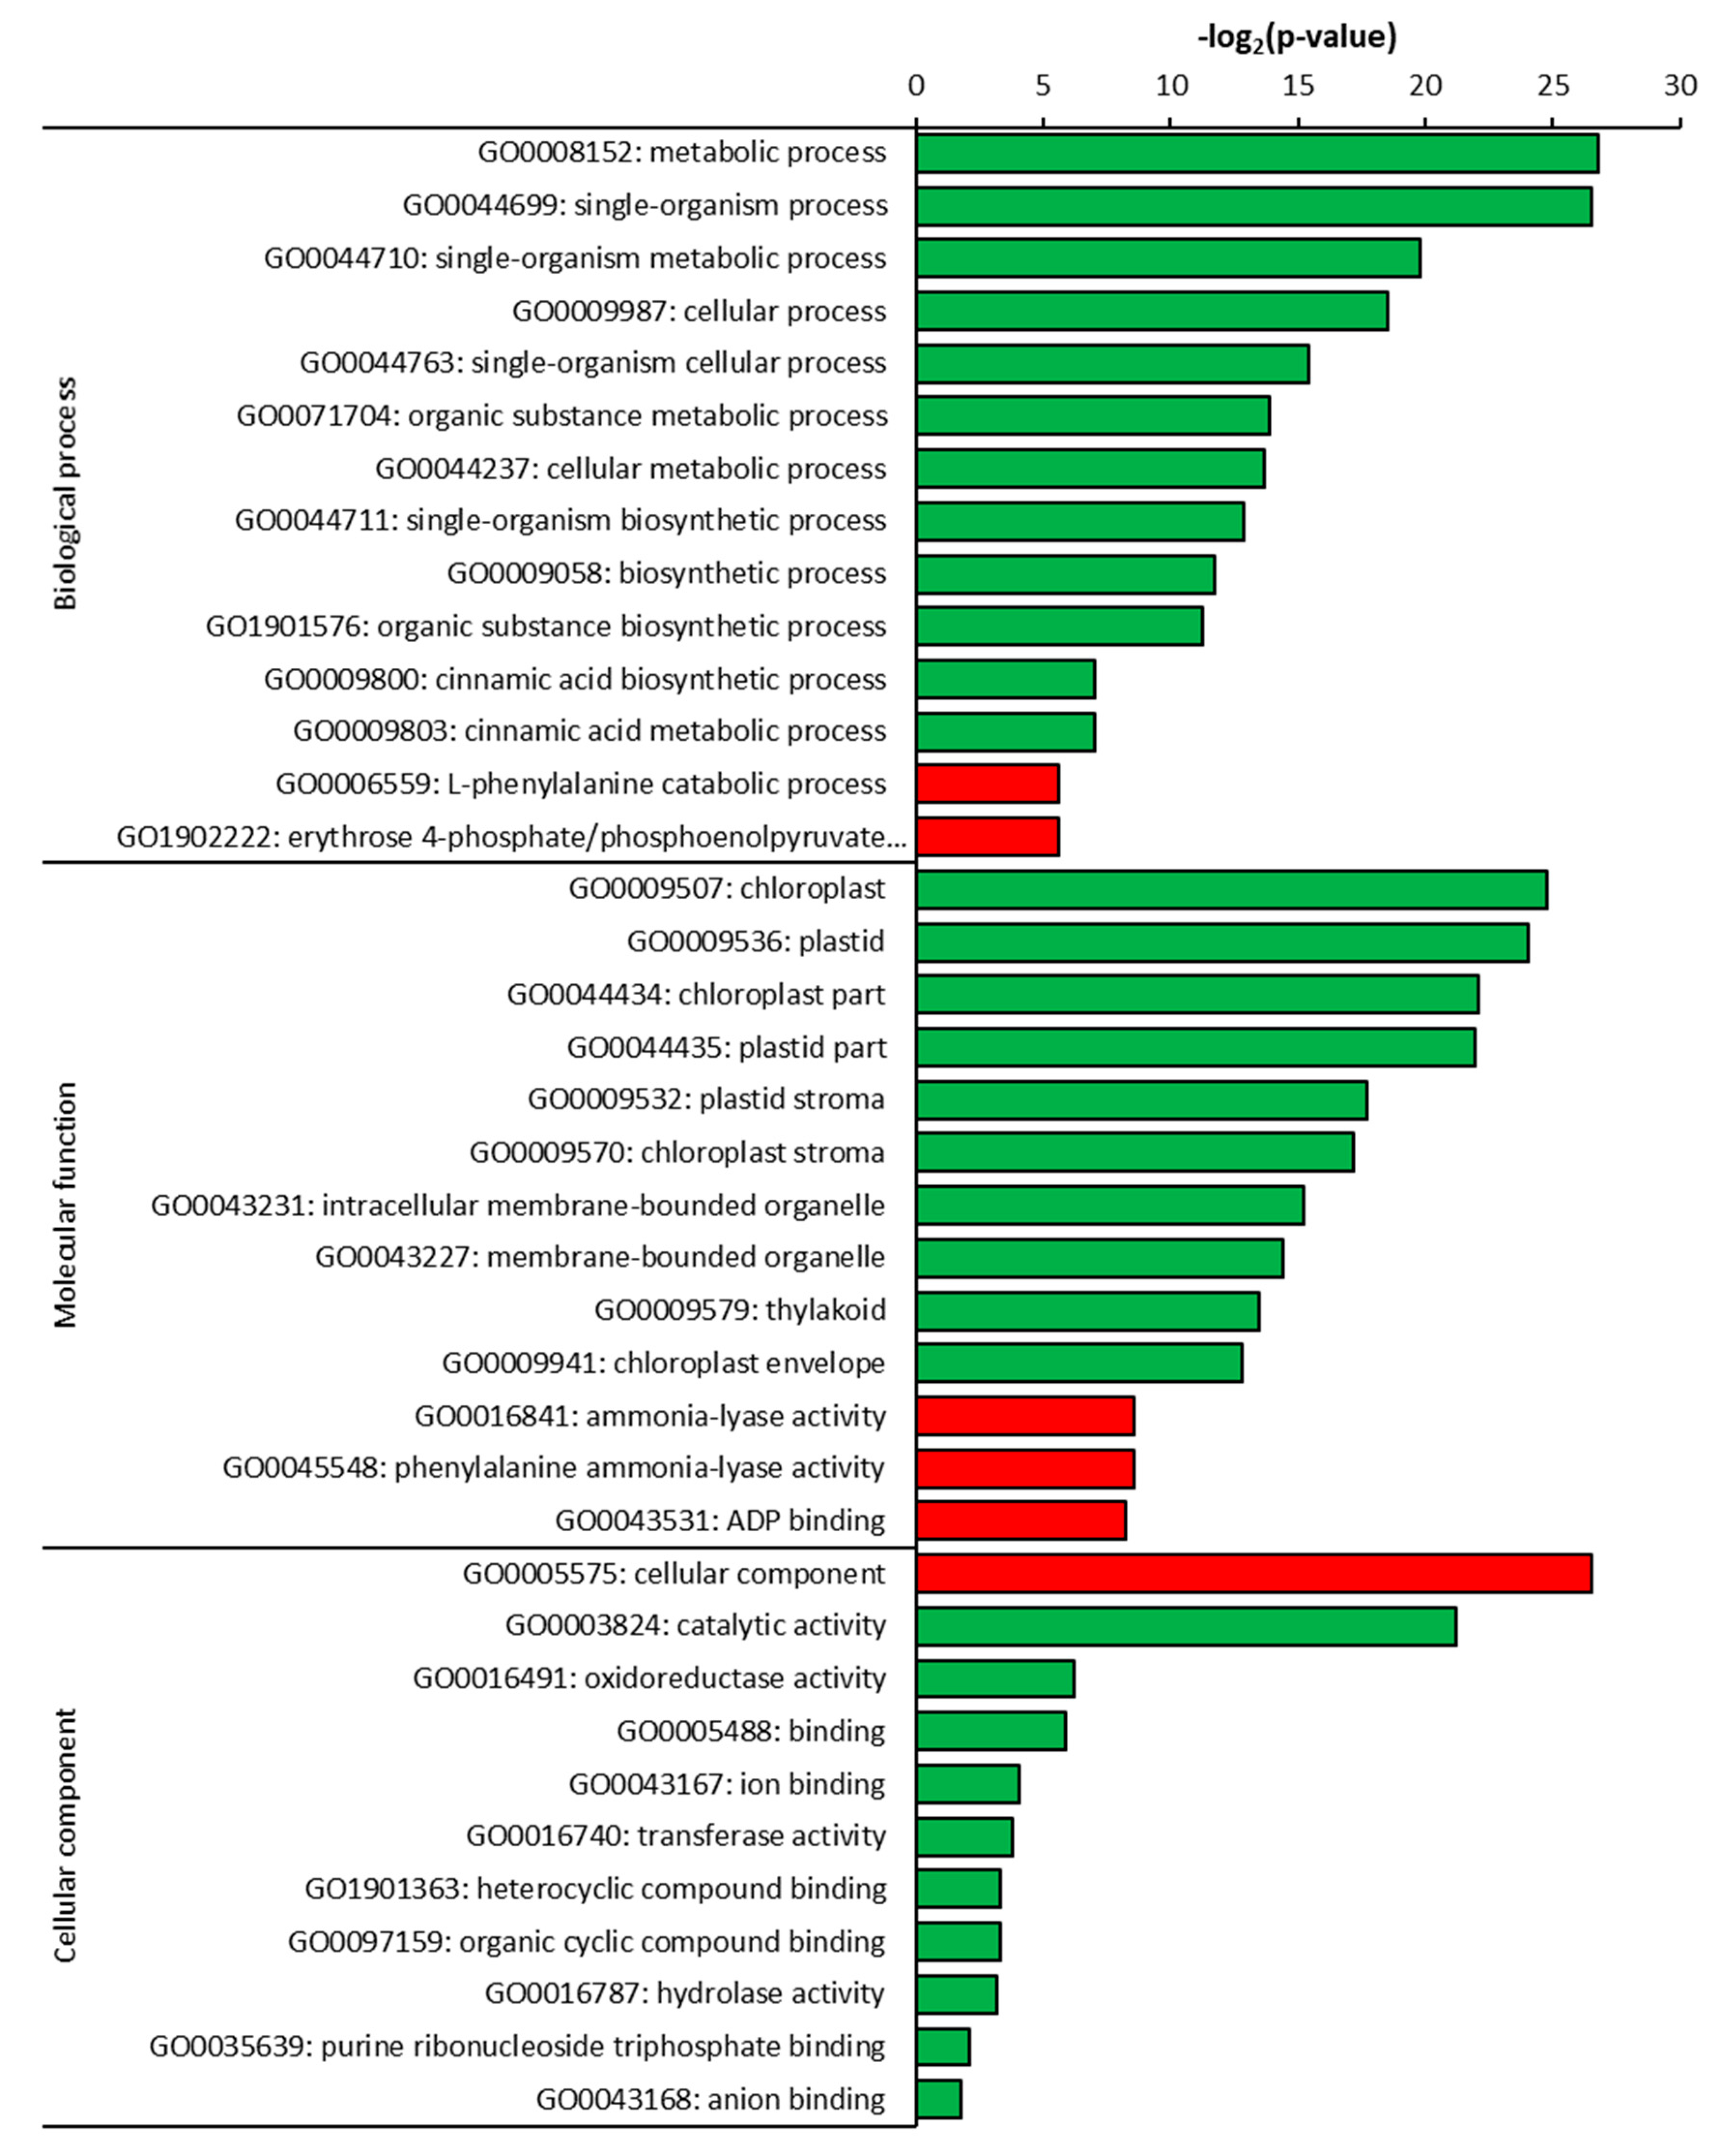
2.3. Gene Ontology (GO) Analysis of DEGs
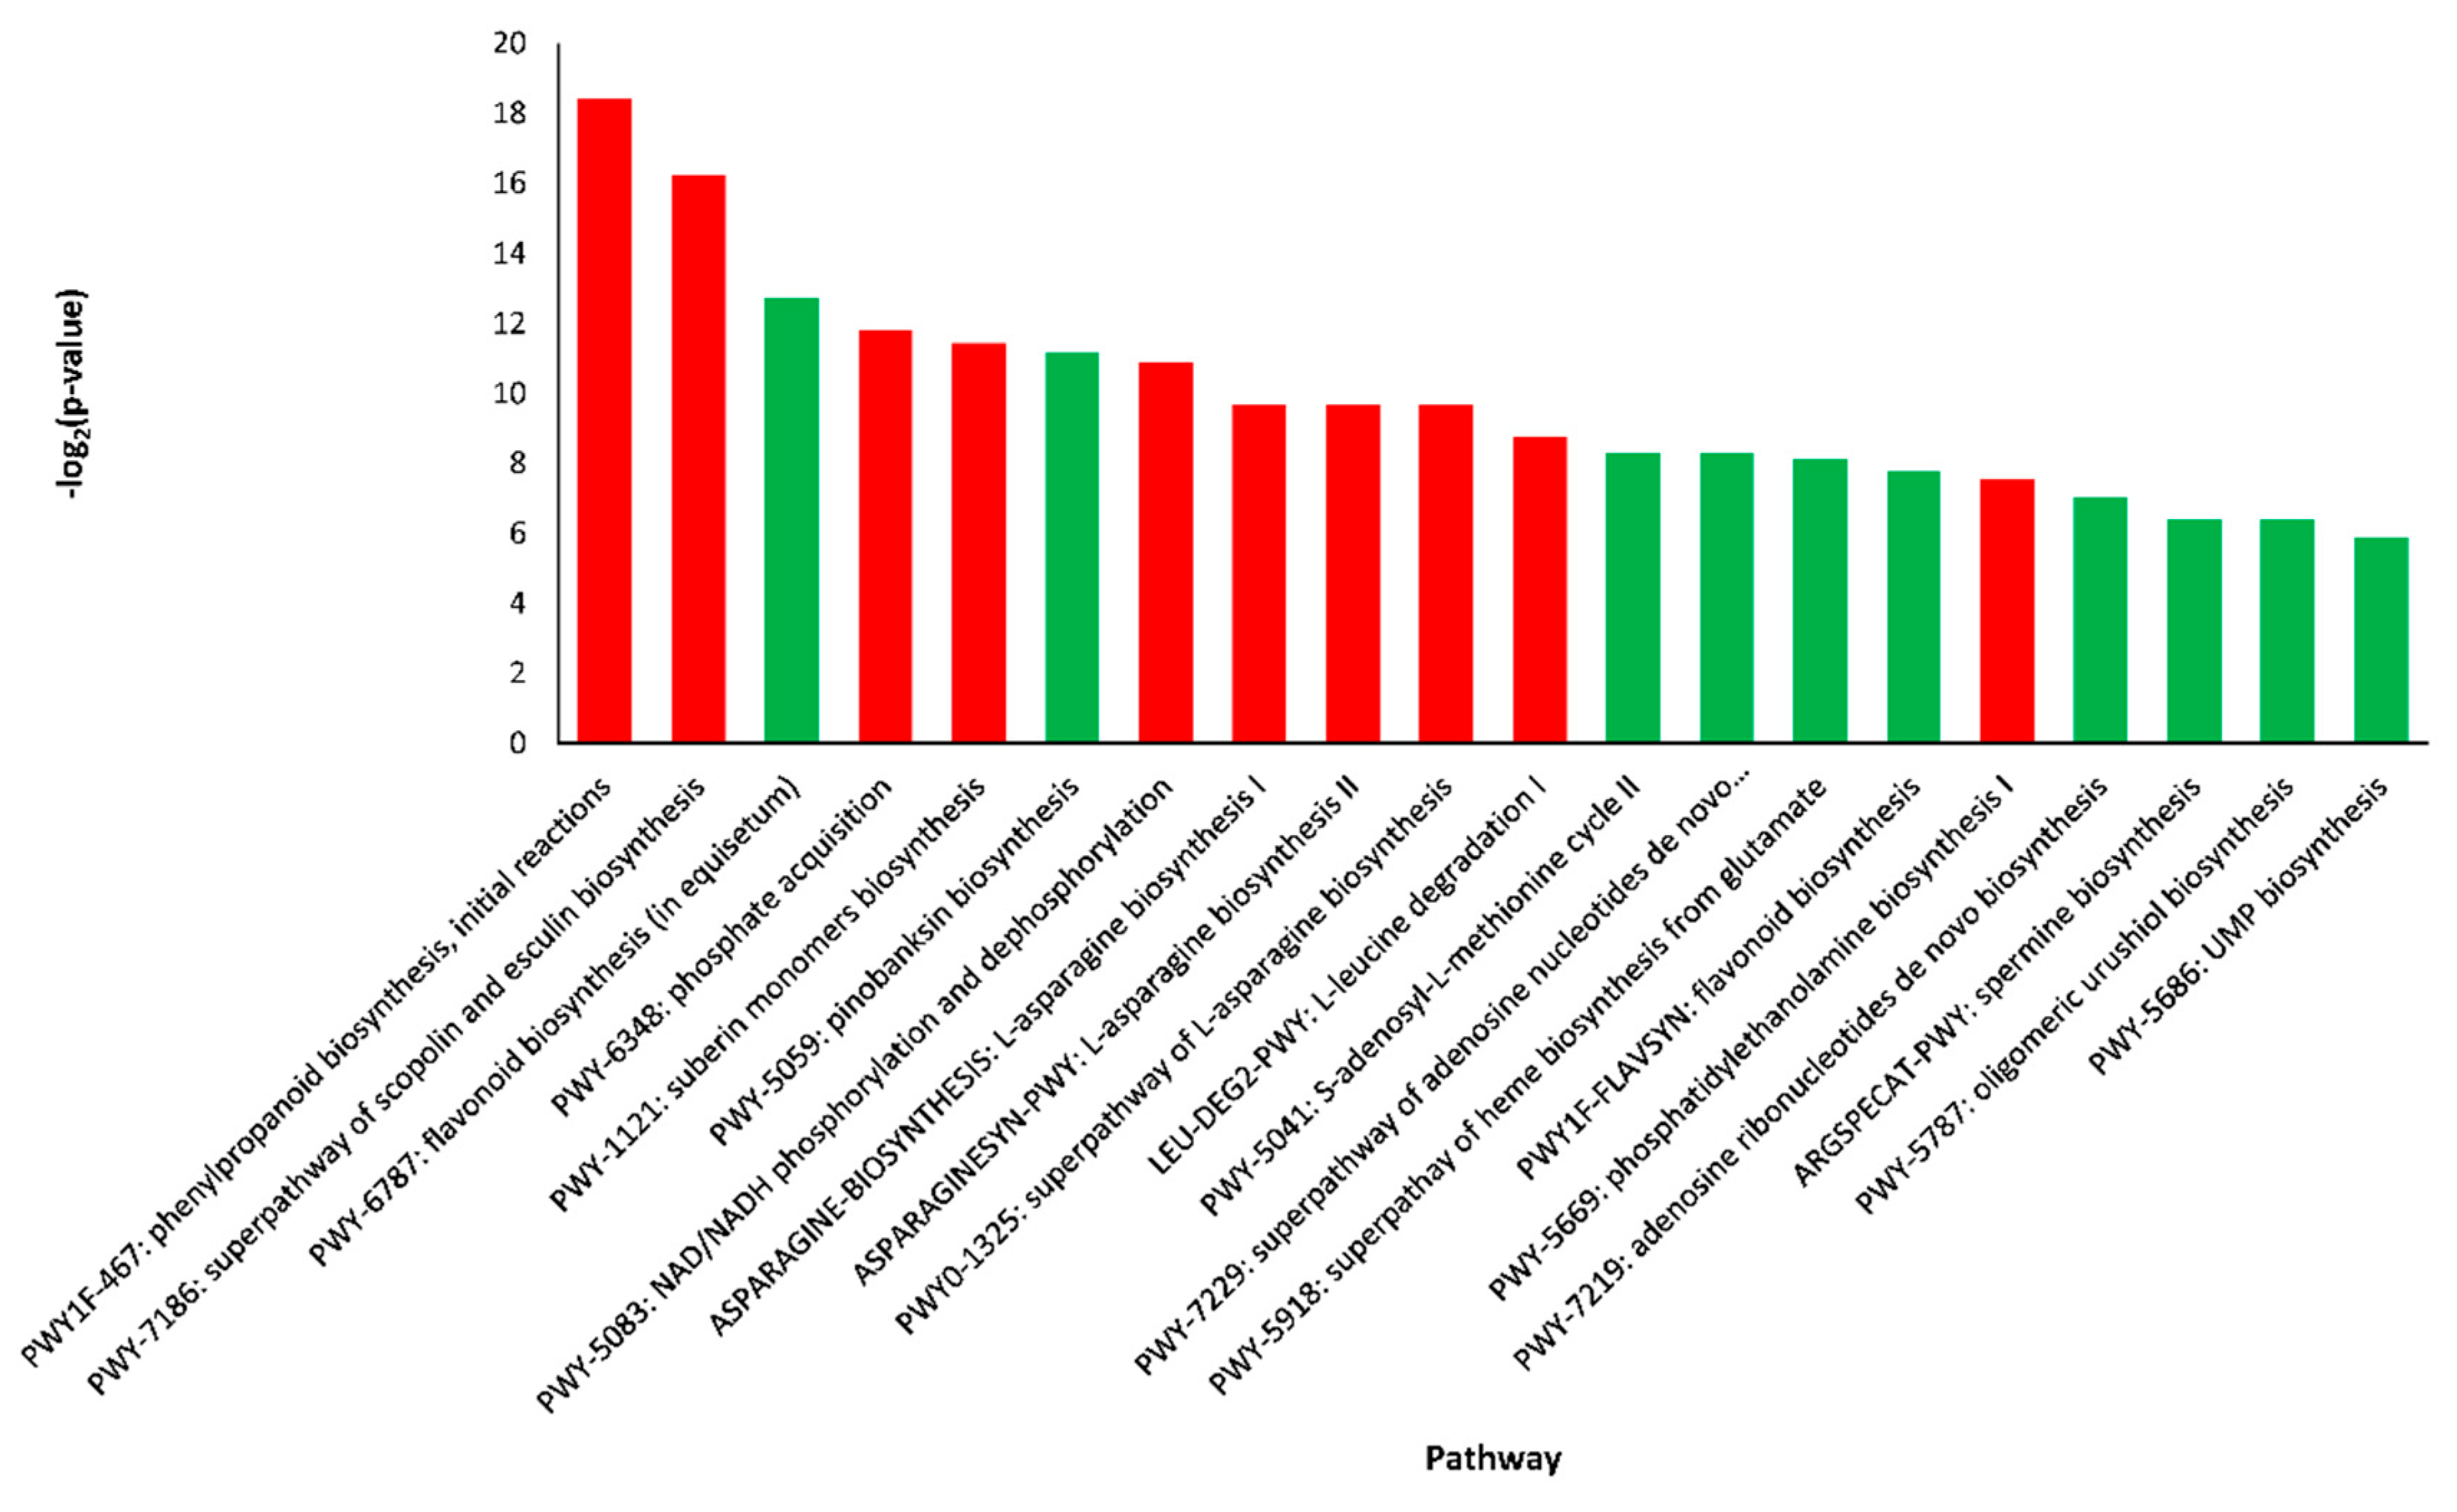
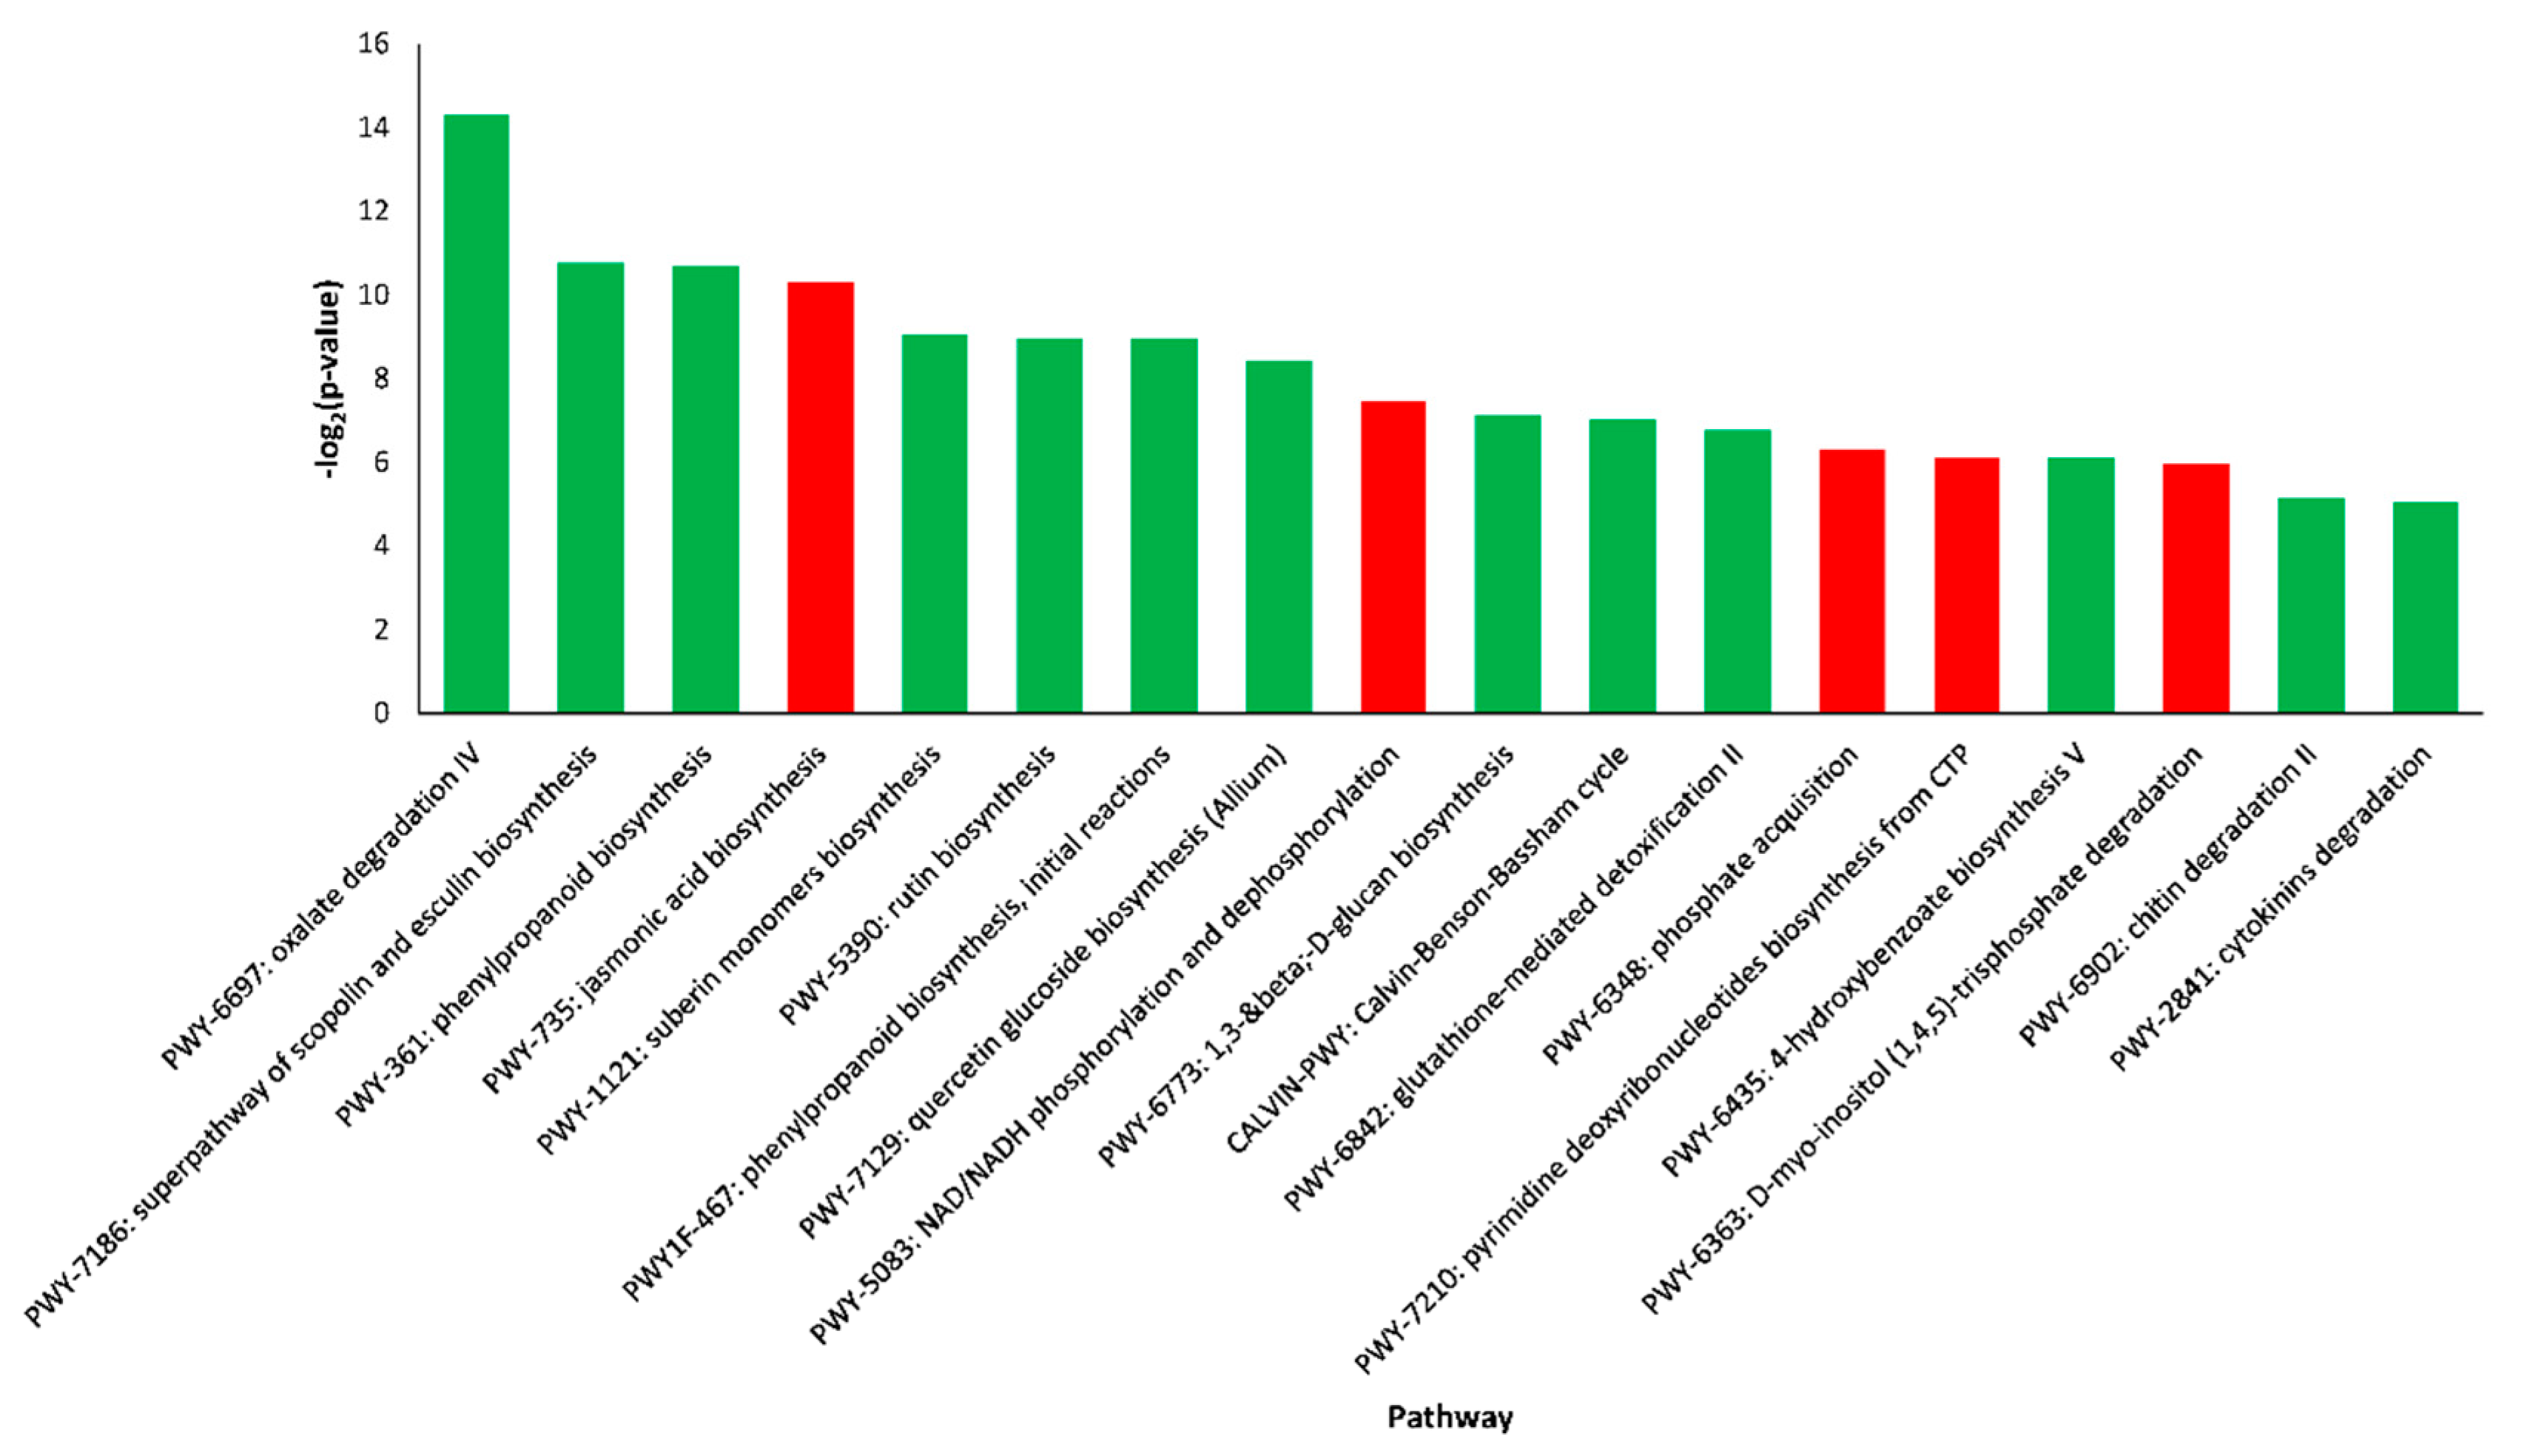
2.4. Pathway Enrichment Analysis of DEGs
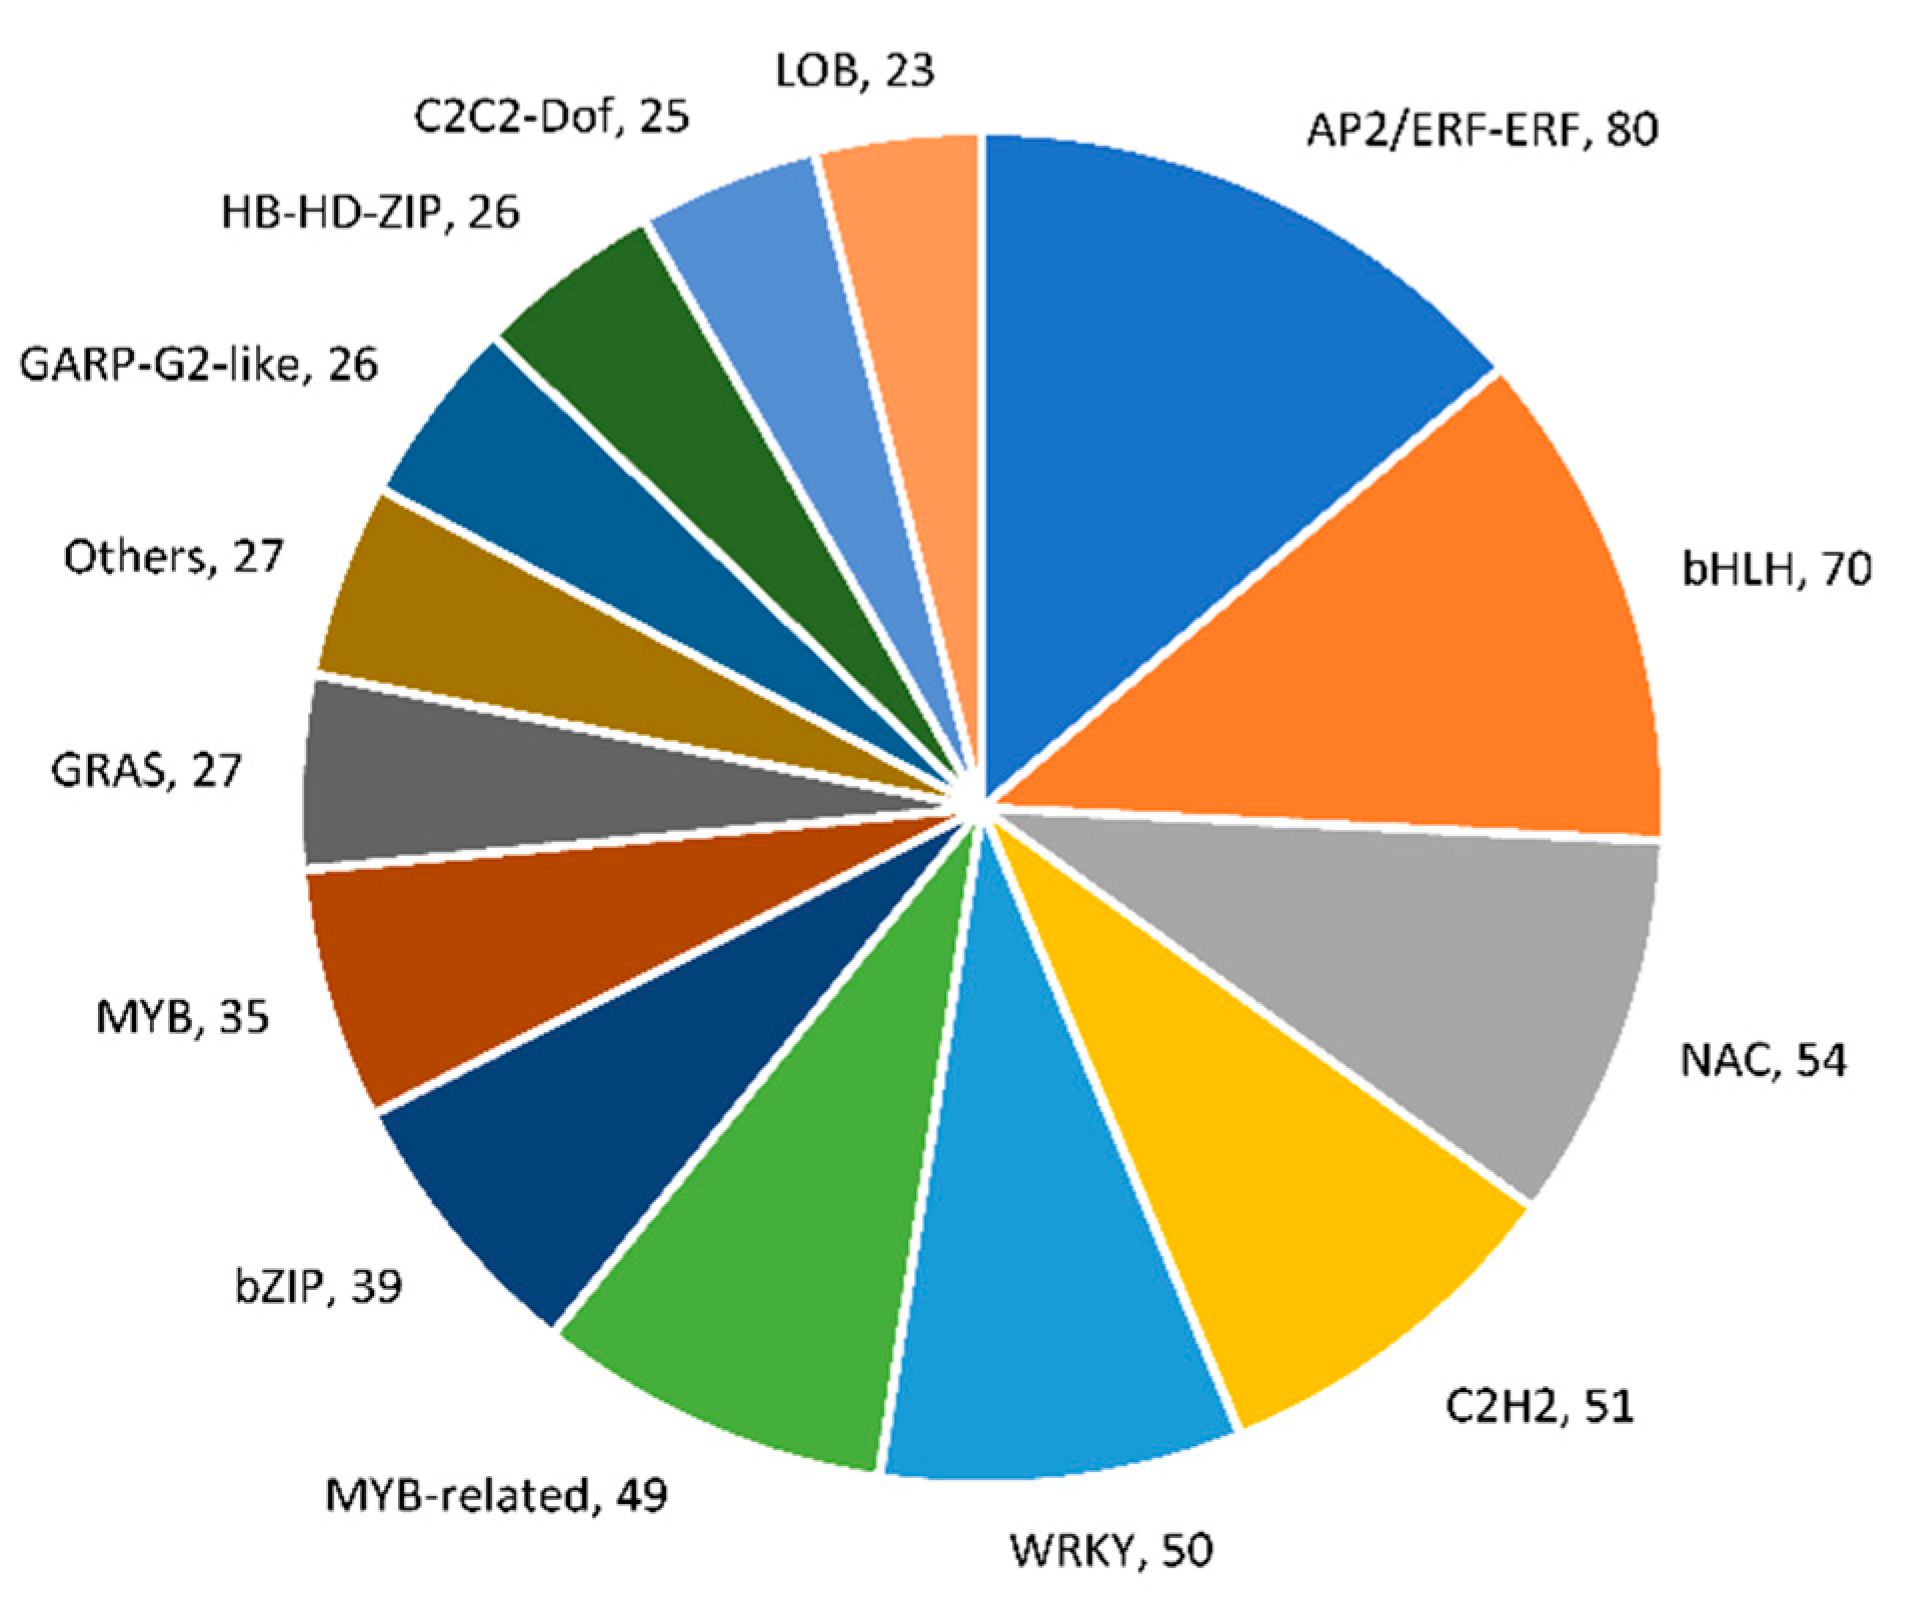
2.5. Identification of Differentially Expressed Transcription Factors (TFs) and Transcriptional Regulators (TRs)
3. Discussion
4. Materials and Methods
4.1. Data Resources
4.2. Data Analysis
4.2.1. Quality Check
4.2.2. Differential Expression Analysis
4.2.3. Gene Ontology and Pathway Enrichment Analysis
4.2.4. Gene Ontology and Pathway Enrichment Analysis
5. Conclusions
Supplementary Materials
Author Contributions
Funding
Acknowledgments
Conflicts of Interest
References
- FAOSTAT. FAOSTAT Statistics Database; FAO: Rome, Italy, 2016. [Google Scholar]
- Renner, S.S.; Schaefer, H.; Kocyan, A. Phylogenetics of Cucumis (Cucurbitaceae): Cucumber (C. sativus) belongs in an Asian/Australian clade far from melon (C. melo). BMC Evol. Biol. 2007, 7, 58. [Google Scholar] [CrossRef] [PubMed]
- Huang, S.; Li, R.; Zhang, Z.; Li, L.; Gu, X.; Fan, W.; Lucas, W.J.; Wang, X.; Xie, B.; Ni, P.; et al. The genome of the cucumber, Cucumis sativus L. Nat. Genet. 2009, 41, 1275–1281. [Google Scholar] [CrossRef] [PubMed]
- Izawa, T.; Konishi, S.; Shomura, A.; Yano, M. DNA changes tell us about rice domestication. Curr. Opin. Plant Biol. 2009, 12, 185–192. [Google Scholar] [CrossRef]
- Paran, I.; van der Knaap, E. Genetic and molecular regulation of fruit and plant domestication traits in tomato and pepper. J. Exp. Bot. 2007, 58, 3841–3852. [Google Scholar] [CrossRef]
- Doebley, J.F.; Gaut, B.S.; Smith, B.D. The molecular genetics of crop domestication. Cell 2006, 127, 1309–1321. [Google Scholar] [CrossRef]
- Peláez, P.; Orona-Tamayo, D.; Montes-Hernández, S.; Valverde, M.E.; Paredes-López, O.; Cibrián-Jaramillo, A. Comparative transcriptome analysis of cultivated and wild seeds of Salvia hispanica (chia). Sci. Rep. 2019, 9, 9761. [Google Scholar] [CrossRef]
- Wei, Q.; Du, L.; Wang, W.; Hu, T.; Hu, H.; Wang, J.; David, K.; Bao, C. Comparative Transcriptome Analysis in Eggplant Reveals Selection Trends during Eggplant Domestication. Int. J. Genom. 2019, 2019, 12. [Google Scholar] [CrossRef]
- Guo, S.; Sun, H.; Zhang, H.; Liu, J.; Ren, Y.; Gong, G.; Jiao, C.; Zheng, Y.; Yang, W.; Fei, Z.; et al. Comparative Transcriptome Analysis of Cultivated and Wild Watermelon during Fruit Development. PLoS ONE 2015, 10, e0130267. [Google Scholar] [CrossRef]
- Dai, Q.; Geng, L.; Lu, M.; Jin, W.; Nan, X.; He, P.-A.; Yao, Y. Comparative transcriptome analysis of the different tissues between the cultivated and wild tomato. PLoS ONE 2017, 12, e0172411. [Google Scholar] [CrossRef]
- Wan, H.; Chen, J. Enhanced expression of a thaumatin-like gene, involved in ‘Pseudoperonospora cubensis’ and abiotic stresses, induced by DNA introgression from a wild relative, ‘Cucumis hystrix’. Plant Omics 2013, 6, 135. [Google Scholar]
- Shang, Y.; Ma, Y.; Zhou, Y.; Zhang, H.; Duan, L.; Chen, H.; Zeng, J.; Zhou, Q.; Wang, S.; Gu, W.; et al. Biosynthesis, regulation, and domestication of bitterness in cucumber. Science 2014, 346, 1084. [Google Scholar] [CrossRef] [PubMed]
- Chen, J.C.; Chiu, M.H.; Nie, R.L.; Cordell, G.A.; Qiu, S.X. Cucurbitacins and cucurbitane glycosides: Structures and biological activities. Nat. Prod. Rep. 2005, 22, 386–399. [Google Scholar] [CrossRef] [PubMed]
- Chen, X.; Bao, J.; Guo, J.; Ding, Q.; Lu, J.; Huang, M.; Wang, Y. Biological activities and potential molecular targets of cucurbitacins: A focus on cancer. Anticancer Drugs 2012, 23, 777–787. [Google Scholar] [CrossRef] [PubMed]
- Wóycicki, R.; Witkowicz, J.; Gawroński, P.; Dąbrowska, J.; Lomsadze, A.; Pawełkowicz, M.; Siedlecka, E.; Yagi, K.; Pląder, W.; Seroczyńska, A.; et al. The Genome Sequence of the North-European Cucumber (Cucumis sativus L.) Unravels Evolutionary Adaptation Mechanisms in Plants. PLoS ONE 2011, 6, e22728. [Google Scholar] [CrossRef]
- Sebastian, P.; Schaefer, H.; Telford, I.R.H.; Renner, S.S. Cucumber (Cucumis sativus) and melon (C. melo) have numerous wild relatives in Asia and Australia, and the sister species of melon is from Australia. Proc. Natl. Acad. Sci. USA 2010, 107, 14269. [Google Scholar] [CrossRef]
- Ghebretinsae, A.G.; Thulin, M.; Barber, J.C. Relationships of cucumbers and melons unraveled: Molecular phylogenetics of Cucumis and related genera (Benincaseae, Cucurbitaceae). Am. J. Bot. 2007, 94, 1256–1266. [Google Scholar] [CrossRef]
- Chung, S.M.; Staub, J.E.; Chen, J.F. Molecular phylogeny of Cucumis species as revealed by consensus chloroplast SSR marker length and sequence variation. Genome 2006, 49, 219–229. [Google Scholar] [CrossRef]
- Xiao, W.; Wang, X.; Bie, M. Genetic and phylogenetic relationships analysis of the complete chloroplast genome Cucumis sativus to China. Mitochondrial DNA Part B 2019, 4, 3900–3901. [Google Scholar] [CrossRef]
- Yang, S.; Qin, X.; Cheng, C.; Li, Z.; Lou, Q.; Li, J.; Chen, J. Organization and evolution of four differentially amplified tandem repeats in the Cucumis hystrix genome. Planta 2017, 246, 749–761. [Google Scholar] [CrossRef]
- Wang, Y.; Zhang, Z.; Jia, L.; Li, Z.; Li, J.; Lou, Q.; Chen, J. Molecular and cytogenetic analyses provide evidence of the introgression of chromosomal segments from the wild Cucumis hystrix into the cultivated cucumber through the bridge of a synthetic allotetraploid. Mol. Breed. 2017, 37, 89. [Google Scholar] [CrossRef]
- Machaj, G.; Bostan, H.; Macko-Podgórni, A.; Iorizzo, M.; Grzebelus, D. Comparative Transcriptomics of Root Development in Wild and Cultivated Carrots. Genes 2018, 9, 431. [Google Scholar] [CrossRef] [PubMed]
- Tian, L.; Chang, C.; Ma, L.; Nasir, F.; Zhang, J.; Li, W.; Tran, L.-S.P.; Tian, C. Comparative study of the mycorrhizal root transcriptomes of wild and cultivated rice in response to the pathogen Magnaporthe oryzae. Rice 2019, 12, 35. [Google Scholar] [CrossRef] [PubMed]
- Li, J.; Li, Y.; Tian, Y.; Qu, M.; Zhang, W.; Gao, L. Melatonin Has the Potential to Alleviate Cinnamic Acid Stress in Cucumber Seedlings. Front. Plant Sci. 2017, 8. [Google Scholar] [CrossRef]
- Jiang, L.; Yan, S.; Yang, W.; Li, Y.; Xia, M.; Chen, Z.; Wang, Q.; Yan, L.; Song, X.; Liu, R.; et al. Transcriptomic analysis reveals the roles of microtubule-related genes and transcription factors in fruit length regulation in cucumber (Cucumis sativus L.). Sci. Rep. 2015, 5, 8031. [Google Scholar] [CrossRef]
- Zhang, H.; Zhang, L.; Ma, Y.; Shang, T.; Wang, S.; Yang, Q.; Huang, S. Studies of an ap2/erf transcriptional factor regulating bi gene of Cucumis sativus. Acta Hortic. Sin. 2014, 41, 672–680. [Google Scholar]
- Liu, X.; Wang, T.; Bartholomew, E.; Black, K.; Dong, M.; Zhang, Y.; Yang, S.; Cai, Y.; Xue, S.; Weng, Y.; et al. Comprehensive analysis of NAC transcription factors and their expression during fruit spine development in cucumber (Cucumis sativus L.). Hortic. Res. 2018, 5, 31. [Google Scholar] [CrossRef]
- Shiriga, K.; Sharma, R.; Kumar, K.; Yadav, S.K.; Hossain, F.; Thirunavukkarasu, N. Genome-wide identification and expression pattern of drought-responsive members of the NAC family in maize. Meta Gene 2014, 2, 407–417. [Google Scholar] [CrossRef]
- Souer, E.; van Houwelingen, A.; Kloos, D.; Mol, J.; Koes, R. The No Apical Meristem Gene of Petunia Is Required for Pattern Formation in Embryos and Flowers and Is Expressed at Meristem and Primordia Boundaries. Cell 1996, 85, 159–170. [Google Scholar] [CrossRef]
- Larsson, E.; Sundstrom, J.F.; Sitbon, F.; von Arnold, S. Expression of PaNAC01, a Picea abies CUP-SHAPED COTYLEDON orthologue, is regulated by polar auxin transport and associated with differentiation of the shoot apical meristem and formation of separated cotyledons. Ann. Bot. 2012, 110, 923–934. [Google Scholar] [CrossRef]
- Lan, Y.; Su, N.; Shen, Y.; Zhang, R.; Wu, F.; Cheng, Z.; Wang, J.; Zhang, X.; Guo, X.; Lei, C.; et al. Identification of novel MiRNAs and MiRNA expression profiling during grain development in indica rice. BMC Genom. 2012, 13, 264. [Google Scholar] [CrossRef]
- Mitsuda, N.; Iwase, A.; Yamamoto, H.; Yoshida, M.; Seki, M.; Shinozaki, K.; Ohme-Takagi, M. NAC transcription factors, NST1 and NST3, are key regulators of the formation of secondary walls in woody tissues of Arabidopsis. Plant Cell 2007, 19, 270–280. [Google Scholar] [CrossRef] [PubMed]
- Mitsuda, N.; Seki, M.; Shinozaki, K.; Ohme-Takagi, M. The NAC transcription factors NST1 and NST2 of Arabidopsis regulate secondary wall thickenings and are required for anther dehiscence. Plant Cell 2005, 17, 2993–3006. [Google Scholar] [CrossRef] [PubMed]
- Jiang, J.; Ma, S.; Ye, N.; Jiang, M.; Cao, J.; Zhang, J. WRKY transcription factors in plant responses to stresses. J. Integr. Plant Biol. 2017, 59, 86–101. [Google Scholar] [CrossRef]
- Ling, J.; Jiang, W.; Zhang, Y.; Yu, H.; Mao, Z.; Gu, X.; Huang, S.; Xie, B. Genome-wide analysis of WRKY gene family in Cucumis sativus. BMC Genom. 2011, 12, 471. [Google Scholar] [CrossRef]
- National Center for Biotechnology Information (NCBI) Sequence Read Archive (SRA) Database. Available online: https://www.ncbi.nlm.nih.gov/sra (accessed on 20 June 2019).
- Joshi, N.A.; Fass, J.N. Sickle: A Sliding-Window, Adaptive, Quality-Based Trimming Tool for FastQ Files (Version 1.33) [Software]. 2011. Available online: https://github.com/najoshi/sickle (accessed on 10 May 2019).
- Bolger, A.M.; Lohse, M.; Usadel, B. Trimmomatic: A flexible trimmer for Illumina sequence data. Bioinformatics 2014, 30, 2114–2120. [Google Scholar] [CrossRef]
- Andrews, S. FastQC: A Quality Control Tool for High Throughput Sequence Data; Babraham Institute: Cambridge, UK, 2010; Available online: http://www.bioinformatics.babraham.ac.uk/projects/fastqc (accessed on 10 May 2019).
- Kim, D.; Langmead, B.; Salzberg, S.L. HISAT: A fast spliced aligner with low memory requirements. Nat. Methods 2015, 12, 357. [Google Scholar] [CrossRef]
- Rumble, S.M.; Lacroute, P.; Dalca, A.V.; Fiume, M.; Sidow, A.; Brudno, M. SHRiMP: Accurate Mapping of Short Color-space Reads. PLoS Comput. Biol. 2009, 5, e1000386. [Google Scholar] [CrossRef]
- Cucurbit Genomics Database (CuGenDB). Available online: http://cucurbitgenomics.org (accessed on 20 June 2019).
- Wu, T.D.; Nacu, S. Fast and SNP-tolerant detection of complex variants and splicing in short reads. Bioinformatics 2010, 26, 873–881. [Google Scholar] [CrossRef]
- Liao, Y.; Smyth, G.K.; Shi, W. featureCounts: An efficient general purpose program for assigning sequence reads to genomic features. Bioinformatics 2014, 30, 923–930. [Google Scholar] [CrossRef]
- Liao, Y.; Smyth, G.K.; Shi, W. The R package Rsubread is easier, faster, cheaper and better for alignment and quantification of RNA sequencing reads. Nucleic Acids Res. 2019, 47, e47. [Google Scholar] [CrossRef]
- Love, M.I.; Huber, W.; Anders, S. Moderated estimation of fold change and dispersion for RNA-seq data with DESeq2. Genome Biol. 2014, 15, 550. [Google Scholar] [CrossRef] [PubMed]
- Parekh, S.; Vieth, B.; Ziegenhain, C.; Enard, W.; Hellmann, I. Strategies for quantitative RNA-seq analyses among closely related species. bioRxiv 2018, 297408. [Google Scholar] [CrossRef]
- Benjamini, Y.; Yekutieli, D. The Control of the False Discovery Rate in Multiple Testing under Dependency. Ann. Stat. 2001, 29, 1165–1188. [Google Scholar]
- Gene Ontology, C. The Gene Ontology project in 2008. Nucleic Acids Res. 2008, 36, D440–D444. [Google Scholar] [CrossRef]
- Zheng, Y.; Wu, S.; Bai, Y.; Sun, H.; Jiao, C.; Guo, S.; Zhao, K.; Blanca, J.; Zhang, Z.; Huang, S.; et al. Cucurbit Genomics Database (CuGenDB): A central portal for comparative and functional genomics of cucurbit crops. Nucleic Acids Res. 2019, 47, D1128–D1136. [Google Scholar] [CrossRef]
- Cucumber (Chinese Long) v2 Database. Available online: http://cucurbitgenomics.org/organism/2 (accessed on 20 June 2019).


| Accession No. | Organism | Tissue | Total Reads | Mapped Reads | Multiple Alignments | ||
|---|---|---|---|---|---|---|---|
| No. | % | No. | % | ||||
| SRR6375807 | C. hystrix | Leaves | 11,450,746 | 8,062,837 | 70.41 | 385,210 | 3.36 |
| SRR6375808 | 11,604,057 | 8,322,444 | 71.72 | 239,315 | 2.06 | ||
| SRR6375809 | 16,732,213 | 12,047,006 | 72.00 | 225,548 | 1.35 | ||
| SRR6375813 | Roots | 13,364,553 | 10,194,458 | 76.28 | 270,044 | 2.02 | |
| SRR6375814 | 12,118,277 | 9,042,523 | 74.62 | 263,423 | 2.17 | ||
| SRR6375815 | 12,513,487 | 9,523,603 | 76.11 | 249,899 | 2.00 | ||
| SRR6854681 | C. sativus | Leaves | 22,850,332 | 22,251,604 | 97.38 | 344,846 | 1.36 |
| SRR6854682 | 22,850,332 | 22,240,800 | 97.29 | 308,372 | 1.35 | ||
| SRR6854683 | 22,546,871 | 21,980,994 | 97.49 | 300,801 | 1.33 | ||
| SRR6854684 | 22,546,871 | 21,959,502 | 97.39 | 300,440 | 1.33 | ||
| SRR6854686 | 25,252,002 | 24,432,576 | 96.76 | 385,458 | 1.53 | ||
| SRR6324159 | Roots | 22,835,231 | 21,046,995 | 92.17 | 479,919 | 2.10 | |
| SRR6324165 | 21,912,885 | 20,137,986 | 91.90 | 475,748 | 2.17 | ||
| SRR6324169 | 23,642,017 | 21,363,366 | 90.36 | 549,798 | 2.33 | ||
| SRR6324170 | 23,343,403 | 21,465,924 | 91.96 | 577,655 | 2.47 | ||
| SRR6324171 | 23,163,605 | 21,631,754 | 93.39 | 475,735 | 2.05 | ||
© 2020 by the authors. Licensee MDPI, Basel, Switzerland. This article is an open access article distributed under the terms and conditions of the Creative Commons Attribution (CC BY) license (http://creativecommons.org/licenses/by/4.0/).
Share and Cite
Abdel-Salam, E.M.; Faisal, M.; Alatar, A.A.; Saquib, Q.; Alwathnani, H.A. Comparative Analysis between Wild and Cultivated Cucumbers Reveals Transcriptional Changes during Domestication Process. Plants 2020, 9, 63. https://doi.org/10.3390/plants9010063
Abdel-Salam EM, Faisal M, Alatar AA, Saquib Q, Alwathnani HA. Comparative Analysis between Wild and Cultivated Cucumbers Reveals Transcriptional Changes during Domestication Process. Plants. 2020; 9(1):63. https://doi.org/10.3390/plants9010063
Chicago/Turabian StyleAbdel-Salam, Eslam M., Mohammad Faisal, Abdulrahman A. Alatar, Quaiser Saquib, and Hend A. Alwathnani. 2020. "Comparative Analysis between Wild and Cultivated Cucumbers Reveals Transcriptional Changes during Domestication Process" Plants 9, no. 1: 63. https://doi.org/10.3390/plants9010063
APA StyleAbdel-Salam, E. M., Faisal, M., Alatar, A. A., Saquib, Q., & Alwathnani, H. A. (2020). Comparative Analysis between Wild and Cultivated Cucumbers Reveals Transcriptional Changes during Domestication Process. Plants, 9(1), 63. https://doi.org/10.3390/plants9010063